user guide turningpoint 5
TRANSCRIPT
TurningPoint User Guide 1
TurningPoint for PCUser Guide
Version 5.2
TurningPoint User Guide 2
© 2013 Turning Technologies, LLC. Portions Responsive Innovations, LLC, Microsoft Corporation
No part of this document may be reproduced or transmitted in any form or by any means, electronic or mechanical, for any purpose, without the express written permission of Turning Technologies, LLC. All rights reserved.
Turning Technologies, LLC, 255 West Federal Street, Youngstown, OH 44503 USA.
TurningPoint® is a registered trademark of Turning Technologies, LLC. Other trademarked product names mentioned in this manual are owned by their respective companies.
The following regulatory statements apply to radio frequency and infrared transmitters and receivers mentioned in this manual, including the ResponseCard RF, ResponseCard RF LCD, ResponseCard IR, ResponseCard XR, ResponseCard NXT and their respective receivers.
FCC Statement
This device complies with part 15 of the FCC Rules. Operation is subject to the following two conditions: (1) This device may not cause harmful interference, and (2) this device must accept any interference received, including interference that may cause undesired operation.
Changes or modifications not expressly approved by the party responsible for compliance could void the user’s authority to operate the equipment.
IC Statement
This device complies with Industry Canada licence-exempt RSS standard(s). Operation is subject to the following two conditions: (1) this device may not cause interference, and (2) this device must accept any interference, including interference that may cause undesired operation of the device.
Le présent appareil est conforme aux CNR d'Industrie Canada applicables aux appareils radio exempts de licence. L'exploitation est autorisée aux deux conditions suivantes : (1) l'appareil ne doit pas produire de brouillage, et (2) l'utilisateur de l'appareil doit accepter tout brouillage radioélectrique subi, même si le brouillage est susceptible d'en compromettre le fonctionnement.
TurningPoint User Guide 3
1 Welcome to TurningPoint!. . . . . . . . . . . . . . . . . 9What’s New in TurningPoint 5. . . . . . . . . . . . . . . . . . . . . . . . . .10Technical Requirements . . . . . . . . . . . . . . . . . . . . . . . . . . . . . .11
Requirements for Software and Hardware . . . . . . . . . . . . . .11Compatible Devices . . . . . . . . . . . . . . . . . . . . . . . . . . . . . . .11
Getting Started . . . . . . . . . . . . . . . . . . . . . . . . . . . . . . . . . . . . .12Download and Setup. . . . . . . . . . . . . . . . . . . . . . . . . . . . . . .12
Downloading TurningPoint . . . . . . . . . . . . . . . . . . . . . . . .12Opening TurningPoint (Zipped File) . . . . . . . . . . . . . . . . .13Installing TurningPoint (EXE File). . . . . . . . . . . . . . . . . . .13
Configuring Automatic Updates . . . . . . . . . . . . . . . . . . . . . .14Device Setup. . . . . . . . . . . . . . . . . . . . . . . . . . . . . . . . . . . . .15
Changing the Channel on the Receiver . . . . . . . . . . . . . .15Locking the Receiver Channel . . . . . . . . . . . . . . . . . . . . .16Setting Up ResponseWare . . . . . . . . . . . . . . . . . . . . . . . .17Testing the Polling Connections . . . . . . . . . . . . . . . . . . . .20Pairing a PresenterCard . . . . . . . . . . . . . . . . . . . . . . . . . .22Migrating Previous Turning Technologies Files . . . . . . . .23
Importing Participant Lists. . . . . . . . . . . . . . . . . . . . . . . . . . .24Importing Session Files. . . . . . . . . . . . . . . . . . . . . . . . . . . . .24Importing Question Lists or Answer Keys . . . . . . . . . . . . . . .25Converting TurningPoint 2008 Presentations . . . . . . . . . . . .25
2 Content . . . . . . . . . . . . . . . . . . . . . . . . . . . . . . . 27Managing Content. . . . . . . . . . . . . . . . . . . . . . . . . . . . . . . . . . .28
Organizing Content Into Folders . . . . . . . . . . . . . . . . . . . . . .28Exporting Content . . . . . . . . . . . . . . . . . . . . . . . . . . . . . . . . .29Importing Content . . . . . . . . . . . . . . . . . . . . . . . . . . . . . . . . .30Deleting Content . . . . . . . . . . . . . . . . . . . . . . . . . . . . . . . . . .31Refreshing Folder Content . . . . . . . . . . . . . . . . . . . . . . . . . .31
Question Lists . . . . . . . . . . . . . . . . . . . . . . . . . . . . . . . . . . . . . .32Creating a New Question List . . . . . . . . . . . . . . . . . . . . . . . .32Question Types and Options . . . . . . . . . . . . . . . . . . . . . . . .34
Multiple Choice . . . . . . . . . . . . . . . . . . . . . . . . . . . . . . . . .35Short Answer . . . . . . . . . . . . . . . . . . . . . . . . . . . . . . . . . .36Numeric Response . . . . . . . . . . . . . . . . . . . . . . . . . . . . . .38True/False . . . . . . . . . . . . . . . . . . . . . . . . . . . . . . . . . . . .40Matching . . . . . . . . . . . . . . . . . . . . . . . . . . . . . . . . . . . . .41Essay . . . . . . . . . . . . . . . . . . . . . . . . . . . . . . . . . . . . . . . .43Demographic Assignment . . . . . . . . . . . . . . . . . . . . . . . .44Priority Ranking . . . . . . . . . . . . . . . . . . . . . . . . . . . . . . . .45
Editing Question List Content . . . . . . . . . . . . . . . . . . . . . . . .46Updating Question Preferences within the Question List Editor. . . . . . . . . . . . . . . . . . . . . . . . . . . . . . . .50Importing Questions Into a Question List . . . . . . . . . . . . . . .51
TurningPoint User Guide 4
Applying New Question List Preferences to Existing Questions . . . . . . . . . . . . . . . . . . . . . . . . . . . . . . . .53Printing a Question List. . . . . . . . . . . . . . . . . . . . . . . . . . . . .53Versions for Self-Paced Polling . . . . . . . . . . . . . . . . . . . . . .55
Adding a Version . . . . . . . . . . . . . . . . . . . . . . . . . . . . . . .55Editing a Version . . . . . . . . . . . . . . . . . . . . . . . . . . . . . . .57Renaming a Version . . . . . . . . . . . . . . . . . . . . . . . . . . . . .58Deleting a Version . . . . . . . . . . . . . . . . . . . . . . . . . . . . . .59
Standards . . . . . . . . . . . . . . . . . . . . . . . . . . . . . . . . . . . . . . . . .60Downloading Standards . . . . . . . . . . . . . . . . . . . . . . . . . . . .60Assigning Standards Using a Downloaded Standards List. .62Creating a Custom Standards List . . . . . . . . . . . . . . . . . . . .63Assigning Standards Using a Custom Standards List . . . . .65
3 Participant Lists . . . . . . . . . . . . . . . . . . . . . . . . 67Creating Participant Lists . . . . . . . . . . . . . . . . . . . . . . . . . . . . .68
Manually Creating a Participant List . . . . . . . . . . . . . . . . . . .68Downloading a Participant List from an Integration . . . . . . .70
Modifying Participant Lists . . . . . . . . . . . . . . . . . . . . . . . . . . . .72Editing Participant List Information . . . . . . . . . . . . . . . . . . . .72Importing a CSV or TXT File. . . . . . . . . . . . . . . . . . . . . . . . .73Exporting to a CSV, HTML or Template File. . . . . . . . . . . . .74Importing a Template File . . . . . . . . . . . . . . . . . . . . . . . . . . .75
Demographics . . . . . . . . . . . . . . . . . . . . . . . . . . . . . . . . . . . . . .76Adding Demographics to a Participant List . . . . . . . . . . . . . .76Editing Demographics in a Participant List . . . . . . . . . . . . . .77Removing Demographics from a Participant List . . . . . . . . .77
Managing Participant Lists . . . . . . . . . . . . . . . . . . . . . . . . . . . .78Changing a Participant List Name . . . . . . . . . . . . . . . . . . . .78Exporting Participant Lists . . . . . . . . . . . . . . . . . . . . . . . . . .79Importing Participant Lists. . . . . . . . . . . . . . . . . . . . . . . . . . .79Duplicating a Participant List. . . . . . . . . . . . . . . . . . . . . . . . .80Printing a Participant List . . . . . . . . . . . . . . . . . . . . . . . . . . .81Deleting a Participant List . . . . . . . . . . . . . . . . . . . . . . . . . .82
4 Preferences . . . . . . . . . . . . . . . . . . . . . . . . . . . . 84Opening the TurningPoint Preferences. . . . . . . . . . . . . . . . . . .85Software . . . . . . . . . . . . . . . . . . . . . . . . . . . . . . . . . . . . . . . . . .87
Administration . . . . . . . . . . . . . . . . . . . . . . . . . . . . . . . . . . . .88Shortcut Keys . . . . . . . . . . . . . . . . . . . . . . . . . . . . . . . . . . . .89
Connections . . . . . . . . . . . . . . . . . . . . . . . . . . . . . . . . . . . . . . .90Response Devices . . . . . . . . . . . . . . . . . . . . . . . . . . . . . . . .91PresenterCard. . . . . . . . . . . . . . . . . . . . . . . . . . . . . . . . . . . .92PresenterWare . . . . . . . . . . . . . . . . . . . . . . . . . . . . . . . . . . .92RemotePoll . . . . . . . . . . . . . . . . . . . . . . . . . . . . . . . . . . . . . .93
TurningPoint User Guide 5
RemotePoll Monitor . . . . . . . . . . . . . . . . . . . . . . . . . . . . . . .94PowerPoint . . . . . . . . . . . . . . . . . . . . . . . . . . . . . . . . . . . . . . . .95
Charts . . . . . . . . . . . . . . . . . . . . . . . . . . . . . . . . . . . . . . . . . .96Questions . . . . . . . . . . . . . . . . . . . . . . . . . . . . . . . . . . . . . . .97Competitions . . . . . . . . . . . . . . . . . . . . . . . . . . . . . . . . . . . . .99Presentation . . . . . . . . . . . . . . . . . . . . . . . . . . . . . . . . . . . .101
Anywhere . . . . . . . . . . . . . . . . . . . . . . . . . . . . . . . . . . . . . . . .102Charts . . . . . . . . . . . . . . . . . . . . . . . . . . . . . . . . . . . . . . . . .103Competitions . . . . . . . . . . . . . . . . . . . . . . . . . . . . . . . . . . . .104Presentation . . . . . . . . . . . . . . . . . . . . . . . . . . . . . . . . . . . .105
Self-Paced. . . . . . . . . . . . . . . . . . . . . . . . . . . . . . . . . . . . . . . .107Login . . . . . . . . . . . . . . . . . . . . . . . . . . . . . . . . . . . . . . . . . .108
5 PowerPoint Polling. . . . . . . . . . . . . . . . . . . . . 109Opening the PowerPoint Polling Environment . . . . . . . . . . . .110Content . . . . . . . . . . . . . . . . . . . . . . . . . . . . . . . . . . . . . . . . . .111
Inserting a Polling Slide . . . . . . . . . . . . . . . . . . . . . . . . . . .111Converting a PowerPoint Slide into a Multiple Choice Polling Slide. . . . . . . . . . . . . . . . . . . . . . . .113Converting a Multiple Choice Slide into a Demographic Slide . . . . . . . . . . . . . . . . . . . . . . . . . . . . . . .114Slide Types and Slide Preferences. . . . . . . . . . . . . . . . . . .115Objects . . . . . . . . . . . . . . . . . . . . . . . . . . . . . . . . . . . . . . . .127
Inserting a Correct Answer Indicator . . . . . . . . . . . . . . .128Inserting a Chart/Changing the Chart Type . . . . . . . . . .129Inserting an Animated Chart. . . . . . . . . . . . . . . . . . . . . .132Inserting a Countdown Timer . . . . . . . . . . . . . . . . . . . . .133Inserting a Grid . . . . . . . . . . . . . . . . . . . . . . . . . . . . . . . .135Inserting a Prompt . . . . . . . . . . . . . . . . . . . . . . . . . . . . .137Inserting a Response Counter . . . . . . . . . . . . . . . . . . . .139Inserting Stats. . . . . . . . . . . . . . . . . . . . . . . . . . . . . . . . .140
Competition. . . . . . . . . . . . . . . . . . . . . . . . . . . . . . . . . . . . .142Import . . . . . . . . . . . . . . . . . . . . . . . . . . . . . . . . . . . . . . . . .148
Importing a Question List File. . . . . . . . . . . . . . . . . . . . .148Tools . . . . . . . . . . . . . . . . . . . . . . . . . . . . . . . . . . . . . . . . . . . .149
Comparative Links . . . . . . . . . . . . . . . . . . . . . . . . . . . . . . .149Inserting a Comparative Link . . . . . . . . . . . . . . . . . . . . .149
Conditional Branching. . . . . . . . . . . . . . . . . . . . . . . . . . . . .151Setting Up Conditional Branching. . . . . . . . . . . . . . . . . .151
Convert to Picture . . . . . . . . . . . . . . . . . . . . . . . . . . . . . . . .156Converting a Text-based Slide to a Picture Slide . . . . . .156
Demographic Comparison . . . . . . . . . . . . . . . . . . . . . . . . .158Inserting a Demographic Comparison . . . . . . . . . . . . . .158
Ranking Wizard. . . . . . . . . . . . . . . . . . . . . . . . . . . . . . . . . .160Creating Polling Slides with the Ranking Wizard . . . . . .160
TurningPoint User Guide 6
Standards . . . . . . . . . . . . . . . . . . . . . . . . . . . . . . . . . . . . . .163Polling . . . . . . . . . . . . . . . . . . . . . . . . . . . . . . . . . . . . . . . . . . .164
Resetting a PowerPoint Polling Session or Charts . . . . . . .164Continuing a Prior PowerPoint Polling Session . . . . . . . . .165Using the Real-Time Registration Tool . . . . . . . . . . . . . . . .165Running a Slide Show. . . . . . . . . . . . . . . . . . . . . . . . . . . . .167The PowerPoint Polling Showbar . . . . . . . . . . . . . . . . . . . .168Viewing a Response Grid . . . . . . . . . . . . . . . . . . . . . . . . . .169Using the Participant Monitor . . . . . . . . . . . . . . . . . . . . . . .170Messaging. . . . . . . . . . . . . . . . . . . . . . . . . . . . . . . . . . . . . .171Inserting New Slides During the Presentation . . . . . . . . . .173Using Data Slicing. . . . . . . . . . . . . . . . . . . . . . . . . . . . . . . .174Saving a PowerPoint Polling Session . . . . . . . . . . . . . . . . .176
6 Anywhere Polling . . . . . . . . . . . . . . . . . . . . . . .177Polling . . . . . . . . . . . . . . . . . . . . . . . . . . . . . . . . . . . . . . . . . . .178
Running a Session . . . . . . . . . . . . . . . . . . . . . . . . . . . . . . .178About the Anywhere Polling Showbar. . . . . . . . . . . . . . . . .180About the Chart Window. . . . . . . . . . . . . . . . . . . . . . . . . . .182Quick Poll Question Types . . . . . . . . . . . . . . . . . . . . . . . . .184Marking a Question as Anonymous . . . . . . . . . . . . . . . . . .187Using the Real-Time Registration Tool . . . . . . . . . . . . . . . .187Messaging. . . . . . . . . . . . . . . . . . . . . . . . . . . . . . . . . . . . . .189
Sessions . . . . . . . . . . . . . . . . . . . . . . . . . . . . . . . . . . . . . . . . .190Saving an Anywhere Polling Session . . . . . . . . . . . . . . . . .190Resetting an Anywhere Polling Session . . . . . . . . . . . . . . .191Continuing a Prior Anywhere Polling Session. . . . . . . . . . .191
7 Self-Paced Polling . . . . . . . . . . . . . . . . . . . . . . .192Setting Up Self-Paced Polling . . . . . . . . . . . . . . . . . . . . . . . . .193Viewing the Compact Mode . . . . . . . . . . . . . . . . . . . . . . . . . .194Manually Setting a Timer . . . . . . . . . . . . . . . . . . . . . . . . . . . .195Polling . . . . . . . . . . . . . . . . . . . . . . . . . . . . . . . . . . . . . . . . . . .196
Self-Paced Polling. . . . . . . . . . . . . . . . . . . . . . . . . . . . . . . .196Viewing the Live Results Monitor . . . . . . . . . . . . . . . . . . . .197
Sessions . . . . . . . . . . . . . . . . . . . . . . . . . . . . . . . . . . . . . . . . .200Saving a Self-Paced Polling Session . . . . . . . . . . . . . . . . .200Resetting a Self-Paced Polling Session . . . . . . . . . . . . . . .201Continuing a Self-Paced Polling Session . . . . . . . . . . . . . .201
8 Sessions . . . . . . . . . . . . . . . . . . . . . . . . . . . . . . 202Individual Session Management . . . . . . . . . . . . . . . . . . . . . . .203
Importing Sessions . . . . . . . . . . . . . . . . . . . . . . . . . . . . . . .203Exporting Sessions . . . . . . . . . . . . . . . . . . . . . . . . . . . . . . .204Extracting Session Information . . . . . . . . . . . . . . . . . . . . . .205
TurningPoint User Guide 7
Creating a Participant List from an Auto Session . . . . . . . .206Merging Sessions . . . . . . . . . . . . . . . . . . . . . . . . . . . . . . . .206Deleting Sessions . . . . . . . . . . . . . . . . . . . . . . . . . . . . . . . .208Changing a Session Name . . . . . . . . . . . . . . . . . . . . . . . . .209Editing a Session . . . . . . . . . . . . . . . . . . . . . . . . . . . . . . . .209
Results Manager . . . . . . . . . . . . . . . . . . . . . . . . . . . . . . . . . . .213Overview. . . . . . . . . . . . . . . . . . . . . . . . . . . . . . . . . . . . . . .214
Opening the Results Manager Overview . . . . . . . . . . . .215Adding a Manual Grade Column . . . . . . . . . . . . . . . . . .218Reordering the Session Columns. . . . . . . . . . . . . . . . . .219Overwriting Session Scores . . . . . . . . . . . . . . . . . . . . . .220
Sessions . . . . . . . . . . . . . . . . . . . . . . . . . . . . . . . . . . . . . . .221Excluding a Session . . . . . . . . . . . . . . . . . . . . . . . . . . . .221Setting Session Performance Points . . . . . . . . . . . . . . .222Setting Attendance Points . . . . . . . . . . . . . . . . . . . . . . .222
Participants . . . . . . . . . . . . . . . . . . . . . . . . . . . . . . . . . . . . .223Editing Participant Information . . . . . . . . . . . . . . . . . . . .224Saving Device IDs from the Real-Time Registration Tool. . . . . . . . . . . . . . . . . . . . . .225Adding or Removing Devices . . . . . . . . . . . . . . . . . . . . .225Viewing Grade Overview Information . . . . . . . . . . . . . . .226Removing a Participant from a Single Session . . . . . . .227Removing a Participant from Results Manager . . . . . . .228Deleting a Removed Participant . . . . . . . . . . . . . . . . . . .229
Unassigned Devices . . . . . . . . . . . . . . . . . . . . . . . . . . . . . .230Assigning an Unassigned Device . . . . . . . . . . . . . . . . . .231Viewing the Grade Overview . . . . . . . . . . . . . . . . . . . . .233Assigning a Single Session to a Participant . . . . . . . . . .233
Removed Participants. . . . . . . . . . . . . . . . . . . . . . . . . . . . .235Viewing Removed Participants . . . . . . . . . . . . . . . . . . .235Reinstating a Participant. . . . . . . . . . . . . . . . . . . . . . . . .236Viewing the Participant Information . . . . . . . . . . . . . . . .236Viewing the Grade Overview . . . . . . . . . . . . . . . . . . . . .237
Export . . . . . . . . . . . . . . . . . . . . . . . . . . . . . . . . . . . . . . . . .238Exporting a Participant Report . . . . . . . . . . . . . . . . . . . .238Exporting a Session to an Export Scheme . . . . . . . . . . .240Exporting the Results Manager Overview . . . . . . . . . . .241
Integrations . . . . . . . . . . . . . . . . . . . . . . . . . . . . . . . . . . . . .242Updating Participant Lists from an LMS . . . . . . . . . . . . .242Exporting Sessions to an LMS Integration . . . . . . . . . .243
Archiving . . . . . . . . . . . . . . . . . . . . . . . . . . . . . . . . . . . . . . .244Archiving a Participant List . . . . . . . . . . . . . . . . . . . . . . . . .244Restoring an Archived Participant List . . . . . . . . . . . . . . . .245
TurningPoint User Guide 8
9 Reports . . . . . . . . . . . . . . . . . . . . . . . . . . . . . . 246Generating Reports. . . . . . . . . . . . . . . . . . . . . . . . . . . . . . . . .247Exporting a Report . . . . . . . . . . . . . . . . . . . . . . . . . . . . . . . . .249Saving and Printing a PDF Report . . . . . . . . . . . . . . . . . . . . .249Results by Question . . . . . . . . . . . . . . . . . . . . . . . . . . . . . . . .250Results by Participant . . . . . . . . . . . . . . . . . . . . . . . . . . . . . . .253Results Detail . . . . . . . . . . . . . . . . . . . . . . . . . . . . . . . . . . . . .254Results by Demographic . . . . . . . . . . . . . . . . . . . . . . . . . . . . .255Comparative Results. . . . . . . . . . . . . . . . . . . . . . . . . . . . . . . .257Session Log Report. . . . . . . . . . . . . . . . . . . . . . . . . . . . . . . . .258
10 Contact Us . . . . . . . . . . . . . . . . . . . . . . . . . . . 259Online Assistance. . . . . . . . . . . . . . . . . . . . . . . . . . . . . .259Customer Support . . . . . . . . . . . . . . . . . . . . . . . . . . . . .260
11 Glossary . . . . . . . . . . . . . . . . . . . . . . . . . . . . . . .261

TurningPoint User Guide 9
1Welcome to TurningPoint!
TurningPoint combines all of the Turning Technologies legacy applications into one, user-friendly interface. Content creation, participant lists, data management (Results Manager) and reports are in one central location. All three polling environments: PowerPoint Polling (formerly TurningPoint), Anywhere Polling (formerly TurningPoint Anywhere) and Self-Paced Polling (formerly TurningKey) are included.
Existing content such as question lists, participant lists and session files can be imported directly into the new software.
TurningPoint User Guide 10
What’s New in TurningPoint 5
What’s New in TurningPoint 5TurningPoint is Turning Technologies’ first, truly cross-platform, poll in ANY environment application.
• Simplifies user workflow and user experience for all current applications by consolidating them into one central interface
A robust HTML content editor that supports pictures, special characters, subscripts and superscripts
An equation editor
Simplifies the ability to create question lists for use in all three polling environments
Simplifies the ability to create, import and export participant lists from the new participant list editor
• Drag and drop functionality for CSV and TXT files
• Copy and Paste functionality for Mac and PC
• Quickly import files downloaded from specific gradebooks and Learning Management Systems
A newly enhanced area to manage aggregate session data (formerly ResultsManager)
• Customized view by toggling data options
• Update participant lists downloaded from Learning Management Systems, export both single session and cumulative grade columns
Device and data manipulation, allowing different devices to be used for individual sessions
A report interface that consolidates the 32 reports, traditionally available from Turning Technologies, into six new customizable reports
• Available for all environments: PowerPoint Polling, Anywhere Polling and Self-Paced Polling
• Reports are customized by toggling information on and off in the data view
• All reports can be easily printed without formatting
• Export results to Excel, CSV and HTML for sharing and manual manipulation
TurningPoint User Guide 11
Technical Requirements
Technical RequirementsTurningPoint was designed to function on most computers; however, there are some basic hardware and software requirements.
Requirements for Software and HardwareThe following software and hardware specifications are required before using TurningPoint:
• Microsoft Windows: XP, Vista, 7 or 8
• Microsoft Office: 2003, 2007, 2010 or 2013 (for PowerPoint Polling and viewing exported reports in Excel)
• Microsoft .NET 3.5 SP1
• Intel or AMD 2GHz processor
• 512 MB RAM
• 120 MB hard disk space
• 1024 x 768 at 32-bit color or higher resolution
• Standard USB 2.0 port (for USB-based hardware devices)
• Ethernet or 802.11 compatible wireless network card required if ResponseWare is in use
• Adobe Flash Player (for Animated 2D/3D charts)
• Adobe Acrobat Reader (for printing)
• Java 7 or later (for importing RTF, DOC, DOCX and QTI documents and exporting reports to Excel and CSV)
Compatible Devices
The following devices are compatible with TurningPoint:
• ResponseCard IR, RF and RF LCD (PowerPoint Polling and Anywhere Polling)
• ResponseCard XR and NXT (PowerPoint Polling, Anywhere Polling and Self-Paced Polling)
• PresenterCard (PowerPoint Polling and Anywhere Polling)
• ResponseWare (PowerPoint Polling and Anywhere Polling)
• PresenterWare (PowerPoint Polling and Anywhere Polling)
TurningPoint User Guide 12
Getting Started
Getting StartedTo get started with TurningPoint, the software must be downloaded from www.turningtechnologies.com/downloads. Uninstalling previous versions of Turning Technologies software is not necessary; however, only one version of the software should be open at any given time.
Download and Setup
TurningPoint can be downloaded through the Turning Technologies website. After it has been downloaded, the file will need to be unzipped or installed depending on the version that was downloaded.
Downloading TurningPoint
The TurningPoint software is accessible through the Turning Technologies website.
Prerequisites
Please verify that your computer meets the Technical Requirements before downloading TurningPoint.
How to download TurningPoint...
1 Go to www.turningtechnologies.com/downloads.
2 Click TurningPoint and then click the link to download the PC version.
Release notes are available in PDF format to the right of the download link.
3 Enter the required information and click Submit.
4 Click the link to start the download.
5 Save the file to a specified location.
TurningPoint User Guide 13
Getting Started
Opening TurningPoint (Zipped File)
Before TurningPoint can be opened, the zipped file must be extracted.
How to open TurningPoint (zipped file)...
1 Double-click the downloaded zip file.
2 Select the desired folder location and click Unzip.
3 Open the unzipped folder and double-click TurningPoint.exe.
Installing TurningPoint (EXE File)
If the install version of TurningPoint was downloaded from the Turning Technologies website, the Extraction Wizard will need to run.
How to Install TurningPoint (EXE file)...
1 Double-click the downloaded setup file.
2 Click Next.
A window opens and displays the license agreement. Read the license agreement on the screen or click the Print button to send the text to a printer.
3 Select the radio button labeled I accept the terms in the license agreement if you accept the terms.
4 Click Next.
5 Enter the name and organization in the fields provided and click Next.
A window opens and displays a message that the computer is ready to install TurningPoint.
6 Click Install.
The computer installs TurningPoint and displays the Finish button on the page when the process is complete.
TipCreate a shortcut for TurningPoint.exe on the desktop for quicker access to the application. DO NOT remove any files from the Application folder. If files are removed the application will not function properly.
TurningPoint User Guide 14
Getting Started
7 Click Finish.
Select the Launch TurningPoint checkbox to immediately open the application, or double-click the TurningPoint shortcut on the desktop to open the application.
Configuring Automatic Updates
Automatic updates allows for the software to be updated without first uninstalling it.
How to configure automatic updates...
1 Open TurningPoint.
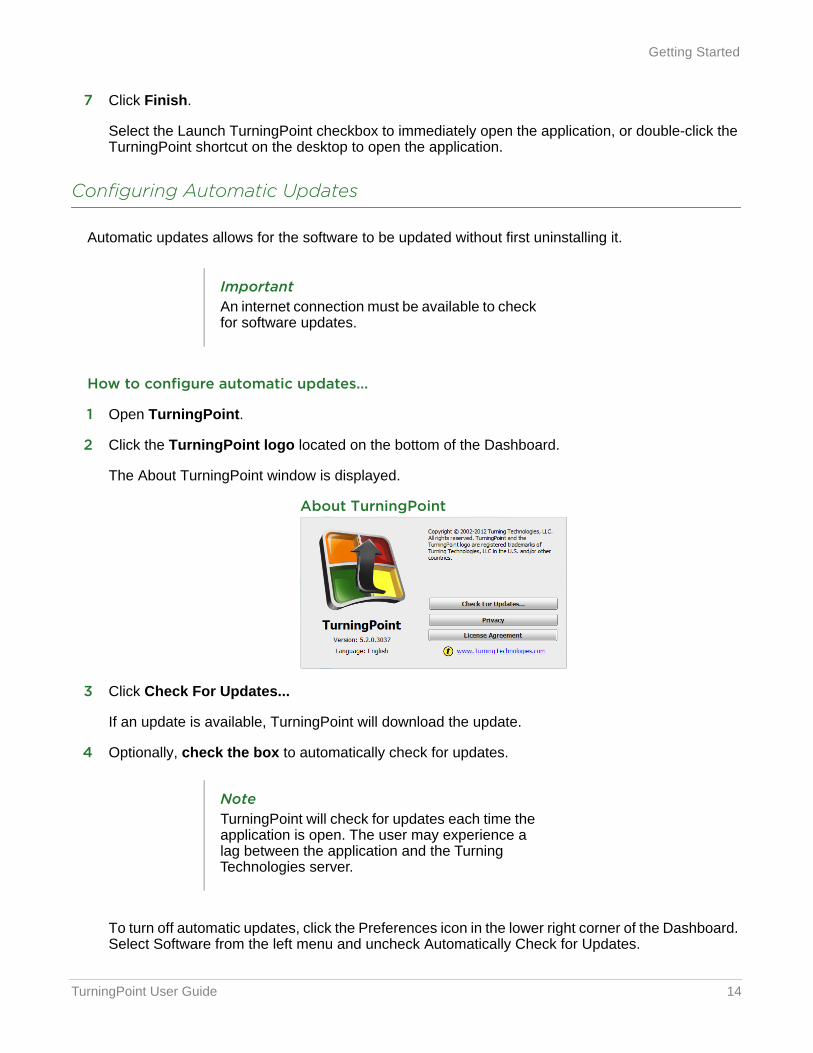
2 Click the TurningPoint logo located on the bottom of the Dashboard.
The About TurningPoint window is displayed.
About TurningPoint
3 Click Check For Updates...
If an update is available, TurningPoint will download the update.
4 Optionally, check the box to automatically check for updates.
To turn off automatic updates, click the Preferences icon in the lower right corner of the Dashboard. Select Software from the left menu and uncheck Automatically Check for Updates.
ImportantAn internet connection must be available to check for software updates.
NoteTurningPoint will check for updates each time the application is open. The user may experience a lag between the application and the Turning Technologies server.
TurningPoint User Guide 15
Getting Started
Device Setup
Participants interact with TurningPoint through response devices (ResponseCards) that communicate through a receiver or the internet with web enabled devices (ResponseWare). A list of the compatible devices can be found on page 11.
This section provides instructions for:
• Changing the Channel on the Receiver
• Locking the Receiver Channel
• Setting Up ResponseWare
• Testing the Polling Connections
• Pairing a PresenterCard
Changing the Channel on the Receiver
When the receiver is plugged in, it is automatically recognized by the computer. The default channel on the receiver is set to 41. Changing the channel allows multiple receivers to accept different sets of responses when in close proximity of one another. The ResponseCards need to be set to the same channel as the receiver when polling.
How to change the channel on the receiver...
1 Plug in the receiver and open TurningPoint.
2 Click the channel number below Receiver.
The Preferences window opens.
3 Select the channel number from the drop-down menu under ResponseCard Channels.
Next Steps
Once the receiver has been setup it is now possible to begin Testing the Polling Connections. To test the polling connections the ResponseCards need to be set to the same channel as the receiver.
TurningPoint User Guide 16
Getting Started
Locking the Receiver Channel
Administrators have the ability to lock down the channel to prevent users from changing channels in shared environments.
How to lock the receiver channel...
1 Run TurningPoint as the Administrator.
2 Click Preferences in the bottom right corner.
3 Select Connections.
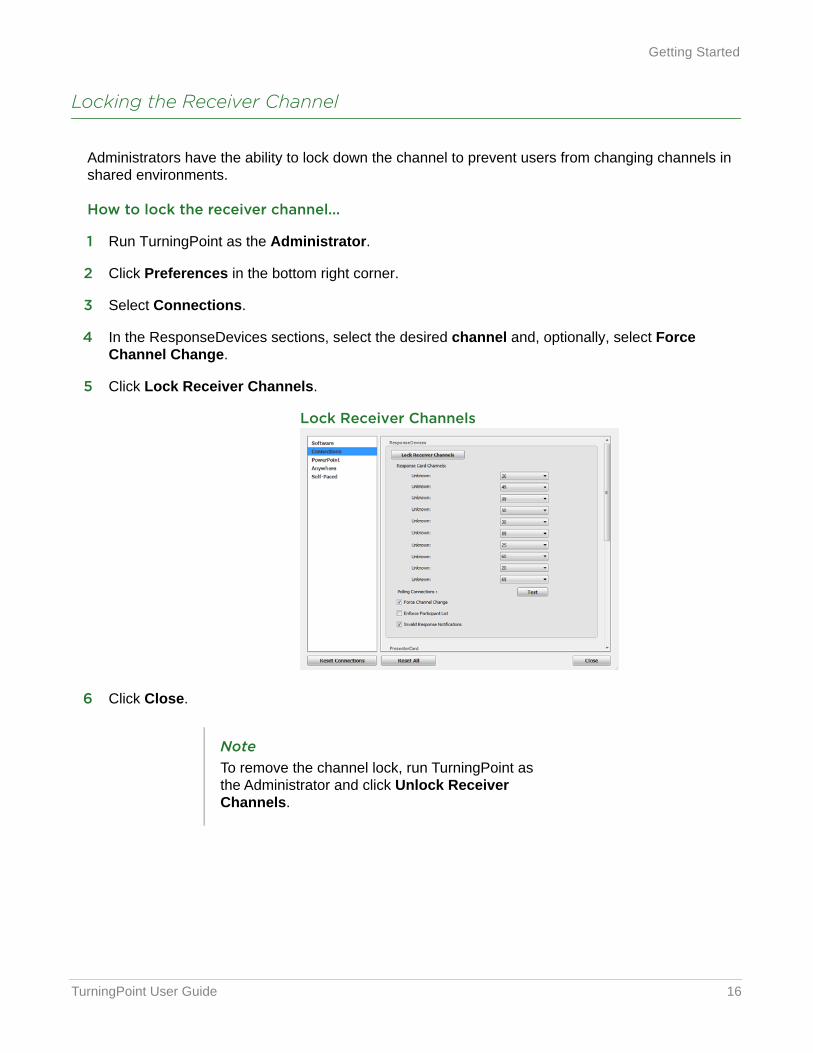
4 In the ResponseDevices sections, select the desired channel and, optionally, select Force Channel Change.
5 Click Lock Receiver Channels.
Lock Receiver Channels
6 Click Close.
NoteTo remove the channel lock, run TurningPoint as the Administrator and click Unlock Receiver Channels.
TurningPoint User Guide 17
Getting Started
Setting Up ResponseWare
ResponseWare must be enabled for participants to use ResponseWare as a response device.
How to setup ResponseWare...
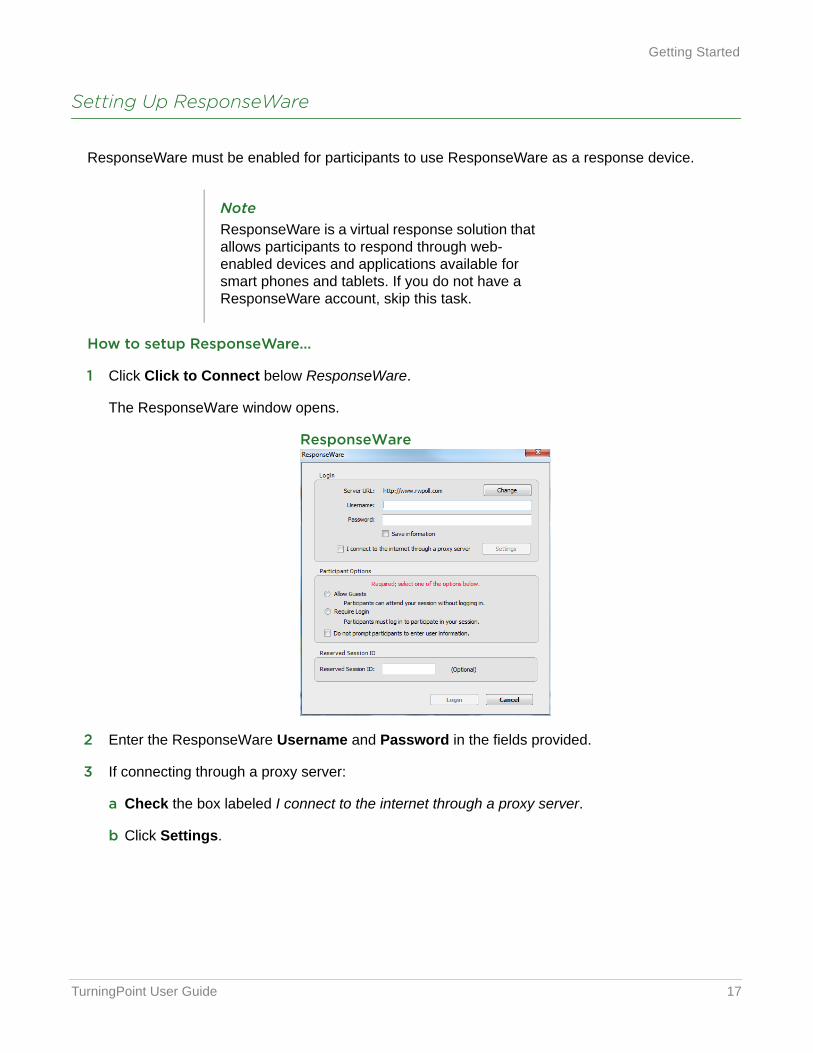
1 Click Click to Connect below ResponseWare.
The ResponseWare window opens.
ResponseWare
2 Enter the ResponseWare Username and Password in the fields provided.
3 If connecting through a proxy server:
a Check the box labeled I connect to the internet through a proxy server.
b Click Settings.
NoteResponseWare is a virtual response solution that allows participants to respond through web-enabled devices and applications available for smart phones and tablets. If you do not have a ResponseWare account, skip this task.
TurningPoint User Guide 18
Getting Started
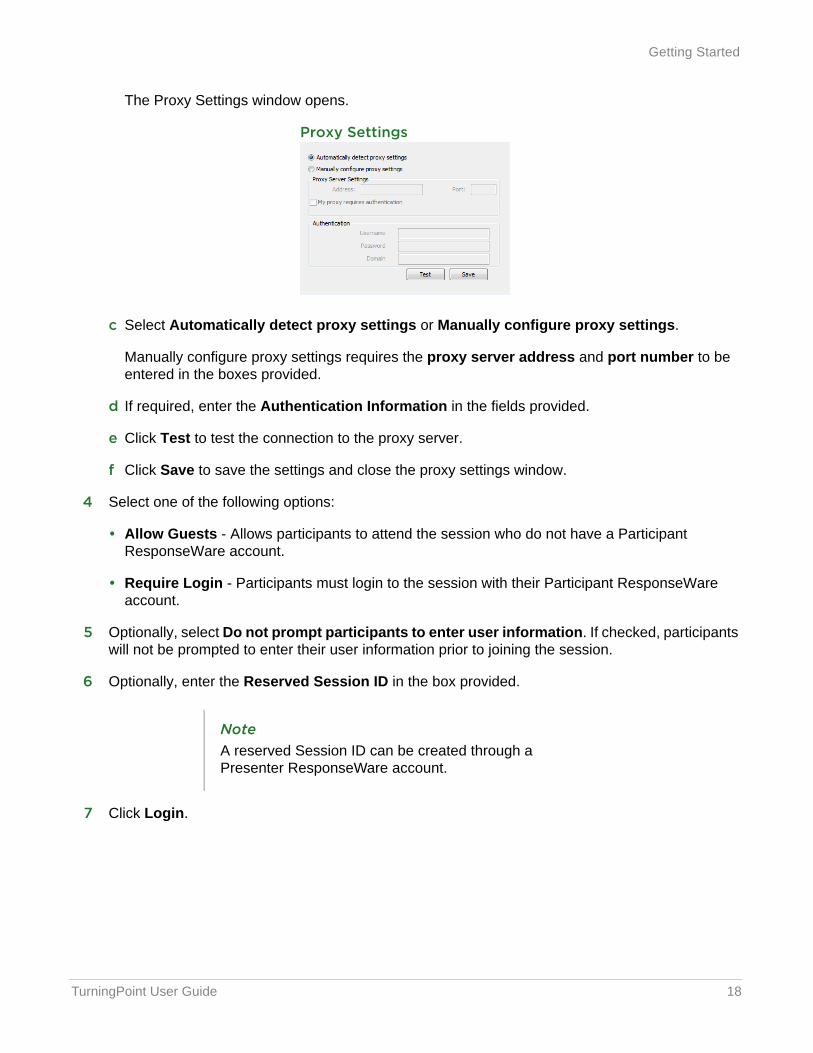
The Proxy Settings window opens.
Proxy Settings
c Select Automatically detect proxy settings or Manually configure proxy settings.
Manually configure proxy settings requires the proxy server address and port number to be entered in the boxes provided.
d If required, enter the Authentication Information in the fields provided.
e Click Test to test the connection to the proxy server.
f Click Save to save the settings and close the proxy settings window.
4 Select one of the following options:
• Allow Guests - Allows participants to attend the session who do not have a Participant ResponseWare account.
• Require Login - Participants must login to the session with their Participant ResponseWare account.
5 Optionally, select Do not prompt participants to enter user information. If checked, participants will not be prompted to enter their user information prior to joining the session.
6 Optionally, enter the Reserved Session ID in the box provided.
7 Click Login.
NoteA reserved Session ID can be created through a Presenter ResponseWare account.
TurningPoint User Guide 19
Getting Started
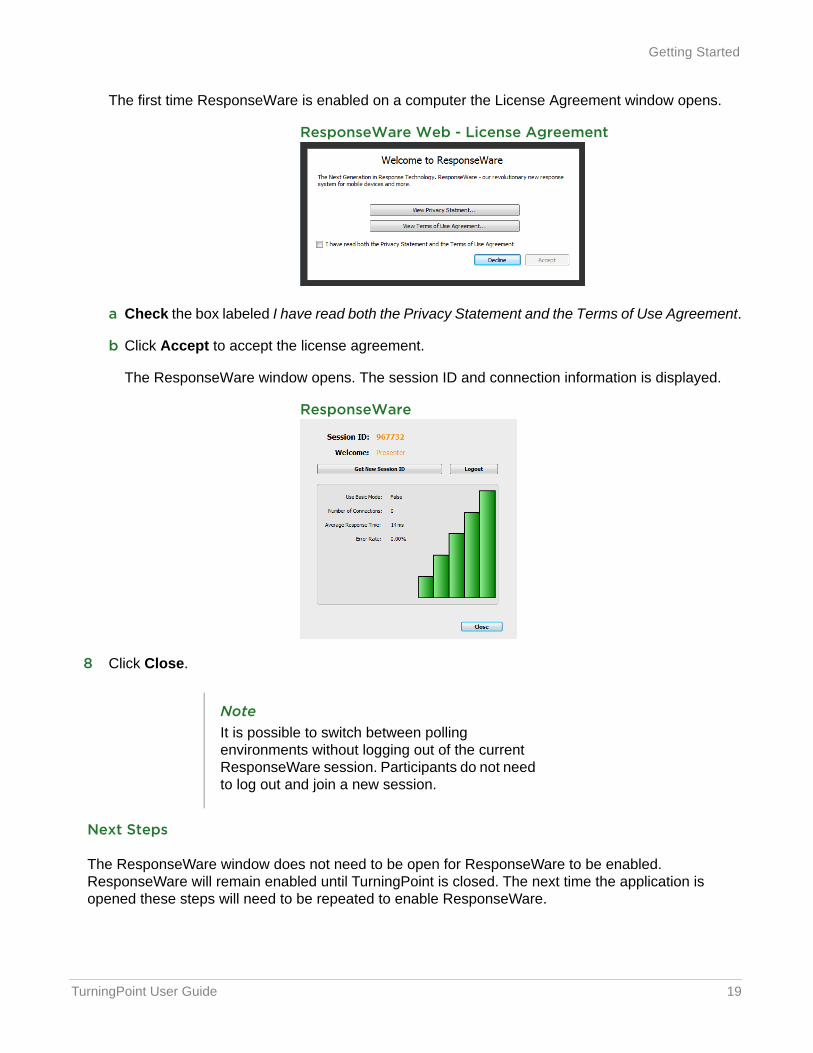
The first time ResponseWare is enabled on a computer the License Agreement window opens.
ResponseWare Web - License Agreement
a Check the box labeled I have read both the Privacy Statement and the Terms of Use Agreement.
b Click Accept to accept the license agreement.
The ResponseWare window opens. The session ID and connection information is displayed.
ResponseWare
8 Click Close.
Next Steps
The ResponseWare window does not need to be open for ResponseWare to be enabled. ResponseWare will remain enabled until TurningPoint is closed. The next time the application is opened these steps will need to be repeated to enable ResponseWare.
NoteIt is possible to switch between polling environments without logging out of the current ResponseWare session. Participants do not need to log out and join a new session.
TurningPoint User Guide 20
Getting Started
Testing the Polling Connections
The polling test is used to ensure that each response device can communicate with TurningPoint.
Prerequisites
Ensure the device receiver is properly installed and the compatible response device to be tested is available.
How to test the polling connections...
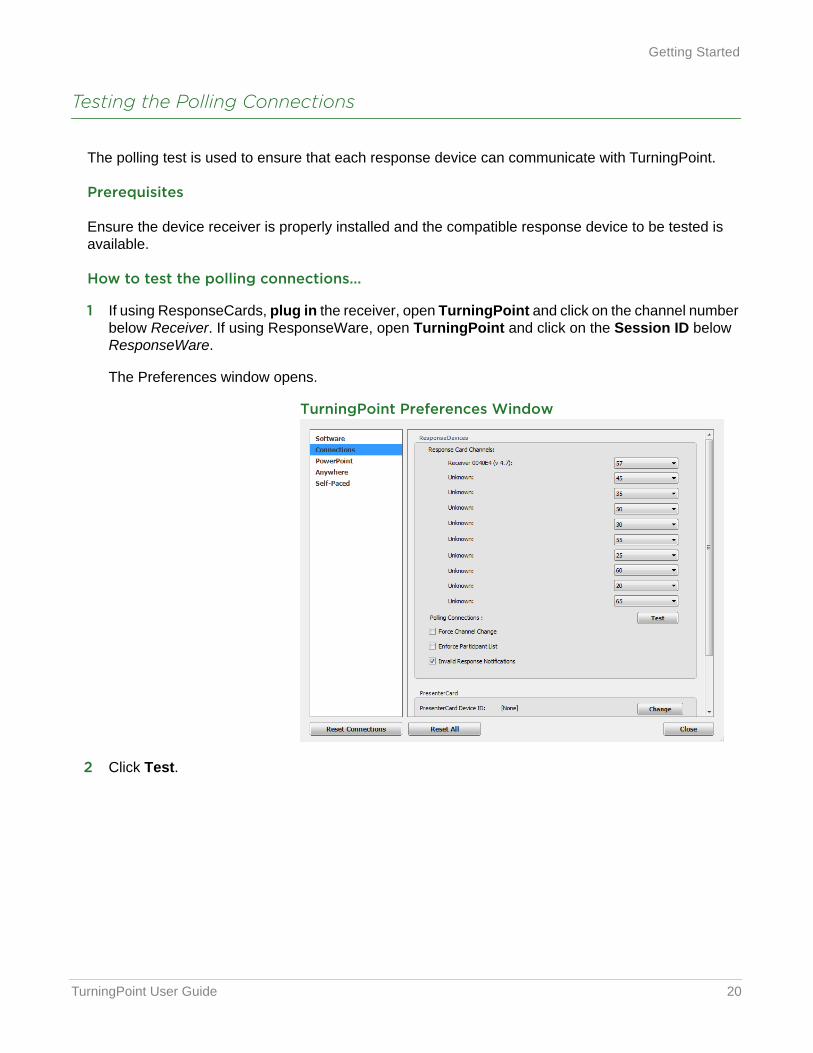
1 If using ResponseCards, plug in the receiver, open TurningPoint and click on the channel number below Receiver. If using ResponseWare, open TurningPoint and click on the Session ID below ResponseWare.
The Preferences window opens.
TurningPoint Preferences Window
2 Click Test.
TurningPoint User Guide 21
Getting Started
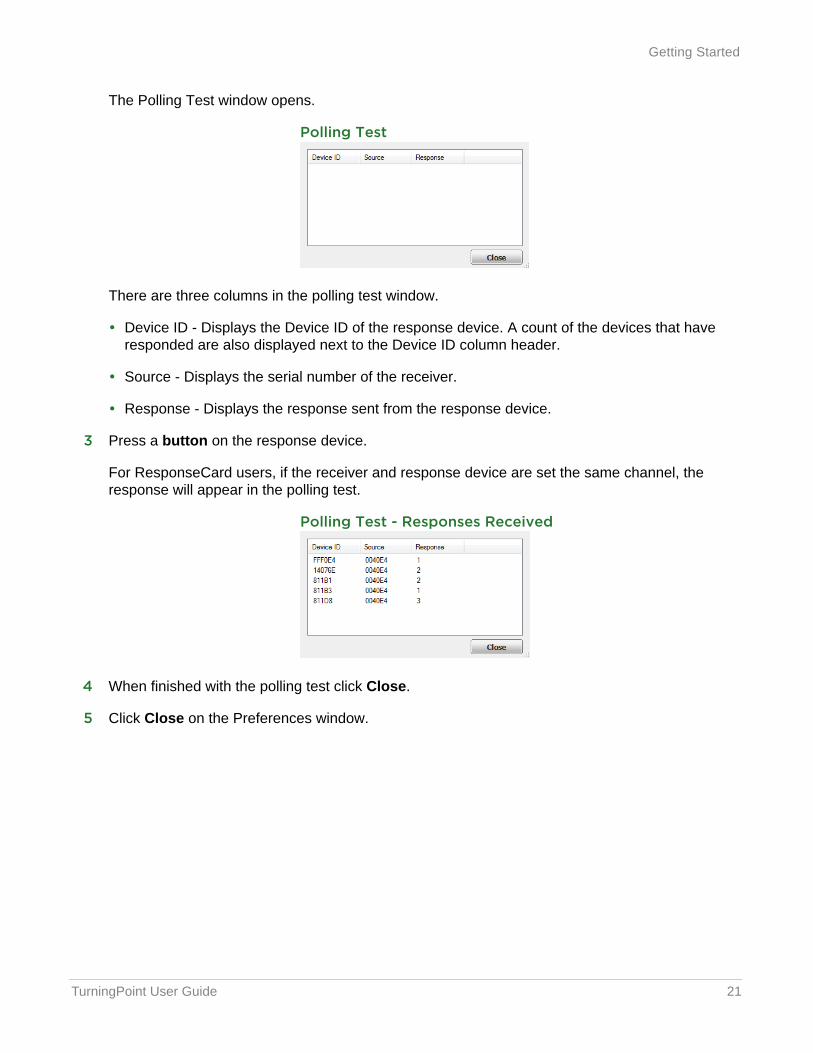
The Polling Test window opens.
Polling Test
There are three columns in the polling test window.
• Device ID - Displays the Device ID of the response device. A count of the devices that have responded are also displayed next to the Device ID column header.
• Source - Displays the serial number of the receiver.
• Response - Displays the response sent from the response device.
3 Press a button on the response device.
For ResponseCard users, if the receiver and response device are set the same channel, the response will appear in the polling test.
Polling Test - Responses Received
4 When finished with the polling test click Close.
5 Click Close on the Preferences window.
TurningPoint User Guide 22
Getting Started
Pairing a PresenterCard
A PresenterCard must be paired with TurningPoint before it can be used as a presentation device. If you do not have a PresenterCard, skip this task.
How to pair a PresenterCard...
1 Plug in the receiver and open TurningPoint.
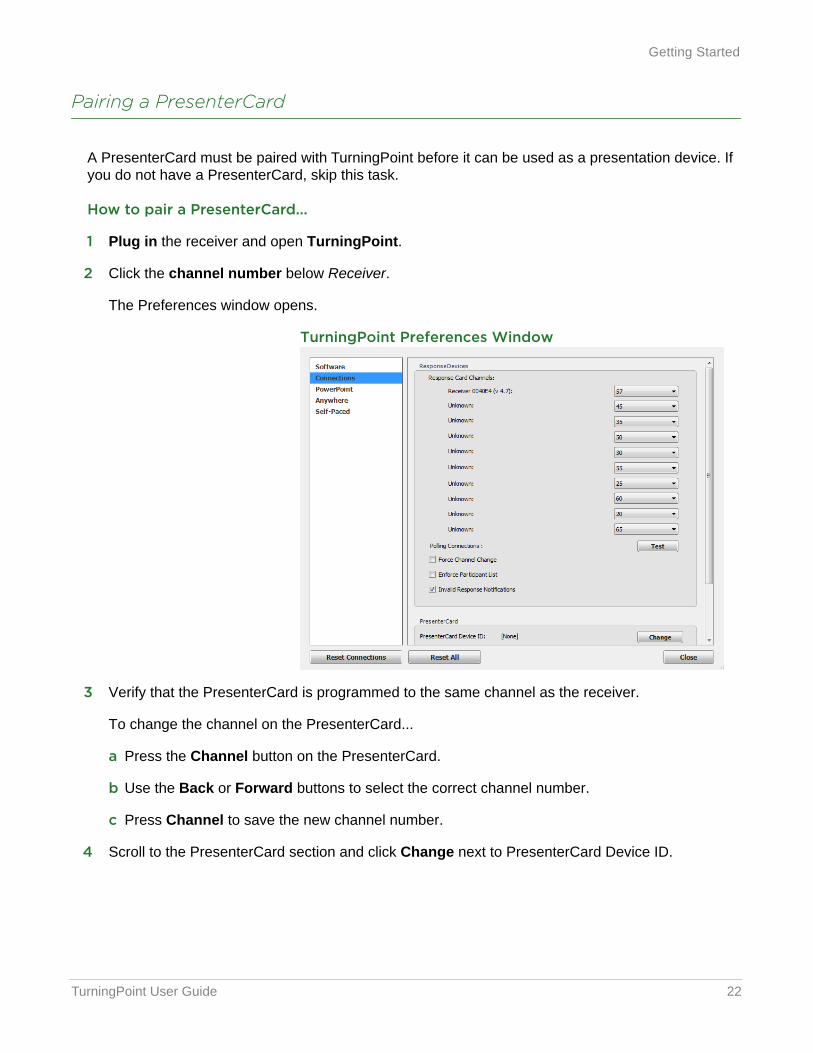
2 Click the channel number below Receiver.
The Preferences window opens.
TurningPoint Preferences Window
3 Verify that the PresenterCard is programmed to the same channel as the receiver.
To change the channel on the PresenterCard...
a Press the Channel button on the PresenterCard.
b Use the Back or Forward buttons to select the correct channel number.
c Press Channel to save the new channel number.
4 Scroll to the PresenterCard section and click Change next to PresenterCard Device ID.
TurningPoint User Guide 23
Getting Started
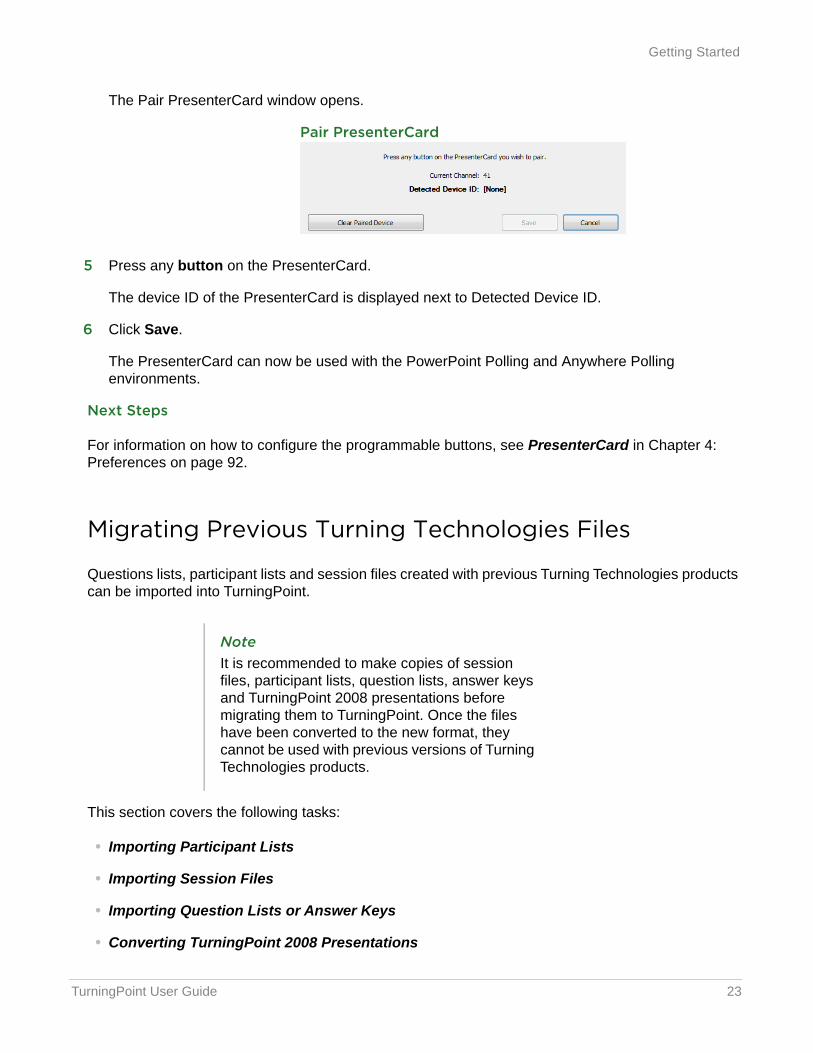
The Pair PresenterCard window opens.
Pair PresenterCard
5 Press any button on the PresenterCard.
The device ID of the PresenterCard is displayed next to Detected Device ID.
6 Click Save.
The PresenterCard can now be used with the PowerPoint Polling and Anywhere Polling environments.
Next Steps
For information on how to configure the programmable buttons, see PresenterCard in Chapter 4: Preferences on page 92.
Migrating Previous Turning Technologies Files
Questions lists, participant lists and session files created with previous Turning Technologies products can be imported into TurningPoint.
This section covers the following tasks:
• Importing Participant Lists
• Importing Session Files
• Importing Question Lists or Answer Keys
• Converting TurningPoint 2008 Presentations
NoteIt is recommended to make copies of session files, participant lists, question lists, answer keys and TurningPoint 2008 presentations before migrating them to TurningPoint. Once the files have been converted to the new format, they cannot be used with previous versions of Turning Technologies products.
TurningPoint User Guide 24
Getting Started
Importing Participant Lists
Participant lists created with previous Turning Technologies products can be imported into TurningPoint. There is no need to recreate existing participant lists.
How to import existing participant lists...
1 Select the Manage tab.
2 Click Participant List and select Import.
3 Click Choose File... and browse to the location of the participant list to be imported.
4 Select the participant list and click Open.
The participant list is now displayed in the panel on the left.
5 Repeat steps 2 - 4 to import additional participant lists.
Importing Session Files
Session files created with other Turning Technologies products may be copied into the TurningPoint Sessions folder. TurningPoint will automatically convert them to the new format. The session files can also be converted using the import function on the Manage tab.
How to import sessions from another location...
1 Select the Manage tab.
2 Click Session and select Import.
3 Browse to the location of the session.
4 Select the session(s) and click Open.
5 Select one of the following options:
a Convert and Replace - This option converts the session file to the new format and deletes the original session file. The new session file is saved in the TurningPoint Sessions folder.
b Convert and Keep - This option adds the session to the sessions list, but the file remains in its original location. The file must remain in this location to view reports and edit the session. If the file is moved, it must be relocated in the session overview screen.
The import summary displays the status of each session(s) that was selected for import.
6 Click OK.
The session(s) are now displayed in the panel on the left.
TurningPoint User Guide 25
Getting Started
Importing Question Lists or Answer Keys
Question lists and answer keys created in TurningPoint Anywhere and TurningKey can be imported into TurningPoint. There is no need to recreate existing content.
How to import existing question lists or answer keys...
1 Select the Content tab.
2 Click Question List and select Import.
3 Browse to the location of the file to be imported.
4 Select the question list and click Open.
A dialog box appears. Click Yes to convert the selected file to the new format.
Next Steps
For more information about updating question list preferences, see Updating Question Preferences within the Question List Editor on page 50.
Converting TurningPoint 2008 Presentations
Presentations created in TurningPoint 2008 can be converted to the new TurningPoint and used for polling.
How to convert a TurningPoint 2008 presentation...
1 Open TurningPoint.
2 Click PowerPoint Polling.
PowerPoint opens with the TurningPoint ribbon/toolbar.
3 Open the TurningPoint 2008 presentation.
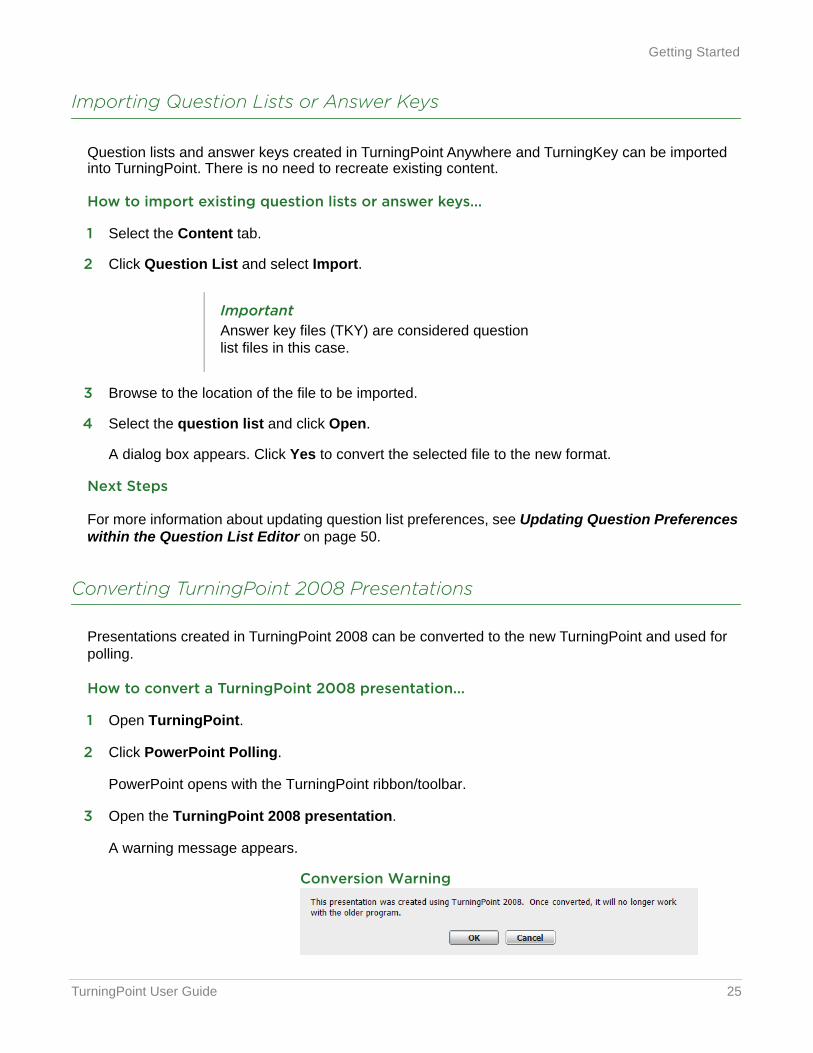
A warning message appears.
Conversion Warning
ImportantAnswer key files (TKY) are considered question list files in this case.

TurningPoint User Guide 26
Getting Started
4 Click OK to continue the conversion.
The TurningPoint 2008 presentation is converted to the new format.
5 Save the presentation.
TipSave the PowerPoint presentation in the TurningPoint Content folder. The presentation will be listed in the Content section of the Polling tab for quick access.
TurningPoint User Guide 27
2 Content
This chapter covers the following sections:
• Managing Content
• Question Lists
• Standards
TurningPoint User Guide 28
Managing Content
Managing ContentThe TurningPoint Content tab allows a user to organize content into folders for all three polling environments. Content may be in the form of question lists or PowerPoint presentations.
This section covers the following topics:
• Organizing Content Into Folders
• Exporting Content
• Importing Content
• Deleting Content
• Refreshing Folder Content
Organizing Content Into Folders
Folders can be created to organize content. Once a folder is created, content items can be placed into the folder.
How to organize content into folders...
1 Select the Content tab.
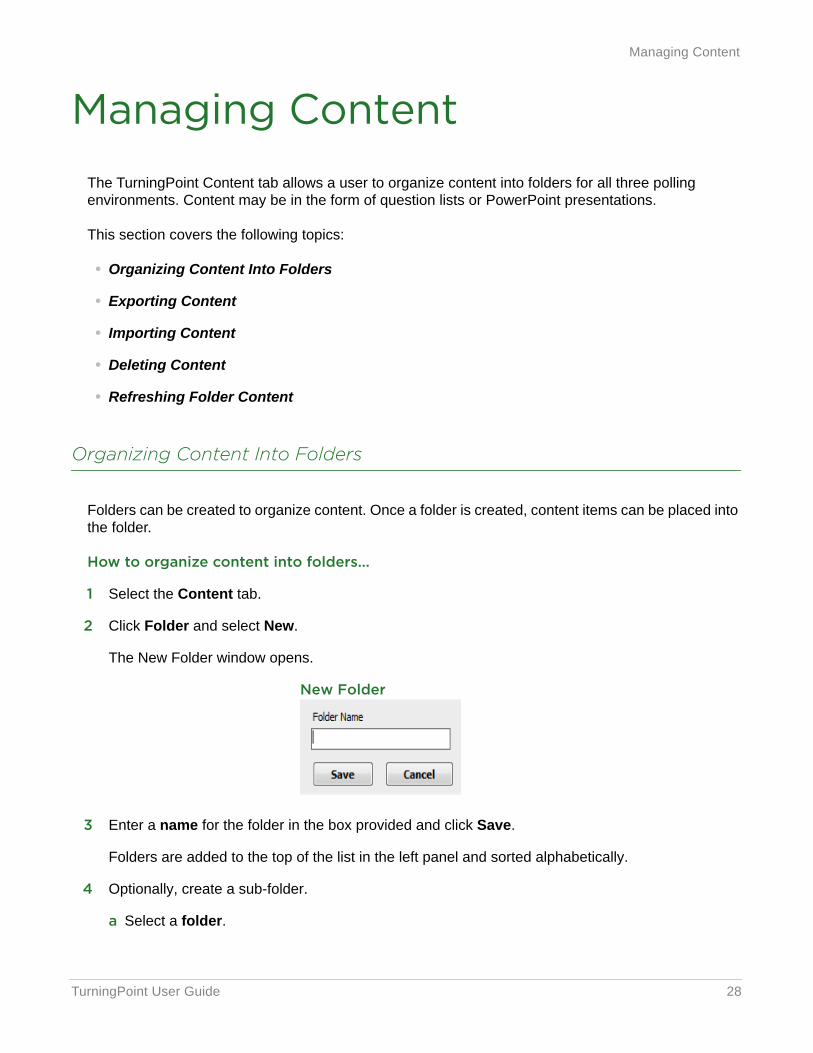
2 Click Folder and select New.
The New Folder window opens.
New Folder
3 Enter a name for the folder in the box provided and click Save.
Folders are added to the top of the list in the left panel and sorted alphabetically.
4 Optionally, create a sub-folder.
a Select a folder.
TurningPoint User Guide 29
Managing Content
b Click Folder and select New.
c Enter a name for the sub-folder in the box provided and click Save.
5 Repeat steps 2 - 4 to create additional folders or sub-folders.
6 To remove a folder, select the folder, click Folder and select Delete.
Next Steps
To place content into a folder, select the content and drag it to the desired folder.
Exporting Content
Question lists and PowerPoint presentations can be exported from TurningPoint. Exporting content creates a copy of the file in the specified location. The file is not removed from its current location.
How to export content...
1 Select the Content tab.
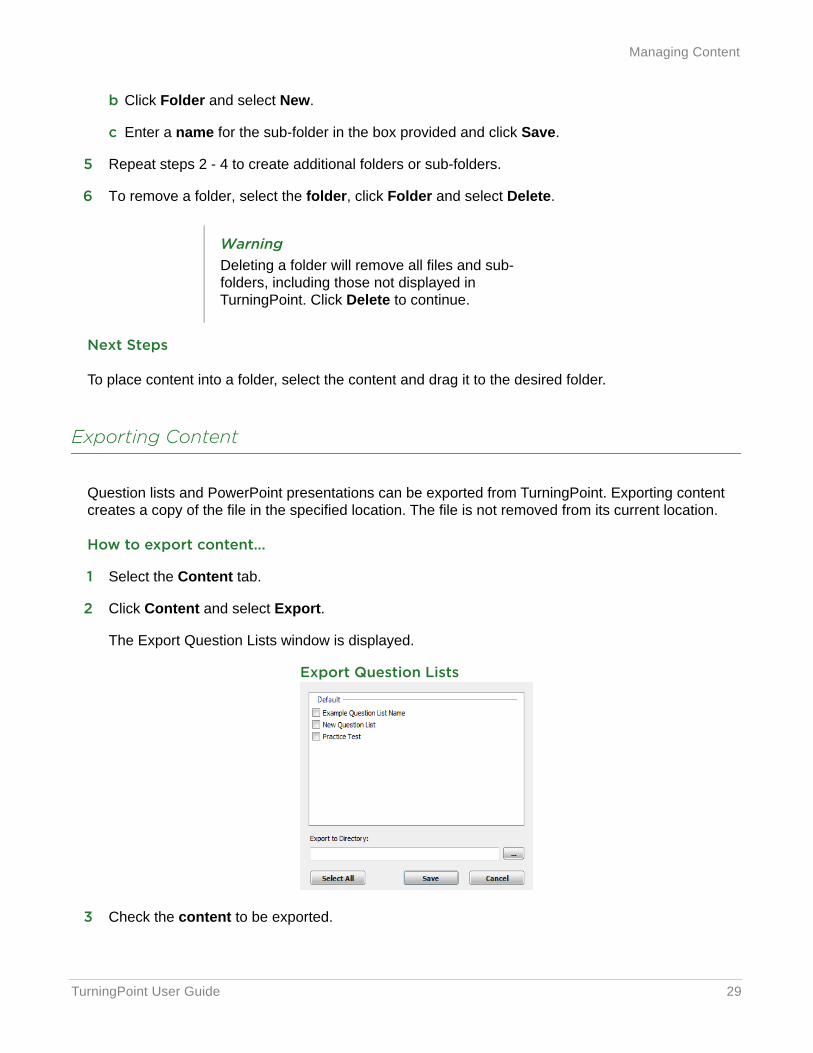
2 Click Content and select Export.
The Export Question Lists window is displayed.
Export Question Lists
3 Check the content to be exported.
WarningDeleting a folder will remove all files and sub-folders, including those not displayed in TurningPoint. Click Delete to continue.
TurningPoint User Guide 30
Managing Content
To export all content from TurningPoint, click Select All.
4 Click ... and navigate to the desired location.
5 Click OK.
6 Click Save.
Importing Content
The following file types can be imported into TurningPoint: question list files (TPQX and TPQ), answer key files from TurningKey (TKY), QuestionPoint files (TQZ) and PowerPoint presentations (PPTX and PPT). When a file is imported, it is copied from its current location to the Content folder in TurningPoint.
How to import existing question list into TurningPoint...
1 Select the Content tab.
2 Click Content and select Import.
3 Select the file(s) and click Open.
Next Steps
To place content into a folder, select the content and drag it to the desired folder. For more information on folders, see Organizing Content Into Folders in Chapter 2: Content on page 28.
NoteWhen exporting content, it is important to remember that folder structure is exported as well. For example, a folder named “Practice” contains three question lists. If a question list from “Practice” is exported, a folder “Practice” is created and the exported question list will be inside the folder.
TipDrag and drop files and folders directly under the Content tab.
TipSelect more than one file by holding down the Shift or Control keys.
TurningPoint User Guide 31
Managing Content
Deleting Content
To delete content from TurningPoint, follow the steps below.
How to delete content from TurningPoint...
1 Select the Content tab.
2 Select a content item.
3 Click Content and select Delete.
A confirmation window is displayed.
4 Click Delete.
5 Alternatively, select a content item and press the Delete key on the keyboard or right-click to delete.
Refreshing Folder Content
The refresh option allows the user to update the display of content if changes to the content folders have been made outside of TurningPoint on the local computer.
How to refresh folder content...
1 Select the Content tab.
2 Click Folder and select Refresh.
Any changes that were made in the folder structure of the content outside of TurningPoint will now be displayed.
TurningPoint User Guide 32
Question Lists
Question ListsA question list is a file that contains questions and answers. For Anywhere Polling and Self-Paced Polling, content is created through question lists. PowerPoint Polling can also utilize question lists; however, the traditional way of creating content in a PowerPoint presentation remains the same. A single question list can be used to poll in all environments on both PC and Mac.
Question lists and answer keys created with previous versions of Turning Technologies products can be imported into TurningPoint. For more information, see Importing Content on page 30.
This section covers the following topics:
• Creating a New Question List
• Question Types and Options
• Editing Question List Content
• Updating Question Preferences within the Question List Editor
• Importing Questions Into a Question List
• Applying New Question List Preferences to Existing Questions
• Printing a Question List
• Versions for Self-Paced Polling
Creating a New Question List
A question list can be used for PowerPoint Polling, Anywhere Polling and Self-Paced Polling. When creating a question list, the preferences can be saved and used as a template for future question lists.
How to create a new question list...
1 Select the Content tab.
2 Click Content, mouse over New and select Question List.
NoteFor more information on creating a PowerPoint presentation as content, see Content in Chapter 5: PowerPoint Polling on page 111.
TurningPoint User Guide 33
Question Lists
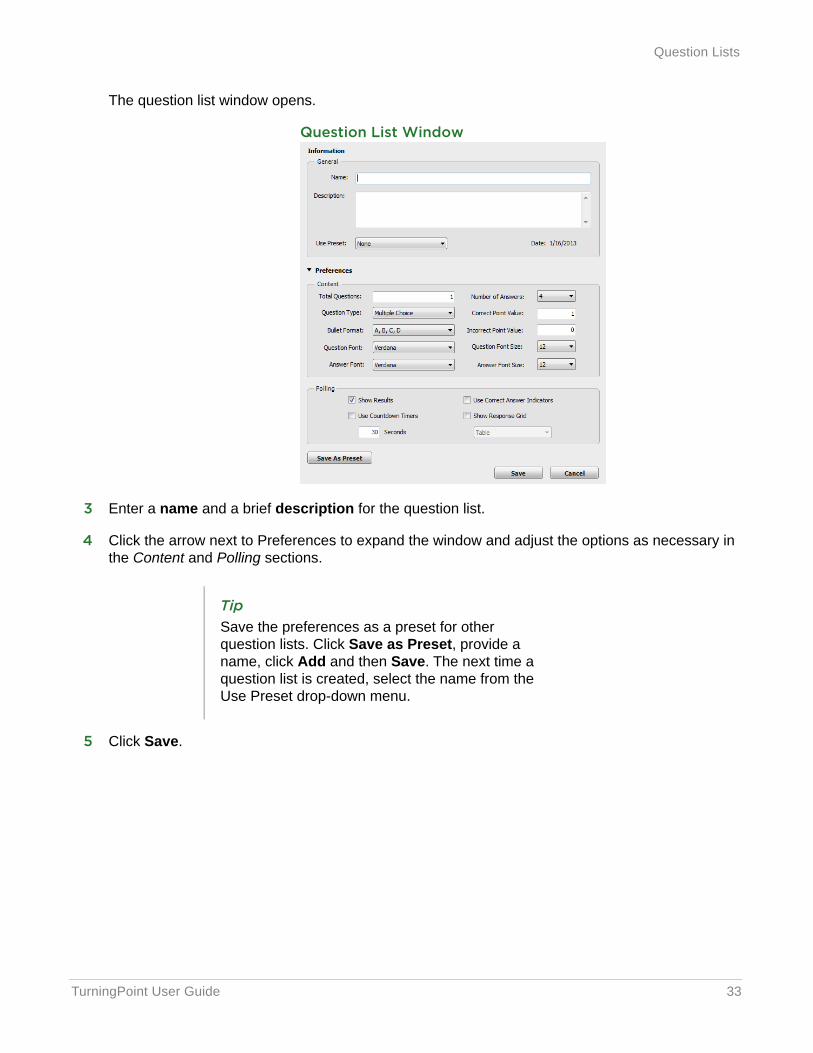
The question list window opens.
Question List Window
3 Enter a name and a brief description for the question list.
4 Click the arrow next to Preferences to expand the window and adjust the options as necessary in the Content and Polling sections.
5 Click Save.
TipSave the preferences as a preset for other question lists. Click Save as Preset, provide a name, click Add and then Save. The next time a question list is created, select the name from the Use Preset drop-down menu.
TurningPoint User Guide 34
Question Lists
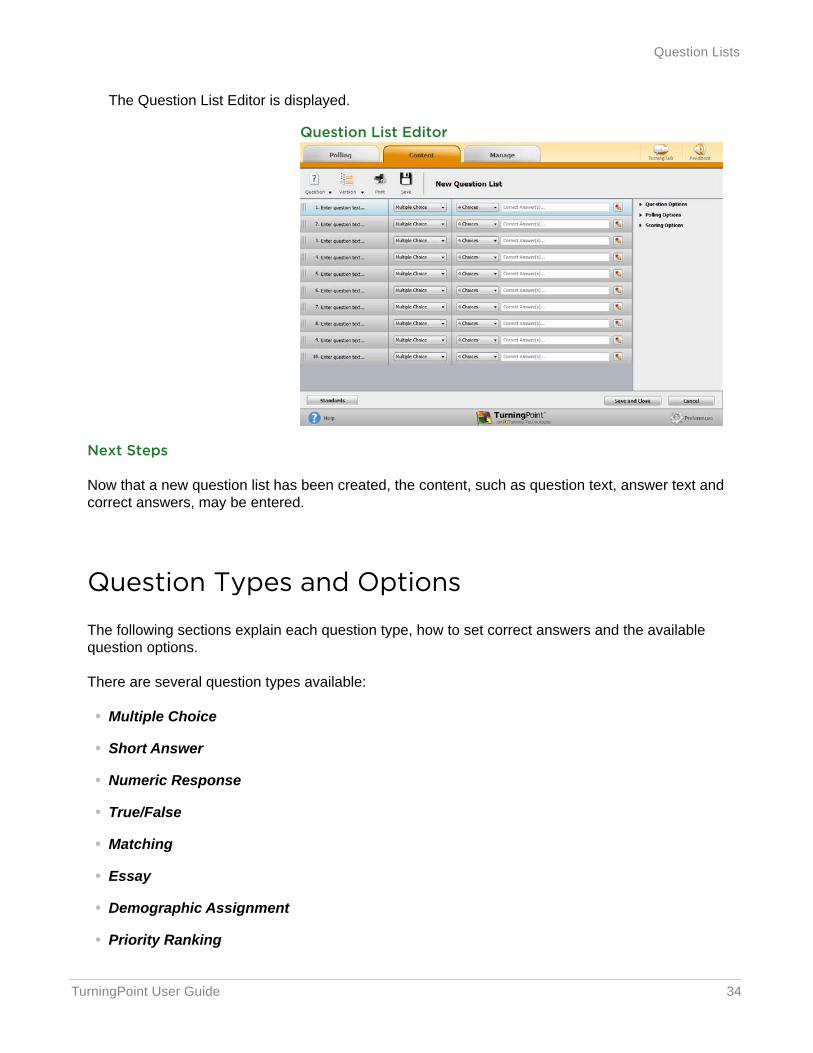
The Question List Editor is displayed.
Question List Editor
Next Steps
Now that a new question list has been created, the content, such as question text, answer text and correct answers, may be entered.
Question Types and Options
The following sections explain each question type, how to set correct answers and the available question options.
There are several question types available:
• Multiple Choice
• Short Answer
• Numeric Response
• True/False
• Matching
• Essay
• Demographic Assignment
• Priority Ranking
TurningPoint User Guide 35
Question Lists
Multiple Choice
A multiple choice question may have up to 10 answer options.
Prerequisites
A new question list must be created or opened for editing. To open a question list for editing, select the Content tab, select a question list and click Edit Question List on the Question List Overview screen.
How to assign multiple choice question options...
1 Select a question from the question list.
2 Select Multiple Choice from the question type drop-down menu.
3 Select the number of possible answer choices from the choices drop-down menu.
4 Enter the correct answer in the box provided.
5 Adjust the Question, Polling and Scoring Options as necessary.
Question Options
• Anonymous - A slide marked anonymous does not track participant list information when polling.
• Bullet Format - The bullet format for the answer choices can be changed from the drop-down menu.
• Multiple Responses - Multiple responses allow participants to send more than one response to a question. When this box is checked the following options may be set: Response Limit, Allow Duplicates and All or Nothing Scoring.
Polling Options
• Show Results - When checked, the chart is displayed after polling.
• First Response Only - When checked, TurningPoint only accepts the first response sent by each participant.
NoteEach correct answer choice needs to be separated by a semicolon. For example, “a; c; d”.Correct answers may also be assigned by selecting Correct from the drop-down menu next to the answer choice bullet in the scoring options.
TurningPoint User Guide 36
Question Lists
• Correct Answer Indicator - A correct answer indicator allows participants to view the correct answer(s) after polling has been closed.
• Countdown Timer - A countdown timer provides participants with a visual cue that polling is about to close as it counts down to zero. When the countdown expires, the countdown timer disappears and polling is automatically closed.
• Response Grid - A response grid displays participant names by default. As participants respond, the corresponding box changes color. If polling with an auto list, it is recommended to change the response grid text to Device ID Only. As participants respond, a Device ID appears in the box.
Scoring Options
• Correct Point Value - The point value of the correct answer(s) can be set by entering a value in the box provided.
• Incorrect Point Value - The point value of the incorrect answer(s) can be set by entering a value in the box provided.
• Speed Scoring - When checked, point values will decrease relative to the time polling is kept open.
• Show Advanced Scoring - When checked, the answer value and the point value are both displayed. The point value can be changed by entering a new value in the box provided.
Next Steps
Now that the question type and options have been defined, the question and answer text may be edited. For more information, see Editing Question List Content on page 46.
Short Answer
A short answer question requires the participants to respond with a phrase. Only participants using a ResponseCard XR, ResponseCard NXT or ResponseWare may respond to a short answer question.
NoteA short answer response can have up to 160 characters in the PowerPoint and Anywhere Polling environments. In the Self-Paced Polling environment, a short answer response can have up to 16 characters.
TurningPoint User Guide 37
Question Lists
Prerequisites
A new question list must be created or opened for editing. To open a question list for editing, select the Content tab, select a question list and click Edit Question List on the Question List Overview screen.
How to assign short answer question options...
1 Select a question from the question list.
2 Select Short Answer from the question type drop-down menu.
3 Enter a keyword(s) for the correct answer in the box provided.
Multiple keywords should be separated with a semicolon.
4 Adjust the Question, Polling and Scoring Options as necessary.
Question Options
• Anonymous - A question marked anonymous does not track participant list information when polling.
Polling Options
• Show Results - When checked, the chart is displayed after polling is closed.
• First Response Only - When checked, TurningPoint only accepts the first response sent by each participant.
• Show Correct Keyword - After polling closes, the correct keyword(s) is displayed on the slide.
• Countdown Timer - A countdown timer provides participants with a visual cue that polling is about to close as it counts down to zero. When the countdown expires, the countdown timer disappears and polling is automatically closed.
• Response Grid - A response grid displays participant names by default. As participants respond, the corresponding box changes color. If polling with an auto list, it is recommended to change the response grid text to Device ID Only. As participants respond, a Device ID appears in the box.
NoteThe following symbols are supported:ResponseCard NXT as of firmware version 1.0.1. , ‘ “ ? @ # $ % ^ & * ( ) _ + - = / < > [ ] { } £ € EResponseCard XR as of firmware version 1.2.1. , + - * / % ( ) ^ @ ! & E €
TurningPoint User Guide 38
Question Lists
Scoring Options
• Correct Point Value - The point value of the correct answer(s) can be set by entering a value in the box provided.
• Incorrect Point Value - The point value of the incorrect answer(s) can be set by entering a value in the box provided.
• Speed Scoring - When checked, point values will decrease relative to the time polling is kept open.
• Answer Value - The answer value can be set by selecting “Correct” or “No Value” from the drop-down box.
• Correct Keyword(s) - Multiple keywords should be separated with a semicolon.
• Enforce Capitalization - When checked, the participant response must have proper capitalization to receive credit.
Numeric Response
A numeric response question requires the participants to respond with a numeric value. Only participants using a ResponseCard XR, ResponseCard NXT or ResponseWare may respond to a numeric response question.
Prerequisites
A new question list must be created or opened for editing. To open a question list for editing, select the Content tab, select a question list and click Edit Question List on the Question List Overview screen.
How to assign numeric response question options...
1 Select a question from the question list.
2 Select Numeric Response from the question type drop-down menu.
3 Enter a value for the correct answer in the box provided.
4 Optionally, enter a minimum and maximum value in the boxes provided. All responses within this range will be marked correct.
5 Adjust the Question, Polling and Scoring Options as necessary.
NoteA numeric response can have up to 16 characters in all three environments.
TurningPoint User Guide 39
Question Lists
Question Options
• Anonymous - A question marked anonymous does not track participant list information when polling.
Polling Options
• Show Results - When checked, the chart is displayed either polling is closed.
• First Response Only - When checked, TurningPoint only accepts the first response sent by each participant.
• Show Correct Answer - After polling closes, the correct answer is displayed on the slide.
• Countdown Timer - A countdown timer provides participants with a visual cue that polling is about to close as it counts down to zero. When the countdown expires, the countdown timer disappears and polling is automatically closed.
• Response Grid - A response grid displays participant names by default. As participants respond, the corresponding box changes color. If polling with an auto list, it is recommended to change the response grid text to Device ID Only. As participants respond, a Device ID appears in the box.
Scoring Options
• Correct Point Value - The point value of the correct answer(s) can be set by entering a value in the box provided.
• Incorrect Point Value - The point value of the incorrect answer(s) can be set by entering a value in the box provided.
• Speed Scoring - When checked, point values will decrease relative to the time polling is kept open.
• Answer Value - The answer value can be set by selecting “Correct” or “No Value” from the drop-down box.
• Acceptable Value - Enter a specific value in the box provided.
• Acceptable Range - If a specific value is not required for a correct answer, a range can be set. Enter a minimum value and a maximum value in the boxes provided.
Next Steps
Now that the question type values have been defined, the question text may be edited. For more information, see Editing Question List Content on page 46.

TurningPoint User Guide 40
Question Lists
True/False
A true/false question requires participants to respond with 1/A for true or 2/B for false.
Prerequisites
A new question list must be created or opened for editing. To open a question list for editing, select the Content tab, select a question list and click Edit Question List on the Question List Overview screen.
How to assign true/false question options...
1 Select a question from the question list.
2 Select True/False from the question type drop-down menu.
3 Select True, False or No Correct as the correct answer.
4 Adjust the Question, Polling and Scoring Options as necessary.
Question Options
• Anonymous - A question marked anonymous does not track participant list information when polling.
• Bullet Format - The bullet format for the answer choices can be changed from the drop-down menu.
Polling Options
• Show Results - When checked, the chart is displayed after polling is closed.
• First Response Only - When checked, TurningPoint only accepts the first response sent by each participant.
• Correct Answer Indicator - A correct answer indicator allows participants to view the correct answer(s) after polling has been closed.
• Countdown Timer - A countdown timer provides participants with a visual cue that polling is about to close as it counts down to zero. When the countdown expires, the countdown timer disappears and polling is automatically closed.
• Response Grid - A response grid displays participant names by default. As participants respond, the corresponding box changes color. If polling with an auto list, it is recommended to change the response grid text to Device ID Only. As participants respond, a Device ID appears in the box.
TurningPoint User Guide 41
Question Lists
Scoring Options
• Correct Point Value - The point value of the correct answer(s) can be set by entering a value in the box provided.
• Incorrect Point Value - The point value of the incorrect answer(s) can be set by entering a value in the box provided.
• Speed Scoring - When checked, point values will decrease relative to the time polling is kept open.
• Select True or False as the correct answer. A value of No Correct can also be selected if there is no correct answer.
Next Steps
Now that the question type and options have been defined, the question and answer text may be edited. For more information, see Editing Question List Content on page 46.
Matching
Matching questions may have up to 10 answer choices. To set up a matching question, a list of matches is paired with a list of choices. Participants submit the choices in the order they correspond to the matches.
Prerequisites
A new question list must be created or opened for editing. To open a question list for editing, select the Content tab, select a question list and click Edit Question List on the Question List Overview screen.
How to assign matching question options...
1 Select a question from the question list.
2 Select Matching from the question type drop-down menu.
3 Select the number of matches from the matches drop-down menu.
4 Select the number of choices from the choices drop-down menu.
NoteMatching questions are not supported in the PowerPoint Polling environment.
TurningPoint User Guide 42
Question Lists
5 Enter the correct answers in the box provided.
6 Adjust the Question, Polling and Scoring Options as necessary.
Question Options
• Anonymous - A question marked anonymous does not track participant list information when polling.
• Bullet Format - The bullet format for the answer choices can be changed from the drop-down menu.
• All or Nothing Scoring - When checked, the participant must choose each correct answer to receive points.
Polling Options
• Show Results - When checked, the chart is displayed after polling is closed.
• Countdown Timer - A countdown timer provides participants with a visual cue that polling is about to close as it counts down to zero. When the countdown expires, the countdown timer disappears and polling is automatically closed.
• Response Grid - A response grid displays participant names by default. As participants respond, the corresponding box changes color. If polling with an auto list, it is recommended to change the response grid text to Device ID Only. As participants respond, a Device ID appears in the box.
Scoring Options
• Correct Point Value - The point value of the correct answer(s) can be set by entering a value in the box provided.
• Incorrect Point Value - The point value of the incorrect answer(s) can be set by entering a value in the box provided.
• Speed Scoring - When checked, point values will decrease relative to the time polling is kept open.
• Show Advanced Scoring - When checked, the answer value and the point value are both displayed. The point value can be changed by entering a new value in the box provided.
Next Steps
Now that the question type and options have been defined, the question and answer text may be edited. For more information, see Editing Question List Content on page 46.
NoteEach correct answer choice needs to be separated by a semicolon. For example, “a; c; d”.Correct answers may also be assigned by selecting the correct answer choices that corresponds to the matched item.
TurningPoint User Guide 43
Question Lists
Essay
Only participants using a ResponseCard XR, ResponseCard NXT or ResponseWare may respond to an essay question.
Prerequisites
A new question list must be created or opened for editing. To open a question list for editing, select the Content tab, select a question list and click Edit Question List on the Question List Overview screen.
How to assign essay question options...
1 Select a question from the question list.
2 Select Essay from the question type drop-down menu.
3 Adjust the Question and Polling Options as necessary.
Question Options
• Anonymous - A question marked anonymous does not track participant list information when polling.
Polling Options
• First Response Only - When checked, TurningPoint only accepts the first response sent by each participant.
• Countdown Timer - A countdown timer provides participants with a visual cue that polling is about to close as it counts down to zero. When the countdown expires, the countdown timer disappears and polling is automatically closed.
• Response Grid - A response grid displays participant names by default. As participants respond, the corresponding box changes color. If polling with an auto list, it is recommended to change the response grid text to Device ID Only. As participants respond, a Device ID appears in the box.
Scoring Options
• TurningPoint does not score essay slides. Manual score adjustments can be made in Results Manager.
Next Steps
Now that the question type has been defined, the question text may be edited. For more information, see Editing Question List Content on page 46.
NoteAn essay response can have up to 160 characters in all three environments.
TurningPoint User Guide 44
Question Lists
Demographic Assignment
A demographic assignment question may have up to 10 answer choices. A demographic assignment question can also be used to assign participants to teams for competitions.
Prerequisites
A new question list must be created or opened for editing. To open a question list for editing, select the Content tab, select a question list and click Edit Question List on the Question List Overview screen.
How to assign demographic assignment question options...
1 Select a question from the question list.
2 Select Demographic Assignment from the question type drop-down menu.
3 Select the number of possible answer choices from the choices drop-down menu.
4 Adjust the Question and Polling Options as necessary.
Demographic Options
• Demographic Grouping - Categorize the demographic options for easier reporting.
• Use in Competition - The answer options become teams and can be used in team competitions. When unchecked, the slide is no longer considered a Team Assignment slide.
• Save to Participant List - The competition information is saved to the current participant list.
Question Options
• Bullet Format - The bullet format for the answer choices can be changed from the drop-down menu.
Polling Options
• Show Results - When checked, the chart is displayed after polling is closed.
• First Response Only - When checked, TurningPoint only accepts the first response sent by each participant.
• Countdown Timer - A countdown timer provides participants with a visual cue that polling is about to close as it counts down to zero. When the countdown expires, the countdown timer disappears and polling is automatically closed.
• Response Grid - A response grid displays participant names by default. As participants respond, the corresponding box changes color. If polling with an auto list, it is recommended to change the response grid text to Device ID Only. As participants respond, a Device ID appears in the box.
Next Steps
Now that the question type has been defined, the question and answer text may be edited. For more information, see Editing Question List Content on page 46.
TurningPoint User Guide 45
Question Lists
Priority Ranking
Priority ranking questions may have up to 10 answer choices. Items are ranked by the participants and then scored based on response weights.
Prerequisites
A new question list must be created or opened for editing. To open a question list for editing, select the Content tab, select a question list and click Edit Question List on the Question List Overview screen.
How to assign priority ranking question options...
1 Select a question from the question list.
2 Select Priority Ranking from the question type drop-down menu.
3 Select the number of choices and number of responses from the drop-down menus.
4 Adjust the Question, Polling and Scoring Options as necessary.
Question Options
• Anonymous - A question marked anonymous does not track participant list information when polling.
• Bullet Format - The bullet format for the answer choices can be changed from the drop-down menu.
• Response Limit - The Response Limit dictates the number of answer choices a participant can select for a specific question.
• Allow Duplicates - When checked, participants are permitted to select the same answer choice more than once.
• Response Weights - Set the value for each response by selecting a value from the drop-down menu or enter a value from 0 to 99999. Repeat for the remaining answers.
Polling Options
• Show Results - When checked, the chart is displayed after polling is closed.
• Countdown Timer - A countdown timer provides participants with a visual cue that polling is about to close as it counts down to zero. When the countdown expires, the countdown timer disappears and polling is automatically closed.
• Response Grid - A response grid displays participant names by default. As participants respond, the corresponding box changes color. If polling with an auto list, it is recommended to change the response grid text to Device ID Only. As participants respond, a Device ID appears in the box.
Next Steps
Now that the question type and options have been defined, the question and answer text may be edited. For more information, see Editing Question List Content on page 46.
TurningPoint User Guide 46
Question Lists
Editing Question List Content
Now that a question list has been created, question and answer text, question options, scoring options and polling options can be assigned. The HTML Editor allows for advanced formatting of pictures, special characters, subscripts, superscripts and hyperlinks. Questions can also be added, deleted or duplicated for quick authoring.
Prerequisites
A new question list must be created or opened for editing. To open a question list for editing, select the Content tab, select a question list and click Edit Question List on the Question List Overview screen.
How to edit question list content...
1 Select a question.
2 Select a question type and the corresponding question options from the drop-down menus. For more information on the available question types, see Question Types and Options on page 34.
3 Optionally, set the Question, Scoring and Polling Options in the panel on the right. Click the arrow next to the category to view the available options. For more information, see Question Types and Options on page 34.
4 Click the pencil icon to the right of the question.
NoteFor question lists to be used as answer keys, simply select a question type and assign a correct answer for each question. Question and answer text is not necessary.
NotePolling options do not apply to Self-Paced Polling.
TurningPoint User Guide 47
Question Lists
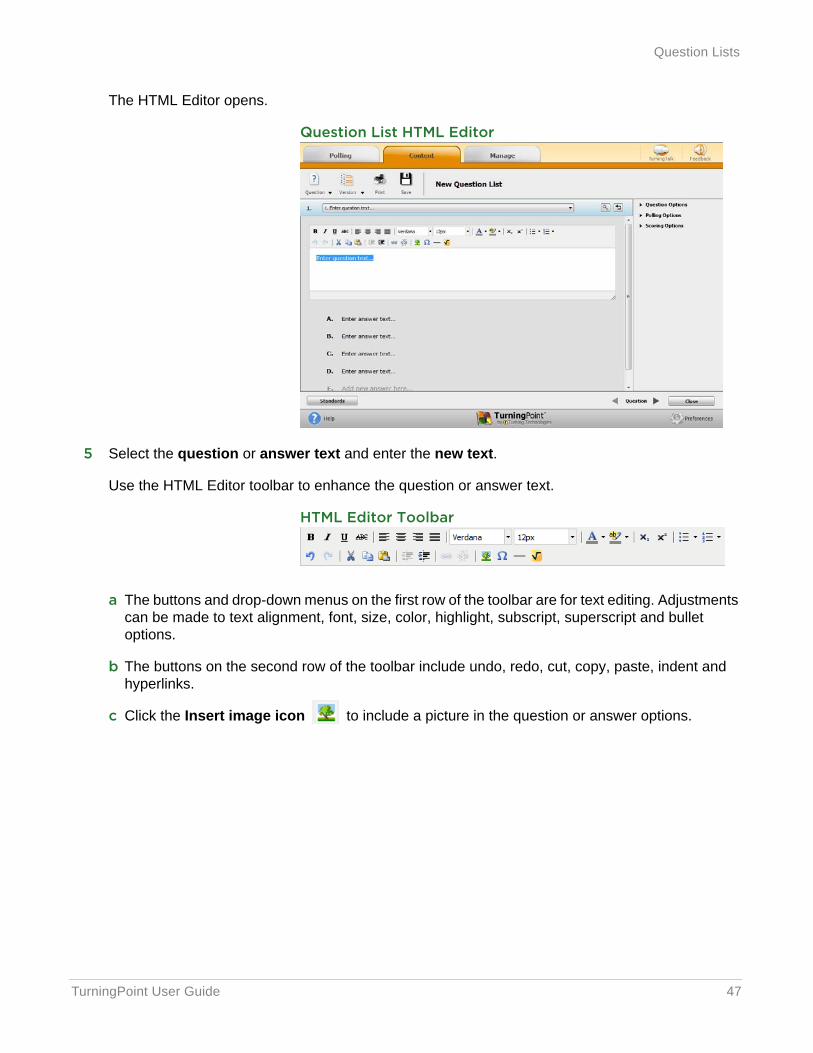
The HTML Editor opens.
Question List HTML Editor
5 Select the question or answer text and enter the new text.
Use the HTML Editor toolbar to enhance the question or answer text.
HTML Editor Toolbar
a The buttons and drop-down menus on the first row of the toolbar are for text editing. Adjustments can be made to text alignment, font, size, color, highlight, subscript, superscript and bullet options.
b The buttons on the second row of the toolbar include undo, redo, cut, copy, paste, indent and hyperlinks.
c Click the Insert image icon to include a picture in the question or answer options.
TurningPoint User Guide 48
Question Lists
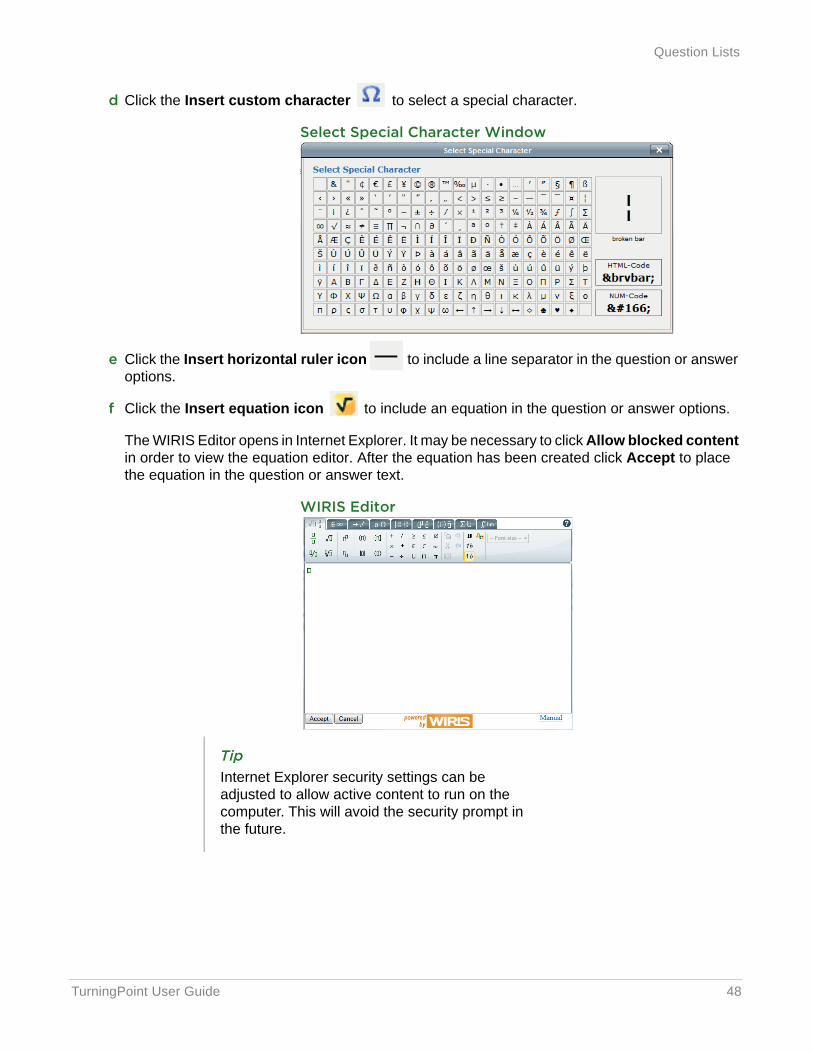
d Click the Insert custom character to select a special character.
Select Special Character Window
e Click the Insert horizontal ruler icon to include a line separator in the question or answer options.
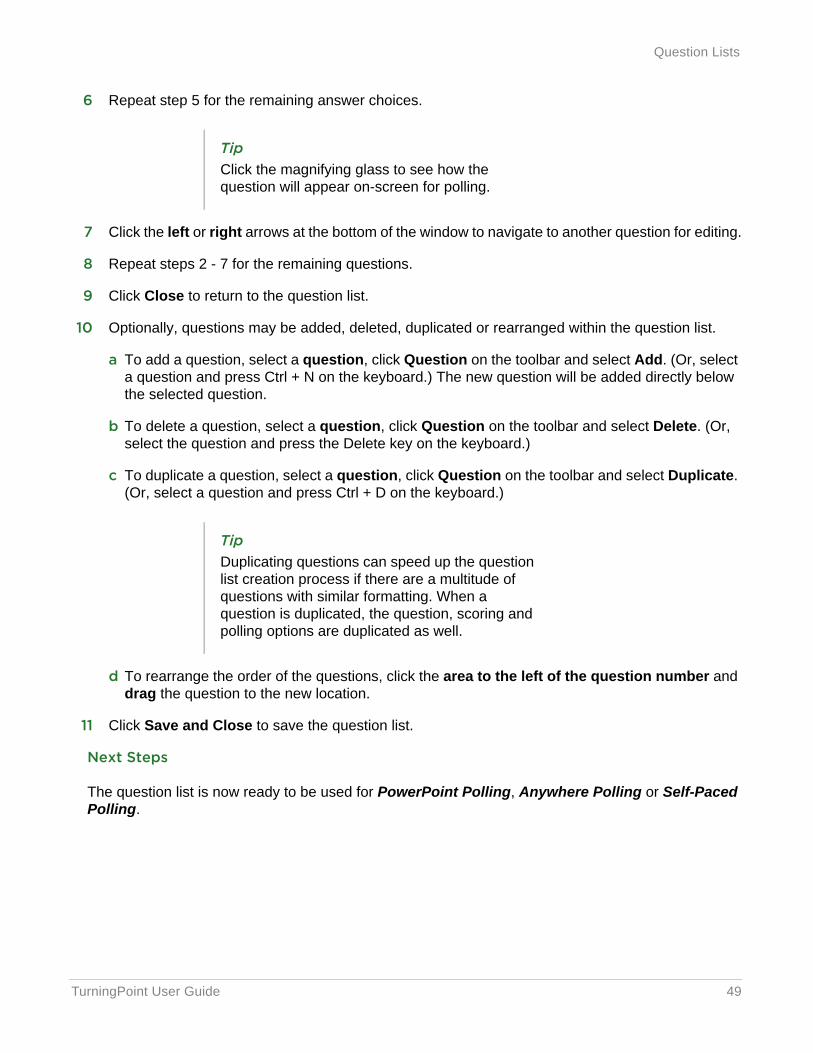
f Click the Insert equation icon to include an equation in the question or answer options.
The WIRIS Editor opens in Internet Explorer. It may be necessary to click Allow blocked content in order to view the equation editor. After the equation has been created click Accept to place the equation in the question or answer text.
WIRIS Editor
TipInternet Explorer security settings can be adjusted to allow active content to run on the computer. This will avoid the security prompt in the future.
TurningPoint User Guide 49
Question Lists
6 Repeat step 5 for the remaining answer choices.
7 Click the left or right arrows at the bottom of the window to navigate to another question for editing.
8 Repeat steps 2 - 7 for the remaining questions.
9 Click Close to return to the question list.
10 Optionally, questions may be added, deleted, duplicated or rearranged within the question list.
a To add a question, select a question, click Question on the toolbar and select Add. (Or, select a question and press Ctrl + N on the keyboard.) The new question will be added directly below the selected question.
b To delete a question, select a question, click Question on the toolbar and select Delete. (Or, select the question and press the Delete key on the keyboard.)
c To duplicate a question, select a question, click Question on the toolbar and select Duplicate. (Or, select a question and press Ctrl + D on the keyboard.)
d To rearrange the order of the questions, click the area to the left of the question number and drag the question to the new location.
11 Click Save and Close to save the question list.
Next Steps
The question list is now ready to be used for PowerPoint Polling, Anywhere Polling or Self-Paced Polling.
TipClick the magnifying glass to see how the question will appear on-screen for polling.
TipDuplicating questions can speed up the question list creation process if there are a multitude of questions with similar formatting. When a question is duplicated, the question, scoring and polling options are duplicated as well.
TurningPoint User Guide 50
Question Lists
Updating Question Preferences within the Question List Editor
A user can update question list preferences after a question list has been saved or imported from older software versions.
Prerequisites
A saved question list is needed.
How to update question preferences within the Question List Editor...
1 Select the Content tab.
2 Select a question list and click Edit Question List.
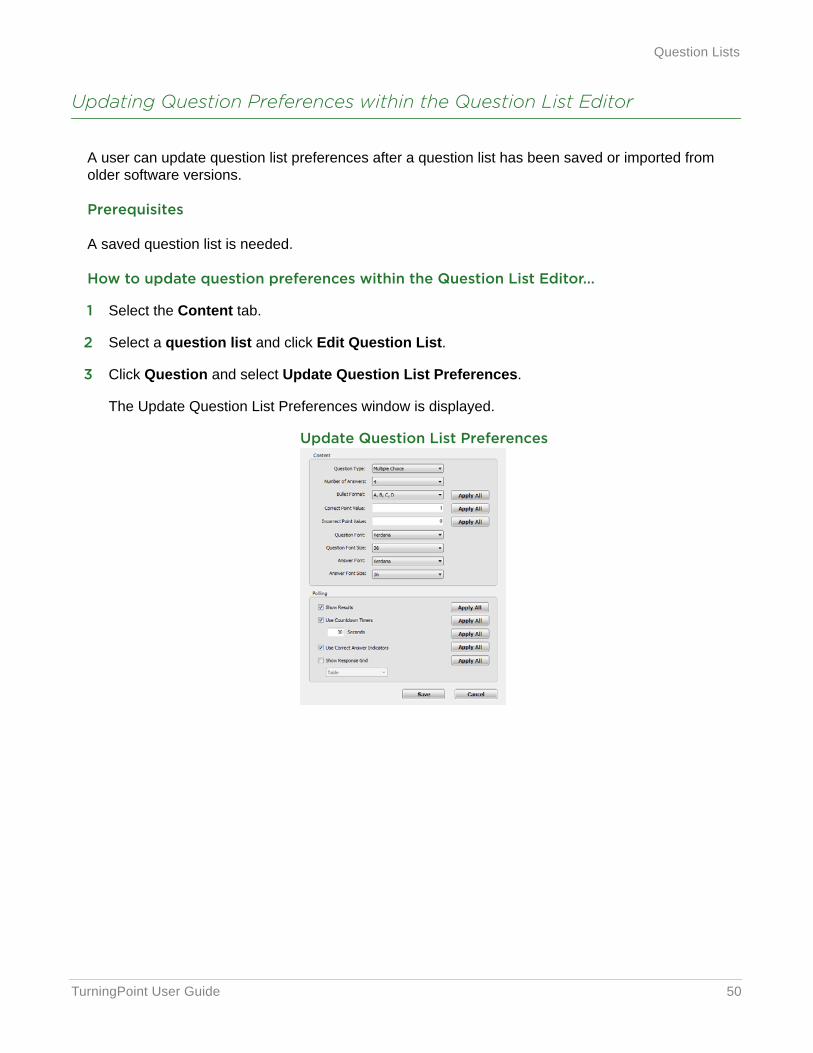
3 Click Question and select Update Question List Preferences.
The Update Question List Preferences window is displayed.
Update Question List Preferences
TurningPoint User Guide 51
Question Lists
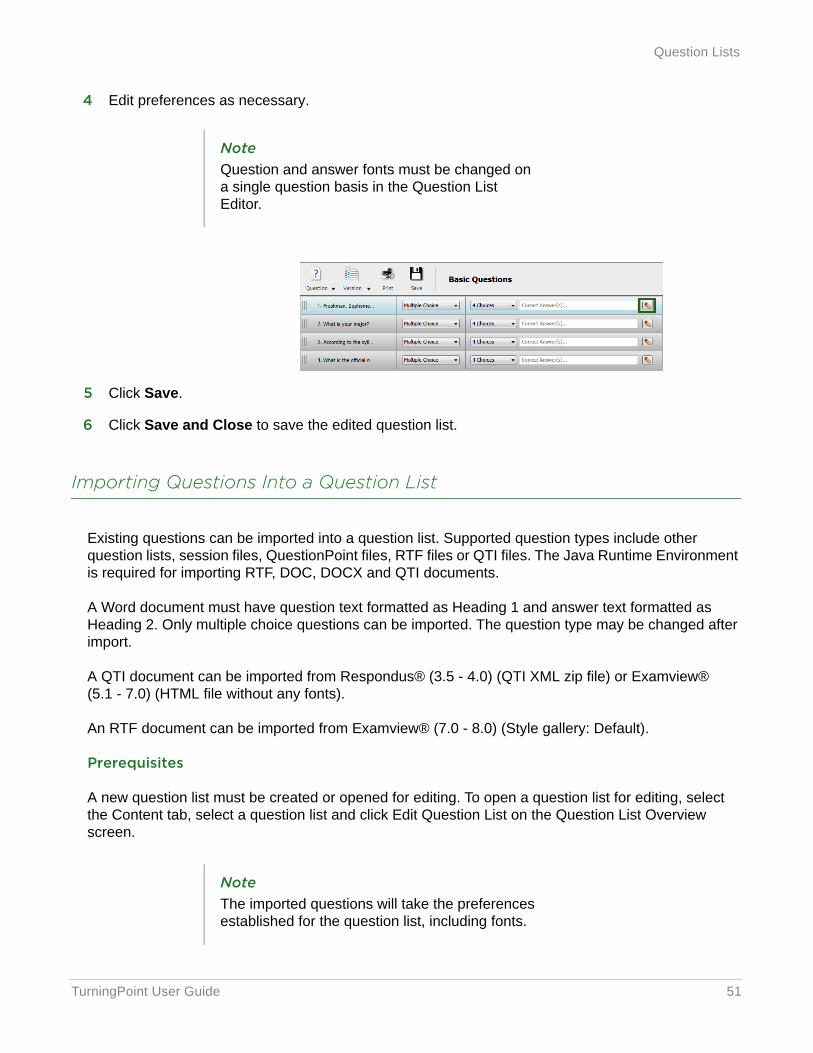
4 Edit preferences as necessary.
5 Click Save.
6 Click Save and Close to save the edited question list.
Importing Questions Into a Question List
Existing questions can be imported into a question list. Supported question types include other question lists, session files, QuestionPoint files, RTF files or QTI files. The Java Runtime Environment is required for importing RTF, DOC, DOCX and QTI documents.
A Word document must have question text formatted as Heading 1 and answer text formatted as Heading 2. Only multiple choice questions can be imported. The question type may be changed after import.
A QTI document can be imported from Respondus® (3.5 - 4.0) (QTI XML zip file) or Examview® (5.1 - 7.0) (HTML file without any fonts).
An RTF document can be imported from Examview® (7.0 - 8.0) (Style gallery: Default).
Prerequisites
A new question list must be created or opened for editing. To open a question list for editing, select the Content tab, select a question list and click Edit Question List on the Question List Overview screen.
NoteQuestion and answer fonts must be changed on a single question basis in the Question List Editor.
NoteThe imported questions will take the preferences established for the question list, including fonts.
TurningPoint User Guide 52
Question Lists
How to import questions into a question list...
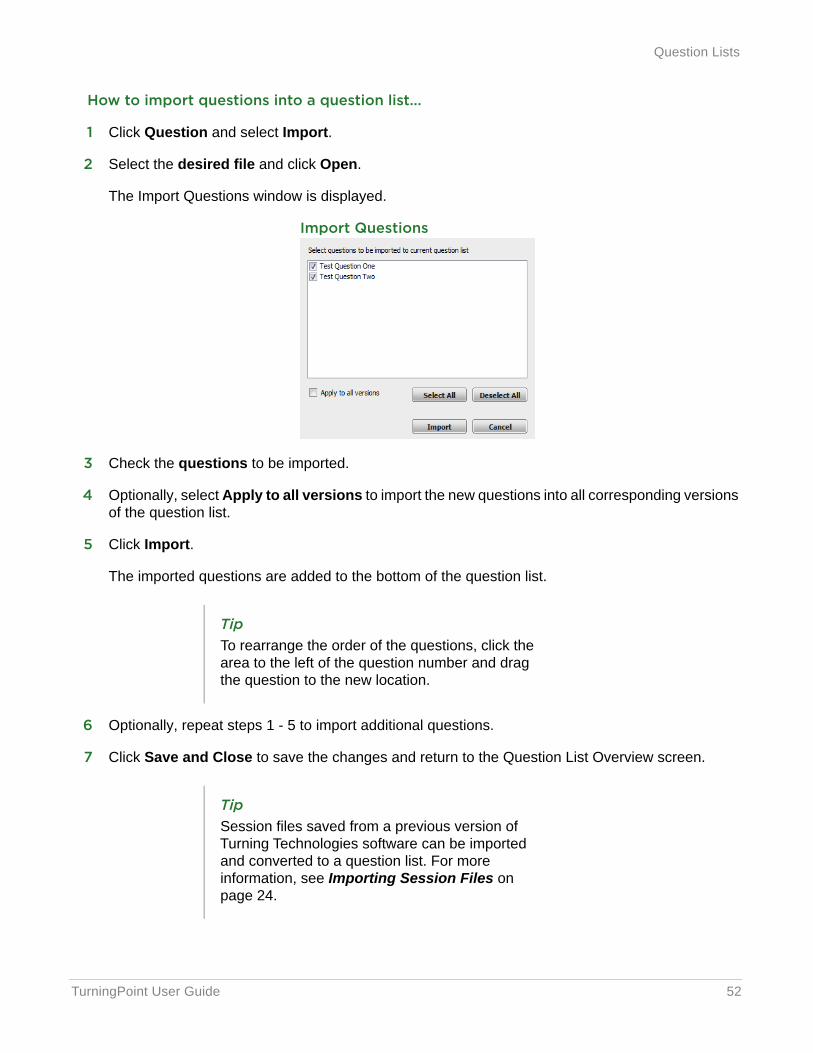
1 Click Question and select Import.
2 Select the desired file and click Open.
The Import Questions window is displayed.
Import Questions
3 Check the questions to be imported.
4 Optionally, select Apply to all versions to import the new questions into all corresponding versions of the question list.
5 Click Import.
The imported questions are added to the bottom of the question list.
6 Optionally, repeat steps 1 - 5 to import additional questions.
7 Click Save and Close to save the changes and return to the Question List Overview screen.
TipTo rearrange the order of the questions, click the area to the left of the question number and drag the question to the new location.
TipSession files saved from a previous version of Turning Technologies software can be imported and converted to a question list. For more information, see Importing Session Files on page 24.
TurningPoint User Guide 53
Question Lists
Applying New Question List Preferences to Existing Questions
Preference changes can be applied to an existing saved question list.
Prerequisites
A saved question list from a legacy version of TurningPoint or a question list created by another user is needed.
How to apply new question list preferences to existing questions...
1 Click Content, mouse over New and select Question List.
2 Name the Question List.
3 Adjust the Preferences and Polling sections as needed.
4 Click Save.
5 Click Question and select Import.
6 Select the desired file and click Open.
7 Check the questions to be imported.
8 Click Import.
9 Click Save and Close to save the changes and return to the Question List Overview screen.
Printing a Question List
There are three printing options available when printing a question list:
• Student Copy - The student copy contains the question and answer choices.
• Teacher Copy - The teacher copy contains all of the question and answer choices along with the correct answers and standards (if applicable).
• Answer Key - The answer key contains the correct answers.
Prerequisites
A question list must be open. If a question list is not open, select the Content tab, select a question list and click Edit Question List on the Question List Overview screen.
TurningPoint User Guide 54
Question Lists
How to print a question list...
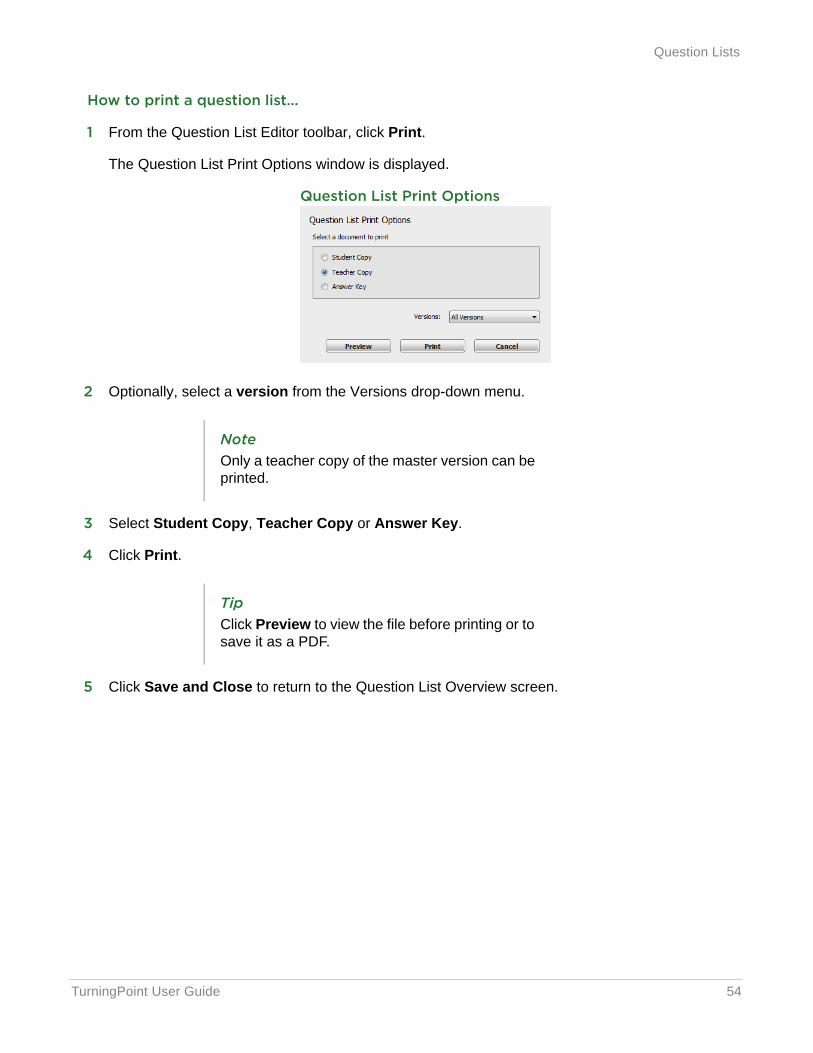
1 From the Question List Editor toolbar, click Print.
The Question List Print Options window is displayed.
Question List Print Options
2 Optionally, select a version from the Versions drop-down menu.
3 Select Student Copy, Teacher Copy or Answer Key.
4 Click Print.
5 Click Save and Close to return to the Question List Overview screen.
NoteOnly a teacher copy of the master version can be printed.
TipClick Preview to view the file before printing or to save it as a PDF.
TurningPoint User Guide 55
Question Lists
Versions for Self-Paced Polling
The Self-Paced Polling environment can accommodate multiple versions of a question list. A master list is generated which allows for quick editing that is reflected in all versions of the question list.
The following topics are covered in this section:
• Adding a Version
• Editing a Version
• Renaming a Version
• Deleting a Version
Adding a Version
Question lists can be generated into different versions for Self-Paced Polling. A master list of the question list is generated for quick editing of the question and answer choices.
Prerequisites
A question list must be open. If a question list is not open, select the Content tab, select a question list and click Edit Question List on the Question List Overview screen.
How to add a version to a question list...
1 Click Version and select Add.
NoteA master list is NOT a separate, testable version of the question list.
NoteVersions containing more than 250 questions cannot be used for Self-Paced Polling.
TurningPoint User Guide 56
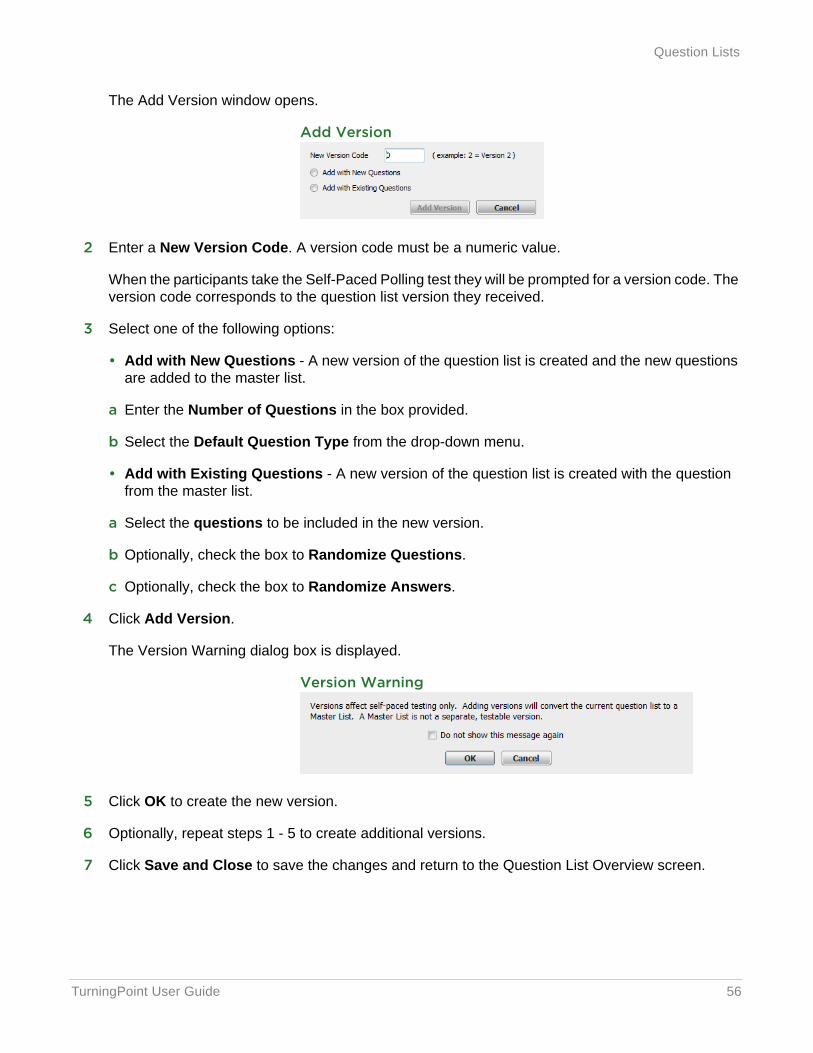
Question Lists
The Add Version window opens.
Add Version
2 Enter a New Version Code. A version code must be a numeric value.
When the participants take the Self-Paced Polling test they will be prompted for a version code. The version code corresponds to the question list version they received.
3 Select one of the following options:
• Add with New Questions - A new version of the question list is created and the new questions are added to the master list.
a Enter the Number of Questions in the box provided.
b Select the Default Question Type from the drop-down menu.
• Add with Existing Questions - A new version of the question list is created with the question from the master list.
a Select the questions to be included in the new version.
b Optionally, check the box to Randomize Questions.
c Optionally, check the box to Randomize Answers.
4 Click Add Version.
The Version Warning dialog box is displayed.
Version Warning
5 Click OK to create the new version.
6 Optionally, repeat steps 1 - 5 to create additional versions.
7 Click Save and Close to save the changes and return to the Question List Overview screen.
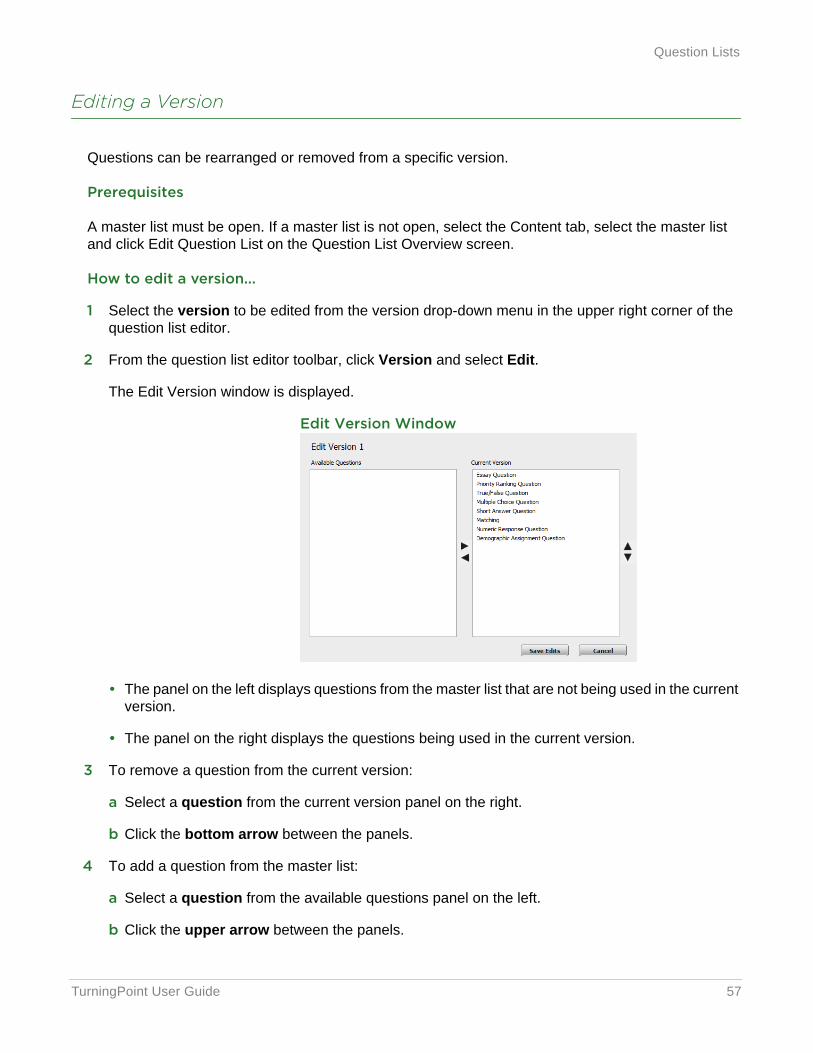
TurningPoint User Guide 57
Question Lists
Editing a Version
Questions can be rearranged or removed from a specific version.
Prerequisites
A master list must be open. If a master list is not open, select the Content tab, select the master list and click Edit Question List on the Question List Overview screen.
How to edit a version...
1 Select the version to be edited from the version drop-down menu in the upper right corner of the question list editor.
2 From the question list editor toolbar, click Version and select Edit.
The Edit Version window is displayed.
Edit Version Window
• The panel on the left displays questions from the master list that are not being used in the current version.
• The panel on the right displays the questions being used in the current version.
3 To remove a question from the current version:
a Select a question from the current version panel on the right.
b Click the bottom arrow between the panels.
4 To add a question from the master list:
a Select a question from the available questions panel on the left.
b Click the upper arrow between the panels.
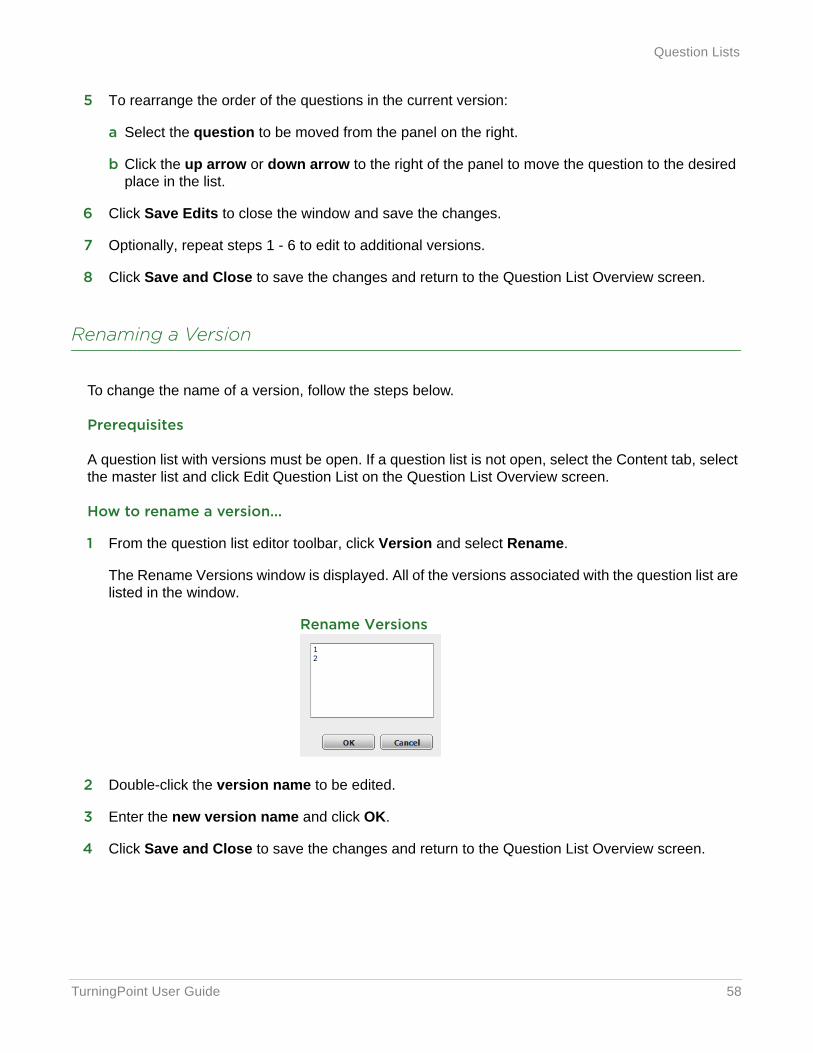
TurningPoint User Guide 58
Question Lists
5 To rearrange the order of the questions in the current version:
a Select the question to be moved from the panel on the right.
b Click the up arrow or down arrow to the right of the panel to move the question to the desired place in the list.
6 Click Save Edits to close the window and save the changes.
7 Optionally, repeat steps 1 - 6 to edit to additional versions.
8 Click Save and Close to save the changes and return to the Question List Overview screen.
Renaming a Version
To change the name of a version, follow the steps below.
Prerequisites
A question list with versions must be open. If a question list is not open, select the Content tab, select the master list and click Edit Question List on the Question List Overview screen.
How to rename a version...
1 From the question list editor toolbar, click Version and select Rename.
The Rename Versions window is displayed. All of the versions associated with the question list are listed in the window.
Rename Versions
2 Double-click the version name to be edited.
3 Enter the new version name and click OK.
4 Click Save and Close to save the changes and return to the Question List Overview screen.
TurningPoint User Guide 59
Question Lists
Deleting a Version
To delete a question list version, follow the steps below. A master list cannot be deleted.
Prerequisites
A question list with versions must be open. If a question list is not open, select the Content tab, select the master list and click Edit Question List on the Question List Overview screen.
How to delete a question list version...
1 Select the version to be edited from the version drop-down menu in the upper right corner of the question list editor.
2 From the question list editor toolbar, click Version and select Delete.
The Delete Version confirmation box is displayed.
3 Click Yes to delete the question list version.
4 Repeat steps 1- 3 to delete additional question list versions.
5 Click Save and Close to return to the Question List Overview screen.
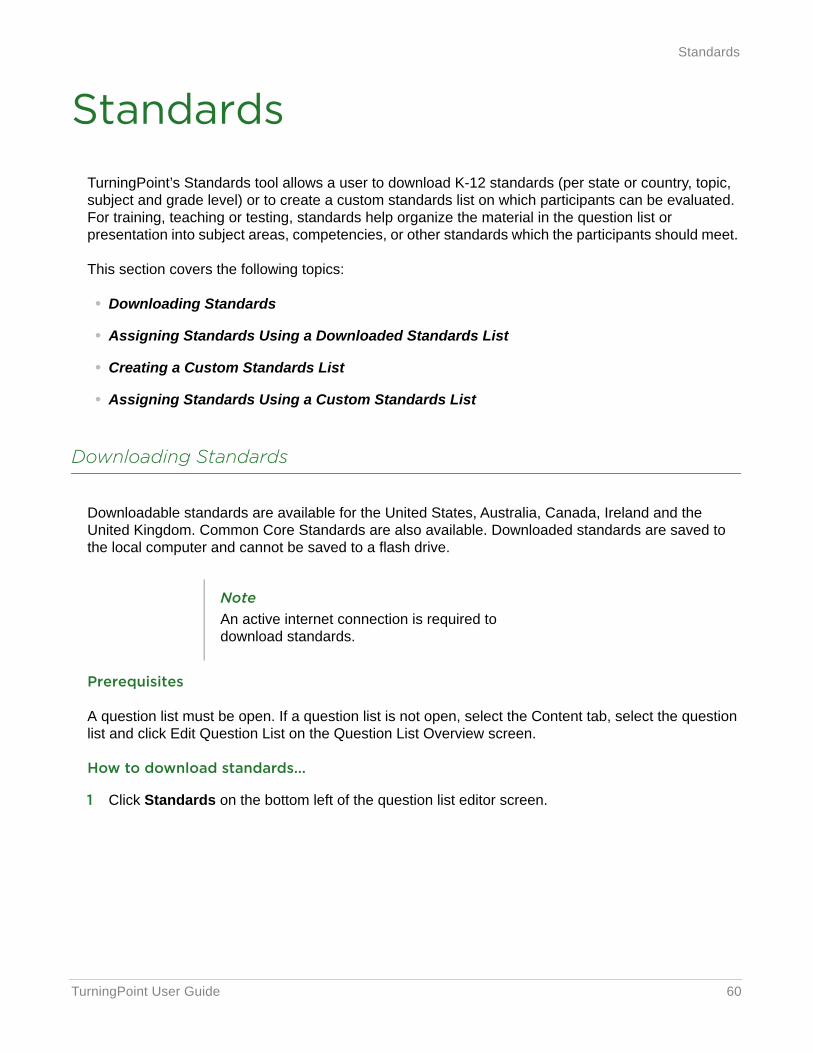
TurningPoint User Guide 60
Standards
StandardsTurningPoint’s Standards tool allows a user to download K-12 standards (per state or country, topic, subject and grade level) or to create a custom standards list on which participants can be evaluated. For training, teaching or testing, standards help organize the material in the question list or presentation into subject areas, competencies, or other standards which the participants should meet.
This section covers the following topics:
• Downloading Standards
• Assigning Standards Using a Downloaded Standards List
• Creating a Custom Standards List
• Assigning Standards Using a Custom Standards List
Downloading Standards
Downloadable standards are available for the United States, Australia, Canada, Ireland and the United Kingdom. Common Core Standards are also available. Downloaded standards are saved to the local computer and cannot be saved to a flash drive.
Prerequisites
A question list must be open. If a question list is not open, select the Content tab, select the question list and click Edit Question List on the Question List Overview screen.
How to download standards...
1 Click Standards on the bottom left of the question list editor screen.
NoteAn active internet connection is required to download standards.
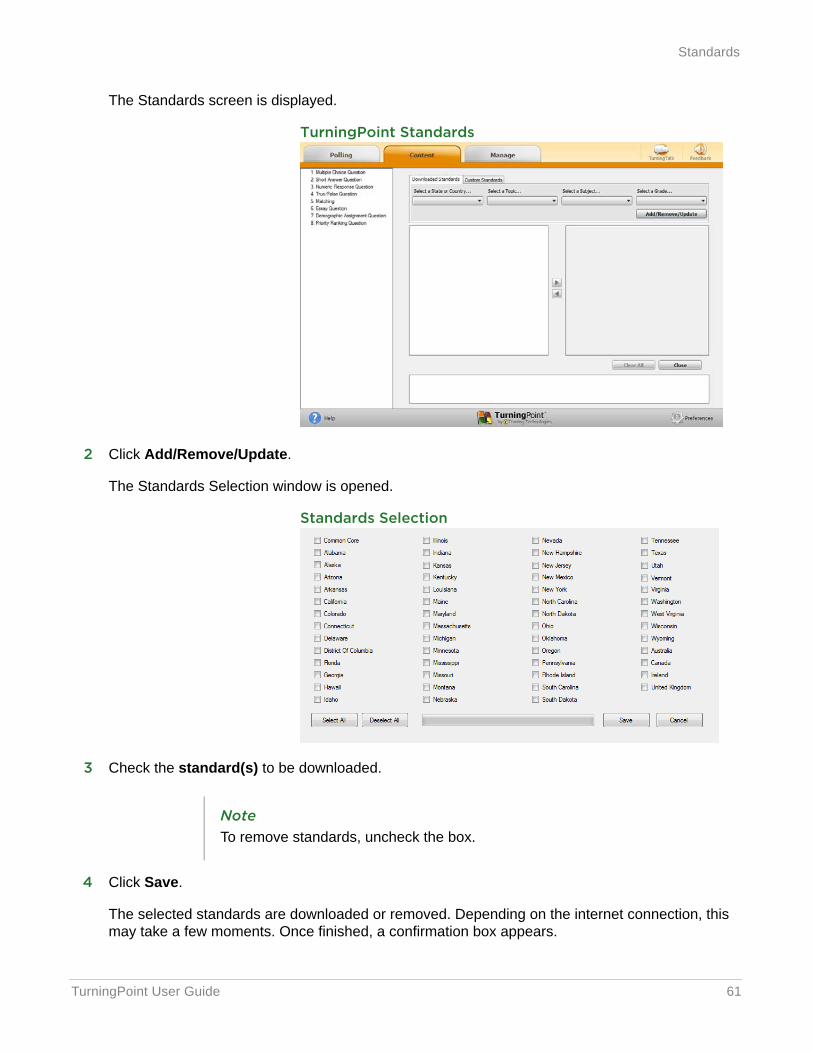
TurningPoint User Guide 61
Standards
The Standards screen is displayed.
TurningPoint Standards
2 Click Add/Remove/Update.
The Standards Selection window is opened.
Standards Selection
3 Check the standard(s) to be downloaded.
4 Click Save.
The selected standards are downloaded or removed. Depending on the internet connection, this may take a few moments. Once finished, a confirmation box appears.
NoteTo remove standards, uncheck the box.
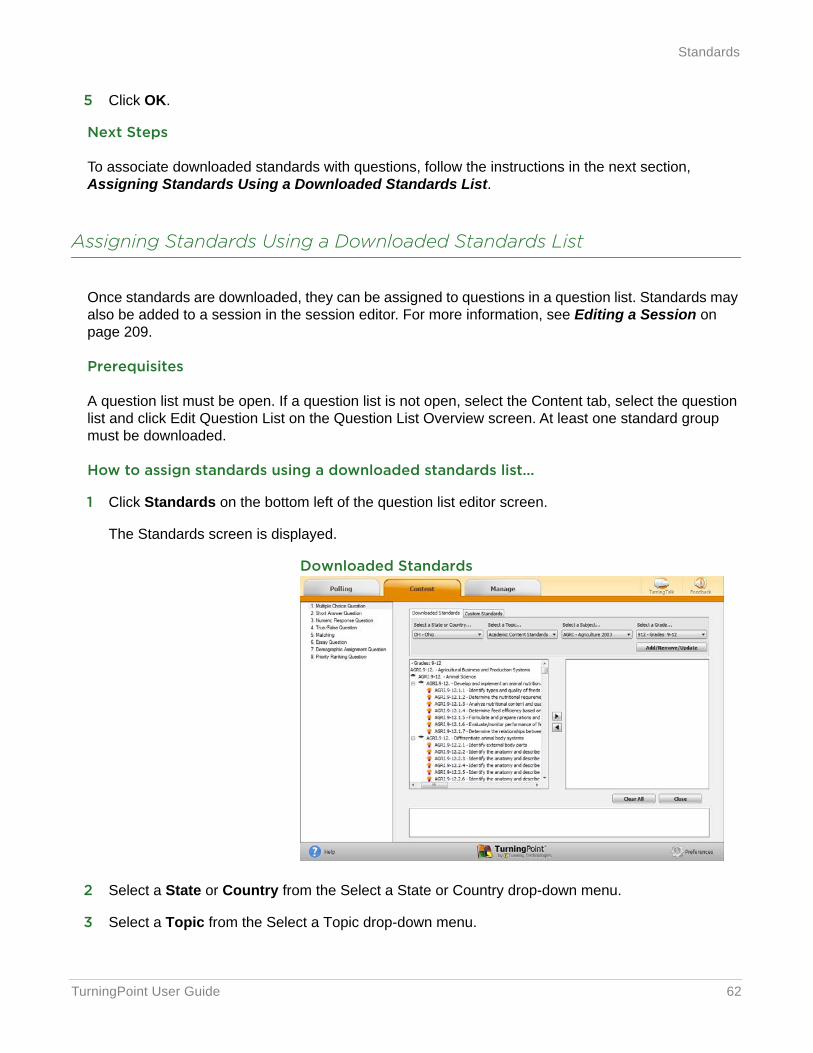
TurningPoint User Guide 62
Standards
5 Click OK.
Next Steps
To associate downloaded standards with questions, follow the instructions in the next section, Assigning Standards Using a Downloaded Standards List.
Assigning Standards Using a Downloaded Standards List
Once standards are downloaded, they can be assigned to questions in a question list. Standards may also be added to a session in the session editor. For more information, see Editing a Session on page 209.
Prerequisites
A question list must be open. If a question list is not open, select the Content tab, select the question list and click Edit Question List on the Question List Overview screen. At least one standard group must be downloaded.
How to assign standards using a downloaded standards list...
1 Click Standards on the bottom left of the question list editor screen.
The Standards screen is displayed.
Downloaded Standards
2 Select a State or Country from the Select a State or Country drop-down menu.
3 Select a Topic from the Select a Topic drop-down menu.
TurningPoint User Guide 63
Standards
4 Select a Subject from the Select a Subject drop-down menu.
5 Select a Grade from the Select a Grade drop-down menu.
All of the standards for the selected state/country, topic, subject and grade are displayed.
6 Select a question from the panel on the left.
7 Select a standard from the list. Double-click the standard to apply it to the selected question.
8 Repeat steps six and seven to assign standards to remaining questions.
9 To remove a standard from a question:
• Select the question and double-click the assigned standard.
• Click Clear All to remove all standards associated with the question.
10 When finished, click Close.
11 Click Save and Close to save the changes and return to the Question List Overview screen.
Creating a Custom Standards List
Custom standards can be created to suit a users specific needs.
Prerequisites
A question list must be open. If a question list is not open, select the Content tab, select the question list and click Edit Question List on the Question List Overview screen.
How to create a custom standards list...
1 Click Standards on the bottom left of the question list editor screen.
NoteTurningPoint will remember these selections for future use.
TipMultiple standards can be selected by holding the Shift key while selecting standards. Multiple questions can also be selected by holding the Shift key while selecting questions.
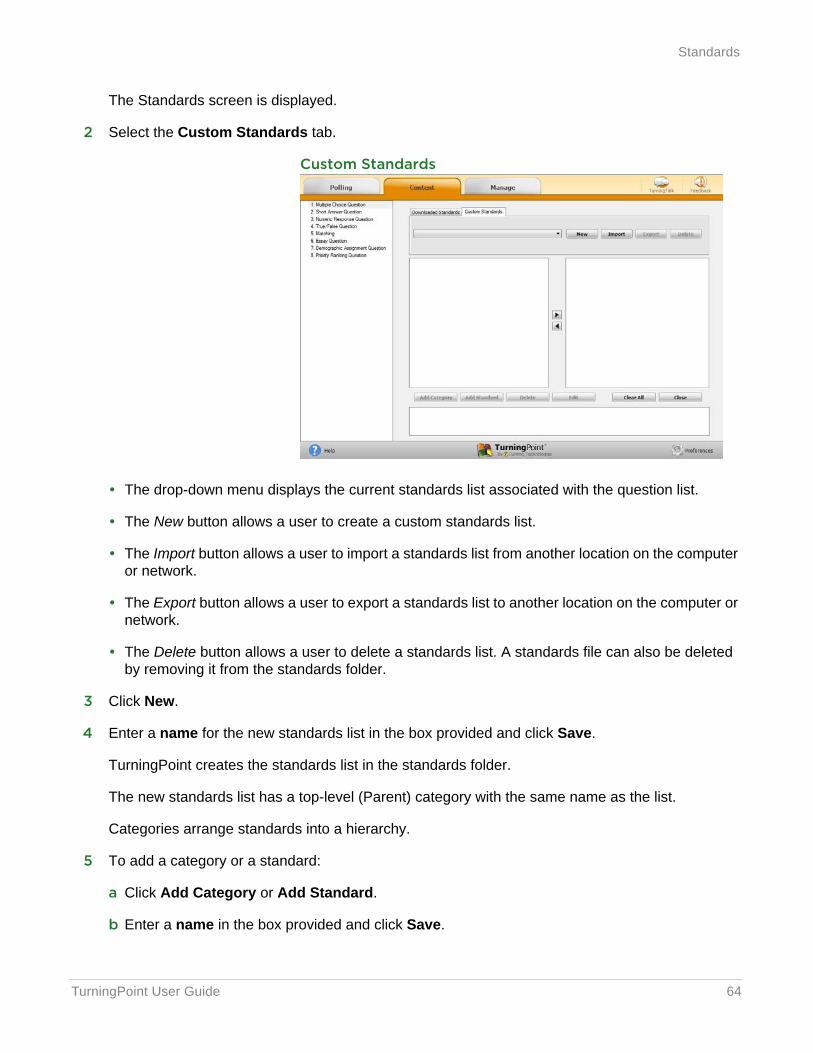
TurningPoint User Guide 64
Standards
The Standards screen is displayed.
2 Select the Custom Standards tab.
Custom Standards
• The drop-down menu displays the current standards list associated with the question list.
• The New button allows a user to create a custom standards list.
• The Import button allows a user to import a standards list from another location on the computer or network.
• The Export button allows a user to export a standards list to another location on the computer or network.
• The Delete button allows a user to delete a standards list. A standards file can also be deleted by removing it from the standards folder.
3 Click New.
4 Enter a name for the new standards list in the box provided and click Save.
TurningPoint creates the standards list in the standards folder.
The new standards list has a top-level (Parent) category with the same name as the list.
Categories arrange standards into a hierarchy.
5 To add a category or a standard:
a Click Add Category or Add Standard.
b Enter a name in the box provided and click Save.
TurningPoint User Guide 65
Standards
c Repeat steps a - b to add additional categories or standards.
6 Optionally, to delete a category or standard, select the category or standard and click Delete.
7 To edit a standard or category name, select the category or standard and click Edit. Enter a name in the box provided and click Save.
8 When finished, click Close.
A confirmation box appears.
9 Click Yes to save the new standards list.
Next Steps
To associate standards with questions, follow the instructions in the next section, Assigning Standards Using a Custom Standards List.
Assigning Standards Using a Custom Standards List
Once custom standards have been created, they can be assigned to questions in a question list. Standards may also be added to a session in the session editor. For more information, see Editing a Session on page 209.
Prerequisites
A question list must be open. If a question list is not open, select the Content tab, select the question list and click Edit Question List on the Question List Overview screen. A custom standards list is also necessary. For more information on custom standards list, see Creating a Custom Standards List on page 63.
How to assign standards using a custom standards list...
1 Click Standards.
The Standards screen is displayed.
2 Select the Custom Standards tab.
3 Select a standards list in one of the following ways:
a Select a standards list from the drop-down menu.
b Click Import and select a standards list from another location.
4 Select a question from the panel on the left.
TurningPoint User Guide 66
Standards
5 Select a standard from the list. Double-click the standard to apply it to the selected question.
6 Repeat steps four and five to assign standards to remaining questions.
7 To remove a standard from a question:
• Select the question and double-click the assigned standard.
• Click Clear All to remove all standards associated with the question list.
8 When finished, click Close.
9 Click Save and Close to save the changes and return to the Question List Overview screen.
TipMultiple standards can be selected by holding the Shift key while selecting standards. Multiple questions can also be selected by holding the Shift key while selecting questions.
TurningPoint User Guide 67
3 Participant Lists
A participant list is a list of participant names, User IDs, Device IDs and other custom categories. The use of a participant list allows for detailed reporting on each participant from a session.
TurningPoint sessions are grouped based on the participant list with which they are associated. For more information on participant list-based session management, see Results Manager in Chapter 8: Sessions on page 213.
This chapter covers the following sections:
• Creating Participant Lists
• Modifying Participant Lists
• Demographics
• Managing Participant Lists
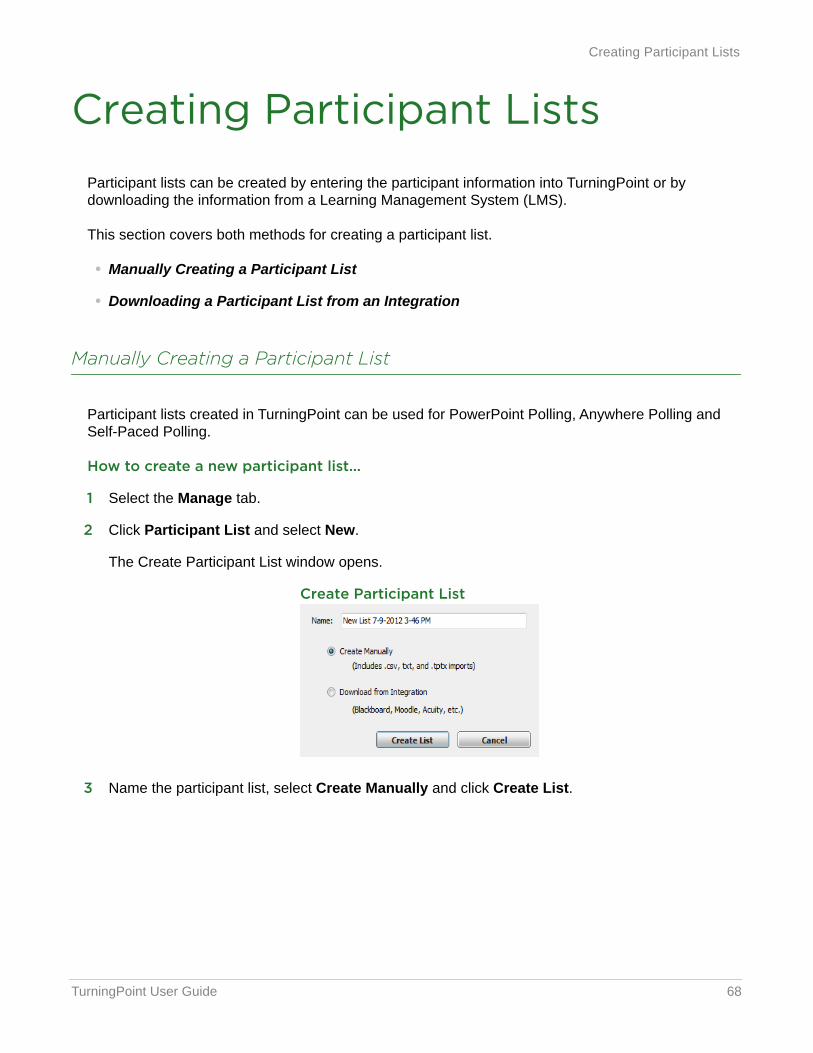
TurningPoint User Guide 68
Creating Participant Lists
Creating Participant ListsParticipant lists can be created by entering the participant information into TurningPoint or by downloading the information from a Learning Management System (LMS).
This section covers both methods for creating a participant list.
• Manually Creating a Participant List
• Downloading a Participant List from an Integration
Manually Creating a Participant List
Participant lists created in TurningPoint can be used for PowerPoint Polling, Anywhere Polling and Self-Paced Polling.
How to create a new participant list...
1 Select the Manage tab.
2 Click Participant List and select New.
The Create Participant List window opens.
Create Participant List
3 Name the participant list, select Create Manually and click Create List.
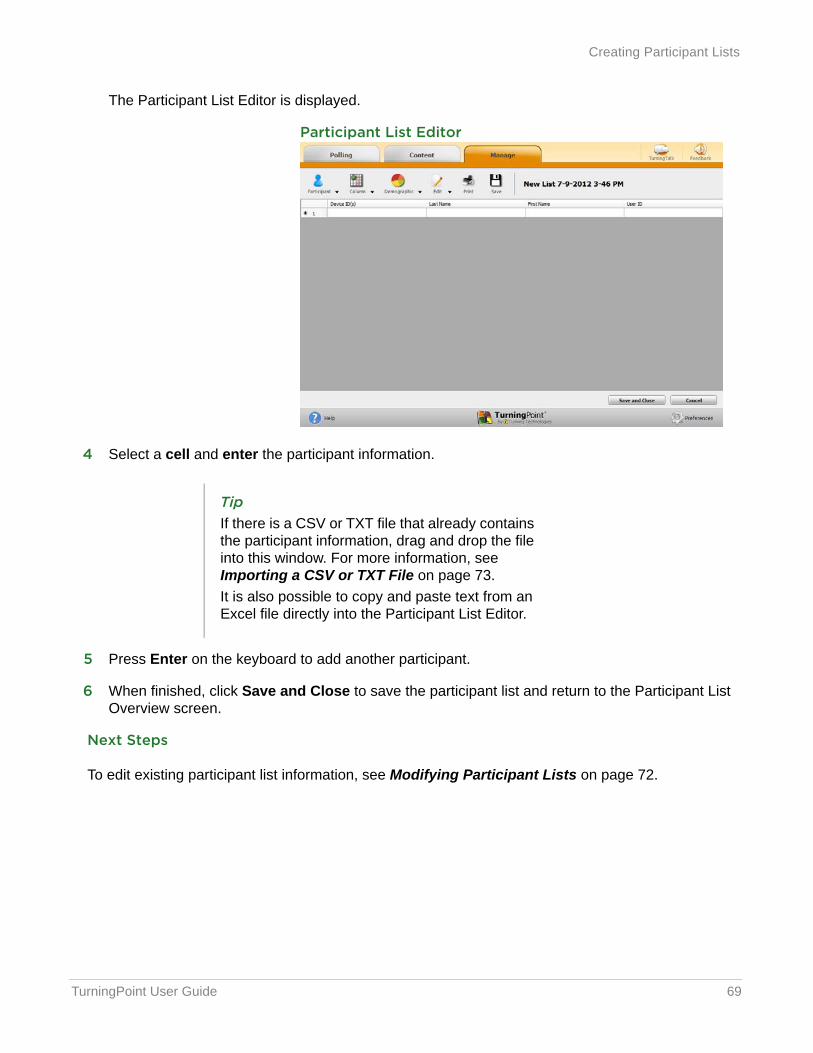
TurningPoint User Guide 69
Creating Participant Lists
The Participant List Editor is displayed.
Participant List Editor
4 Select a cell and enter the participant information.
5 Press Enter on the keyboard to add another participant.
6 When finished, click Save and Close to save the participant list and return to the Participant List Overview screen.
Next Steps
To edit existing participant list information, see Modifying Participant Lists on page 72.
TipIf there is a CSV or TXT file that already contains the participant information, drag and drop the file into this window. For more information, see Importing a CSV or TXT File on page 73.It is also possible to copy and paste text from an Excel file directly into the Participant List Editor.
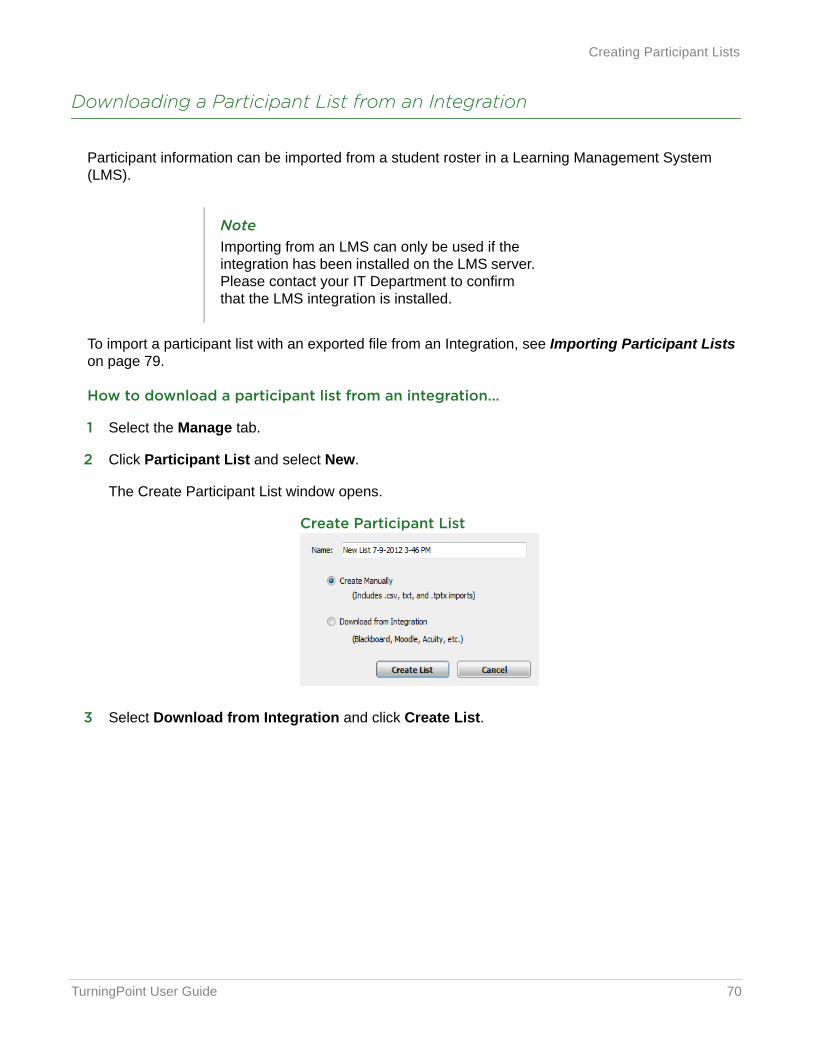
TurningPoint User Guide 70
Creating Participant Lists
Downloading a Participant List from an Integration
Participant information can be imported from a student roster in a Learning Management System (LMS).
To import a participant list with an exported file from an Integration, see Importing Participant Lists on page 79.
How to download a participant list from an integration...
1 Select the Manage tab.
2 Click Participant List and select New.
The Create Participant List window opens.
Create Participant List
3 Select Download from Integration and click Create List.
NoteImporting from an LMS can only be used if the integration has been installed on the LMS server. Please contact your IT Department to confirm that the LMS integration is installed.
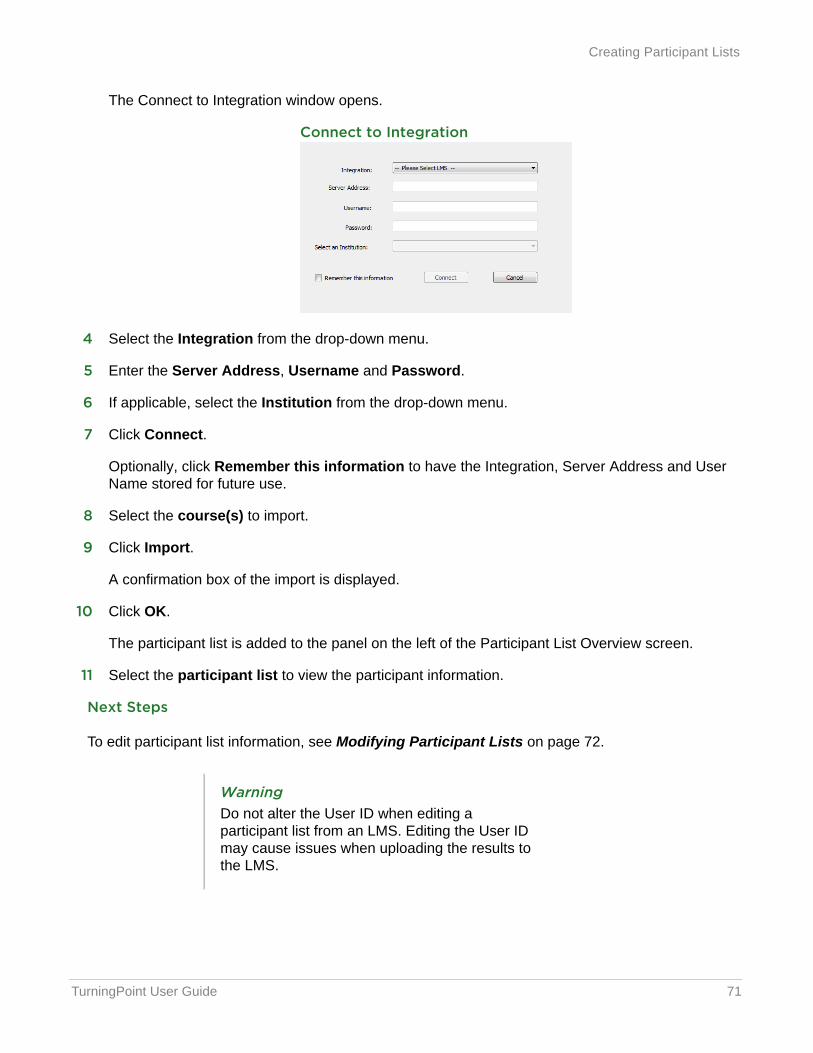
TurningPoint User Guide 71
Creating Participant Lists
The Connect to Integration window opens.
Connect to Integration
4 Select the Integration from the drop-down menu.
5 Enter the Server Address, Username and Password.
6 If applicable, select the Institution from the drop-down menu.
7 Click Connect.
Optionally, click Remember this information to have the Integration, Server Address and User Name stored for future use.
8 Select the course(s) to import.
9 Click Import.
A confirmation box of the import is displayed.
10 Click OK.
The participant list is added to the panel on the left of the Participant List Overview screen.
11 Select the participant list to view the participant information.
Next Steps
To edit participant list information, see Modifying Participant Lists on page 72.
WarningDo not alter the User ID when editing a participant list from an LMS. Editing the User ID may cause issues when uploading the results to the LMS.
TurningPoint User Guide 72
Modifying Participant Lists
Modifying Participant Lists After a participant list has been created, changes may be made to suit a user’s specific needs.
This section covers the following topics:
• Editing Participant List Information
• Importing a CSV or TXT File
• Exporting to a CSV, HTML or Template File
• Importing a Template File
Editing Participant List Information
Follow these steps to make changes to an existing participant list.
How to edit participant list information...
1 Select the Manage tab.
2 Select a participant list and click Edit Participants.
The Participant List Editor is displayed.
3 Select a cell and edit the participant information.
4 To add a participant, click Participant and select Add.
5 To remove a participant, select the participant, click Participant and select Remove.
6 To add a column, click Column and select Add.
Select a header type.
• Custom - Enter a name for the column header in the box provided and click OK.
• Voting Weight - A participant vote is equal to one. A voting weight allows a participant’s vote to be weighted heavier than a single vote. A voting weight of “2” would be equal to two votes.
WarningModifying a participant list WILL alter data or scores in all associated session files.
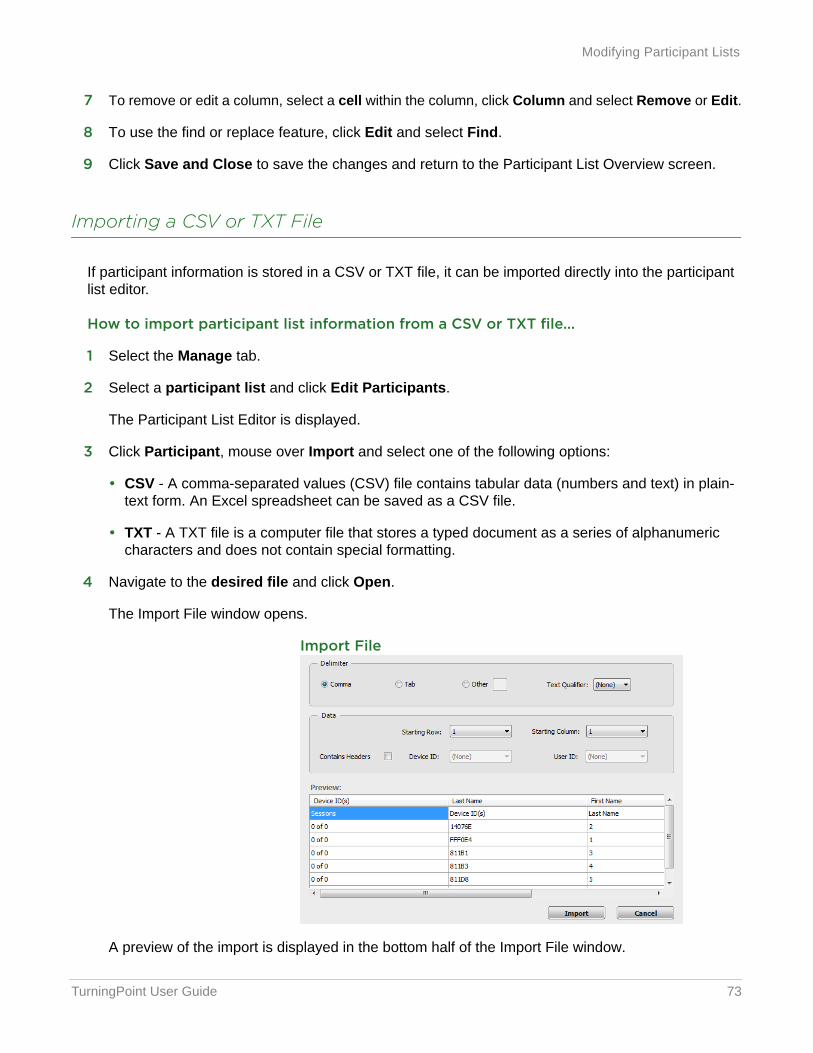
TurningPoint User Guide 73
Modifying Participant Lists
7 To remove or edit a column, select a cell within the column, click Column and select Remove or Edit.
8 To use the find or replace feature, click Edit and select Find.
9 Click Save and Close to save the changes and return to the Participant List Overview screen.
Importing a CSV or TXT File
If participant information is stored in a CSV or TXT file, it can be imported directly into the participant list editor.
How to import participant list information from a CSV or TXT file...
1 Select the Manage tab.
2 Select a participant list and click Edit Participants.
The Participant List Editor is displayed.
3 Click Participant, mouse over Import and select one of the following options:
• CSV - A comma-separated values (CSV) file contains tabular data (numbers and text) in plain-text form. An Excel spreadsheet can be saved as a CSV file.
• TXT - A TXT file is a computer file that stores a typed document as a series of alphanumeric characters and does not contain special formatting.
4 Navigate to the desired file and click Open.
The Import File window opens.
Import File
A preview of the import is displayed in the bottom half of the Import File window.
TurningPoint User Guide 74
Modifying Participant Lists
5 Select the delimiter type.
6 Check the box to the right of Contains Headers if the file being imported has headers. Headers will be excluded from the import.
7 If necessary, adjust the Starting Row or Starting Column.
8 If the Device ID or User ID is in a column with a different header name, select the column header from the appropriate drop-down menu.
9 Click Import.
10 Click Yes to proceed.
The participant information is imported into the participant list.
11 Click Save and Close to save the changes and return to the Participant List Overview screen.
Exporting to a CSV, HTML or Template File
To export a CSV, HTML or template file, follow the steps below.
How to export participant list information to a CSV, TXT or Template file...
1 Select the Manage tab.
2 Select a participant list and click Edit Participants.
The Participant List Editor is displayed.
3 Click Participant, mouse over Export and select one of the following options:
• CSV - A comma-separated values (CSV) file contains tabular data (numbers and text) in plain-text form. An Excel spreadsheet can be saved as a CSV file.
• HTML - An HTML file can be opened with an internet browser.
• Template - The template file contains all of the fields in the participant list. Importing a template into a participant list makes creating a new participant list with the same fields easier. For more information on how to import a template, see Importing a Template File in the next section.
4 Provide a name for the file and click Save.
5 Click Save and Close to close the participant list and return to the Participant List Overview screen.
WarningImporting data will overwrite all data currently in the grid.
TurningPoint User Guide 75
Modifying Participant Lists
Next Steps
Now that a participant list has been exported as a CSV or HTML, it can be imported into another program such as a gradebook.
Importing a Template File
Importing a template file will overwrite the existing columns.
How to import a template file...
1 Select the Manage tab.
2 Select a participant list and click Edit Participants.
The Participant List Editor is displayed.
3 Click Participant, mouse over Import and select Template.
4 Select the template file (TPTX extension) and click Open.
The template is applied to the current participant list.
5 Click Save and Close to save the changes and return to the Participant List Overview screen.
TurningPoint User Guide 76
Demographics
DemographicsDemographics can be assigned in a participant list for team competitions and detailed reporting on session data.
This section covers the following topics:
• Adding Demographics to a Participant List
• Editing Demographics in a Participant List
• Removing Demographics from a Participant List
Adding Demographics to a Participant List
Participant list demographics allow a user to assign participants to teams or other demographics. This information can be used to display demographic results during a presentation or in the Results by Demographic report. The demographics will apply to all sessions associated with the participant list.
How to add demographics to a participant list...
1 Select the Manage tab.
2 Select a participant list and click Edit Participants.
The Participant List Editor is displayed.
3 Click Demographic and select Add.
4 Enter the Demographic Grouping name.
The demographic grouping name allows for organization of demographic information. (example: gender)
5 Enter text for individual demographic Group Options. (example: male, female)
6 Click Add.
7 Repeat steps five and six until all group options have been added.
TipSet up different groups for different types of demographics in order to apply multiple demographic filters in the demographic report.
TurningPoint User Guide 77
Demographics
8 Optionally, check Use for Competitions if the demographic will be used for team leader boards during the presentation.
9 Click OK.
10 Assign a demographic for each participant from the drop-down menu in the Demographic column.
11 Click Save and Close to save the changes and return to the Participant List Overview screen.
Editing Demographics in a Participant List
Editing a demographic allows the demographic name to be changed along with the available demographic options.
How to edit demographics in a participant list...
1 Select the Manage tab.
2 Select a participant list and click Edit Participants.
The Participant List Editor is displayed.
3 Select a cell in the demographic column.
4 Click Demographic and select Edit.
5 Change the demographic name, demographic options or set competition settings as necessary.
6 Click OK.
7 Click Save and Close to save the changes and return to the Participant List Overview screen.
Removing Demographics from a Participant List
To remove a demographic from a participant list, follow the steps below.
How to remove a demographic from a participant list...
1 Select the Manage tab.
2 Select a participant list and click Edit Participants.
The Participant List Editor is displayed.
3 Select a cell in the demographic column.
4 Click Demographic and select Remove.
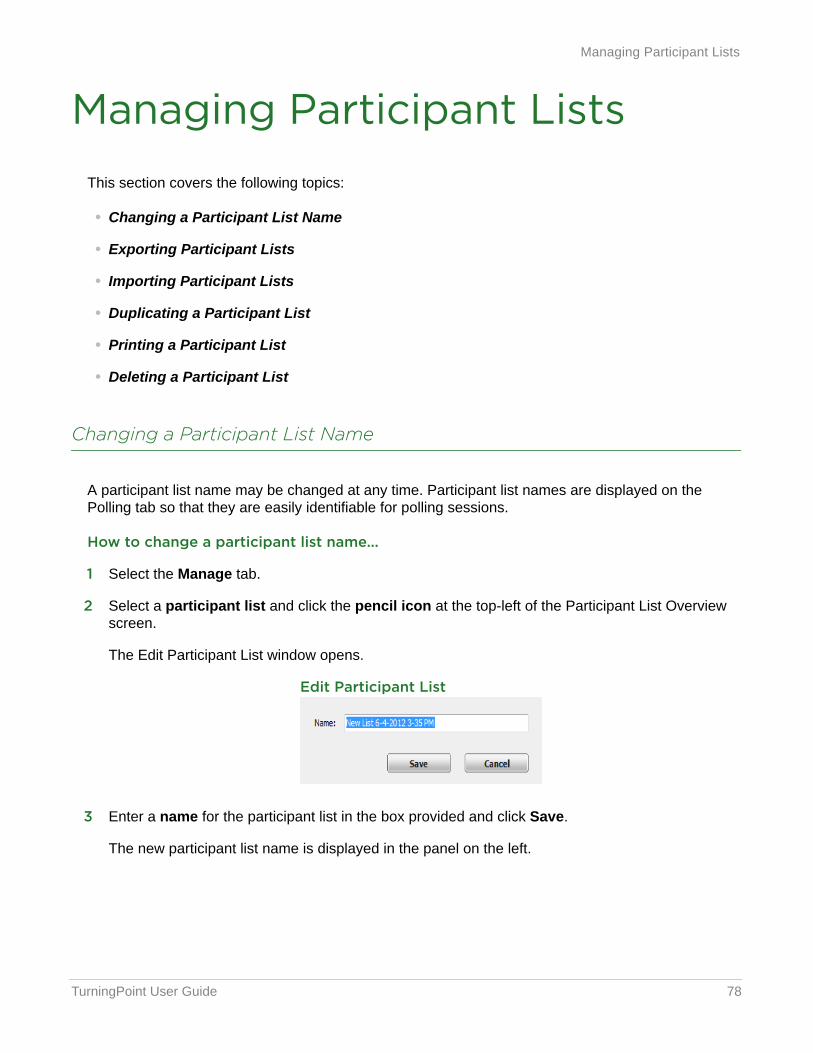
TurningPoint User Guide 78
Managing Participant Lists
Managing Participant ListsThis section covers the following topics:
• Changing a Participant List Name
• Exporting Participant Lists
• Importing Participant Lists
• Duplicating a Participant List
• Printing a Participant List
• Deleting a Participant List
Changing a Participant List Name
A participant list name may be changed at any time. Participant list names are displayed on the Polling tab so that they are easily identifiable for polling sessions.
How to change a participant list name...
1 Select the Manage tab.
2 Select a participant list and click the pencil icon at the top-left of the Participant List Overview screen.
The Edit Participant List window opens.
Edit Participant List
3 Enter a name for the participant list in the box provided and click Save.
The new participant list name is displayed in the panel on the left.
TurningPoint User Guide 79
Managing Participant Lists
Exporting Participant Lists
A participant list can be exported from TurningPoint on one computer for use on another computer.
How to export a participant list...
1 Select the Manage tab.
2 Click Participant List and select Export.
3 Select the participant list(s) to be exported.
4 Click ..., navigate to the save location and click OK.
5 Click Save.
The selected participant list(s) are now saved to the selected location.
Next Steps
Now that a participant list has been exported, it can be imported into TurningPoint on another computer. To import a participant list see the next section, Importing Participant Lists.
Importing Participant Lists
Exported participant lists can be imported into TurningPoint on another computer. Exported participant information from an integration can also be imported as a participant list.
How to import a participant list...
1 Select the Manage tab.
2 Click Participant List and select Import.
NoteParticipant lists used in previous Turning Technologies products can be imported into TurningPoint.
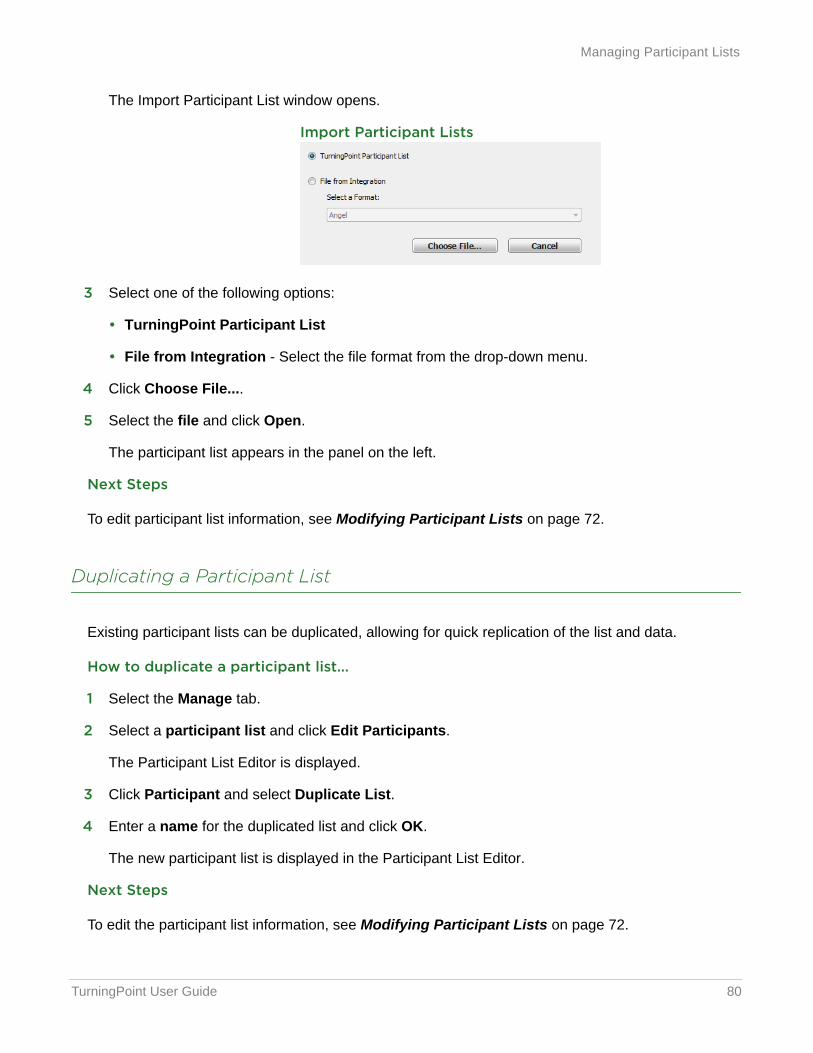
TurningPoint User Guide 80
Managing Participant Lists
The Import Participant List window opens.
Import Participant Lists
3 Select one of the following options:
• TurningPoint Participant List
• File from Integration - Select the file format from the drop-down menu.
4 Click Choose File....
5 Select the file and click Open.
The participant list appears in the panel on the left.
Next Steps
To edit participant list information, see Modifying Participant Lists on page 72.
Duplicating a Participant List
Existing participant lists can be duplicated, allowing for quick replication of the list and data.
How to duplicate a participant list...
1 Select the Manage tab.
2 Select a participant list and click Edit Participants.
The Participant List Editor is displayed.
3 Click Participant and select Duplicate List.
4 Enter a name for the duplicated list and click OK.
The new participant list is displayed in the Participant List Editor.
Next Steps
To edit the participant list information, see Modifying Participant Lists on page 72.
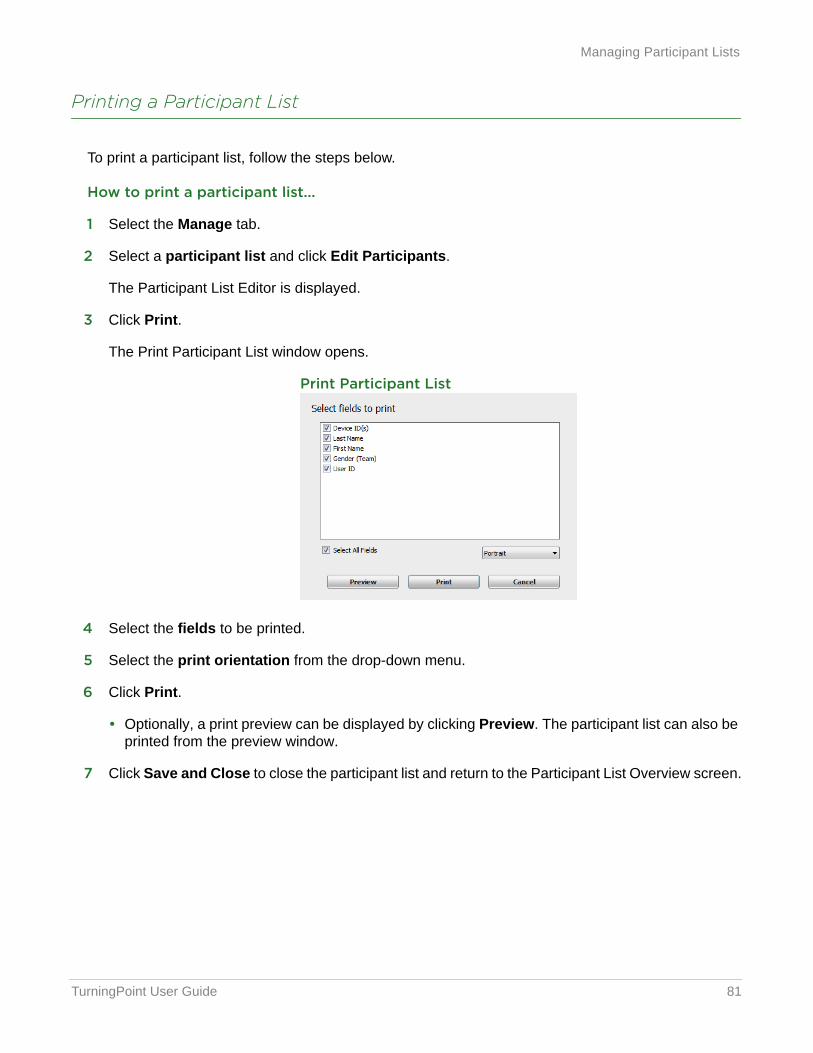
TurningPoint User Guide 81
Managing Participant Lists
Printing a Participant List
To print a participant list, follow the steps below.
How to print a participant list...
1 Select the Manage tab.
2 Select a participant list and click Edit Participants.
The Participant List Editor is displayed.
3 Click Print.
The Print Participant List window opens.
Print Participant List
4 Select the fields to be printed.
5 Select the print orientation from the drop-down menu.
6 Click Print.
• Optionally, a print preview can be displayed by clicking Preview. The participant list can also be printed from the preview window.
7 Click Save and Close to close the participant list and return to the Participant List Overview screen.
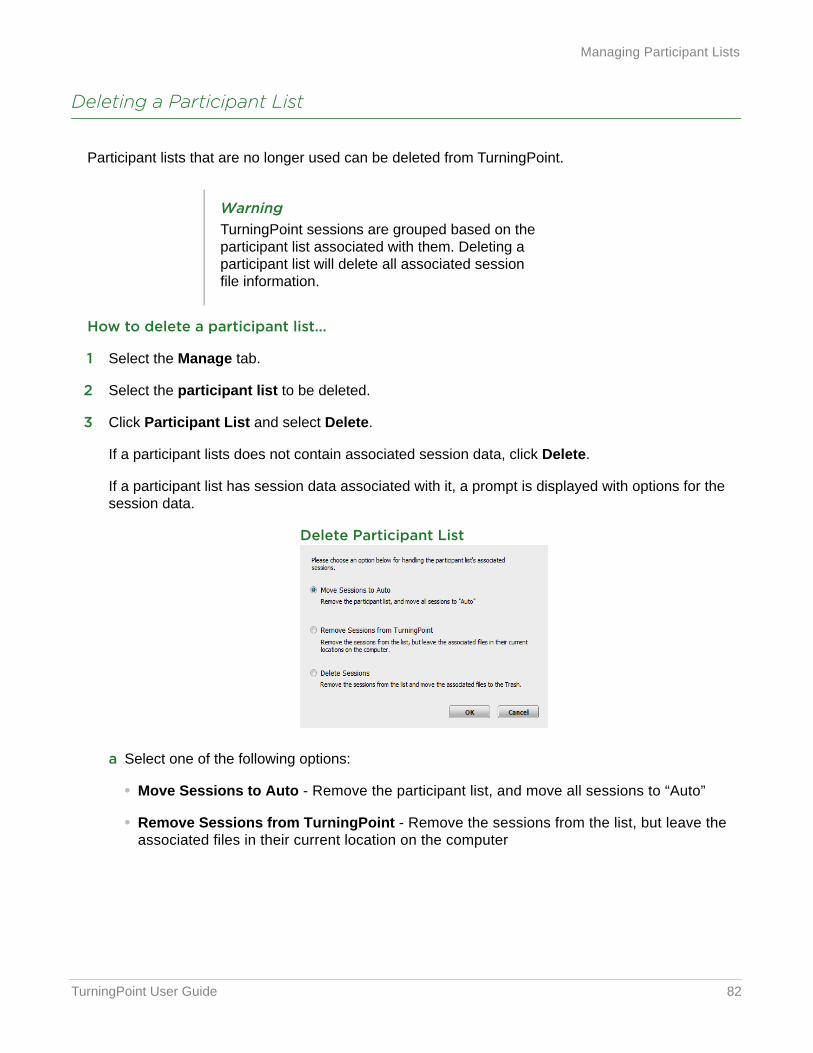
TurningPoint User Guide 82
Managing Participant Lists
Deleting a Participant List
Participant lists that are no longer used can be deleted from TurningPoint.
How to delete a participant list...
1 Select the Manage tab.
2 Select the participant list to be deleted.
3 Click Participant List and select Delete.
If a participant lists does not contain associated session data, click Delete.
If a participant list has session data associated with it, a prompt is displayed with options for the session data.
Delete Participant List
a Select one of the following options:
• Move Sessions to Auto - Remove the participant list, and move all sessions to “Auto”
• Remove Sessions from TurningPoint - Remove the sessions from the list, but leave the associated files in their current location on the computer
WarningTurningPoint sessions are grouped based on the participant list associated with them. Deleting a participant list will delete all associated session file information.

TurningPoint User Guide 83
Managing Participant Lists
• Delete Sessions - Remove the sessions from the list and move the associated files to the Recycle Bin
b Click OK.
WarningIf Delete Sessions is selected, all session files will be placed in the Recycle Bin and will be permanently removed from the system if the Recycle Bin is emptied.
TurningPoint User Guide 84
4 Preferences
This chapter explains how to access the Preferences window within TurningPoint and all three polling environments.
The TurningPoint preferences are organized into five categories:
• Software
• Connections
• PowerPoint
• Anywhere
• Self-Paced
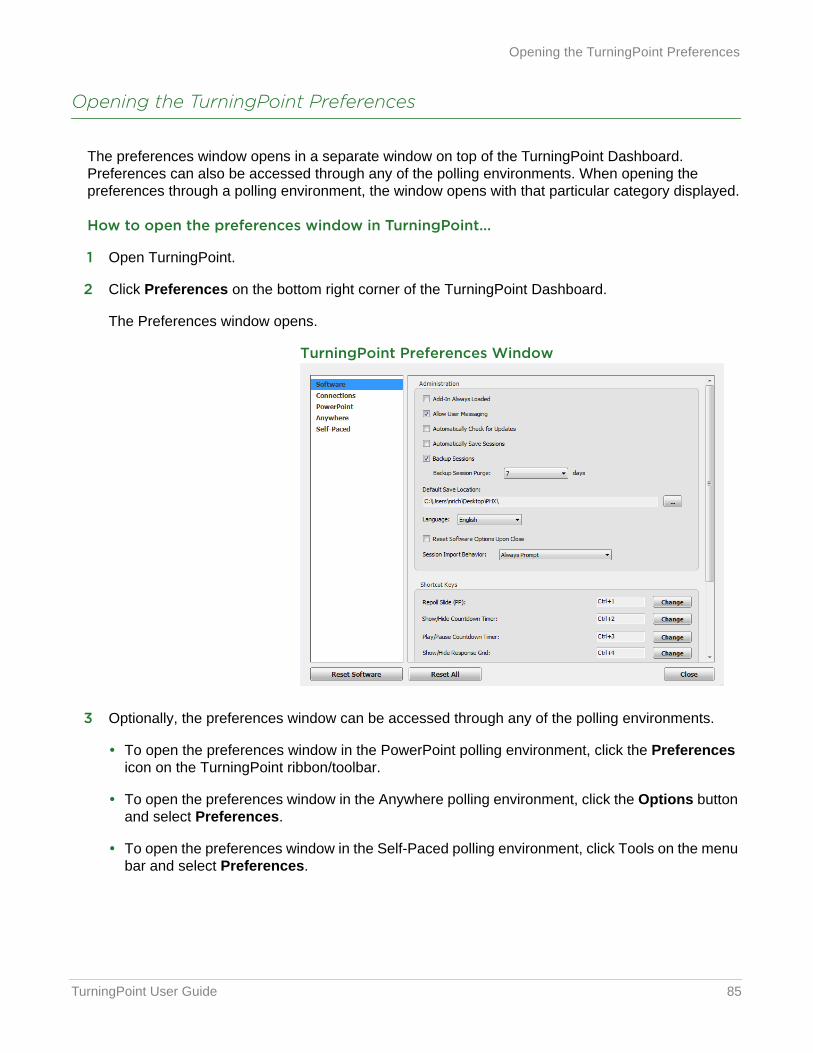
TurningPoint User Guide 85
Opening the TurningPoint Preferences
Opening the TurningPoint Preferences
The preferences window opens in a separate window on top of the TurningPoint Dashboard. Preferences can also be accessed through any of the polling environments. When opening the preferences through a polling environment, the window opens with that particular category displayed.
How to open the preferences window in TurningPoint...
1 Open TurningPoint.
2 Click Preferences on the bottom right corner of the TurningPoint Dashboard.
The Preferences window opens.
TurningPoint Preferences Window
3 Optionally, the preferences window can be accessed through any of the polling environments.
• To open the preferences window in the PowerPoint polling environment, click the Preferences icon on the TurningPoint ribbon/toolbar.
• To open the preferences window in the Anywhere polling environment, click the Options button and select Preferences.
• To open the preferences window in the Self-Paced polling environment, click Tools on the menu bar and select Preferences.

TurningPoint User Guide 86
Opening the TurningPoint Preferences
4 Adjust the preferences as necessary.
5 Click Close to close the Preferences window.
NoteChanges made within the preferences are automatically saved.Click Reset All to revert all preferences back to their original state. Click the Reset button to revert all preferences for individual categories back to their original state.
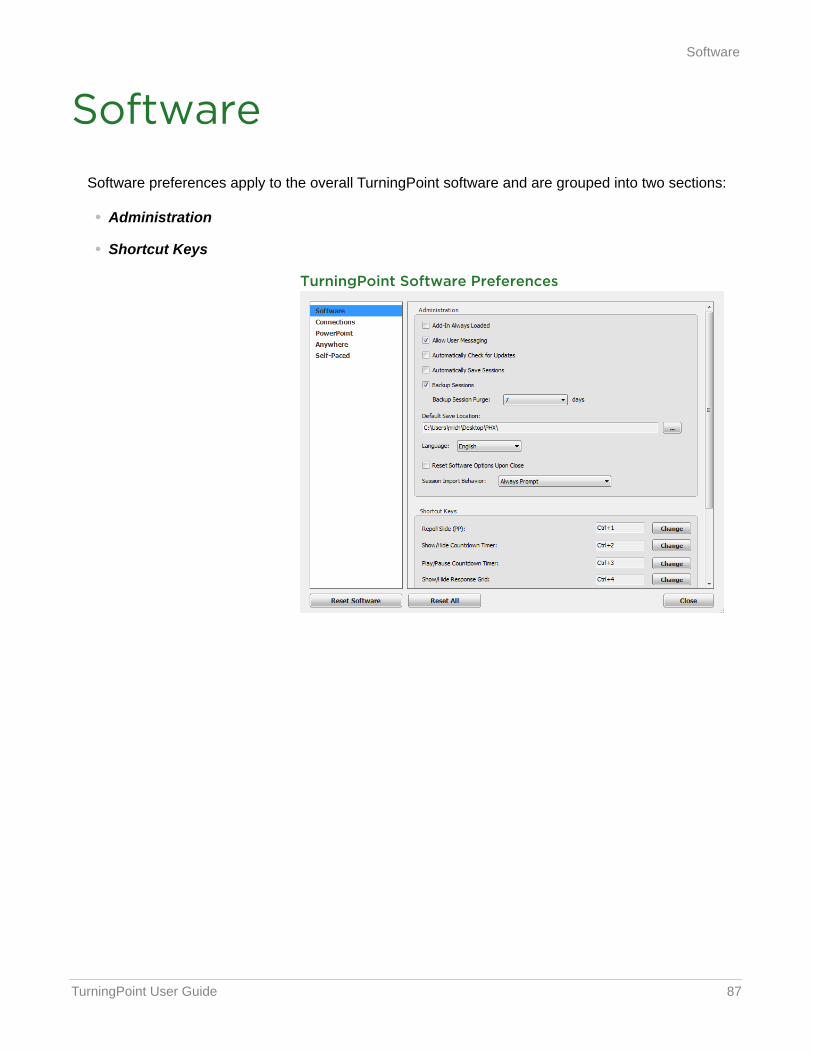
TurningPoint User Guide 87
Software
SoftwareSoftware preferences apply to the overall TurningPoint software and are grouped into two sections:
• Administration
• Shortcut Keys
TurningPoint Software Preferences
TurningPoint User Guide 88
Software
Administration
Administration settings refer to preferences that apply to the entire TurningPoint application.
Add-in Always Loaded
Determines if the PowerPoint Polling environment automatically loads when PowerPoint is open.
Allow User Messaging
Allows participants to send feedback to the presenter.
Automatically Check for Updates
When checked, TurningPoint will notify the user that an updated version is available for download.
Automatically Save Sessions
Sessions are automatically saved to the default save location when sessions are reset or the polling environment is closed.
Backup Sessions
A backup session is automatically saved when a user decides to not save a session file.
• Backup Session Purge - Backup session are automatically deleted after the specified number of days.
Default Save Location
Determines a custom location to save the session files.
Language
Changes the TurningPoint language. Currently, English-US is the only supported language.
Reset Software Options Upon Close
When checked, all preferences and software options (any items saved to memory) revert to their original state when TurningPoint is closed. Administration and Response Devices preferences are not affected.
TurningPoint User Guide 89
Software
Session Import Behavior
Determines how TurningPoint handles session files when they are detected.
• Move Files to Directory - This option moves the session files from their original location to the default session directory.
• Leave Files in Previous Location - This option adds the session file to the Manage tab but does not move the session file. If the file is moved from that location at a later date, it will need to be located to view reports or edit the session.
• Always Prompt - Every time new session files are detected TurningPoint prompts the user to move the files or leave them in the previous location.
Shortcut Keys
TurningPoint allows for user-specified shortcut keys in PowerPoint Polling and Anywhere Polling.
To change the shortcut key click Change, press a button on the keyboard, select Ctrl, Shift or Alt. Shortcut keys are available for the following software functions:
• Repoll Slide (PP) - The repoll function in the PowerPoint Polling environment.
• Show/Hide Countdown Timer (AW) - This shortcut applies to the countdown timer in the Anywhere Polling environment.
• Play/Pause Countdown Timer - This shortcut applies to the countdown timer in all three polling environments.
• Show/Hide Response Grid - This shortcut applies to the response grid in the PowerPoint and Anywhere Polling environments.
• Show/Hide Connection Information - This shortcut applies to the PowerPoint and Anywhere Polling environments.
• Show/Hide Chart (AW) - This shortcut applies to the chart window in the Anywhere Polling environment.
• Show/Hide Presentation Window - This shortcut applies to the PowerPoint and Anywhere Polling environments. In the PowerPoint Polling environment the screen displays black.
• Show/Hide Showbar (PP) - This shortcut applies to the PowerPoint Polling environment.
• Start/Stop Polling - This shortcut applies to the Anywhere Polling environment.
• Toggle Responses - The shortcut toggles the response count and percentages in the PowerPoint and Anywhere Polling environments.
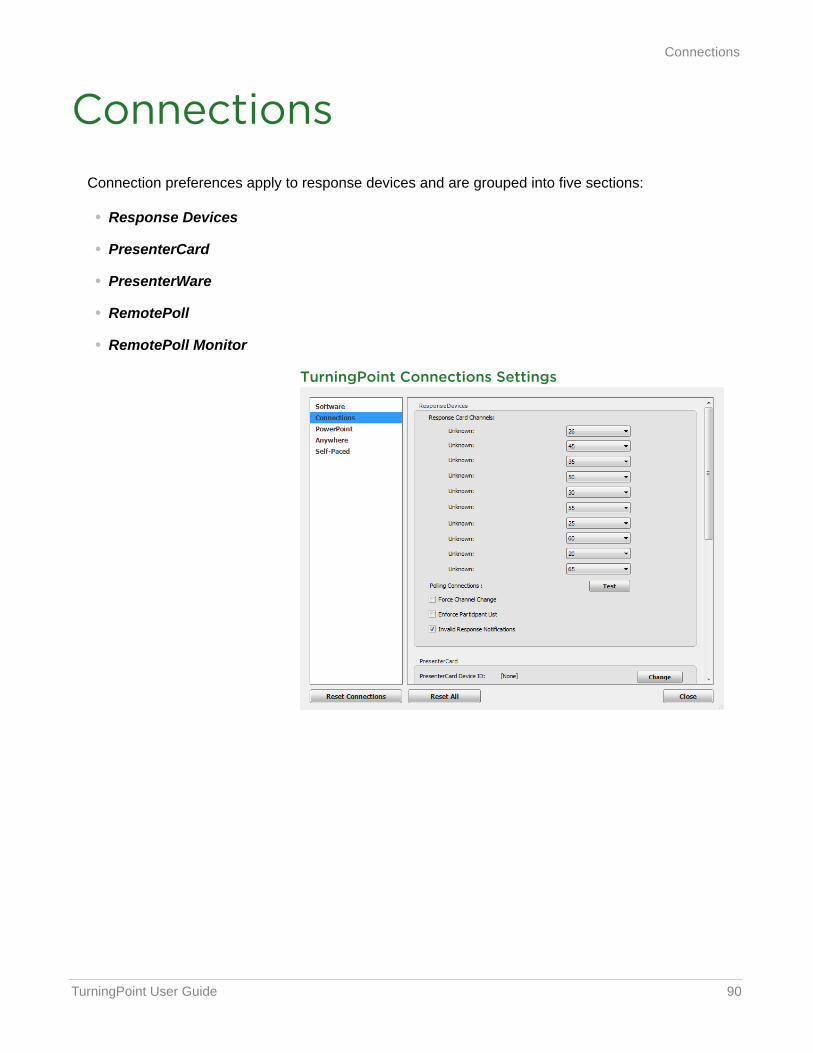
TurningPoint User Guide 90
Connections
ConnectionsConnection preferences apply to response devices and are grouped into five sections:
• Response Devices
• PresenterCard
• PresenterWare
• RemotePoll
• RemotePoll Monitor
TurningPoint Connections Settings
TurningPoint User Guide 91
Connections
Response Devices
This section contains preferences for the response devices compatible with TurningPoint.
ResponseCard Channels
Displays the Receiver ID and Channels of the receivers connected to computer. To change the channel on the receiver, select the channel number from the drop-down menu.
Polling Connections
The polling test is used to ensure that each response device can communicate with TurningPoint. For instructions on how to test the polling connections, see Testing the Polling Connections on page 20.
Force Channel Change
Determines whether TurningPoint will allow the receiver channel to be maintained once connected. When checked, TurningPoint will force the receiver to change to the first available channel slot.
Enforce Participant List
When checked, responses from participants who are not in the loaded participant list are excluded. The default will accept all participants’ responses and append them to the end of the participant list.
Invalid Response Notifications
When checked, the ResponseCard will notify the participant that an invalid response was chosen.
NoteThe invalid response notification does not apply to the ResponseCard IR.
TurningPoint User Guide 92
Connections
PresenterCard
This section contains the preferences for pairing the PresenterCard with TurningPoint and programming the customizable buttons.
PresenterCard Device ID
Click Change to open the PresenterCard pairing window. The PresenterCard must be paired to be compatible with TurningPoint. For pairing instructions, see Pairing a PresenterCard on page 22.
PowerPoint Programmable Button 1
Select an option from the drop-down menu for the first programmable button.
PowerPoint Programmable Button 2
Select an option from the drop-down menu for the second programmable button.
PowerPoint Programmable Button 3
Select an option from the drop-down menu for the third programmable button.
PresenterWare
This section contains the preferences for enabling PresenterWare Support. PresenterWare setup must be completed through either the PowerPoint Polling or Anywhere Polling Preferences.
Enable PresenterWare Support
Check this option to enable PresenterWare Support via TurningPoint.
PresenterWare Connection
Click Confirm. To enable this button, PresenterWare must be launched on your smart phone or tablet.
Current IP Address
Displays the presenting computer’s IP address to establish communication between the PresenterWare software and TurningPoint.
TurningPoint User Guide 93
Connections
PresenterWare Port
Enter the presenting computer’s network port number. Default is 6090.
Bonjour Name
Optionally, enter your computer’s Bonjour name.
RemotePoll
This section contains the preferences for enabling RemotePoll.
Enable RemotePoll Support
Check this option to enable RemotePoll Support via TurningPoint.
Current IP Address
Displays the presenting computer’s IP Address to establish communication between the RemotePoll software and TurningPoint.
RemotePoll Port
Enter the presenting computer’s network port number. Default is 1025.
TipFor more information about PresenterWare, including configuring a device, please see PresenterWare for AnyWhere Polling or PresenterWare for PowerPoint Polling: www.turningtechnologies.com/user-guides.
TipFor more information about RemotePoll, please see the RemotePoll User Guide: www.turningtechnologies.com/user-guides.
TurningPoint User Guide 94
Connections
RemotePoll Monitor
This section contains the preferences for enabling the RemotePoll Monitor.
Enable RemotePoll Monitor Support
Check this option to enable RemotePoll Monitor Support via TurningPoint.
Current IP Address
Displays the presenting computer’s IP Address to establish communication between the RemotePoll Monitor software and TurningPoint.
RemotePoll Port
Enter the presenting computer’s network port number. Default is 2010.
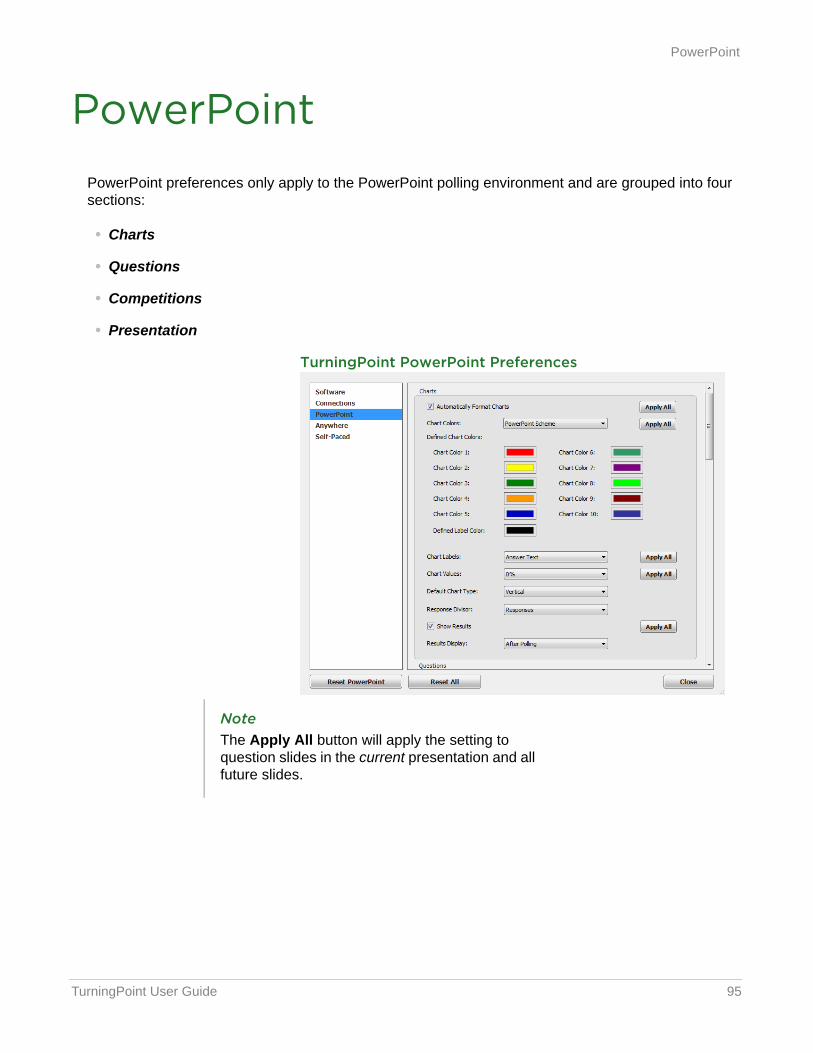
TurningPoint User Guide 95
PowerPoint
PowerPointPowerPoint preferences only apply to the PowerPoint polling environment and are grouped into four sections:
• Charts
• Questions
• Competitions
• Presentation
TurningPoint PowerPoint Preferences
NoteThe Apply All button will apply the setting to question slides in the current presentation and all future slides.
TurningPoint User Guide 96
PowerPoint
Charts
This section enables the user to view and change the chart preferences.
Automatically Format Charts
If checked, the charts will retain their default properties. If unchecked, the user has the option to edit the chart properties by double-clicking on the chart and editing as necessary. Each chart must be edited separately, however the general setting may be applied via Preferences.
Chart Colors
Select a color scheme from the drop-down menu to determine what colors will be used during the presentation. There are three options available.
• PowerPoint Scheme - Uses the selected PowerPoint color scheme.
• Defined - Uses user defined chart colors.
• Correct/Incorrect - Applies green for correct answers and red for incorrect answers.
Defined Chart Colors
These are the colors that will display when Defined is the selected Chart Color. Click a color to open the color palette and select a new color.
Defined Label Color
Determines the color of the chart label text. Click the color to open the color palette and select a new color.
Chart Labels
Determines if Answer Text or Bullets will be displayed in the chart labels and legends.
Chart Values
Determines whether a Response Count (number of participants) or a percentage is displayed. There are three formats for displaying the percentage: 0%, 0.0% and 0.00%.
Default Chart Type
Determines the default chart that is used when a slide is inserted into a presentation. To change the chart type, simply select another one from the drop-down menu.
TurningPoint User Guide 97
PowerPoint
Response Divisor
Determines whether the divisor used to calculate the percentages on a multiple response question will be:
• the total number of responses received (responses)
• the total number of participants in the session’s participant list
• the total number of devices that responded
Show Results
When checked, a chart is displayed when polling is closed.
Results Display
Determines whether the results are displayed after polling or during polling. The during polling option is only available for Office 2003 or Office 2010 users.
Questions
This section enables the user to view and change question preference.
Accept First Response Only
When checked, TurningPoint only accepts the first response sent by each participant.
Bullet Format
Determines the type of answer bullets for polling slides. The available options include: alphabetic uppercase [A, B, C, D], alphabetic lowercase [a, b, c, d], numeric starting at 1 [1, 2, 3, 4] or numeric starting at 0 [0, 1, 2, 3].
Automatically Advance After Objects
When checked, chart results will automatically display upon the completion of a countdown timer or response counter.
Automatically Open Polling
When checked, polling automatically opens when the slide is shown. When unchecked, the slide needs to be advanced to open polling.
TurningPoint User Guide 98
PowerPoint
Countdown Timer
Determines if a countdown object will be automatically inserted on new slides.
• Countdown Seconds - Set the number of seconds a countdown object will display. The acceptable range is 1 - 999. The default is set at 30 seconds.
• Countdown Sound - A sound file can be added to a countdown timer. To add a countdown sound click ..., browse to the location of the sound file and click Open.
Response Grid
When checked, a response grid is automatically inserted onto each new polling slide. The following settings are available for Response Grids.
• Response Grid Type - Determines the default response grid type. There are three Response Grids available:
• The table grid displays numbered boxes that represent each participant in the participant list. If polling with an auto list, the number of boxes displayed is determined by the number of participants responding.
• The response grid displays the participant name by default. As the participants respond, the corresponding box will change color. If polling with an auto list, it is recommended to change the response grid text to Device ID Only in the preferences. As the participants respond a Device ID will appear in the box.
• The non-response grid displays the participant name by default. As the participants respond, the corresponding box will be removed. If polling with an auto list it, is recommended to change the response grid text to Device ID Only in the preferences.
• Response Grid Text - Determines what participant information is displayed.
• Rotation Interval - Determines the number of seconds a Response/Non-Response Grid will pause between intervals. The acceptable range is two to ten seconds. The default is set at four.
• Font Size - Determines the font size for the text displayed on the response grids.
• Starting Cell Color - Determines the Response/Non-Response Grid starting color.
• First Response Color - Determines the color of the cell when a participant submits a response.
• Second Response Color - Determines the color of the cell when a participant submits another response.
• Third Response Color - Determines the color of the cell when a participant submits another response for the third time.
TurningPoint User Guide 99
PowerPoint
Multiple Responses
Multiple responses allow participants to send more than one response to a question. When this box is checked the following options may be set:
• Number of Responses- Select the number of responses allowed for each participant from the drop-down menu.
• Allow Duplicates - When checked, the participants are allowed to select the same answer choice more than once.
• All or Nothing Scoring - When checked, the participant must choose each correct answer to receive points.
Point Values
Determines the correct and incorrect point values. Click Apply All to change all correct or incorrect point values.
• Correct - The point value of the correct answer can be set by entering a value in the box provided.
• Incorrect - The point value of the incorrect answer can be set by entering a value in the box provided.
Prompt
Selecting a prompt type from the drop-down menu will automatically insert the prompt object on the polling slide during slide creation.
• Prompt Text - The phrase that will display in the prompt object.
Competitions
This section enables the user to view and change the preferences for competition.
Fastest Responders
The Fastest Responders settings determine what type of information is displayed and how many participants are displayed.
• Display Correct Responders Only - Only participants who responded correctly to the previous question slide will be displayed.
• Participant Information - Select the type of participant information to be displayed from the drop-down menu.
• Participant Count - Select the number of participants to be displayed from the drop-down menu.
TurningPoint User Guide 100
PowerPoint
Participant Scores
The Participant Scores preferences determine what type of information is displayed, how many participants are displayed and how the scores are calculated.
• Participant Information - Select the type of participant information to be displayed from the drop-down menu.
• Participant Count - Select the number of participants to be displayed from the drop-down menu.
• Score Calculation - Select whether the points displayed are Cumulative or Single from the drop-down menu. Cumulative points are the total points earned up to that point in the presentation. Single points are only the points earned on the previous question slide.
Team Scores
The Team Scores settings determine how many teams are displayed and how the scores are calculated.
• Include Teams with Less Than 1 Point - When checked, teams that have zero or negative points will be displayed on the slide.
• Team Display Count - Select the number of teams to be displayed from the drop-down menu.
• Score Calculation - Select whether the points displayed are cumulative or single from the drop-down menu. Cumulative points are the total points earned up to that point in the presentation. Single points are only the points earned on the previous question slide.
• Include Non-Responders - When checked, participants who have been active in the session but did not respond to a particular question(s) will be counted as a response for their team and scored as a ‘zero.’
Overall Racing Settings
The Overall Racing preferences determine what image is used to represent the teams, whether or not the winner board is displayed and what the point threshold is to win the race.
• Animated Image - Select the image to represent the teams. One image is used for all teams.
• Display Winner Board - When checked, a slide displaying the winning team will appear when the point threshold is met.
• Point Threshold to Win - When the point level has been reached the winner board will display.
TurningPoint User Guide 101
PowerPoint
Presentation
This section enables the user to view and change various presentation preferences.
Collapse Showbar
When checked, the showbar is displayed in a shortened form.
Display Showbar
When checked, the showbar is visible when a polling slide is displayed.
Include PowerPoint Presentation
When checked, a copy of the PowerPoint presentation is automatically saved inside each session. For more information on how to extract a PowerPoint presentation, see Extracting Session Information on page 205.
Use Secondary Monitor
When checked, the showbar is displayed on a secondary monitor, if available.
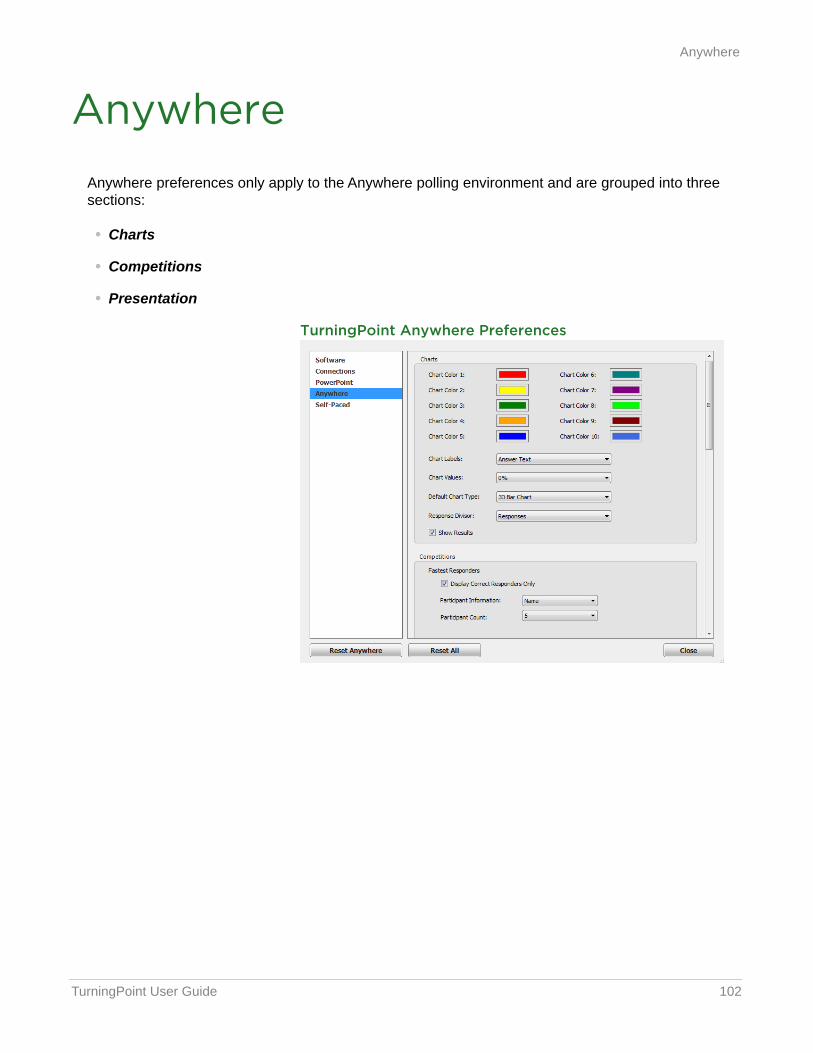
TurningPoint User Guide 102
Anywhere
AnywhereAnywhere preferences only apply to the Anywhere polling environment and are grouped into three sections:
• Charts
• Competitions
• Presentation
TurningPoint Anywhere Preferences
TurningPoint User Guide 103
Anywhere
Charts
This section enables the user to view and change the chart preferences.
Chart Colors
Determines the colors that are displayed in each chart. Click a color to open the color palette and select a new color.
Chart Labels
Determines if Answer Text or Bullets will be displayed in the chart labels and legends.
Chart Values
Determines whether a Response Count (number of participants) or a percentage is displayed. There are three formats for displaying the percentage: 0%, 0.0% and 0.00%.
Default Chart Type
Determines the default chart that is used for the presentation.
Response Divisor
Determines whether the divisor used to calculate the percentages on a multiple response question will be:
• the total number of responses received (responses)
• the total number of participants in the session’s participant list
• the total number of devices that responded
Show Results
When checked, a chart is displayed when polling is closed.
TurningPoint User Guide 104
Anywhere
Competitions
This section enables the user to view and change the preferences for competition.
Fastest Responders
The Fastest Responders preferences determine what type of information is displayed and how many participants are displayed.
• Display Correct Responders Only - Only participants who responded correctly to the previous question slide will be displayed.
• Participant Information - Select the type of participant information to be displayed from the drop-down menu.
• Participant Count - Select the number of participants to be displayed from the drop-down menu.
Participant Scores
The Participant Scores preferences determine what type of information is displayed, how many participants are displayed and how the scores are calculated.
• Participant Information - Select the type of participant information to be displayed from the drop-down menu.
• Participant Count - Select the number of participants to be displayed from the drop-down menu.
• Score Calculation - Select whether the points displayed are Cumulative or Single from the drop-down menu. Cumulative points are the total points earned up to that point in the presentation. Single points are only the points earned on the previous question slide.
Team Scores
The Team Scores preferences determine how many teams are displayed and how the scores are calculated.
• Include Teams with Less Than 1 Point - When checked, teams that have zero or negative points will be displayed on the slide.
• Team Display Count - Select the number of teams to be displayed from the drop-down menu.
• Score Calculation - Select wether the points displayed are cumulative or single from the drop-down menu. Cumulative points are the total points earned up to that point in the presentation. Single points are only the points earned on the previous question slide.
• Include Non-Responders - When checked, participants who have been active in the session but did not respond to a particular question(s) will be counted as a response for their team and scored as a ‘zero.’
TurningPoint User Guide 105
Anywhere
PresentationThis section enables the user to view and change various presentation preferences.
Accept First Response Only
When checked, TurningPoint only accepts the first response sent by each participant.
Countdown Timer
Determines if a countdown timer will be displayed.
• Countdown Seconds - Set the number of seconds a countdown timer will display. The acceptable range is 1 - 999. The default is set at 30 seconds.
Include Screenshots
When checked, the screenshots are automatically saved with each session for reports and session editing. For more information on how to extract screenshots, see Extracting Session Information on page 205.
Point Values
Determines the correct and incorrect point values.
• Correct - The point value of the correct answer(s) can be set by entering a value in the box provided.
• Incorrect - The point value of the incorrect answer can be set by entering a value in the box provided.
Quick Poll Answers
Determines the default number of answer choices for a Quick Poll question.
Quick Poll Font
Determines the font on the Quick Poll question display.
Bullet Format
Determines the type of answer bullets. The available options include: alphabetic uppercase [A, B, C, D], alphabetic lowercase [a, b, c, d], numeric starting at 1 [1, 2, 3, 4] or numeric starting at 0 [0, 1, 2, 3].
Quick Poll Multiple Responses
Multiple responses allow participants to send more than one response to a question. When this box is checked the following options may be set: number of responses, allow duplicates and all or nothing scoring.
TurningPoint User Guide 106
Anywhere
• Number of Responses - Select the number of responses allowed for each participant from the drop-down menu.
• Allow Duplicates - When checked, the participants are allowed to select the same answer choice more than once.
• All or Nothing Scoring - When checked, the participant must choose each correct answer to receive points.
Response Grid
When checked, the selected response grid type is displayed each time polling is open in the PowerPoint Polling environment. The following settings are available for Response Grids.
• Response Grid Type - Determines the default Response Grid. There are three Response Grids:
• The table grid displays numbered boxes that represent each participant in the participant list. If polling with an auto list, the number of boxes displayed is determined by the number of participants responding.
• The response grid displays the participant name by default. As the participants respond, the corresponding box will change color. If polling with an auto list, it is recommended to change the response grid text to Device ID Only in the preferences. As the participants respond a Device ID will appear in the box.
• The non-response grid displays the participant name by default. As the participants respond, the corresponding box will be removed. If polling with an auto list it, is recommended to change the response grid text to Device ID Only in the preferences.
• Response Grid Text - Determines what participant information is displayed.
• Rotation Interval - Determines the number of seconds a Response/Non-Response Grid will pause between intervals. The acceptable range is two to ten seconds. The default is set at four.
• Font Size - Determines the font size for the text displayed on the response grids.
• Starting Cell Color - Determines the Response/Non-Response Grid starting color.
• First Response Color - Determines the color of the cell when a participant submits a response.
• Second Response Color - Determines the color of the cell when a participant submits another response.
• Third Response Color - Determines the color of the cell when a participant submits another response for the third time.
Show Question List
The question list is displayed in a window beneath the Anywhere Polling showbar.
Show Presentation Window
Displays the polling questions in a resizable window. The show presentation window only applies if a question list is loaded.
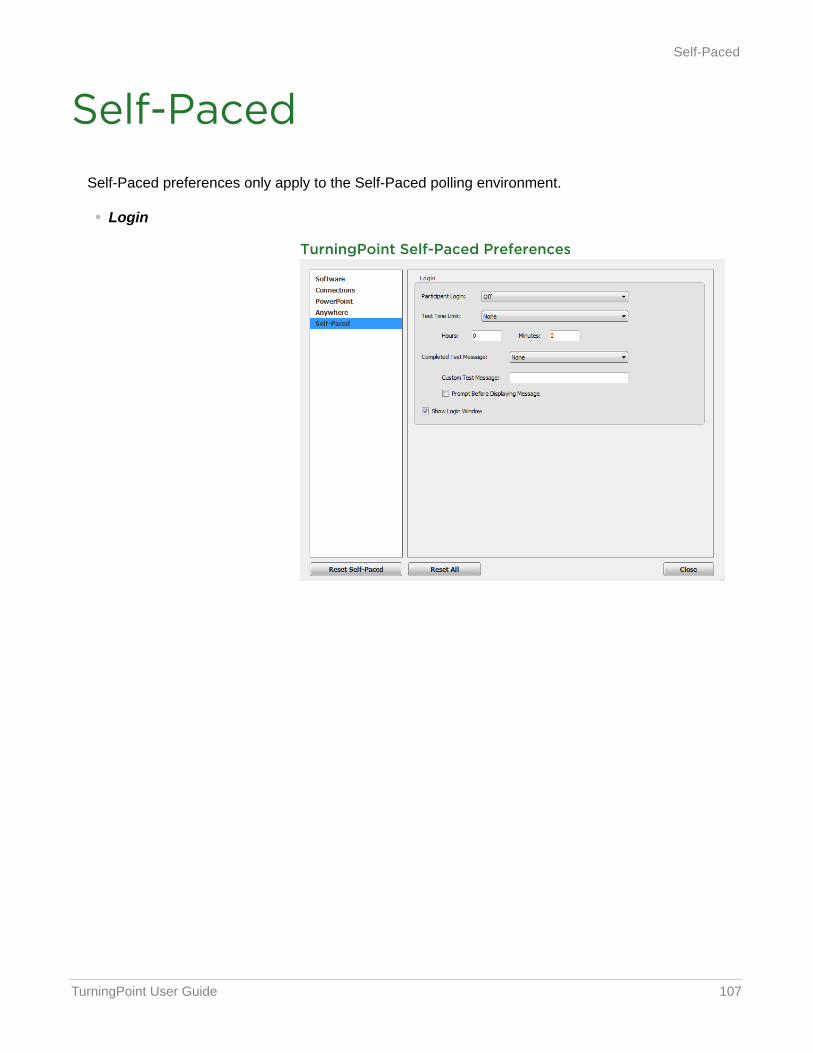
TurningPoint User Guide 107
Self-Paced
Self-PacedSelf-Paced preferences only apply to the Self-Paced polling environment.
• Login
TurningPoint Self-Paced Preferences
TurningPoint User Guide 108
Self-Paced
Login
This section enables the user to view and change the Self-Paced Polling preferences.
Participant Login
Determines whether the participants are required to login to the test. There are three login options available from the drop-down menu.
• Off - Does not require the participants to login to the test.
• Required (Default to Previous User ID on Card) - The participant logs in with the current User ID stored in the card.
• Required (Clear Previous User ID on Card) - The participants are required to enter their User ID before logging in.
Test Time Limit
There are three time limit options available from the drop-down menu.
• None - The test will have no timer and polling must be closed manually.
• Set Duration - Enter the hours and/or minutes for the length of the test. Polling will automatically close at this time.
• End Time - Set a specific end time for the test. Polling will automatically close at this time.
Completed Test Message
A completed test message can be sent to the participants. Different grade options are available from the drop-down menu along with a Custom option.
• Custom Text Message - If Custom is selected as the completed test message, enter text for the message in the box provided.
• Prompt Before Displaying Message - Allows participants to determine if the completed test message is displayed.
Show Login Window
Displays the Login window when Accept Logins is clicked, otherwise the Participant Login, Test Time Limit and Completed Test Message preferences will be observed.

TurningPoint User Guide 109
5 PowerPoint Polling
This chapter covers the following sections of the PowerPoint Polling environment:
• Content
• Tools
• Polling
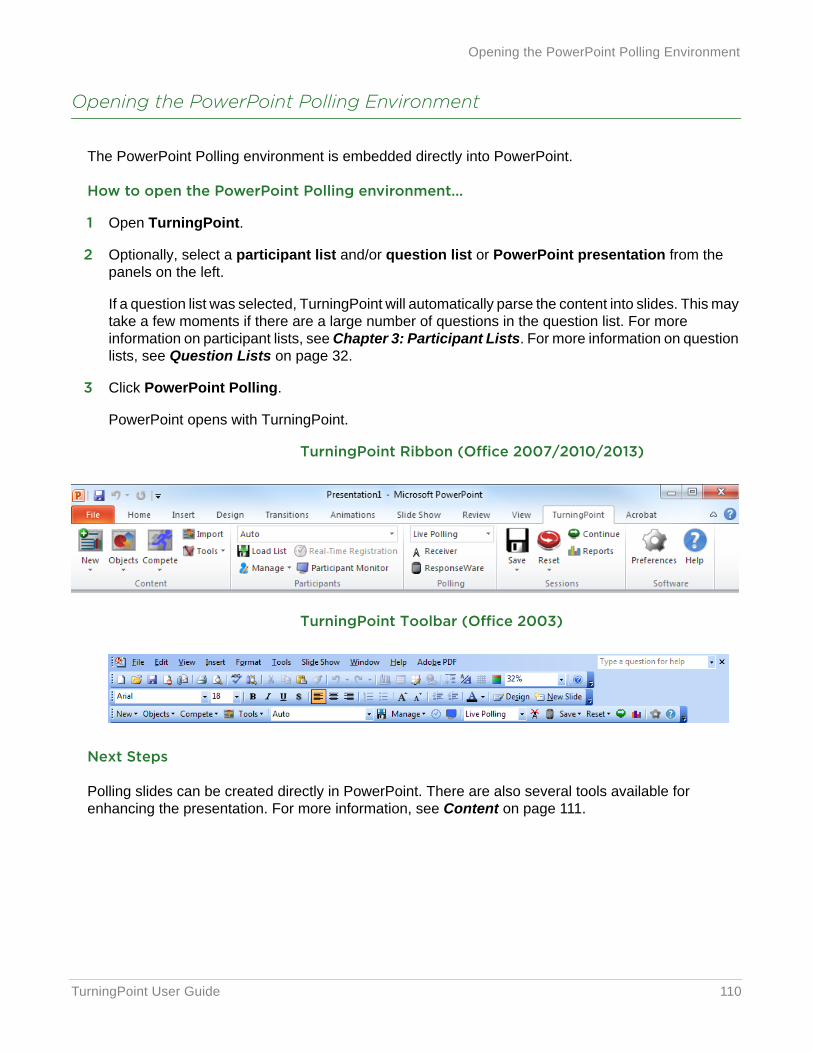
TurningPoint User Guide 110
Opening the PowerPoint Polling Environment
Opening the PowerPoint Polling Environment
The PowerPoint Polling environment is embedded directly into PowerPoint.
How to open the PowerPoint Polling environment...
1 Open TurningPoint.
2 Optionally, select a participant list and/or question list or PowerPoint presentation from the panels on the left.
If a question list was selected, TurningPoint will automatically parse the content into slides. This may take a few moments if there are a large number of questions in the question list. For more information on participant lists, see Chapter 3: Participant Lists. For more information on question lists, see Question Lists on page 32.
3 Click PowerPoint Polling.
PowerPoint opens with TurningPoint.
TurningPoint Ribbon (Office 2007/2010/2013)
TurningPoint Toolbar (Office 2003)
Next Steps
Polling slides can be created directly in PowerPoint. There are also several tools available for enhancing the presentation. For more information, see Content on page 111.
TurningPoint User Guide 111
Content
ContentPowerPoint Polling content is simply a PowerPoint slide with the ability to dynamically display information based on the responses from the participants.
This section explains:
• Slide Types and Slide Preferences
• Objects
• Competition
• Import
• Tools
This section also explains the different ways to create polling content:
• Inserting a Polling Slide
• Converting a PowerPoint Slide into a Multiple Choice Polling Slide
• Question Lists
Inserting a Polling Slide
Creating content in PowerPoint is similar to the way content was created in previous versions of TurningPoint software.
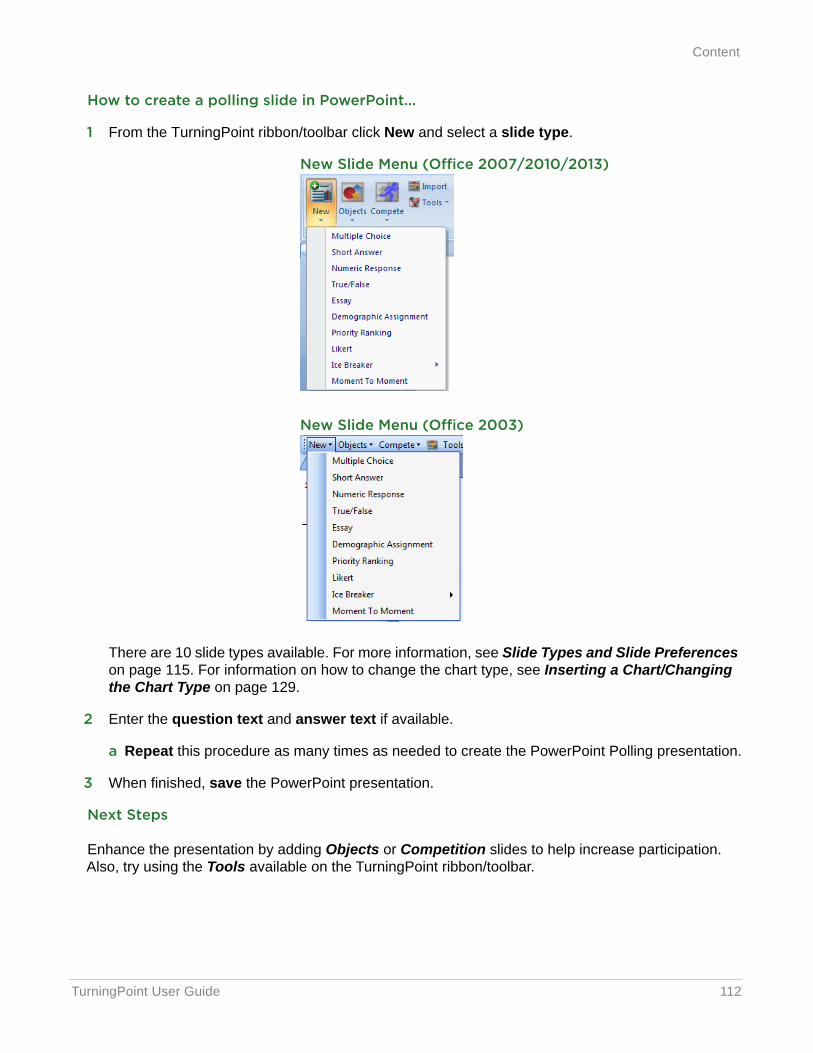
TurningPoint User Guide 112
Content
How to create a polling slide in PowerPoint...
1 From the TurningPoint ribbon/toolbar click New and select a slide type.
New Slide Menu (Office 2007/2010/2013)
New Slide Menu (Office 2003)
There are 10 slide types available. For more information, see Slide Types and Slide Preferences on page 115. For information on how to change the chart type, see Inserting a Chart/Changing the Chart Type on page 129.
2 Enter the question text and answer text if available.
a Repeat this procedure as many times as needed to create the PowerPoint Polling presentation.
3 When finished, save the PowerPoint presentation.
Next Steps
Enhance the presentation by adding Objects or Competition slides to help increase participation. Also, try using the Tools available on the TurningPoint ribbon/toolbar.
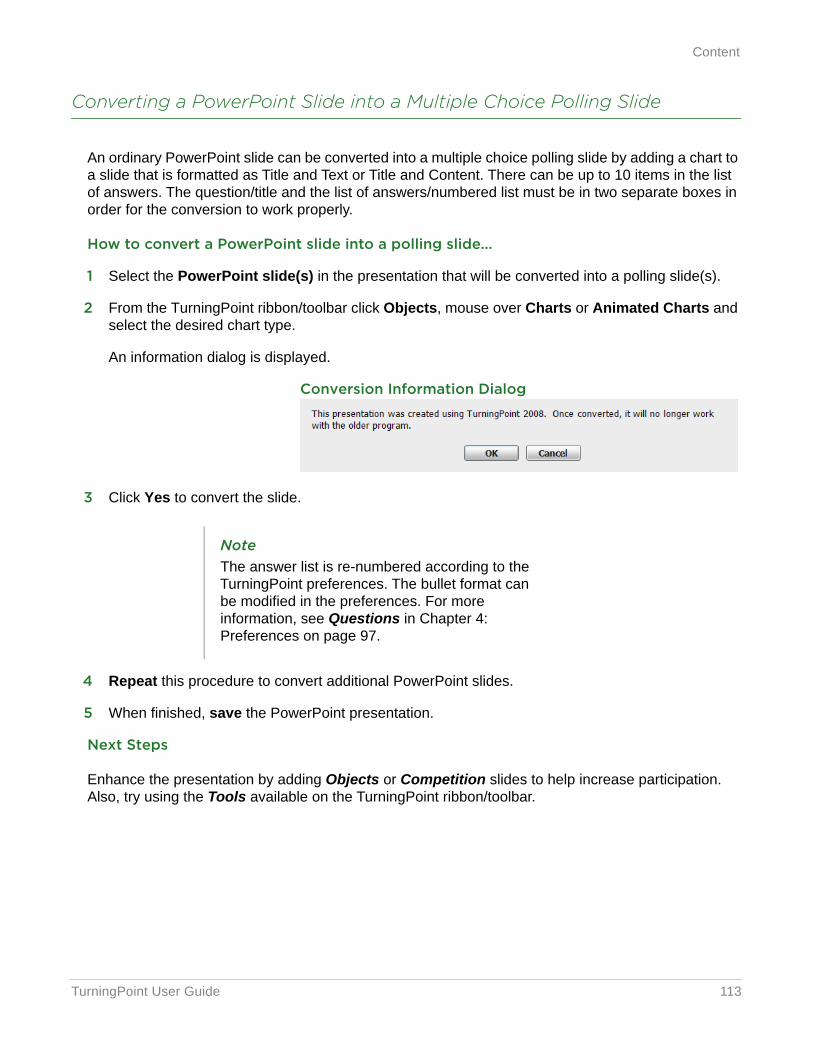
TurningPoint User Guide 113
Content
Converting a PowerPoint Slide into a Multiple Choice Polling Slide
An ordinary PowerPoint slide can be converted into a multiple choice polling slide by adding a chart to a slide that is formatted as Title and Text or Title and Content. There can be up to 10 items in the list of answers. The question/title and the list of answers/numbered list must be in two separate boxes in order for the conversion to work properly.
How to convert a PowerPoint slide into a polling slide...
1 Select the PowerPoint slide(s) in the presentation that will be converted into a polling slide(s).
2 From the TurningPoint ribbon/toolbar click Objects, mouse over Charts or Animated Charts and select the desired chart type.
An information dialog is displayed.
Conversion Information Dialog
3 Click Yes to convert the slide.
4 Repeat this procedure to convert additional PowerPoint slides.
5 When finished, save the PowerPoint presentation.
Next Steps
Enhance the presentation by adding Objects or Competition slides to help increase participation. Also, try using the Tools available on the TurningPoint ribbon/toolbar.
NoteThe answer list is re-numbered according to the TurningPoint preferences. The bullet format can be modified in the preferences. For more information, see Questions in Chapter 4: Preferences on page 97.
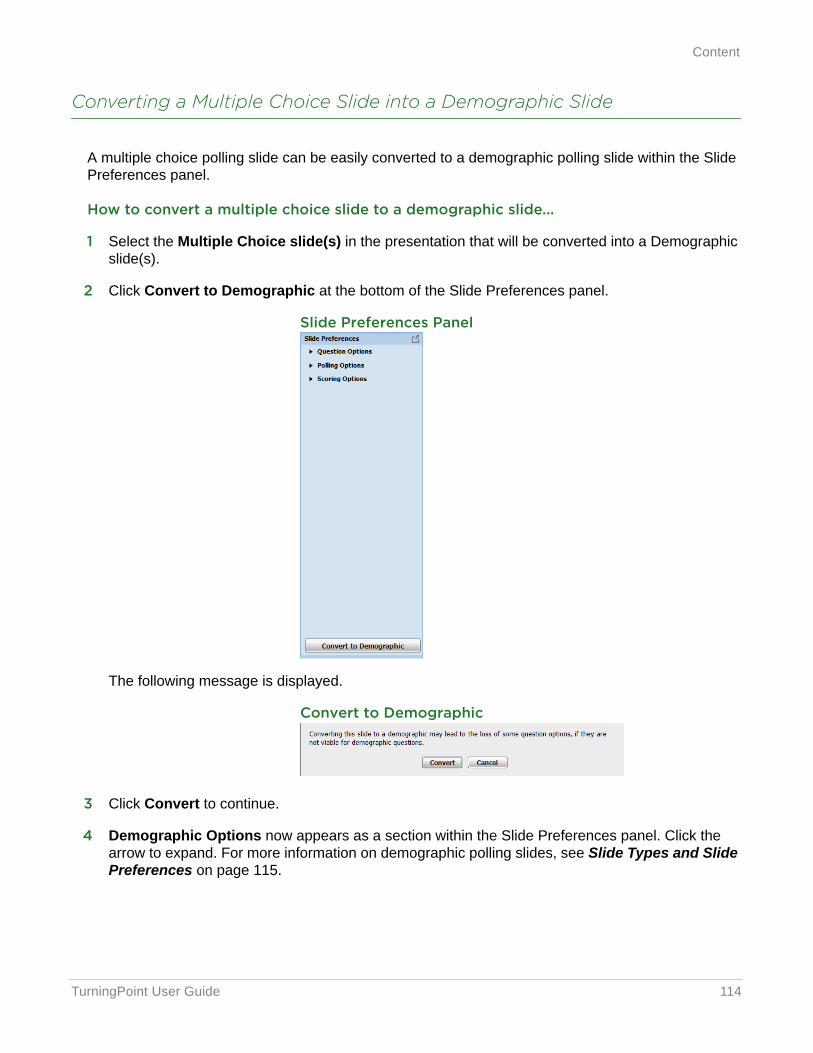
TurningPoint User Guide 114
Content
Converting a Multiple Choice Slide into a Demographic Slide
A multiple choice polling slide can be easily converted to a demographic polling slide within the Slide Preferences panel.
How to convert a multiple choice slide to a demographic slide...
1 Select the Multiple Choice slide(s) in the presentation that will be converted into a Demographic slide(s).
2 Click Convert to Demographic at the bottom of the Slide Preferences panel.
Slide Preferences Panel
The following message is displayed.
Convert to Demographic
3 Click Convert to continue.
4 Demographic Options now appears as a section within the Slide Preferences panel. Click the arrow to expand. For more information on demographic polling slides, see Slide Types and Slide Preferences on page 115.
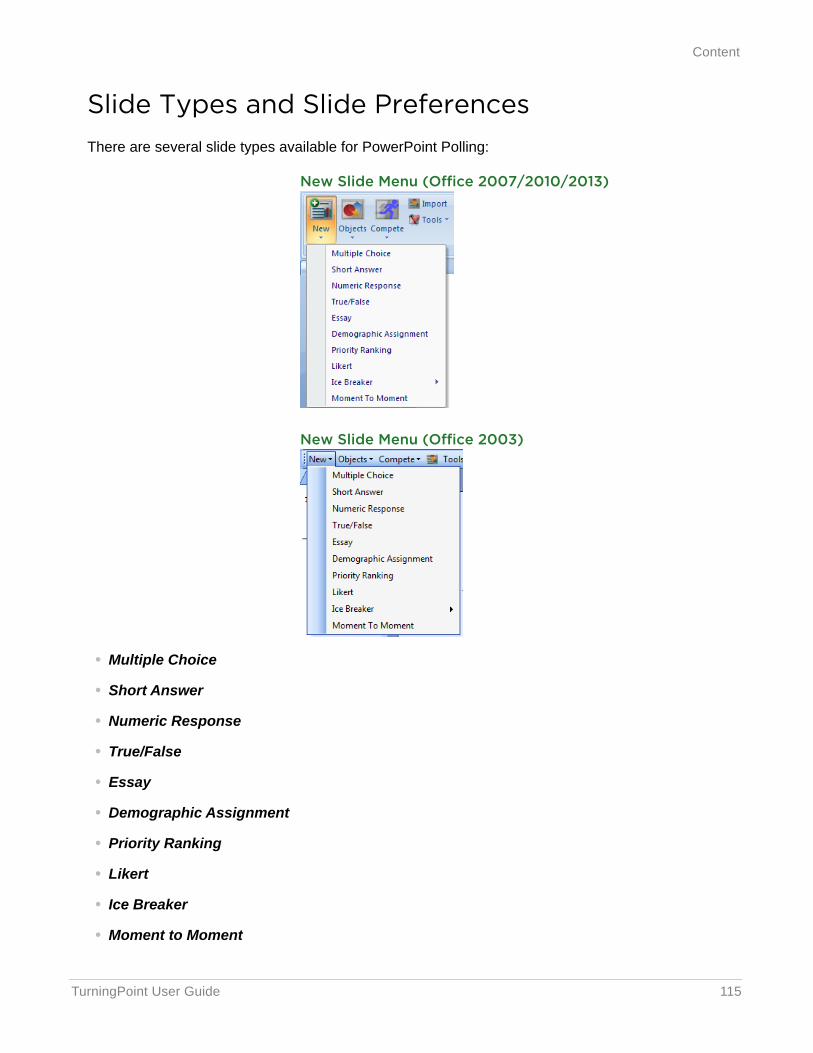
TurningPoint User Guide 115
Content
Slide Types and Slide PreferencesThere are several slide types available for PowerPoint Polling:
New Slide Menu (Office 2007/2010/2013)
New Slide Menu (Office 2003)
• Multiple Choice
• Short Answer
• Numeric Response
• True/False
• Essay
• Demographic Assignment
• Priority Ranking
• Likert
• Ice Breaker
• Moment to Moment
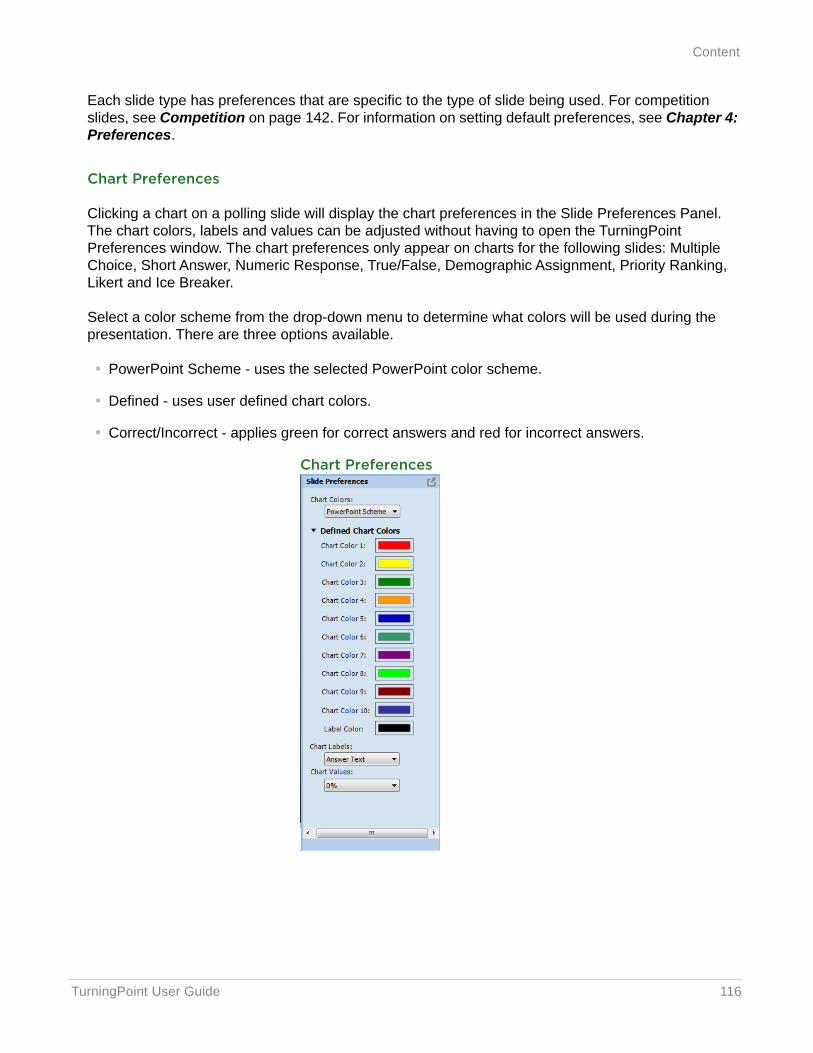
TurningPoint User Guide 116
Content
Each slide type has preferences that are specific to the type of slide being used. For competition slides, see Competition on page 142. For information on setting default preferences, see Chapter 4: Preferences.
Chart Preferences
Clicking a chart on a polling slide will display the chart preferences in the Slide Preferences Panel. The chart colors, labels and values can be adjusted without having to open the TurningPoint Preferences window. The chart preferences only appear on charts for the following slides: Multiple Choice, Short Answer, Numeric Response, True/False, Demographic Assignment, Priority Ranking, Likert and Ice Breaker.
Select a color scheme from the drop-down menu to determine what colors will be used during the presentation. There are three options available.
• PowerPoint Scheme - uses the selected PowerPoint color scheme.
• Defined - uses user defined chart colors.
• Correct/Incorrect - applies green for correct answers and red for incorrect answers.
Chart Preferences
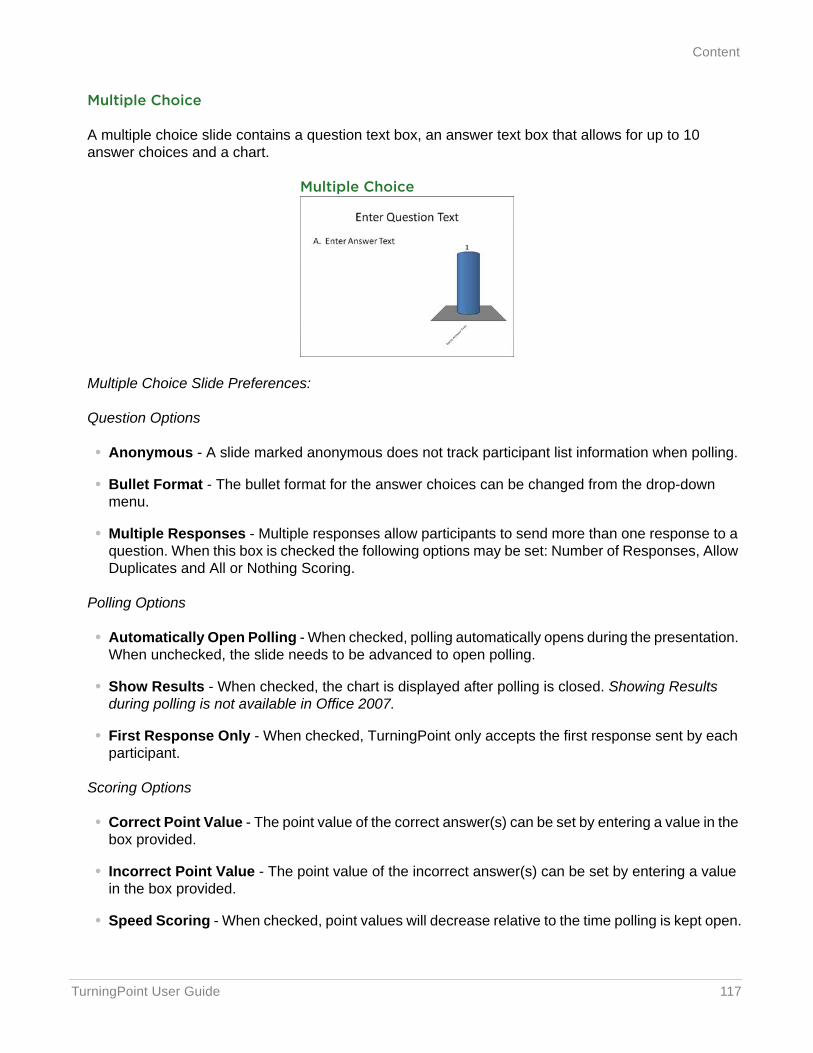
TurningPoint User Guide 117
Content
Multiple Choice
A multiple choice slide contains a question text box, an answer text box that allows for up to 10 answer choices and a chart.
Multiple Choice
Multiple Choice Slide Preferences:
Question Options
• Anonymous - A slide marked anonymous does not track participant list information when polling.
• Bullet Format - The bullet format for the answer choices can be changed from the drop-down menu.
• Multiple Responses - Multiple responses allow participants to send more than one response to a question. When this box is checked the following options may be set: Number of Responses, Allow Duplicates and All or Nothing Scoring.
Polling Options
• Automatically Open Polling - When checked, polling automatically opens during the presentation. When unchecked, the slide needs to be advanced to open polling.
• Show Results - When checked, the chart is displayed after polling is closed. Showing Results during polling is not available in Office 2007.
• First Response Only - When checked, TurningPoint only accepts the first response sent by each participant.
Scoring Options
• Correct Point Value - The point value of the correct answer(s) can be set by entering a value in the box provided.
• Incorrect Point Value - The point value of the incorrect answer(s) can be set by entering a value in the box provided.
• Speed Scoring - When checked, point values will decrease relative to the time polling is kept open.
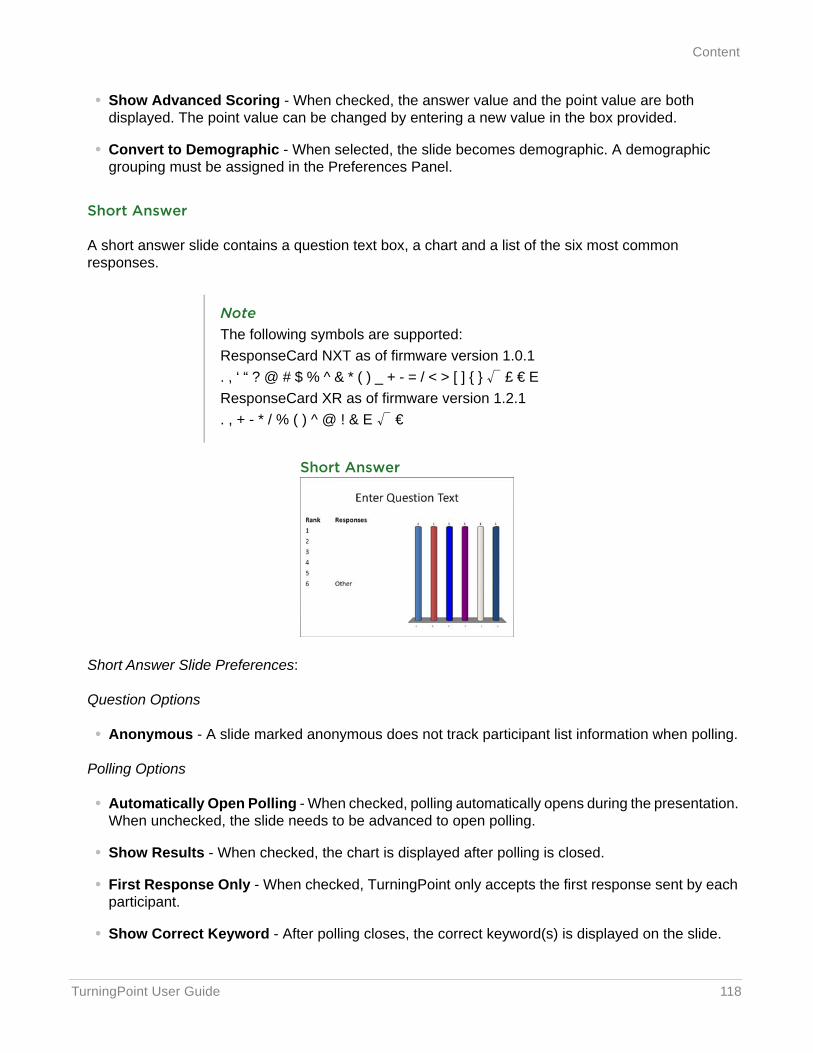
TurningPoint User Guide 118
Content
• Show Advanced Scoring - When checked, the answer value and the point value are both displayed. The point value can be changed by entering a new value in the box provided.
• Convert to Demographic - When selected, the slide becomes demographic. A demographic grouping must be assigned in the Preferences Panel.
Short Answer
A short answer slide contains a question text box, a chart and a list of the six most common responses.
Short Answer
Short Answer Slide Preferences:
Question Options
• Anonymous - A slide marked anonymous does not track participant list information when polling.
Polling Options
• Automatically Open Polling - When checked, polling automatically opens during the presentation. When unchecked, the slide needs to be advanced to open polling.
• Show Results - When checked, the chart is displayed after polling is closed.
• First Response Only - When checked, TurningPoint only accepts the first response sent by each participant.
• Show Correct Keyword - After polling closes, the correct keyword(s) is displayed on the slide.
NoteThe following symbols are supported:ResponseCard NXT as of firmware version 1.0.1. , ‘ “ ? @ # $ % ^ & * ( ) _ + - = / < > [ ] { } £ € EResponseCard XR as of firmware version 1.2.1. , + - * / % ( ) ^ @ ! & E €
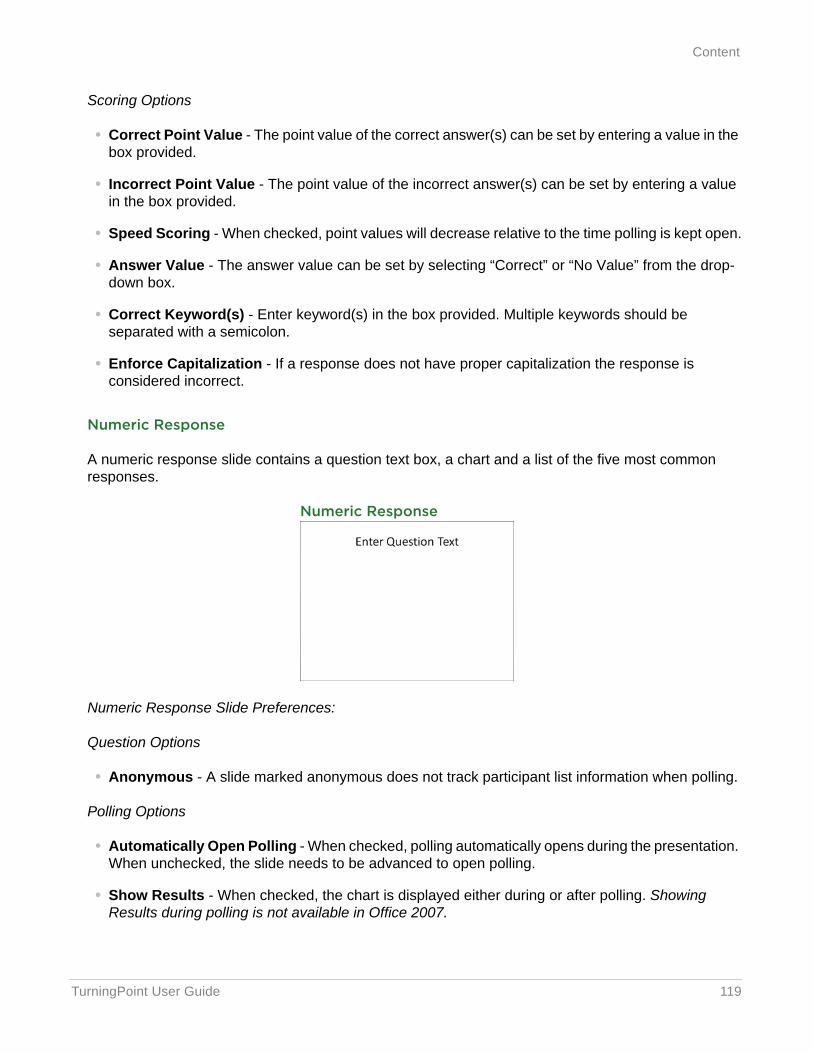
TurningPoint User Guide 119
Content
Scoring Options
• Correct Point Value - The point value of the correct answer(s) can be set by entering a value in the box provided.
• Incorrect Point Value - The point value of the incorrect answer(s) can be set by entering a value in the box provided.
• Speed Scoring - When checked, point values will decrease relative to the time polling is kept open.
• Answer Value - The answer value can be set by selecting “Correct” or “No Value” from the drop-down box.
• Correct Keyword(s) - Enter keyword(s) in the box provided. Multiple keywords should be separated with a semicolon.
• Enforce Capitalization - If a response does not have proper capitalization the response is considered incorrect.
Numeric Response
A numeric response slide contains a question text box, a chart and a list of the five most common responses.
Numeric Response
Numeric Response Slide Preferences:
Question Options
• Anonymous - A slide marked anonymous does not track participant list information when polling.
Polling Options
• Automatically Open Polling - When checked, polling automatically opens during the presentation. When unchecked, the slide needs to be advanced to open polling.
• Show Results - When checked, the chart is displayed either during or after polling. Showing Results during polling is not available in Office 2007.
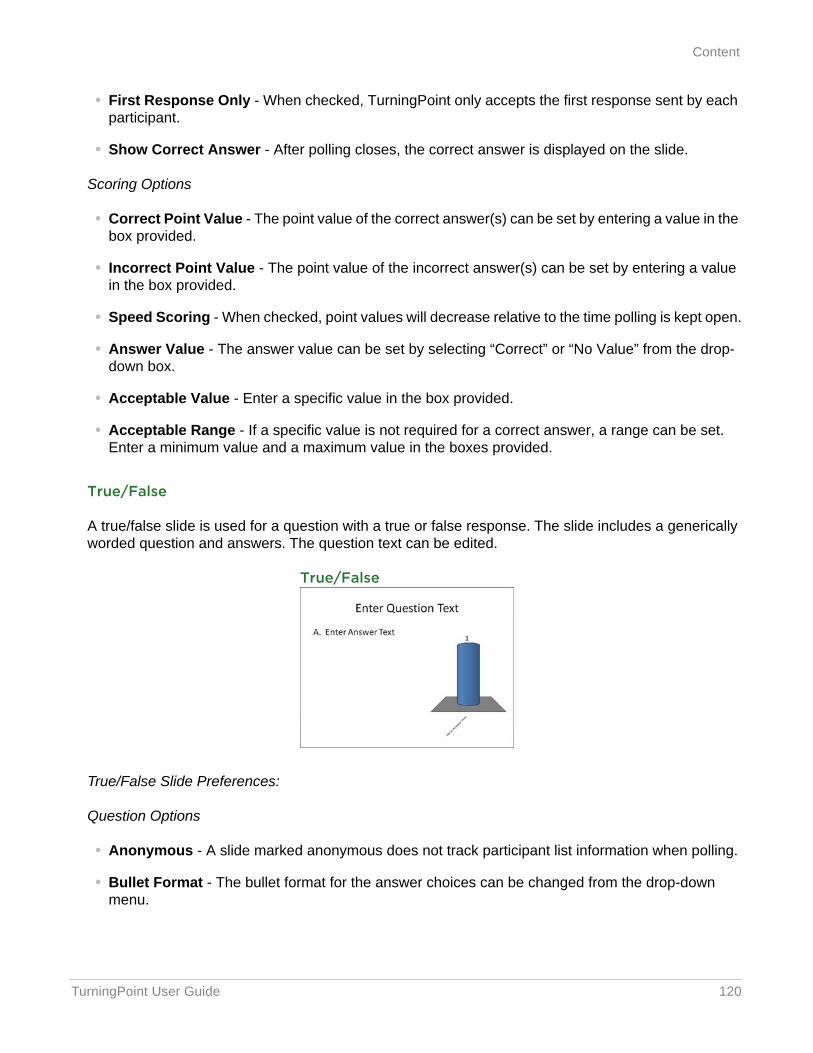
TurningPoint User Guide 120
Content
• First Response Only - When checked, TurningPoint only accepts the first response sent by each participant.
• Show Correct Answer - After polling closes, the correct answer is displayed on the slide.
Scoring Options
• Correct Point Value - The point value of the correct answer(s) can be set by entering a value in the box provided.
• Incorrect Point Value - The point value of the incorrect answer(s) can be set by entering a value in the box provided.
• Speed Scoring - When checked, point values will decrease relative to the time polling is kept open.
• Answer Value - The answer value can be set by selecting “Correct” or “No Value” from the drop-down box.
• Acceptable Value - Enter a specific value in the box provided.
• Acceptable Range - If a specific value is not required for a correct answer, a range can be set. Enter a minimum value and a maximum value in the boxes provided.
True/False
A true/false slide is used for a question with a true or false response. The slide includes a generically worded question and answers. The question text can be edited.
True/False
True/False Slide Preferences:
Question Options
• Anonymous - A slide marked anonymous does not track participant list information when polling.
• Bullet Format - The bullet format for the answer choices can be changed from the drop-down menu.
TurningPoint User Guide 121
Content
Polling Options
• Automatically Open Polling - When checked, polling automatically opens during the presentation. When unchecked, the slide needs to be advanced to open polling.
• Show Results - When checked, the chart is displayed either during or after polling. Showing Results during polling is not available in Office 2007.
• First Response Only - When checked, TurningPoint only accepts the first response sent by each participant.
Scoring Options
• Correct Point Value - The point value of the correct answer(s) can be set by entering a value in the box provided.
• Incorrect Point Value - The point value of the incorrect answer(s) can be set by entering a value in the box provided.
• Speed Scoring - When checked, point values will decrease relative to the time polling is kept open.
• Select True or False as the correct answer. A value of No Correct can also be selected if there is no correct answer.
Essay
The essay slide contains a question region to pose a question.
Essay
Essay Slide Preferences:
Question Options
• Anonymous - A slide marked anonymous does not track participant list information when polling.
Scoring Options
• TurningPoint does not score essay slides. Manual score adjustments can be made in Results Manager.
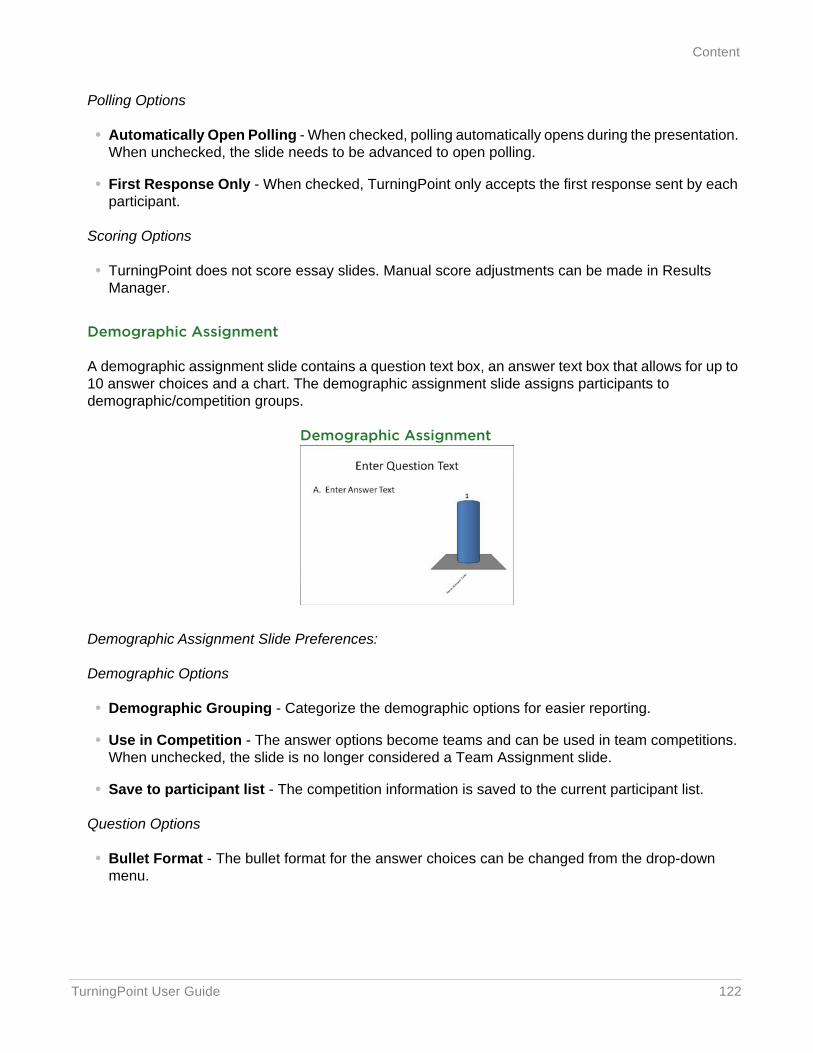
TurningPoint User Guide 122
Content
Polling Options
• Automatically Open Polling - When checked, polling automatically opens during the presentation. When unchecked, the slide needs to be advanced to open polling.
• First Response Only - When checked, TurningPoint only accepts the first response sent by each participant.
Scoring Options
• TurningPoint does not score essay slides. Manual score adjustments can be made in Results Manager.
Demographic Assignment
A demographic assignment slide contains a question text box, an answer text box that allows for up to 10 answer choices and a chart. The demographic assignment slide assigns participants to demographic/competition groups.
Demographic Assignment
Demographic Assignment Slide Preferences:
Demographic Options
• Demographic Grouping - Categorize the demographic options for easier reporting.
• Use in Competition - The answer options become teams and can be used in team competitions. When unchecked, the slide is no longer considered a Team Assignment slide.
• Save to participant list - The competition information is saved to the current participant list.
Question Options
• Bullet Format - The bullet format for the answer choices can be changed from the drop-down menu.
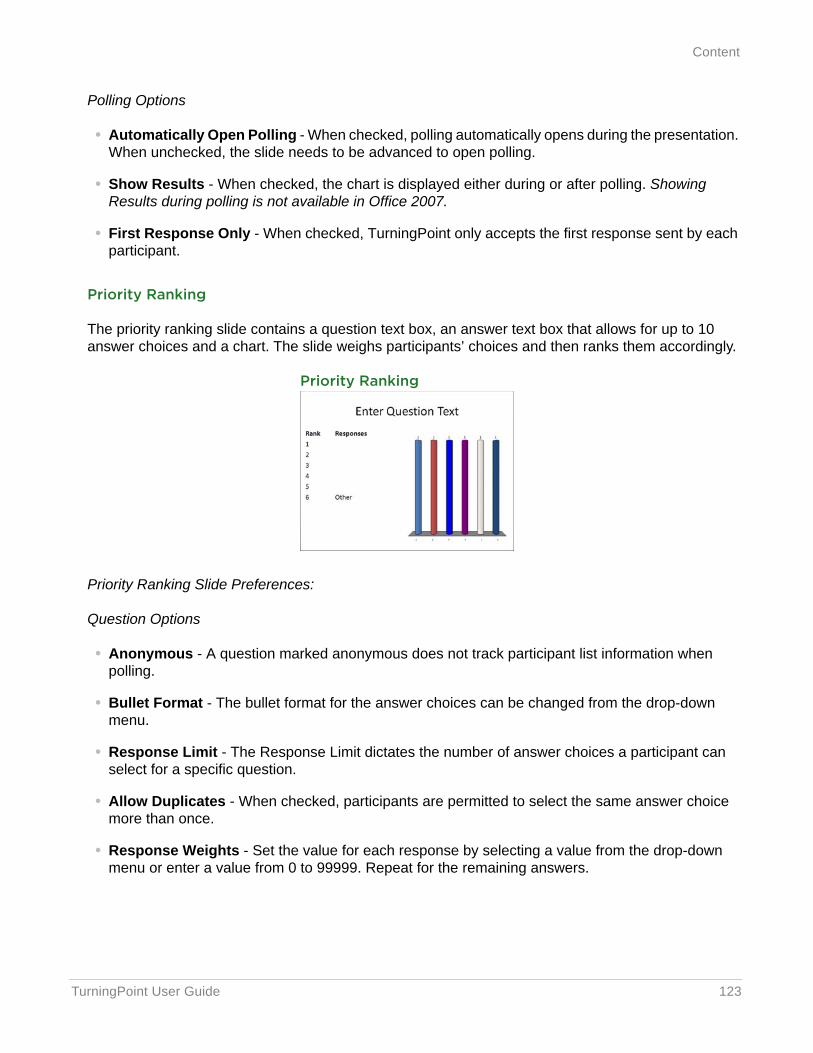
TurningPoint User Guide 123
Content
Polling Options
• Automatically Open Polling - When checked, polling automatically opens during the presentation. When unchecked, the slide needs to be advanced to open polling.
• Show Results - When checked, the chart is displayed either during or after polling. Showing Results during polling is not available in Office 2007.
• First Response Only - When checked, TurningPoint only accepts the first response sent by each participant.
Priority Ranking
The priority ranking slide contains a question text box, an answer text box that allows for up to 10 answer choices and a chart. The slide weighs participants’ choices and then ranks them accordingly.
Priority Ranking
Priority Ranking Slide Preferences:
Question Options
• Anonymous - A question marked anonymous does not track participant list information when polling.
• Bullet Format - The bullet format for the answer choices can be changed from the drop-down menu.
• Response Limit - The Response Limit dictates the number of answer choices a participant can select for a specific question.
• Allow Duplicates - When checked, participants are permitted to select the same answer choice more than once.
• Response Weights - Set the value for each response by selecting a value from the drop-down menu or enter a value from 0 to 99999. Repeat for the remaining answers.
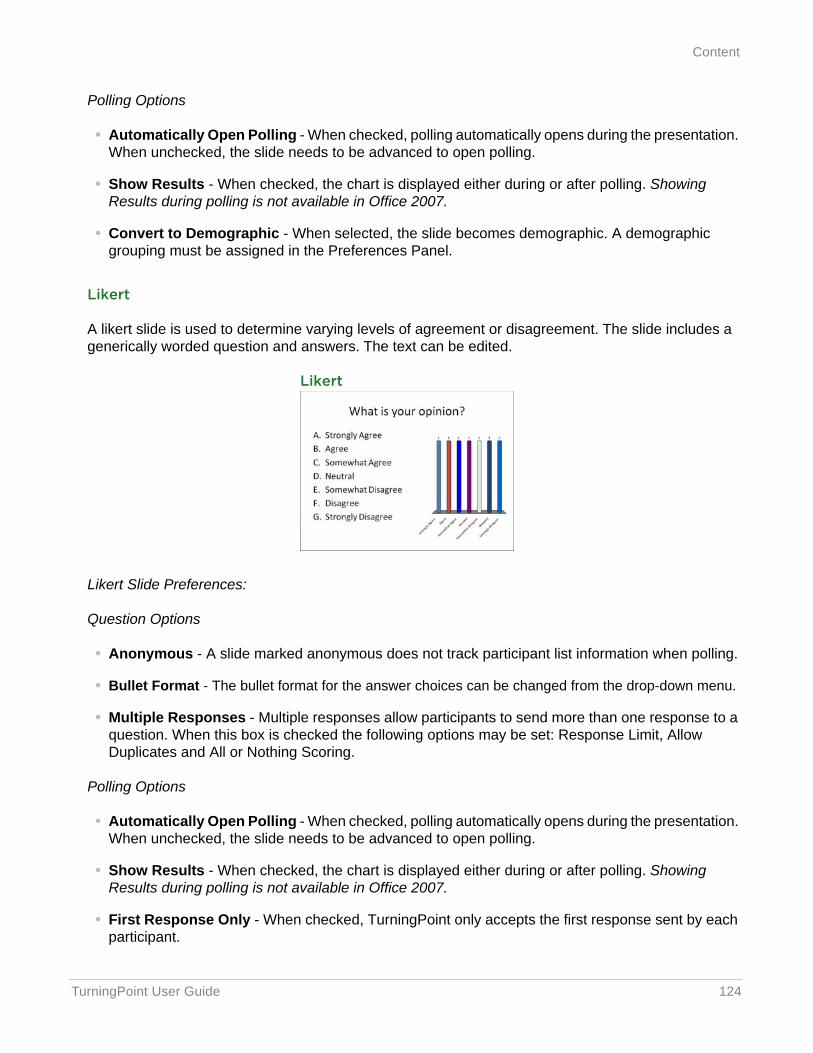
TurningPoint User Guide 124
Content
Polling Options
• Automatically Open Polling - When checked, polling automatically opens during the presentation. When unchecked, the slide needs to be advanced to open polling.
• Show Results - When checked, the chart is displayed either during or after polling. Showing Results during polling is not available in Office 2007.
• Convert to Demographic - When selected, the slide becomes demographic. A demographic grouping must be assigned in the Preferences Panel.
Likert
A likert slide is used to determine varying levels of agreement or disagreement. The slide includes a generically worded question and answers. The text can be edited.
Likert
Likert Slide Preferences:
Question Options
• Anonymous - A slide marked anonymous does not track participant list information when polling.
• Bullet Format - The bullet format for the answer choices can be changed from the drop-down menu.
• Multiple Responses - Multiple responses allow participants to send more than one response to a question. When this box is checked the following options may be set: Response Limit, Allow Duplicates and All or Nothing Scoring.
Polling Options
• Automatically Open Polling - When checked, polling automatically opens during the presentation. When unchecked, the slide needs to be advanced to open polling.
• Show Results - When checked, the chart is displayed either during or after polling. Showing Results during polling is not available in Office 2007.
• First Response Only - When checked, TurningPoint only accepts the first response sent by each participant.
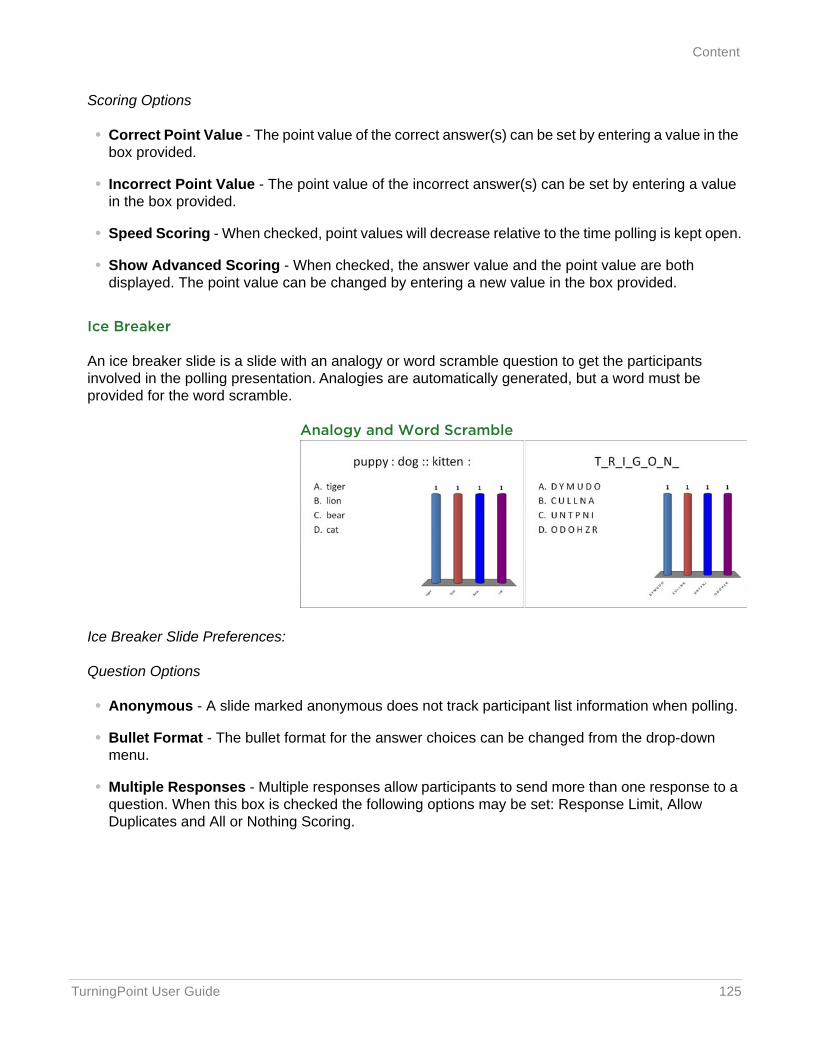
TurningPoint User Guide 125
Content
Scoring Options
• Correct Point Value - The point value of the correct answer(s) can be set by entering a value in the box provided.
• Incorrect Point Value - The point value of the incorrect answer(s) can be set by entering a value in the box provided.
• Speed Scoring - When checked, point values will decrease relative to the time polling is kept open.
• Show Advanced Scoring - When checked, the answer value and the point value are both displayed. The point value can be changed by entering a new value in the box provided.
Ice Breaker
An ice breaker slide is a slide with an analogy or word scramble question to get the participants involved in the polling presentation. Analogies are automatically generated, but a word must be provided for the word scramble.
Analogy and Word Scramble
Ice Breaker Slide Preferences:
Question Options
• Anonymous - A slide marked anonymous does not track participant list information when polling.
• Bullet Format - The bullet format for the answer choices can be changed from the drop-down menu.
• Multiple Responses - Multiple responses allow participants to send more than one response to a question. When this box is checked the following options may be set: Response Limit, Allow Duplicates and All or Nothing Scoring.
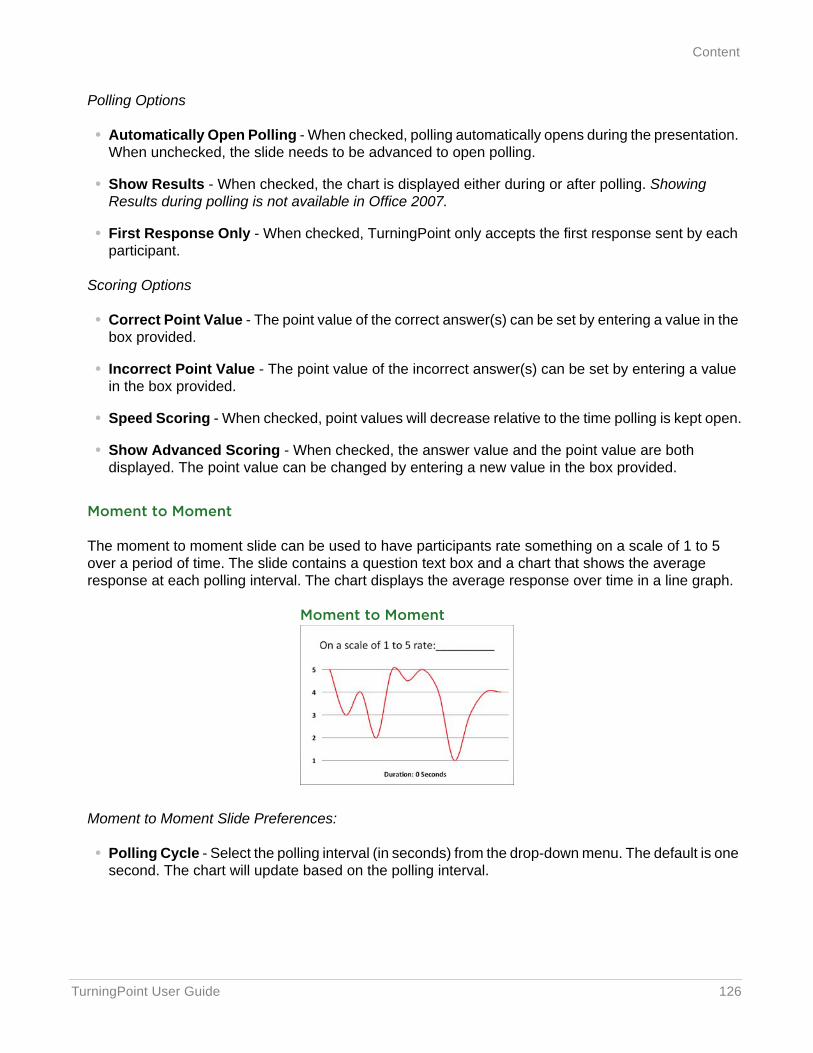
TurningPoint User Guide 126
Content
Polling Options
• Automatically Open Polling - When checked, polling automatically opens during the presentation. When unchecked, the slide needs to be advanced to open polling.
• Show Results - When checked, the chart is displayed either during or after polling. Showing Results during polling is not available in Office 2007.
• First Response Only - When checked, TurningPoint only accepts the first response sent by each participant.
Scoring Options
• Correct Point Value - The point value of the correct answer(s) can be set by entering a value in the box provided.
• Incorrect Point Value - The point value of the incorrect answer(s) can be set by entering a value in the box provided.
• Speed Scoring - When checked, point values will decrease relative to the time polling is kept open.
• Show Advanced Scoring - When checked, the answer value and the point value are both displayed. The point value can be changed by entering a new value in the box provided.
Moment to Moment
The moment to moment slide can be used to have participants rate something on a scale of 1 to 5 over a period of time. The slide contains a question text box and a chart that shows the average response at each polling interval. The chart displays the average response over time in a line graph.
Moment to Moment
Moment to Moment Slide Preferences:
• Polling Cycle - Select the polling interval (in seconds) from the drop-down menu. The default is one second. The chart will update based on the polling interval.
TurningPoint User Guide 127
Content
Objects
Objects may be added to each slide in several ways. This section covers adding objects to a slide through the TurningPoint ribbon/toolbar.
• Objects such as charts, countdown timers, response grids and prompts may be set as default objects that are automatically inserted on each slide. To set default objects, see PowerPoint in Chapter 4: Preferences on page 95 for more information.
• Objects may also be set during question list creation. For more information, see Chapter 2: Content.
• Objects can be added to a slide through the TurningPoint ribbon/toolbar.
There are several types of objects available, this section covers:
• Inserting a Correct Answer Indicator
• Inserting a Chart/Changing the Chart Type
• Inserting an Animated Chart
• Inserting a Countdown Timer
• Inserting a Grid
• Inserting a Prompt
• Inserting a Response Counter
• Inserting Stats
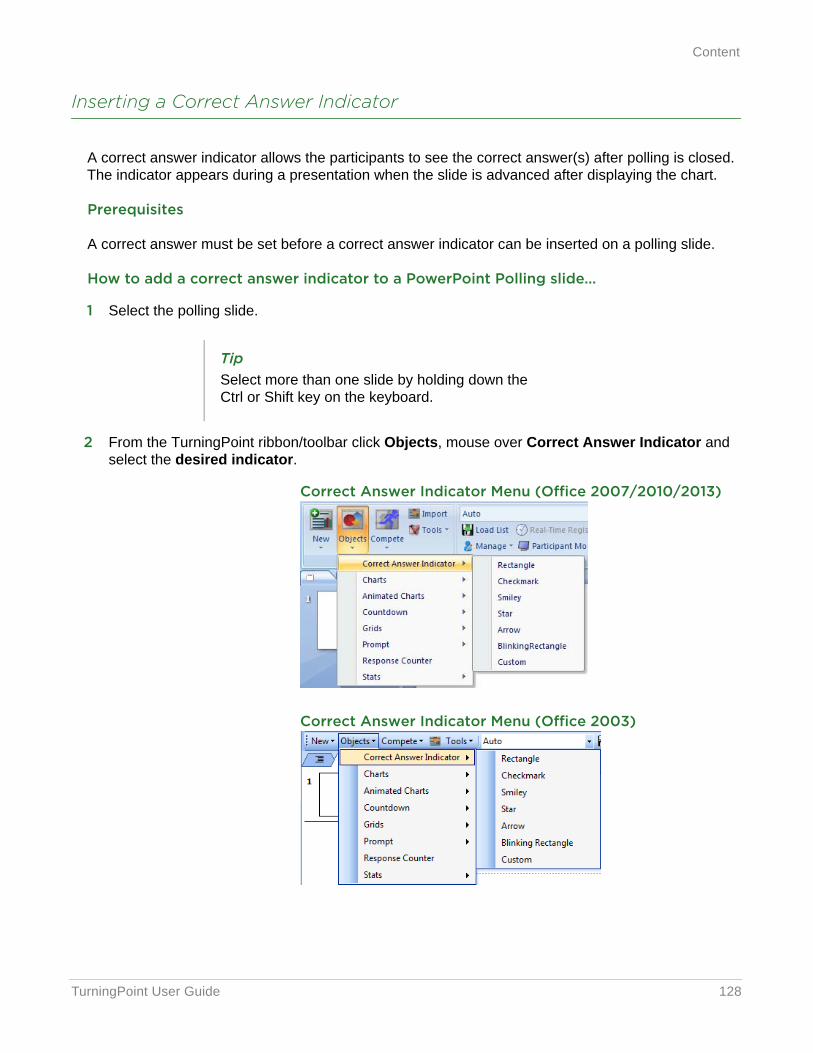
TurningPoint User Guide 128
Content
Inserting a Correct Answer Indicator
A correct answer indicator allows the participants to see the correct answer(s) after polling is closed. The indicator appears during a presentation when the slide is advanced after displaying the chart.
Prerequisites
A correct answer must be set before a correct answer indicator can be inserted on a polling slide.
How to add a correct answer indicator to a PowerPoint Polling slide...
1 Select the polling slide.
2 From the TurningPoint ribbon/toolbar click Objects, mouse over Correct Answer Indicator and select the desired indicator.
Correct Answer Indicator Menu (Office 2007/2010/2013)
Correct Answer Indicator Menu (Office 2003)
TipSelect more than one slide by holding down the Ctrl or Shift key on the keyboard.
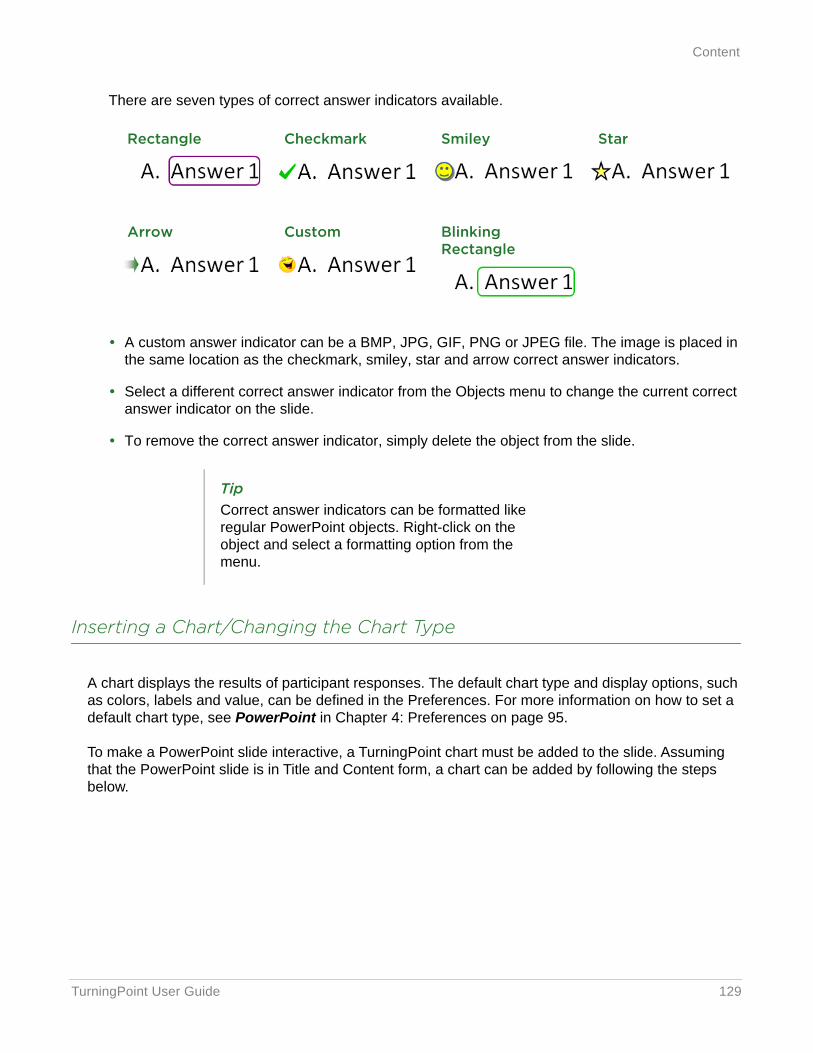
TurningPoint User Guide 129
Content
There are seven types of correct answer indicators available.
• A custom answer indicator can be a BMP, JPG, GIF, PNG or JPEG file. The image is placed in the same location as the checkmark, smiley, star and arrow correct answer indicators.
• Select a different correct answer indicator from the Objects menu to change the current correct answer indicator on the slide.
• To remove the correct answer indicator, simply delete the object from the slide.
Inserting a Chart/Changing the Chart Type
A chart displays the results of participant responses. The default chart type and display options, such as colors, labels and value, can be defined in the Preferences. For more information on how to set a default chart type, see PowerPoint in Chapter 4: Preferences on page 95.
To make a PowerPoint slide interactive, a TurningPoint chart must be added to the slide. Assuming that the PowerPoint slide is in Title and Content form, a chart can be added by following the steps below.
Rectangle Checkmark Smiley Star
Arrow Custom Blinking Rectangle
TipCorrect answer indicators can be formatted like regular PowerPoint objects. Right-click on the object and select a formatting option from the menu.
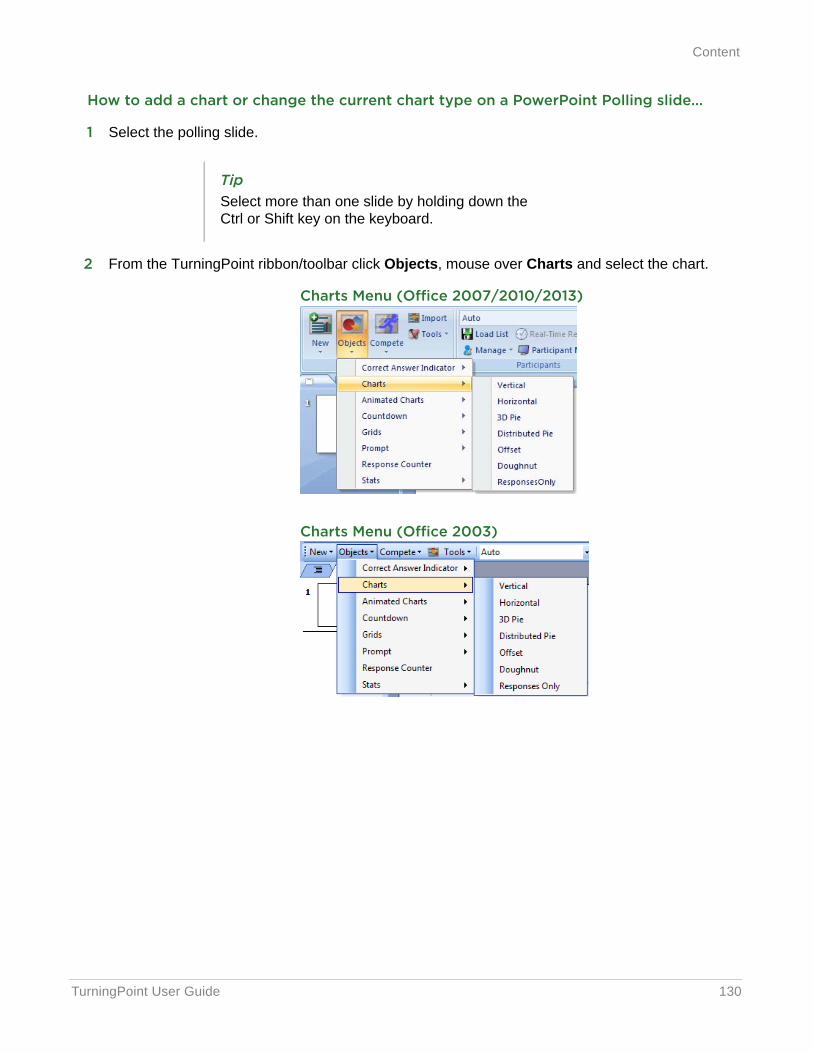
TurningPoint User Guide 130
Content
How to add a chart or change the current chart type on a PowerPoint Polling slide...
1 Select the polling slide.
2 From the TurningPoint ribbon/toolbar click Objects, mouse over Charts and select the chart.
Charts Menu (Office 2007/2010/2013)
Charts Menu (Office 2003)
TipSelect more than one slide by holding down the Ctrl or Shift key on the keyboard.
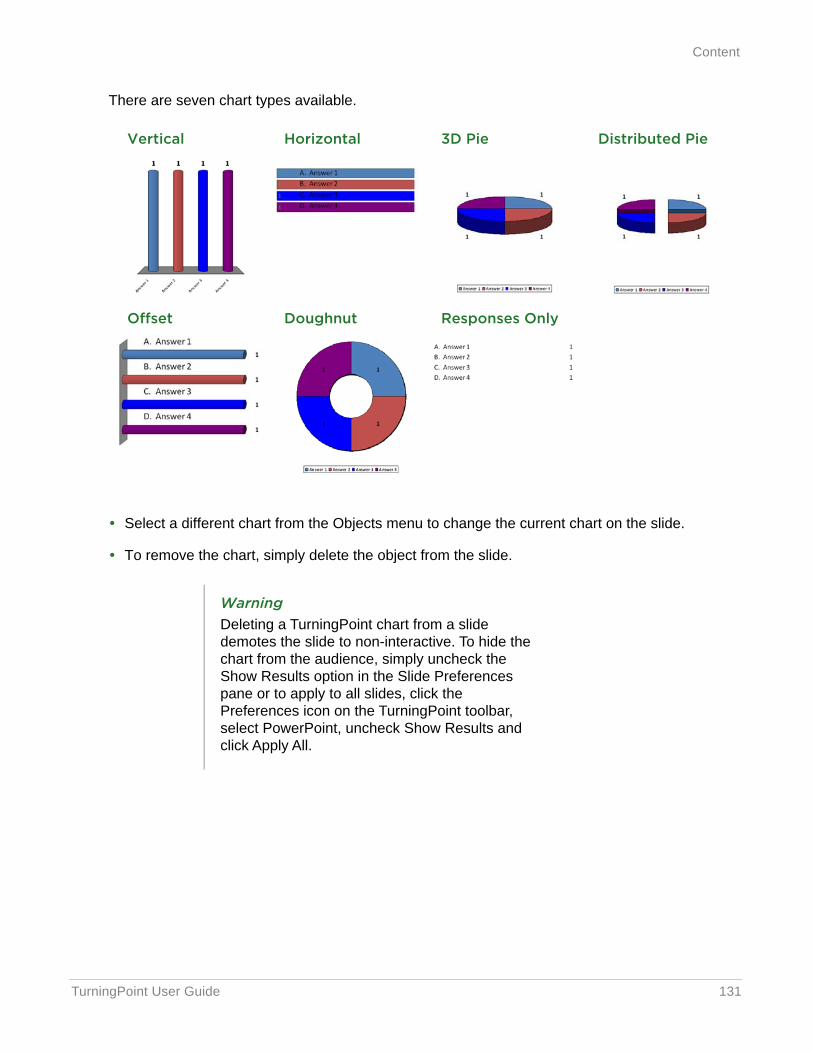
TurningPoint User Guide 131
Content
There are seven chart types available.
• Select a different chart from the Objects menu to change the current chart on the slide.
• To remove the chart, simply delete the object from the slide.
Vertical Horizontal 3D Pie Distributed Pie
Offset Doughnut Responses Only
WarningDeleting a TurningPoint chart from a slide demotes the slide to non-interactive. To hide the chart from the audience, simply uncheck the Show Results option in the Slide Preferences pane or to apply to all slides, click the Preferences icon on the TurningPoint toolbar, select PowerPoint, uncheck Show Results and click Apply All.
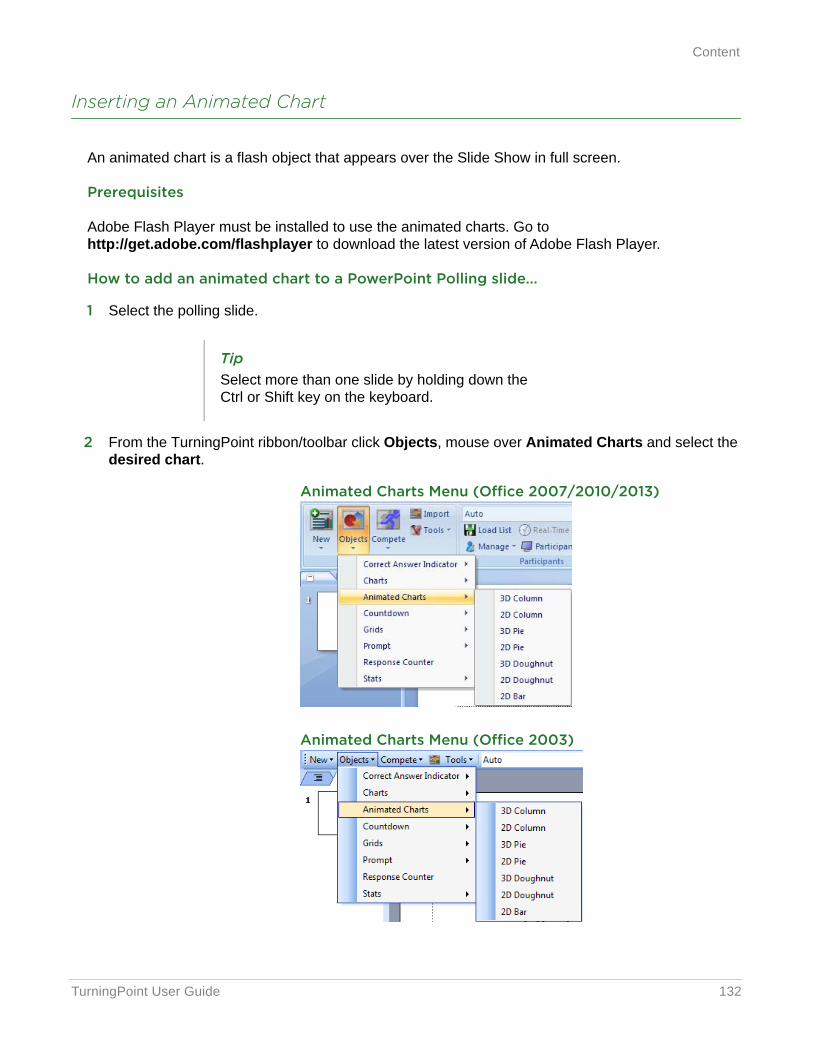
TurningPoint User Guide 132
Content
Inserting an Animated Chart
An animated chart is a flash object that appears over the Slide Show in full screen.
Prerequisites
Adobe Flash Player must be installed to use the animated charts. Go to http://get.adobe.com/flashplayer to download the latest version of Adobe Flash Player.
How to add an animated chart to a PowerPoint Polling slide...
1 Select the polling slide.
2 From the TurningPoint ribbon/toolbar click Objects, mouse over Animated Charts and select the desired chart.
Animated Charts Menu (Office 2007/2010/2013)
Animated Charts Menu (Office 2003)
TipSelect more than one slide by holding down the Ctrl or Shift key on the keyboard.
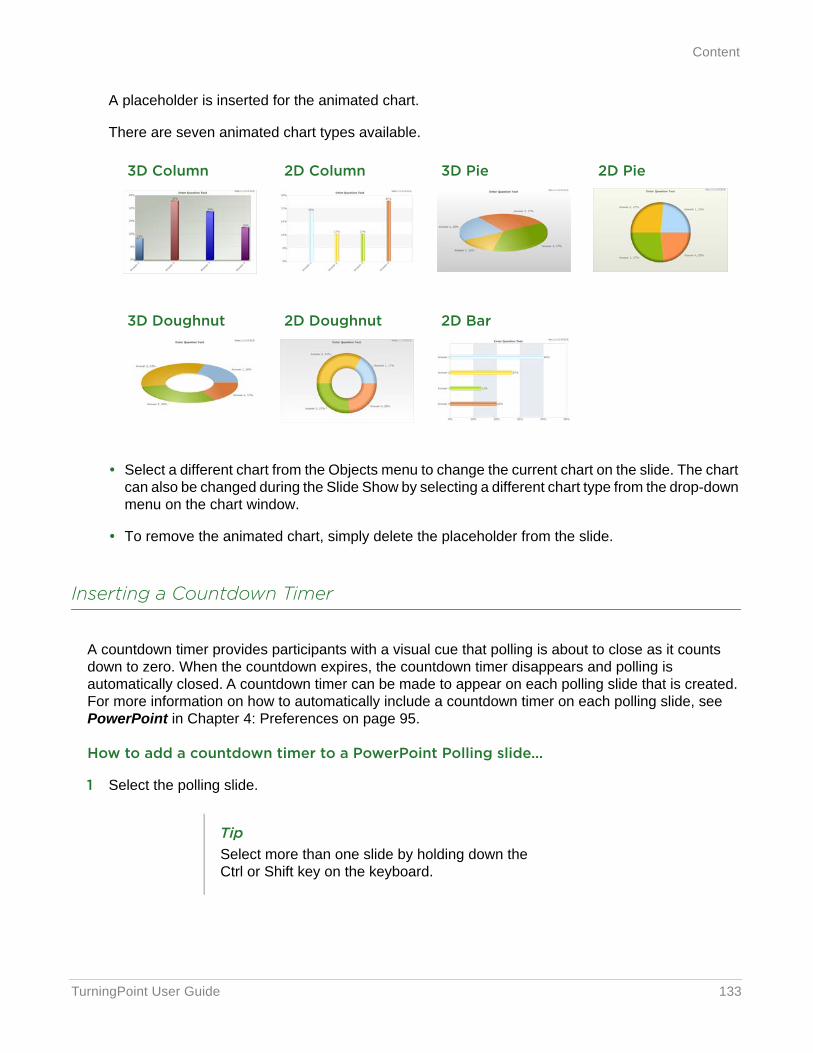
TurningPoint User Guide 133
Content
A placeholder is inserted for the animated chart.
There are seven animated chart types available.
• Select a different chart from the Objects menu to change the current chart on the slide. The chart can also be changed during the Slide Show by selecting a different chart type from the drop-down menu on the chart window.
• To remove the animated chart, simply delete the placeholder from the slide.
Inserting a Countdown Timer
A countdown timer provides participants with a visual cue that polling is about to close as it counts down to zero. When the countdown expires, the countdown timer disappears and polling is automatically closed. A countdown timer can be made to appear on each polling slide that is created. For more information on how to automatically include a countdown timer on each polling slide, see PowerPoint in Chapter 4: Preferences on page 95.
How to add a countdown timer to a PowerPoint Polling slide...
1 Select the polling slide.
3D Column 2D Column 3D Pie 2D Pie
3D Doughnut 2D Doughnut 2D Bar
TipSelect more than one slide by holding down the Ctrl or Shift key on the keyboard.
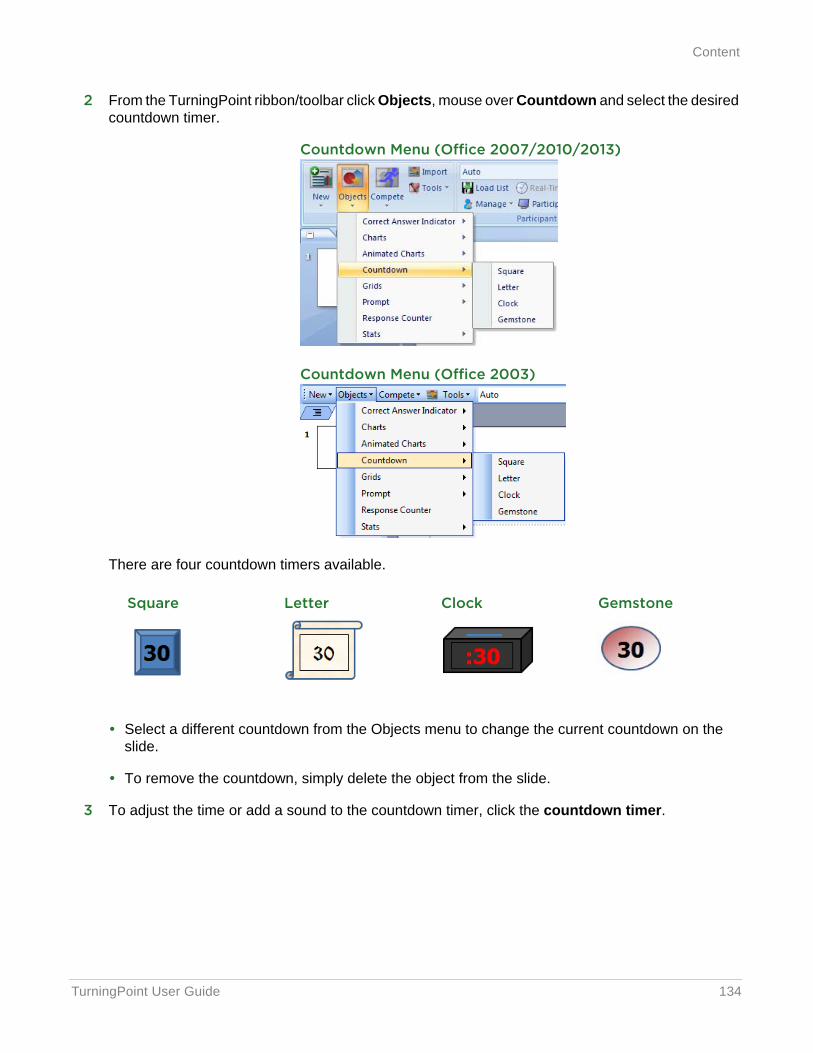
TurningPoint User Guide 134
Content
2 From the TurningPoint ribbon/toolbar click Objects, mouse over Countdown and select the desired countdown timer.
Countdown Menu (Office 2007/2010/2013)
Countdown Menu (Office 2003)
There are four countdown timers available.
• Select a different countdown from the Objects menu to change the current countdown on the slide.
• To remove the countdown, simply delete the object from the slide.
3 To adjust the time or add a sound to the countdown timer, click the countdown timer.
Square Letter Clock Gemstone
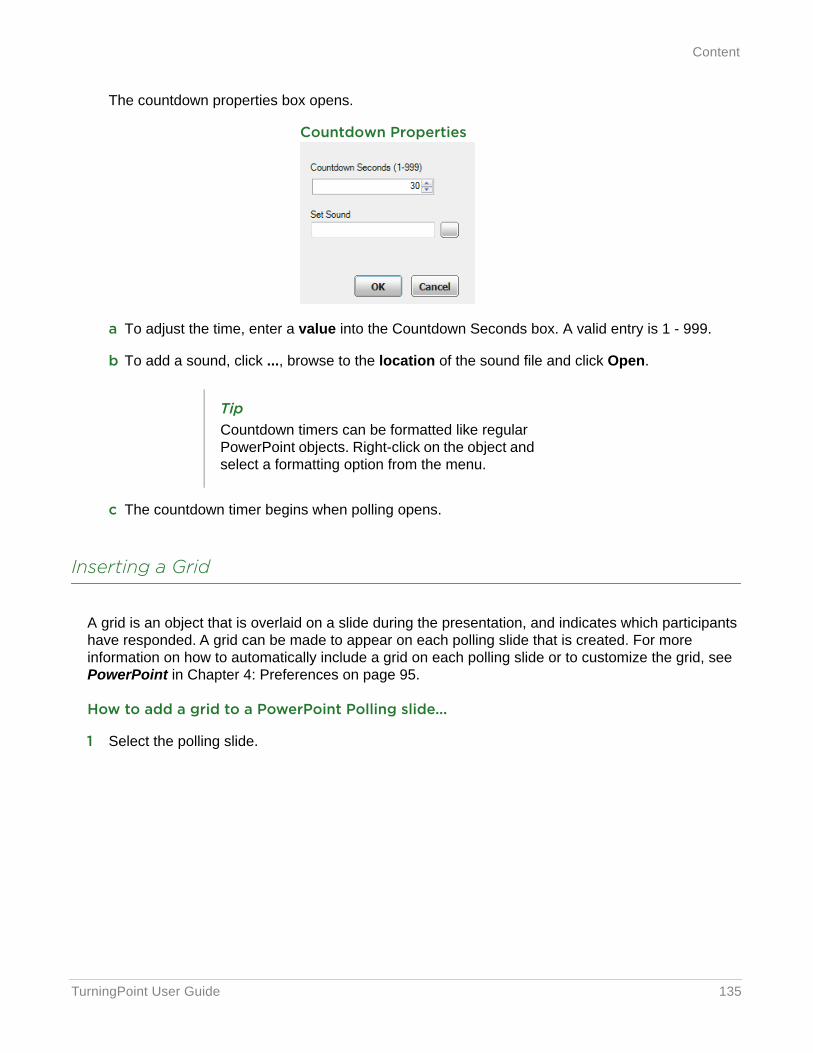
TurningPoint User Guide 135
Content
The countdown properties box opens.
Countdown Properties
a To adjust the time, enter a value into the Countdown Seconds box. A valid entry is 1 - 999.
b To add a sound, click ..., browse to the location of the sound file and click Open.
c The countdown timer begins when polling opens.
Inserting a Grid
A grid is an object that is overlaid on a slide during the presentation, and indicates which participants have responded. A grid can be made to appear on each polling slide that is created. For more information on how to automatically include a grid on each polling slide or to customize the grid, see PowerPoint in Chapter 4: Preferences on page 95.
How to add a grid to a PowerPoint Polling slide...
1 Select the polling slide.
TipCountdown timers can be formatted like regular PowerPoint objects. Right-click on the object and select a formatting option from the menu.
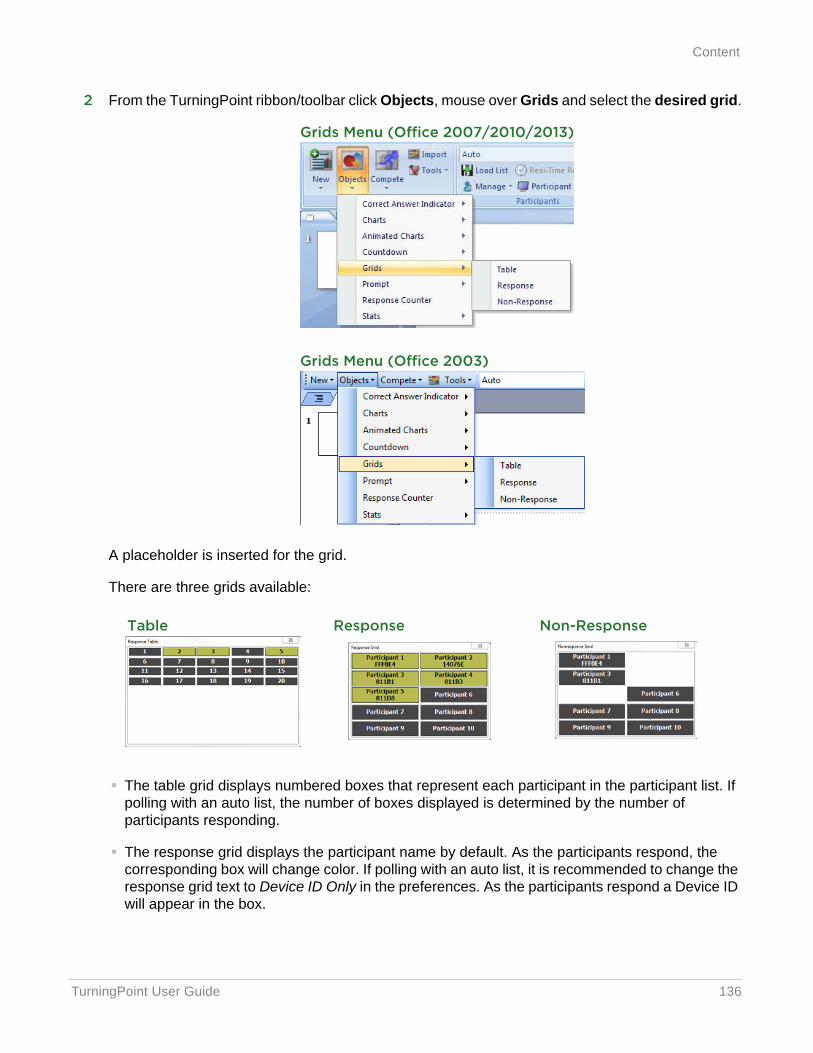
TurningPoint User Guide 136
Content
2 From the TurningPoint ribbon/toolbar click Objects, mouse over Grids and select the desired grid.
Grids Menu (Office 2007/2010/2013)
Grids Menu (Office 2003)
A placeholder is inserted for the grid.
There are three grids available:
• The table grid displays numbered boxes that represent each participant in the participant list. If polling with an auto list, the number of boxes displayed is determined by the number of participants responding.
• The response grid displays the participant name by default. As the participants respond, the corresponding box will change color. If polling with an auto list, it is recommended to change the response grid text to Device ID Only in the preferences. As the participants respond a Device ID will appear in the box.
Table Response Non-Response
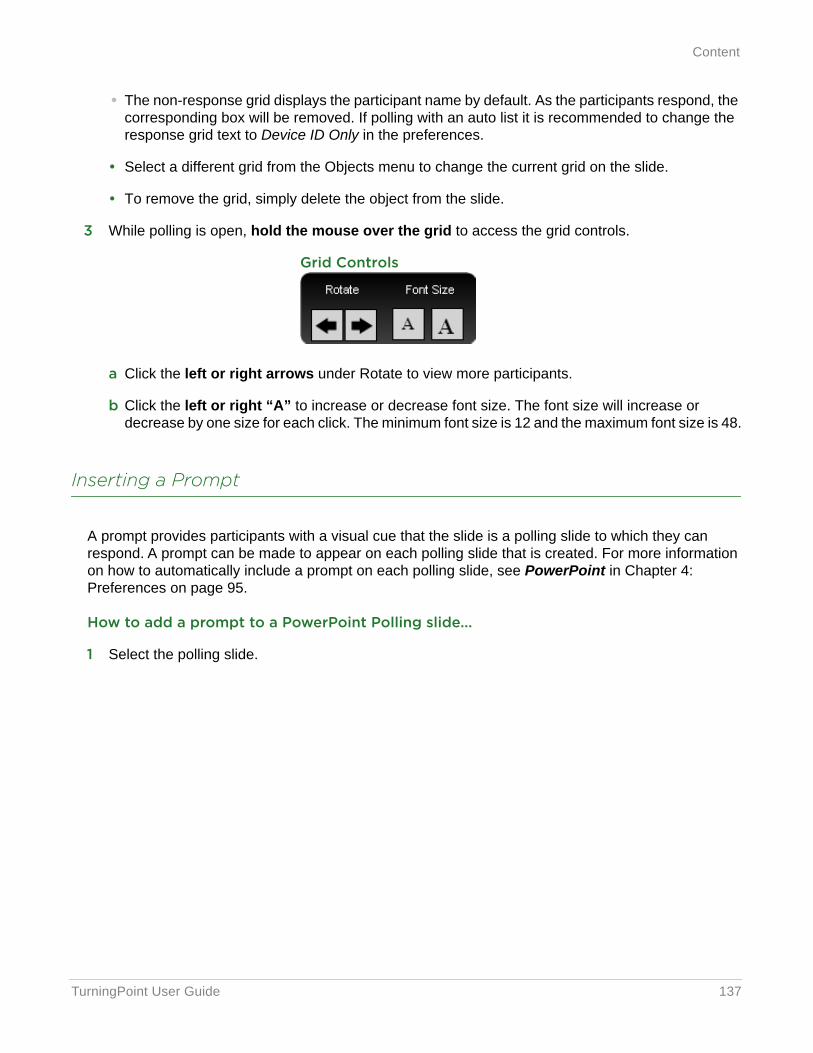
TurningPoint User Guide 137
Content
• The non-response grid displays the participant name by default. As the participants respond, the corresponding box will be removed. If polling with an auto list it is recommended to change the response grid text to Device ID Only in the preferences.
• Select a different grid from the Objects menu to change the current grid on the slide.
• To remove the grid, simply delete the object from the slide.
3 While polling is open, hold the mouse over the grid to access the grid controls.
Grid Controls
a Click the left or right arrows under Rotate to view more participants.
b Click the left or right “A” to increase or decrease font size. The font size will increase or decrease by one size for each click. The minimum font size is 12 and the maximum font size is 48.
Inserting a Prompt
A prompt provides participants with a visual cue that the slide is a polling slide to which they can respond. A prompt can be made to appear on each polling slide that is created. For more information on how to automatically include a prompt on each polling slide, see PowerPoint in Chapter 4: Preferences on page 95.
How to add a prompt to a PowerPoint Polling slide...
1 Select the polling slide.
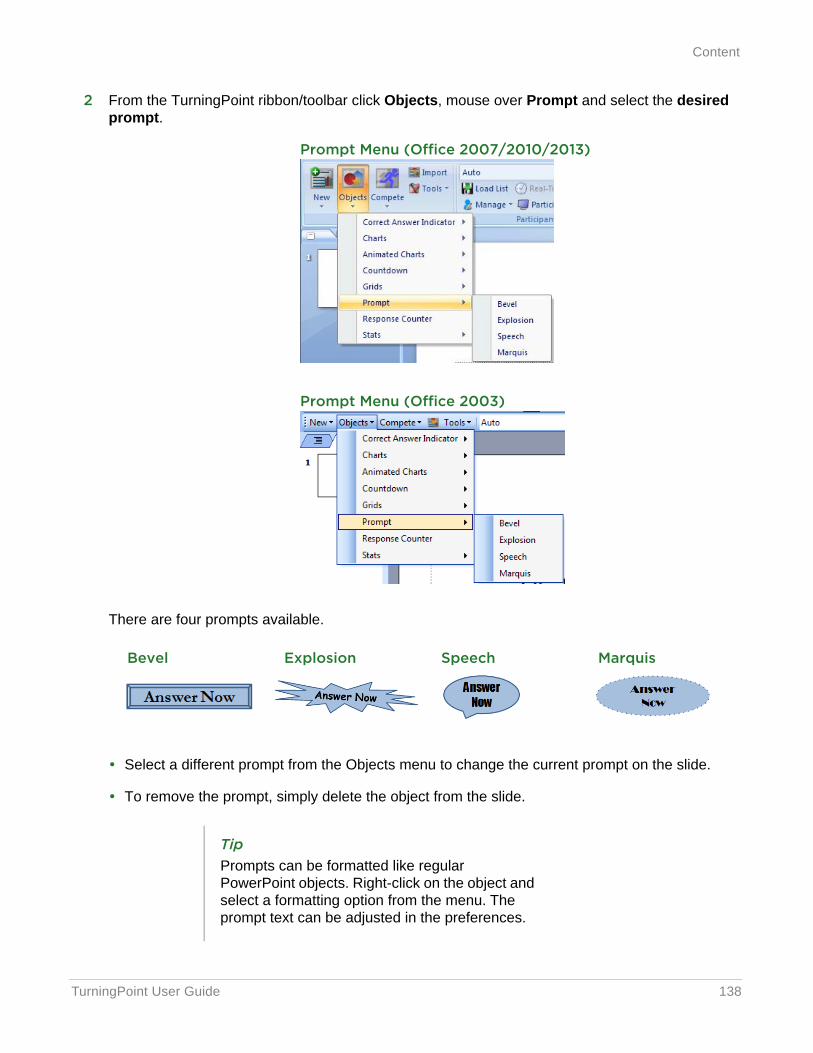
TurningPoint User Guide 138
Content
2 From the TurningPoint ribbon/toolbar click Objects, mouse over Prompt and select the desired prompt.
Prompt Menu (Office 2007/2010/2013)
Prompt Menu (Office 2003)
There are four prompts available.
• Select a different prompt from the Objects menu to change the current prompt on the slide.
• To remove the prompt, simply delete the object from the slide.
Bevel Explosion Speech Marquis
TipPrompts can be formatted like regular PowerPoint objects. Right-click on the object and select a formatting option from the menu. The prompt text can be adjusted in the preferences.
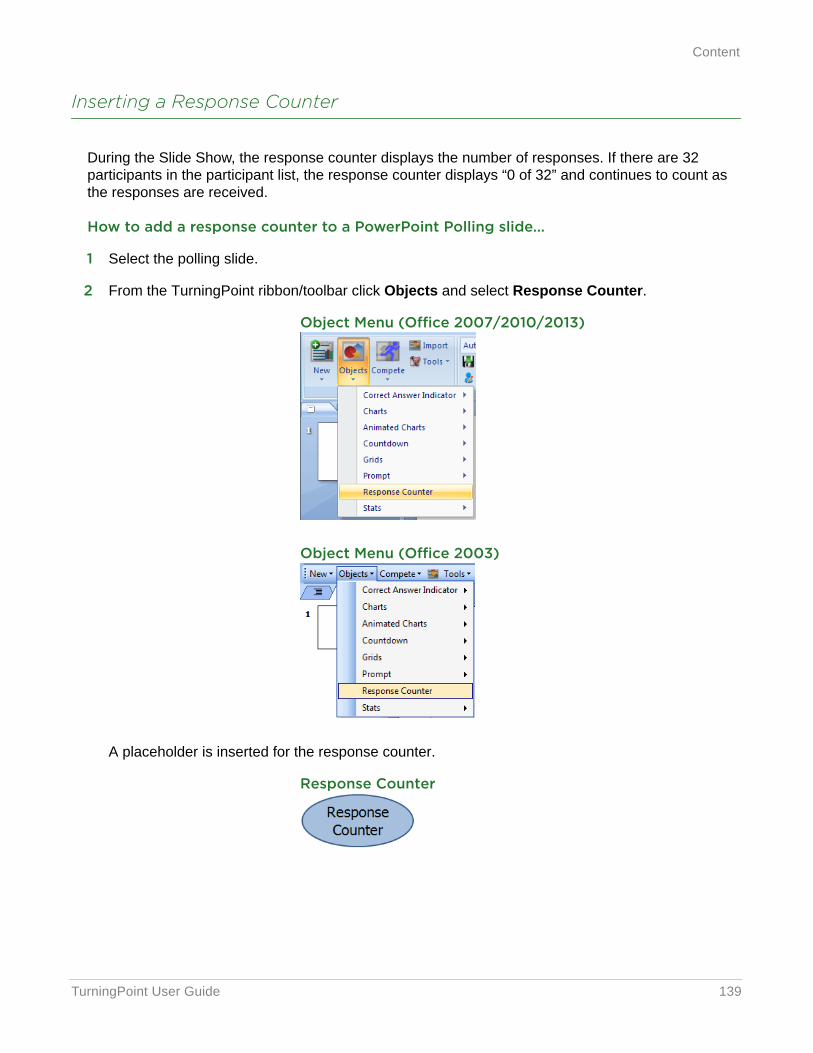
TurningPoint User Guide 139
Content
Inserting a Response Counter
During the Slide Show, the response counter displays the number of responses. If there are 32 participants in the participant list, the response counter displays “0 of 32” and continues to count as the responses are received.
How to add a response counter to a PowerPoint Polling slide...
1 Select the polling slide.
2 From the TurningPoint ribbon/toolbar click Objects and select Response Counter.
Object Menu (Office 2007/2010/2013)
Object Menu (Office 2003)
A placeholder is inserted for the response counter.
Response Counter
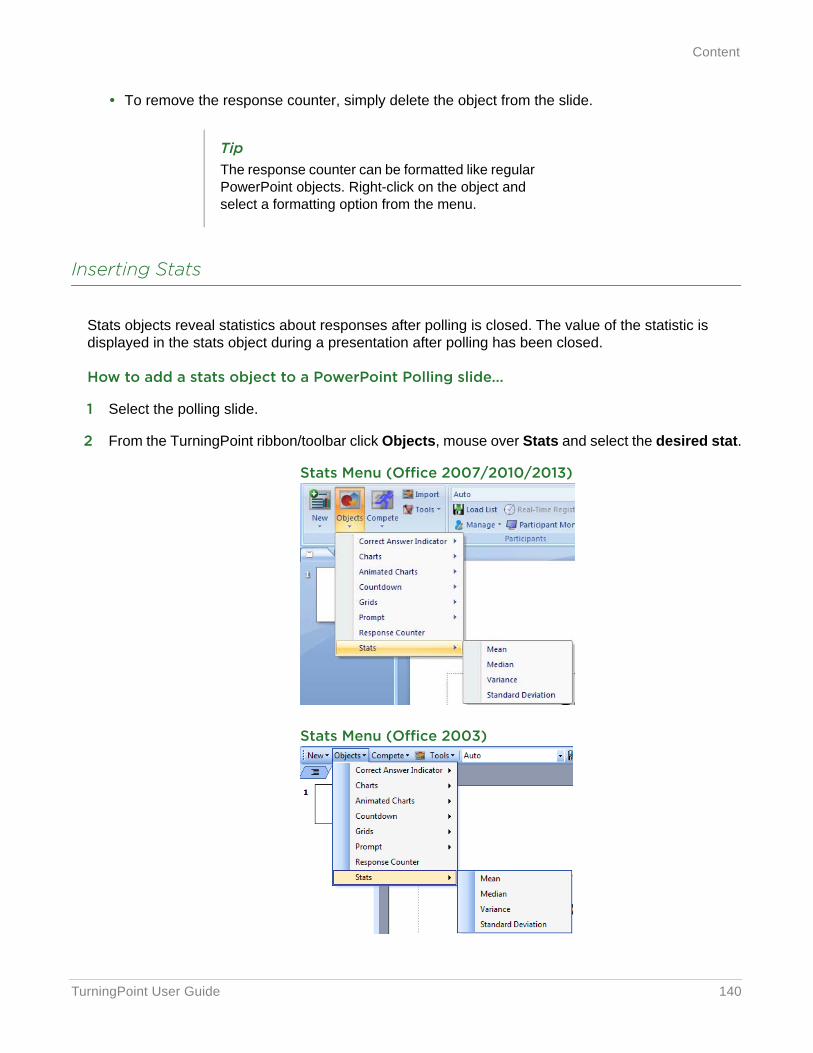
TurningPoint User Guide 140
Content
• To remove the response counter, simply delete the object from the slide.
Inserting Stats
Stats objects reveal statistics about responses after polling is closed. The value of the statistic is displayed in the stats object during a presentation after polling has been closed.
How to add a stats object to a PowerPoint Polling slide...
1 Select the polling slide.
2 From the TurningPoint ribbon/toolbar click Objects, mouse over Stats and select the desired stat.
Stats Menu (Office 2007/2010/2013)
Stats Menu (Office 2003)
TipThe response counter can be formatted like regular PowerPoint objects. Right-click on the object and select a formatting option from the menu.
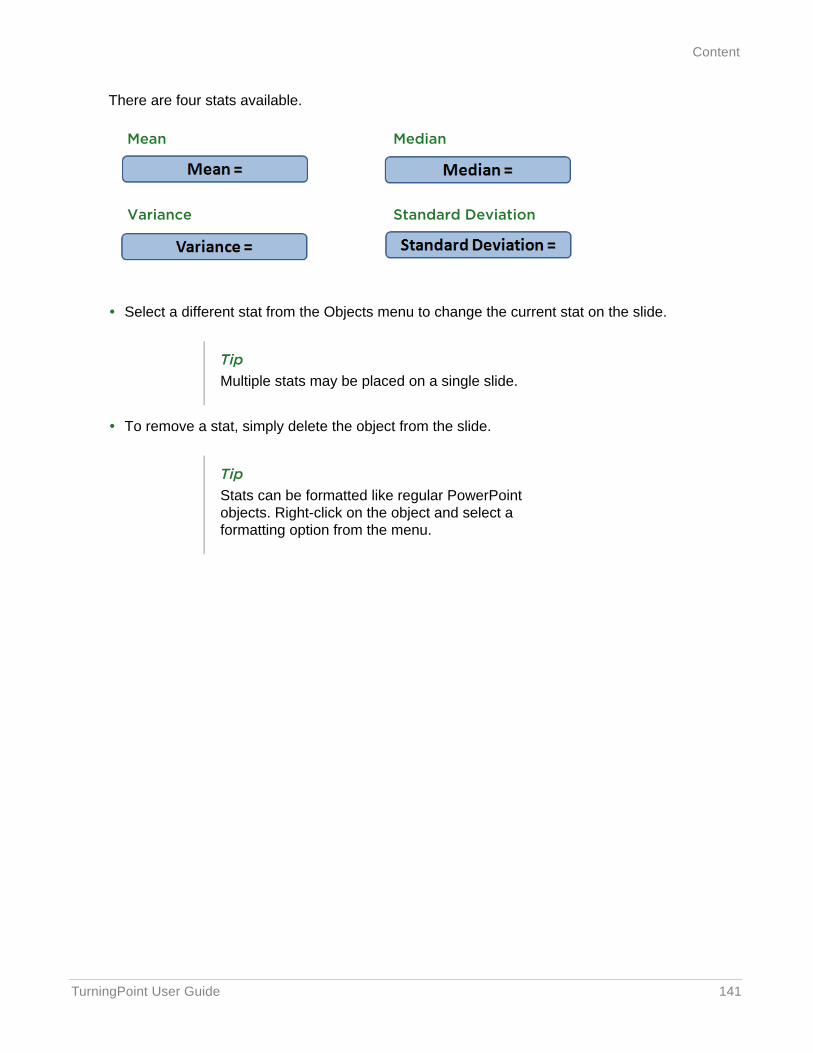
TurningPoint User Guide 141
Content
There are four stats available.
• Select a different stat from the Objects menu to change the current stat on the slide.
• To remove a stat, simply delete the object from the slide.
Mean Median
Variance Standard Deviation
TipMultiple stats may be placed on a single slide.
TipStats can be formatted like regular PowerPoint objects. Right-click on the object and select a formatting option from the menu.
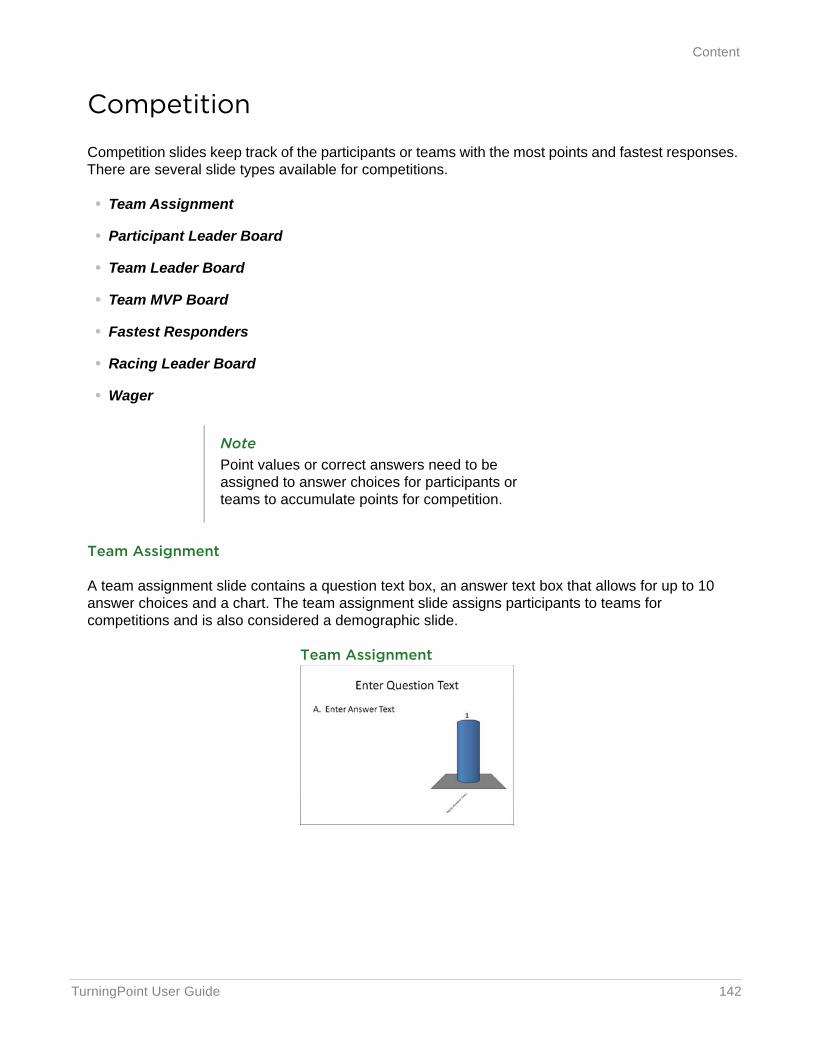
TurningPoint User Guide 142
Content
Competition
Competition slides keep track of the participants or teams with the most points and fastest responses. There are several slide types available for competitions.
• Team Assignment
• Participant Leader Board
• Team Leader Board
• Team MVP Board
• Fastest Responders
• Racing Leader Board
• Wager
Team Assignment
A team assignment slide contains a question text box, an answer text box that allows for up to 10 answer choices and a chart. The team assignment slide assigns participants to teams for competitions and is also considered a demographic slide.
Team Assignment
NotePoint values or correct answers need to be assigned to answer choices for participants or teams to accumulate points for competition.
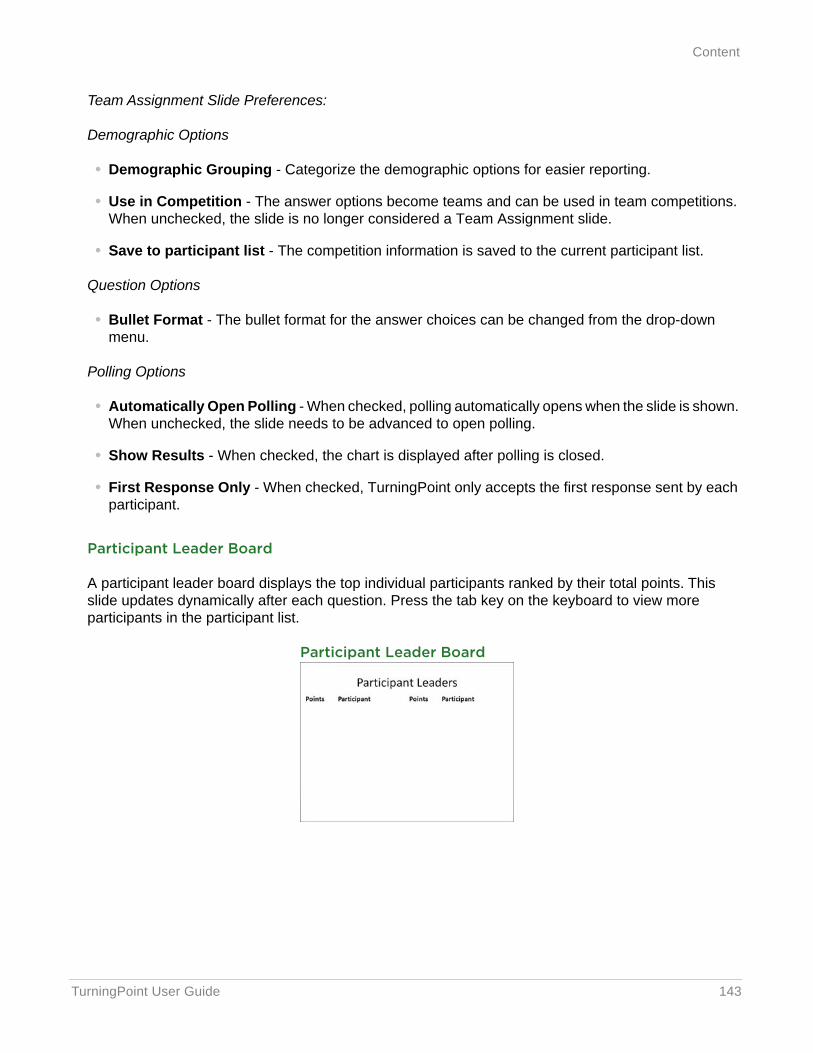
TurningPoint User Guide 143
Content
Team Assignment Slide Preferences:
Demographic Options
• Demographic Grouping - Categorize the demographic options for easier reporting.
• Use in Competition - The answer options become teams and can be used in team competitions. When unchecked, the slide is no longer considered a Team Assignment slide.
• Save to participant list - The competition information is saved to the current participant list.
Question Options
• Bullet Format - The bullet format for the answer choices can be changed from the drop-down menu.
Polling Options
• Automatically Open Polling - When checked, polling automatically opens when the slide is shown. When unchecked, the slide needs to be advanced to open polling.
• Show Results - When checked, the chart is displayed after polling is closed.
• First Response Only - When checked, TurningPoint only accepts the first response sent by each participant.
Participant Leader Board
A participant leader board displays the top individual participants ranked by their total points. This slide updates dynamically after each question. Press the tab key on the keyboard to view more participants in the participant list.
Participant Leader Board
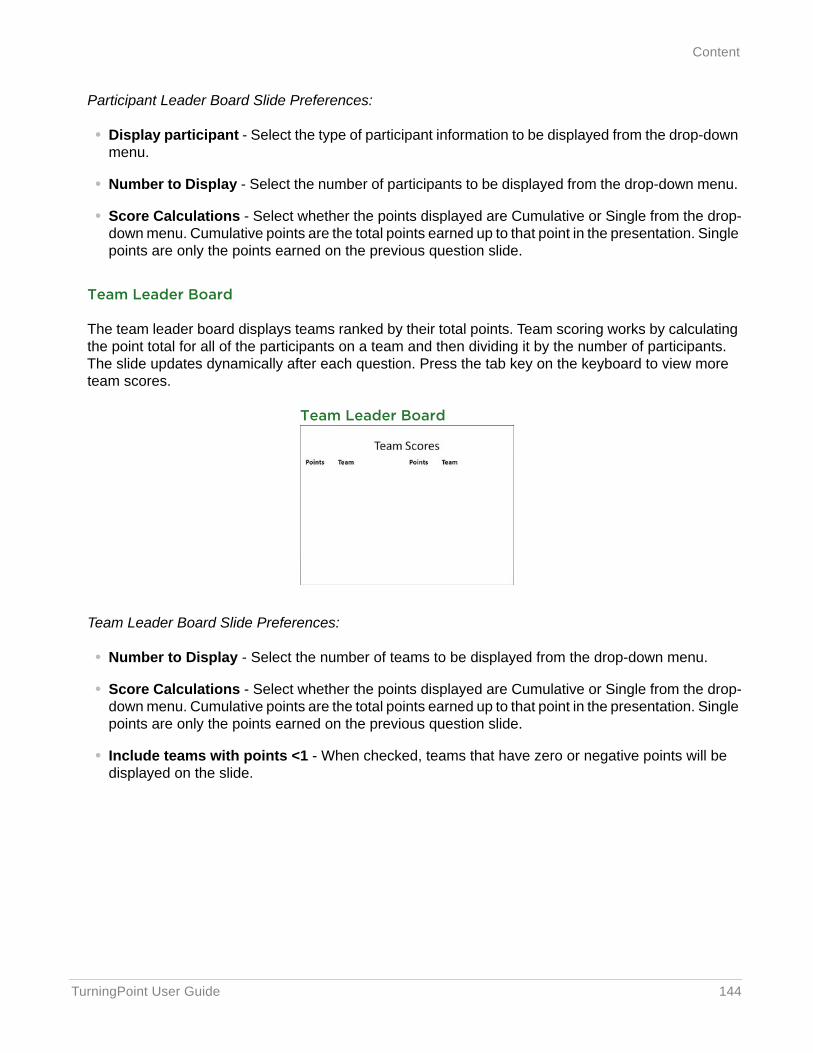
TurningPoint User Guide 144
Content
Participant Leader Board Slide Preferences:
• Display participant - Select the type of participant information to be displayed from the drop-down menu.
• Number to Display - Select the number of participants to be displayed from the drop-down menu.
• Score Calculations - Select whether the points displayed are Cumulative or Single from the drop-down menu. Cumulative points are the total points earned up to that point in the presentation. Single points are only the points earned on the previous question slide.
Team Leader Board
The team leader board displays teams ranked by their total points. Team scoring works by calculating the point total for all of the participants on a team and then dividing it by the number of participants. The slide updates dynamically after each question. Press the tab key on the keyboard to view more team scores.
Team Leader Board
Team Leader Board Slide Preferences:
• Number to Display - Select the number of teams to be displayed from the drop-down menu.
• Score Calculations - Select whether the points displayed are Cumulative or Single from the drop-down menu. Cumulative points are the total points earned up to that point in the presentation. Single points are only the points earned on the previous question slide.
• Include teams with points <1 - When checked, teams that have zero or negative points will be displayed on the slide.
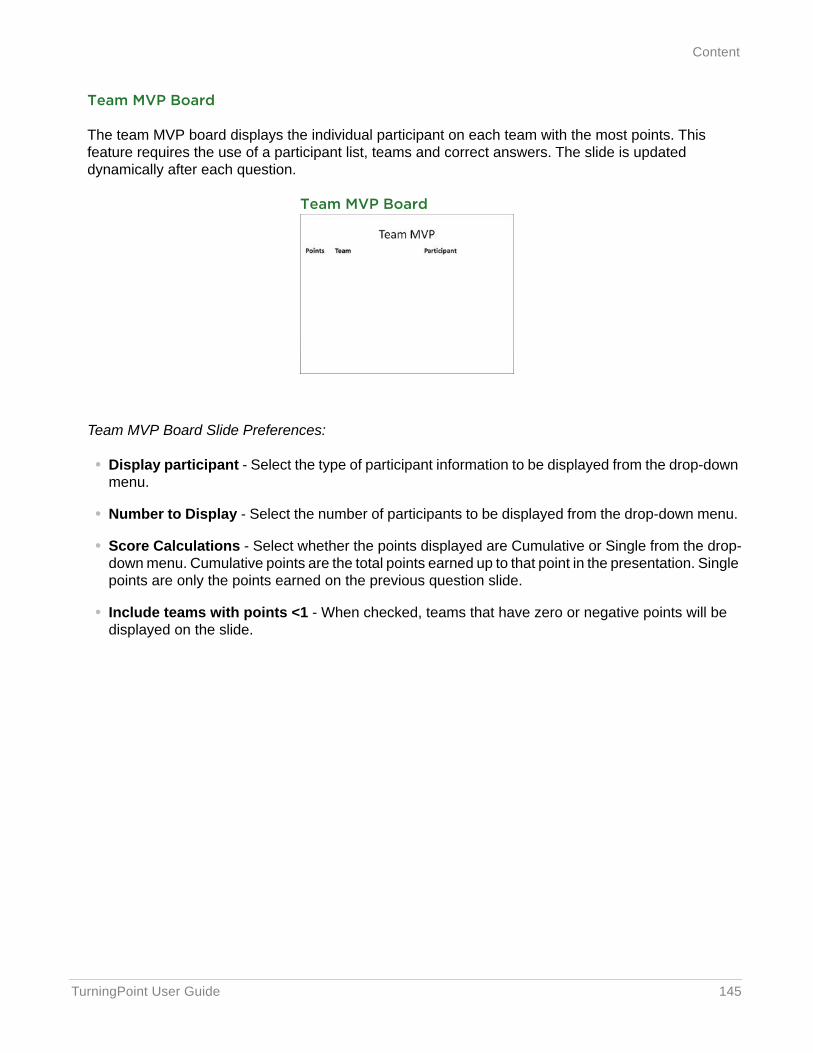
TurningPoint User Guide 145
Content
Team MVP Board
The team MVP board displays the individual participant on each team with the most points. This feature requires the use of a participant list, teams and correct answers. The slide is updated dynamically after each question.
Team MVP Board
Team MVP Board Slide Preferences:
• Display participant - Select the type of participant information to be displayed from the drop-down menu.
• Number to Display - Select the number of participants to be displayed from the drop-down menu.
• Score Calculations - Select whether the points displayed are Cumulative or Single from the drop-down menu. Cumulative points are the total points earned up to that point in the presentation. Single points are only the points earned on the previous question slide.
• Include teams with points <1 - When checked, teams that have zero or negative points will be displayed on the slide.
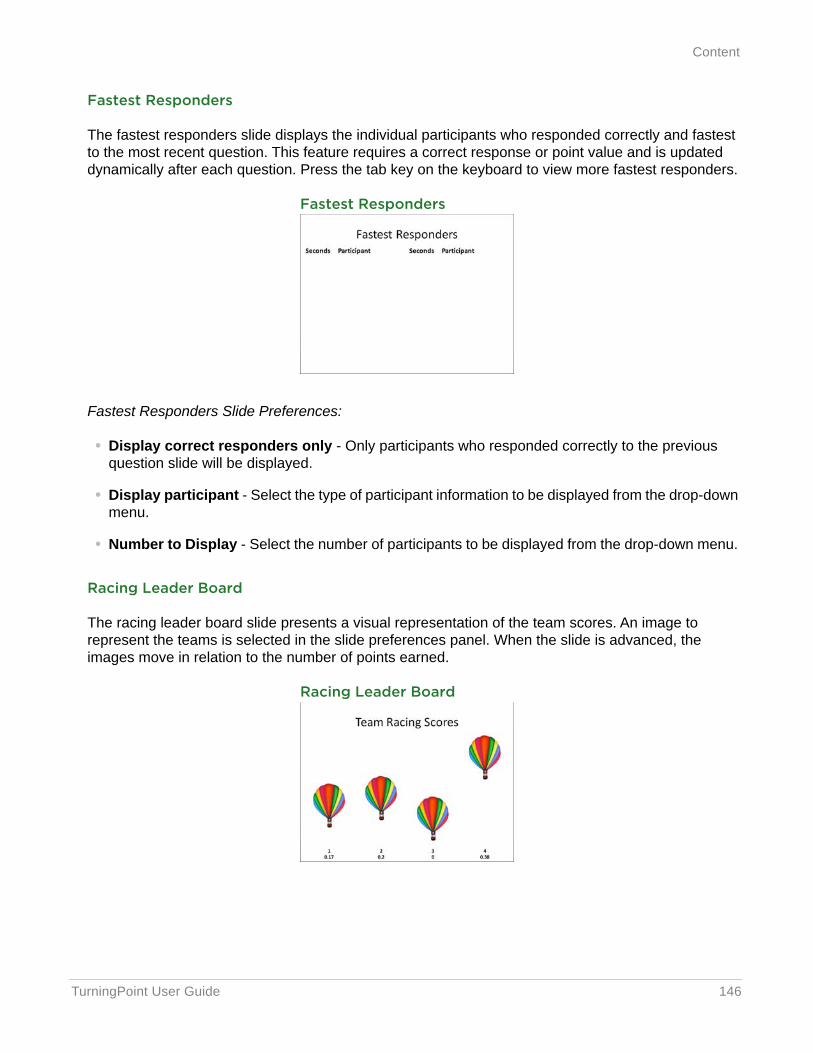
TurningPoint User Guide 146
Content
Fastest Responders
The fastest responders slide displays the individual participants who responded correctly and fastest to the most recent question. This feature requires a correct response or point value and is updated dynamically after each question. Press the tab key on the keyboard to view more fastest responders.
Fastest Responders
Fastest Responders Slide Preferences:
• Display correct responders only - Only participants who responded correctly to the previous question slide will be displayed.
• Display participant - Select the type of participant information to be displayed from the drop-down menu.
• Number to Display - Select the number of participants to be displayed from the drop-down menu.
Racing Leader Board
The racing leader board slide presents a visual representation of the team scores. An image to represent the teams is selected in the slide preferences panel. When the slide is advanced, the images move in relation to the number of points earned.
Racing Leader Board
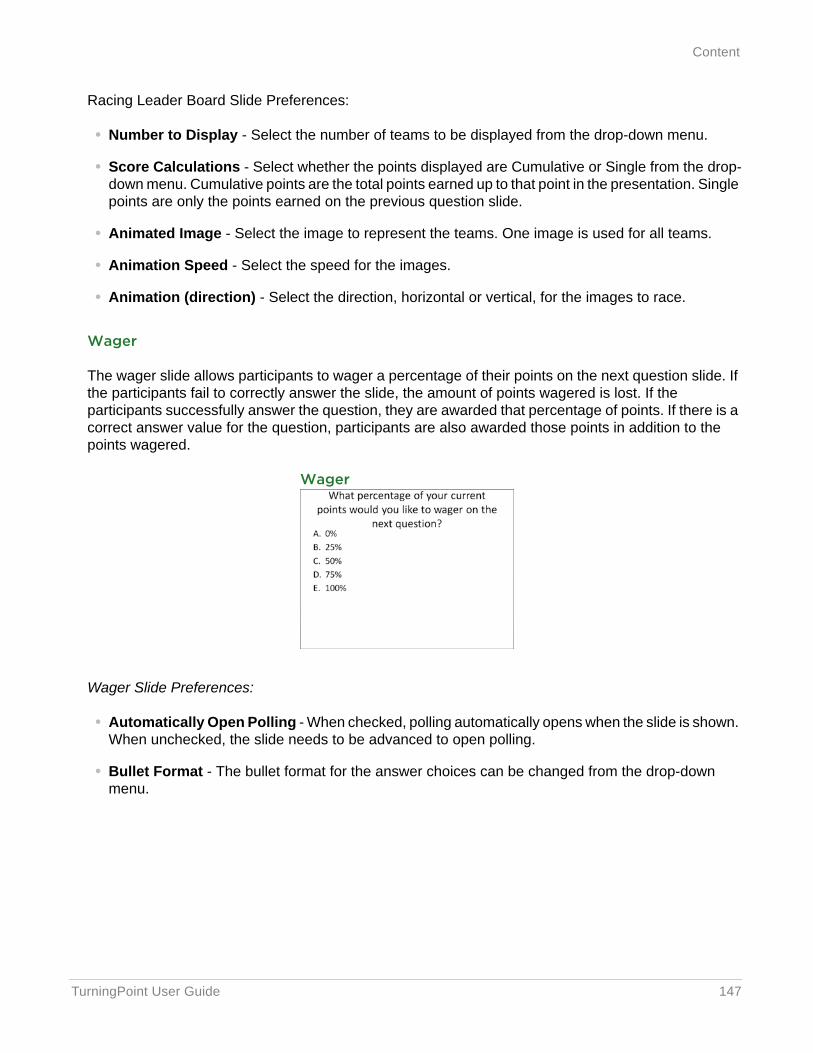
TurningPoint User Guide 147
Content
Racing Leader Board Slide Preferences:
• Number to Display - Select the number of teams to be displayed from the drop-down menu.
• Score Calculations - Select whether the points displayed are Cumulative or Single from the drop-down menu. Cumulative points are the total points earned up to that point in the presentation. Single points are only the points earned on the previous question slide.
• Animated Image - Select the image to represent the teams. One image is used for all teams.
• Animation Speed - Select the speed for the images.
• Animation (direction) - Select the direction, horizontal or vertical, for the images to race.
Wager
The wager slide allows participants to wager a percentage of their points on the next question slide. If the participants fail to correctly answer the slide, the amount of points wagered is lost. If the participants successfully answer the question, they are awarded that percentage of points. If there is a correct answer value for the question, participants are also awarded those points in addition to the points wagered.
Wager
Wager Slide Preferences:
• Automatically Open Polling - When checked, polling automatically opens when the slide is shown. When unchecked, the slide needs to be advanced to open polling.
• Bullet Format - The bullet format for the answer choices can be changed from the drop-down menu.
TurningPoint User Guide 148
Content
Import
The Import Question List icon on the TurningPoint ribbon/toolbar is used to import a question list file from any location, such as the TurningPoint Content folder, a flash drive or network drive.
Importing a Question List File
The questions from the question list file are converted into polling slides.
How to import a question list file into a polling presentation...
1 Click Import on the TurningPoint ribbon/toolbar.
2 Browse to the location of the question list file.
3 Select the question list file and click Open.
A box displays the status of the question list file import.
Next Steps
Correct answers and other slide setting options can be adjusted in the Slide Preferences pane. For more information on Slide Preferences, see Slide Types and Slide Preferences on page 115.
NoteOnly one question list file may be selected at a time.
TurningPoint User Guide 149
Tools
ToolsThe PowerPoint Polling tools are advanced features that can be used to enhance the presentation.
There are six tools available:
• Comparative Links
• Conditional Branching
• Convert to Picture
• Demographic Comparison
• Ranking Wizard
• Standards
Comparative Links
Comparative links can be used to display the results from two separate slides on one slide. If a question is asked at the beginning of the presentation and then again towards the end, a comparative links slide will display the results from each question on the same slide.
Inserting a Comparative Link
Generally, the slides being compared should each have the same number of answers. The slide on which the comparison displays must come after the second slide being compared, so that the results of those slides are available for display.
Prerequisites
A presentation must contain at least two Multiple Choice polling slides to set up a comparative link.
NoteA comparative link slide does not need to be present in order to generate a Comparative Results Report.
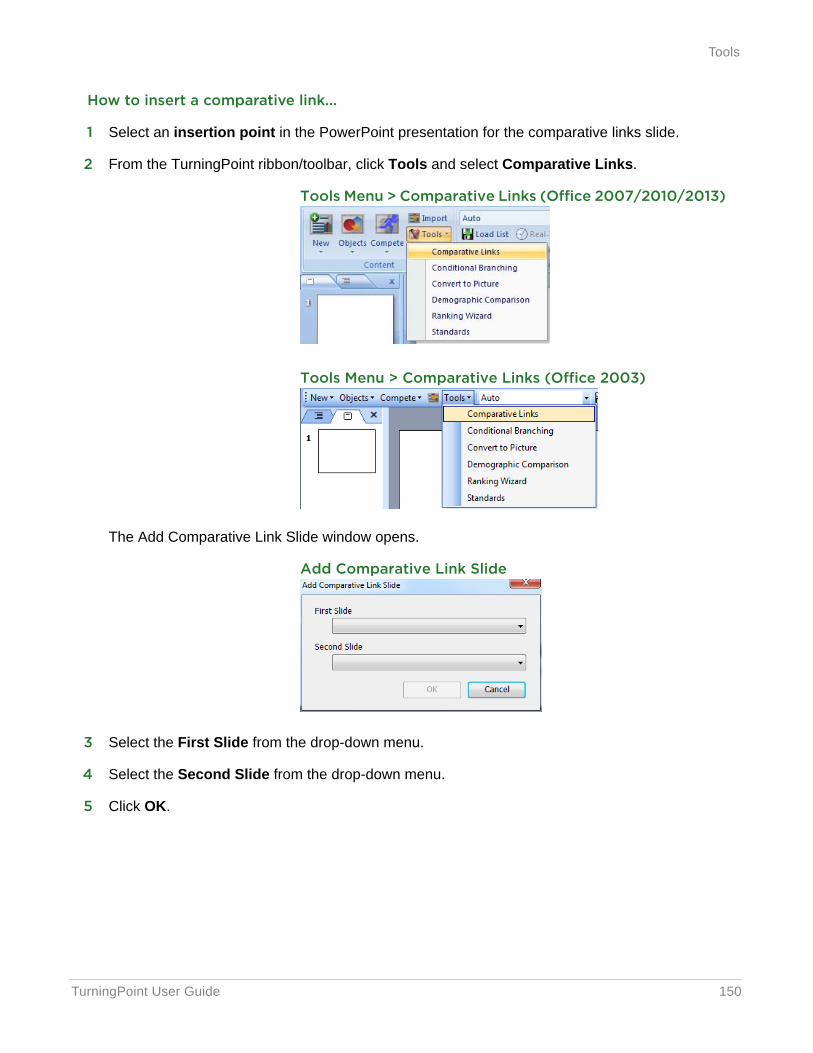
TurningPoint User Guide 150
Tools
How to insert a comparative link...
1 Select an insertion point in the PowerPoint presentation for the comparative links slide.
2 From the TurningPoint ribbon/toolbar, click Tools and select Comparative Links.
Tools Menu > Comparative Links (Office 2007/2010/2013)
Tools Menu > Comparative Links (Office 2003)
The Add Comparative Link Slide window opens.
Add Comparative Link Slide
3 Select the First Slide from the drop-down menu.
4 Select the Second Slide from the drop-down menu.
5 Click OK.
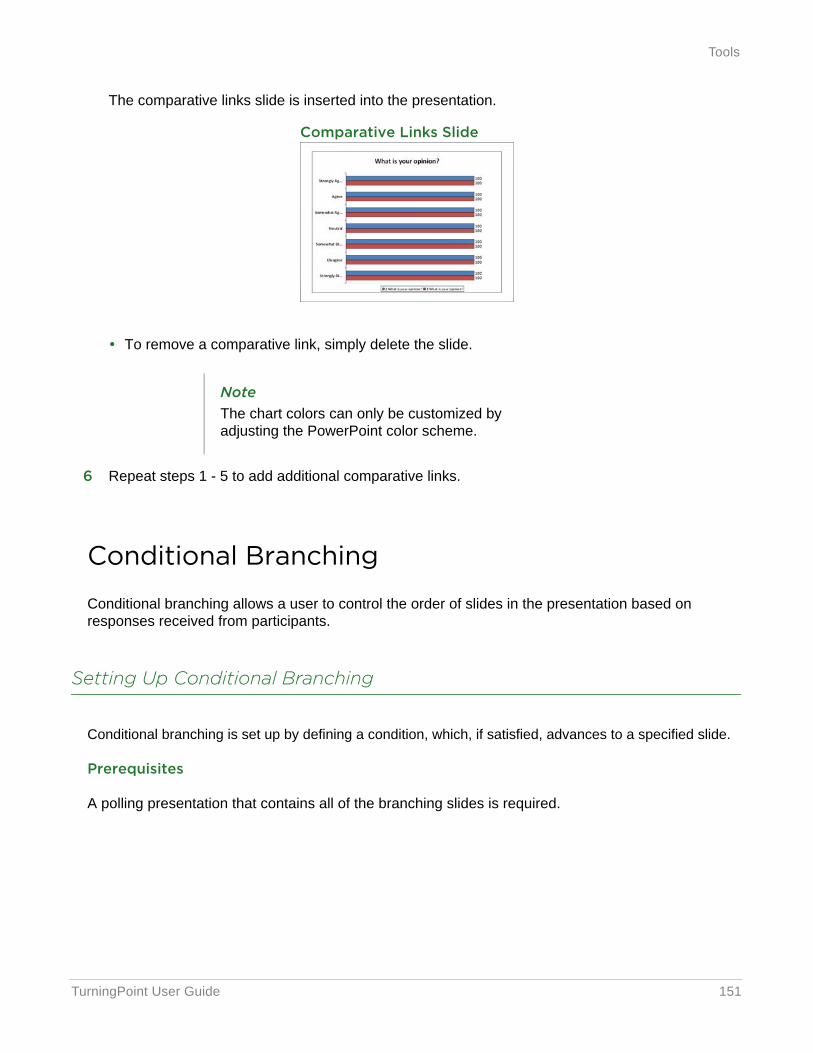
TurningPoint User Guide 151
Tools
The comparative links slide is inserted into the presentation.
Comparative Links Slide
• To remove a comparative link, simply delete the slide.
6 Repeat steps 1 - 5 to add additional comparative links.
Conditional Branching
Conditional branching allows a user to control the order of slides in the presentation based on responses received from participants.
Setting Up Conditional Branching
Conditional branching is set up by defining a condition, which, if satisfied, advances to a specified slide.
Prerequisites
A polling presentation that contains all of the branching slides is required.
NoteThe chart colors can only be customized by adjusting the PowerPoint color scheme.
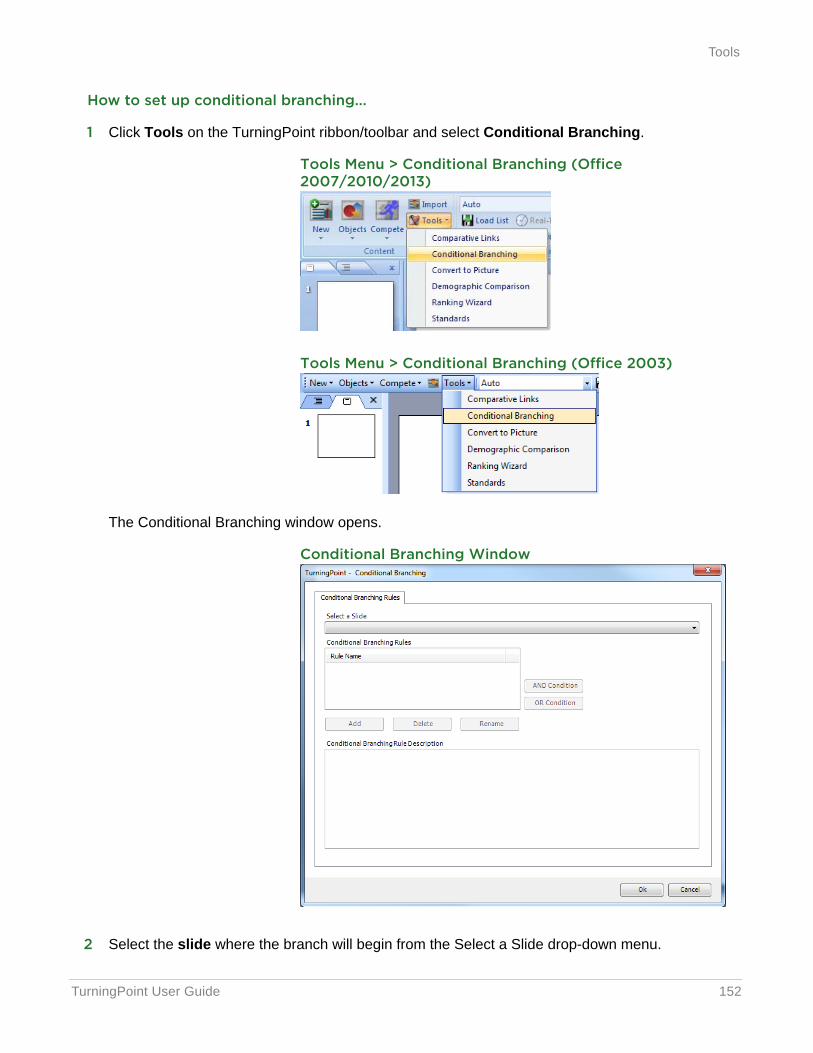
TurningPoint User Guide 152
Tools
How to set up conditional branching...
1 Click Tools on the TurningPoint ribbon/toolbar and select Conditional Branching.
Tools Menu > Conditional Branching (Office 2007/2010/2013)
Tools Menu > Conditional Branching (Office 2003)
The Conditional Branching window opens.
Conditional Branching Window
2 Select the slide where the branch will begin from the Select a Slide drop-down menu.
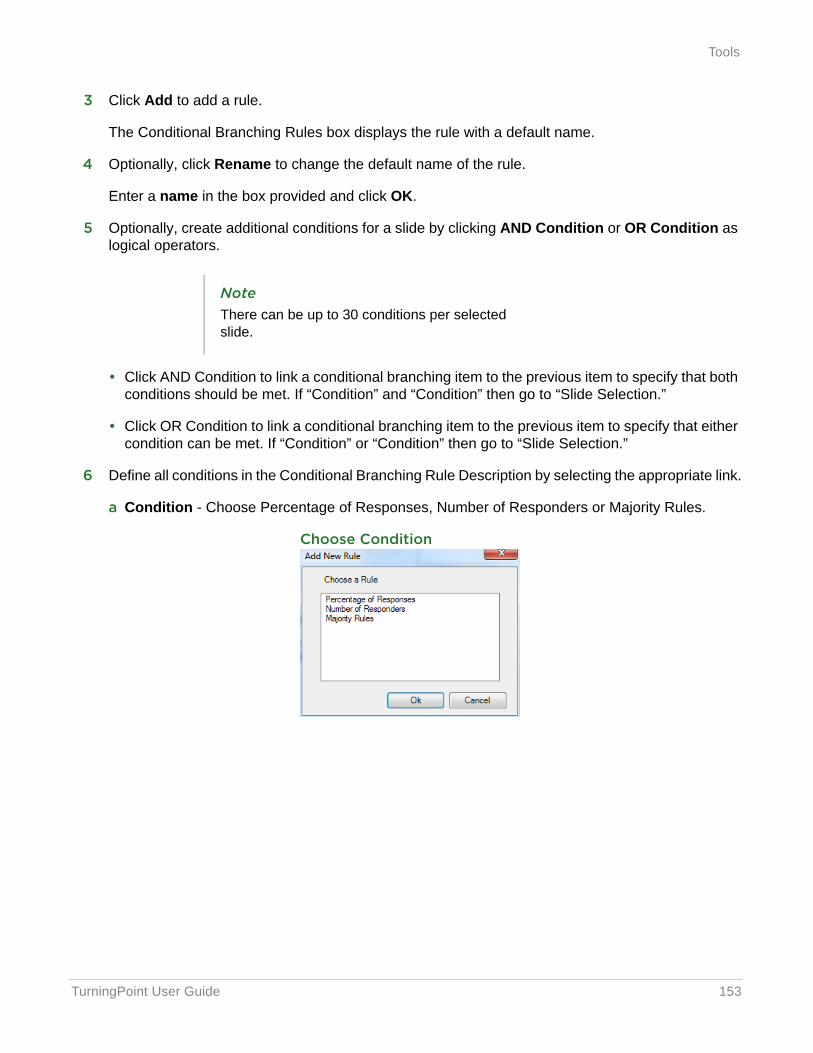
TurningPoint User Guide 153
Tools
3 Click Add to add a rule.
The Conditional Branching Rules box displays the rule with a default name.
4 Optionally, click Rename to change the default name of the rule.
Enter a name in the box provided and click OK.
5 Optionally, create additional conditions for a slide by clicking AND Condition or OR Condition as logical operators.
• Click AND Condition to link a conditional branching item to the previous item to specify that both conditions should be met. If “Condition” and “Condition” then go to “Slide Selection.”
• Click OR Condition to link a conditional branching item to the previous item to specify that either condition can be met. If “Condition” or “Condition” then go to “Slide Selection.”
6 Define all conditions in the Conditional Branching Rule Description by selecting the appropriate link.
a Condition - Choose Percentage of Responses, Number of Responders or Majority Rules.
Choose Condition
NoteThere can be up to 30 conditions per selected slide.
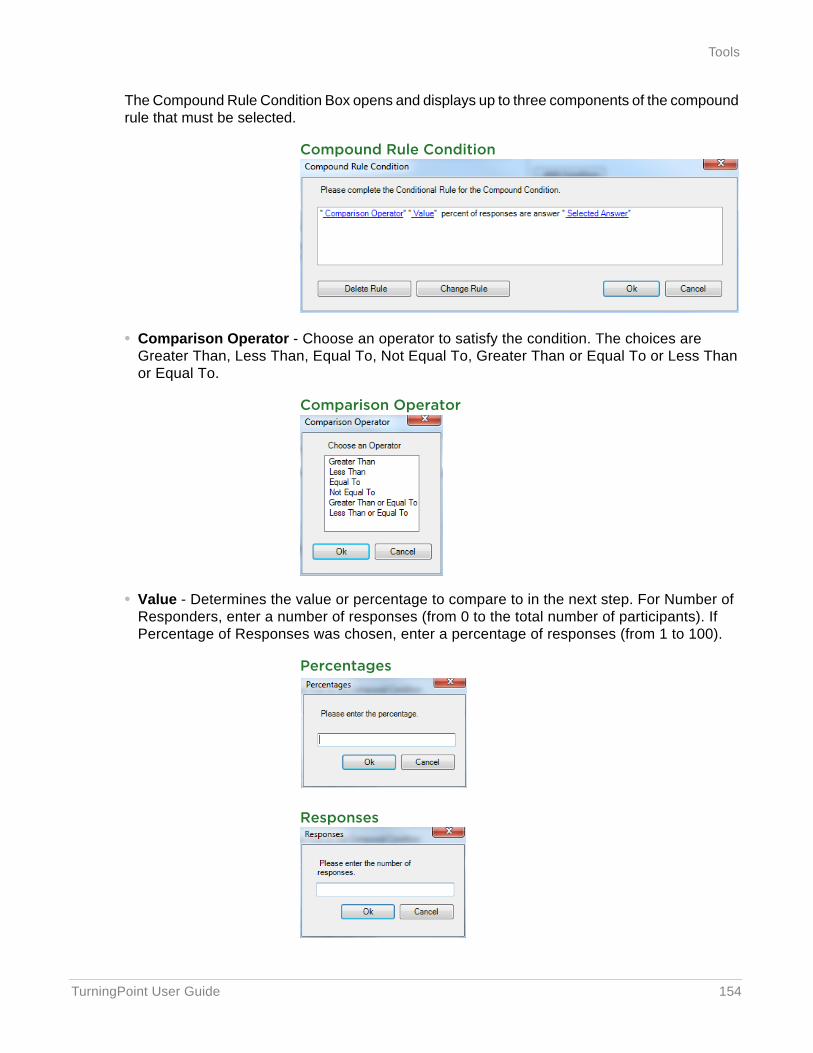
TurningPoint User Guide 154
Tools
The Compound Rule Condition Box opens and displays up to three components of the compound rule that must be selected.
Compound Rule Condition
• Comparison Operator - Choose an operator to satisfy the condition. The choices are Greater Than, Less Than, Equal To, Not Equal To, Greater Than or Equal To or Less Than or Equal To.
Comparison Operator
• Value - Determines the value or percentage to compare to in the next step. For Number of Responders, enter a number of responses (from 0 to the total number of participants). If Percentage of Responses was chosen, enter a percentage of responses (from 1 to 100).
Percentages
Responses
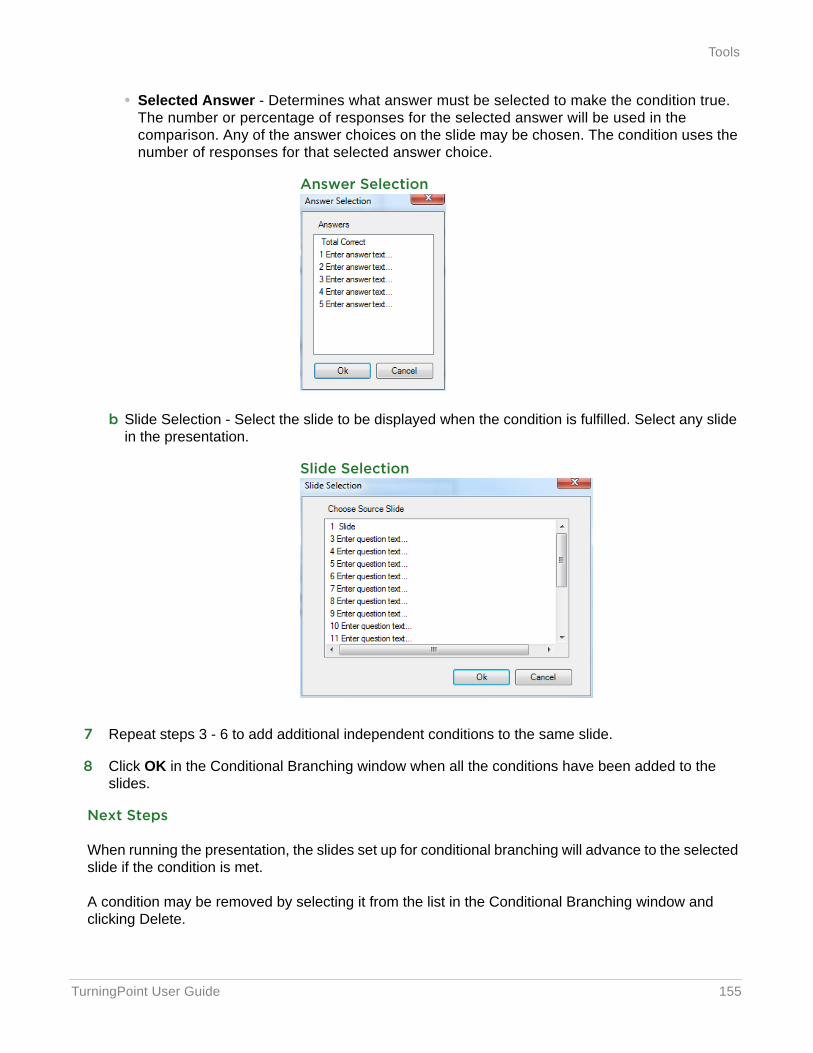
TurningPoint User Guide 155
Tools
• Selected Answer - Determines what answer must be selected to make the condition true. The number or percentage of responses for the selected answer will be used in the comparison. Any of the answer choices on the slide may be chosen. The condition uses the number of responses for that selected answer choice.
Answer Selection
b Slide Selection - Select the slide to be displayed when the condition is fulfilled. Select any slide in the presentation.
Slide Selection
7 Repeat steps 3 - 6 to add additional independent conditions to the same slide.
8 Click OK in the Conditional Branching window when all the conditions have been added to the slides.
Next Steps
When running the presentation, the slides set up for conditional branching will advance to the selected slide if the condition is met.
A condition may be removed by selecting it from the list in the Conditional Branching window and clicking Delete.
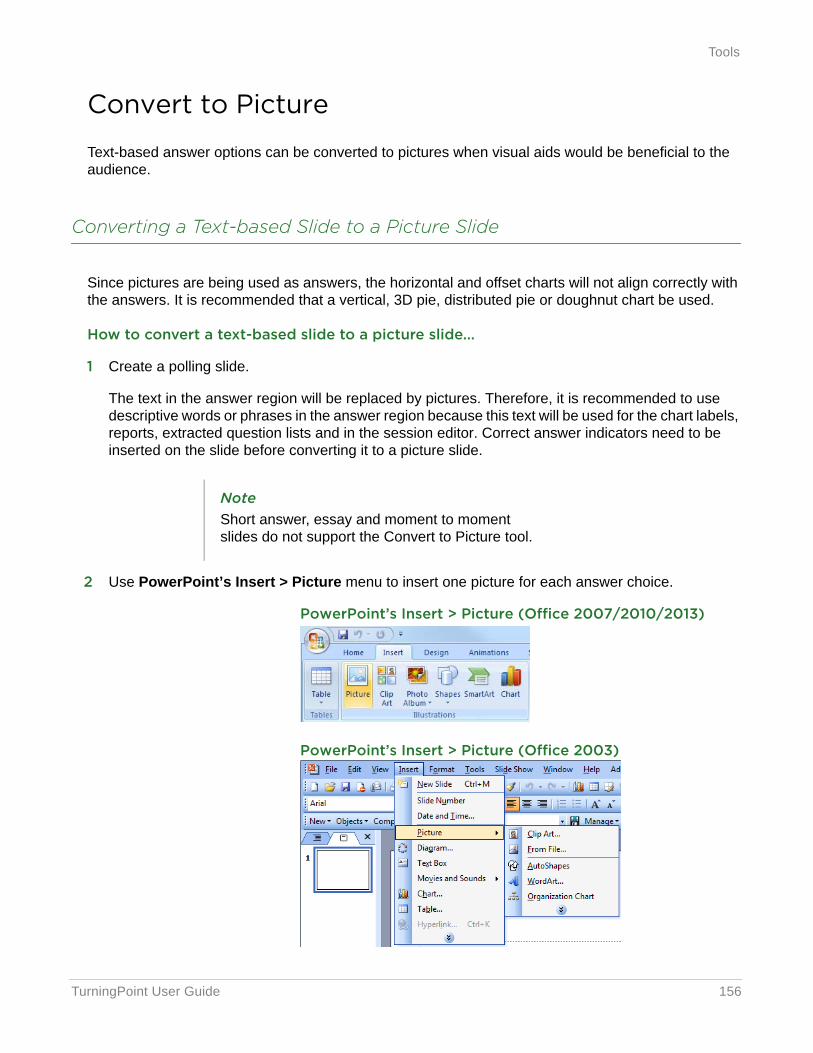
TurningPoint User Guide 156
Tools
Convert to Picture
Text-based answer options can be converted to pictures when visual aids would be beneficial to the audience.
Converting a Text-based Slide to a Picture Slide
Since pictures are being used as answers, the horizontal and offset charts will not align correctly with the answers. It is recommended that a vertical, 3D pie, distributed pie or doughnut chart be used.
How to convert a text-based slide to a picture slide...
1 Create a polling slide.
The text in the answer region will be replaced by pictures. Therefore, it is recommended to use descriptive words or phrases in the answer region because this text will be used for the chart labels, reports, extracted question lists and in the session editor. Correct answer indicators need to be inserted on the slide before converting it to a picture slide.
2 Use PowerPoint’s Insert > Picture menu to insert one picture for each answer choice.
PowerPoint’s Insert > Picture (Office 2007/2010/2013)
PowerPoint’s Insert > Picture (Office 2003)
NoteShort answer, essay and moment to moment slides do not support the Convert to Picture tool.
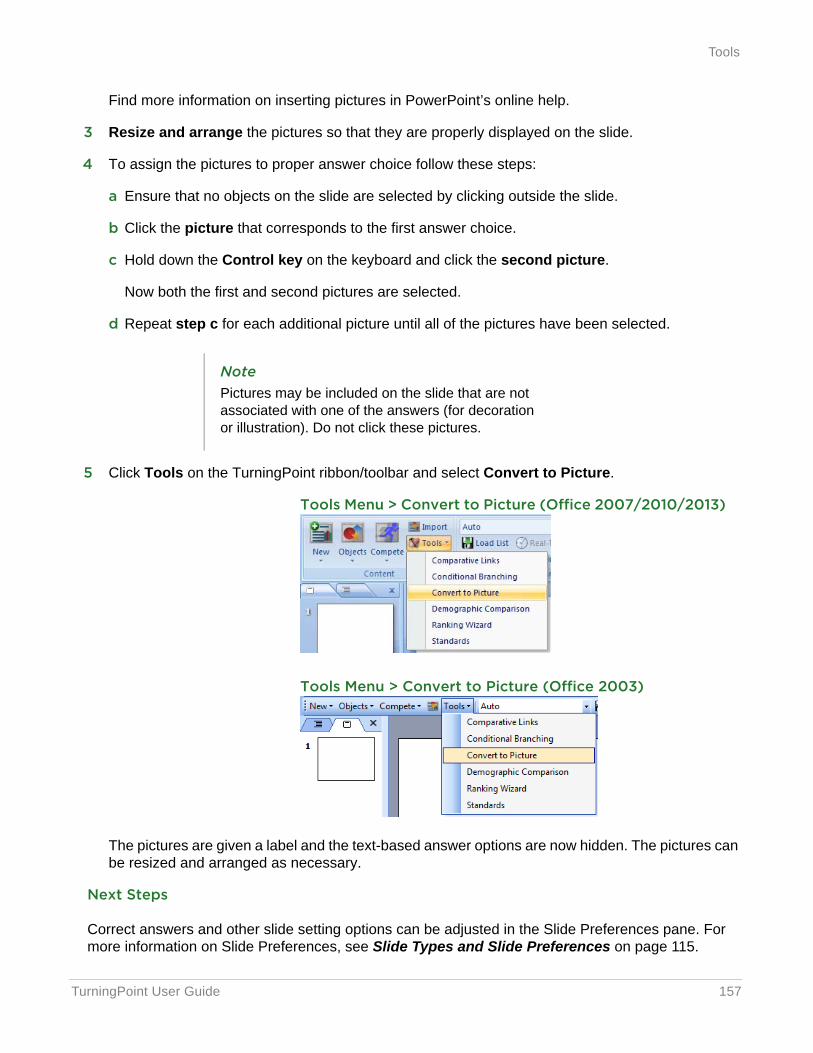
TurningPoint User Guide 157
Tools
Find more information on inserting pictures in PowerPoint’s online help.
3 Resize and arrange the pictures so that they are properly displayed on the slide.
4 To assign the pictures to proper answer choice follow these steps:
a Ensure that no objects on the slide are selected by clicking outside the slide.
b Click the picture that corresponds to the first answer choice.
c Hold down the Control key on the keyboard and click the second picture.
Now both the first and second pictures are selected.
d Repeat step c for each additional picture until all of the pictures have been selected.
5 Click Tools on the TurningPoint ribbon/toolbar and select Convert to Picture.
Tools Menu > Convert to Picture (Office 2007/2010/2013)
Tools Menu > Convert to Picture (Office 2003)
The pictures are given a label and the text-based answer options are now hidden. The pictures can be resized and arranged as necessary.
Next Steps
Correct answers and other slide setting options can be adjusted in the Slide Preferences pane. For more information on Slide Preferences, see Slide Types and Slide Preferences on page 115.
NotePictures may be included on the slide that are not associated with one of the answers (for decoration or illustration). Do not click these pictures.
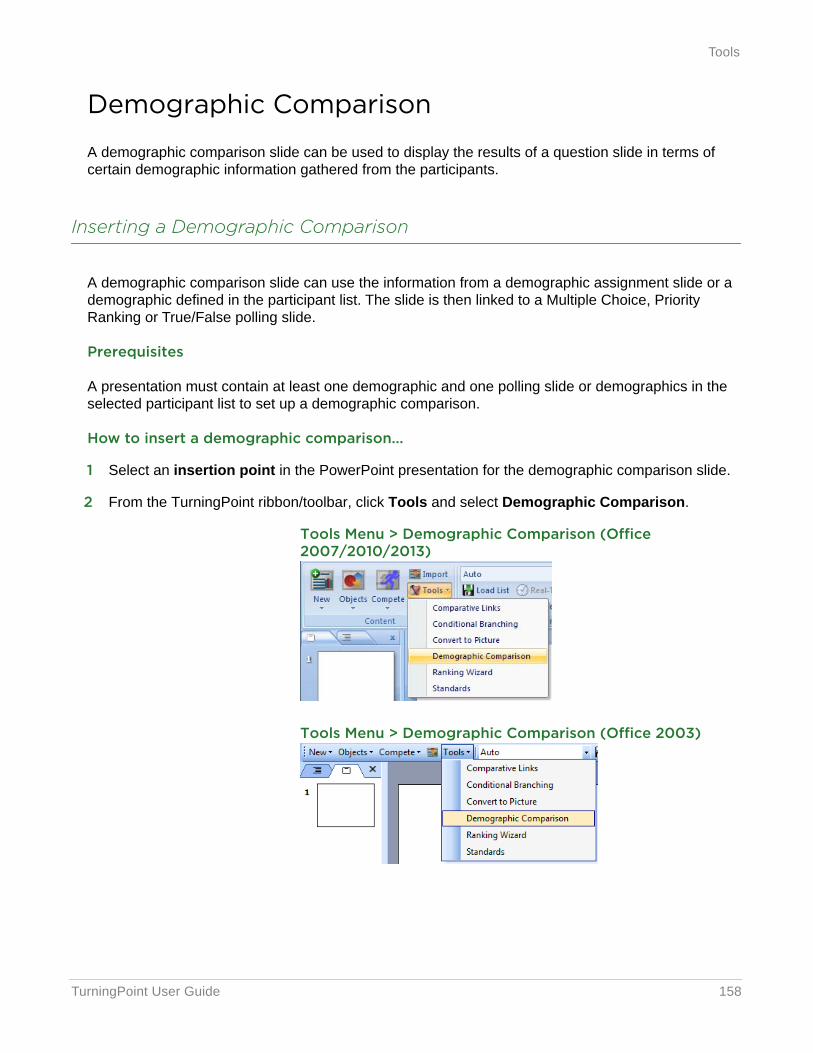
TurningPoint User Guide 158
Tools
Demographic Comparison
A demographic comparison slide can be used to display the results of a question slide in terms of certain demographic information gathered from the participants.
Inserting a Demographic Comparison
A demographic comparison slide can use the information from a demographic assignment slide or a demographic defined in the participant list. The slide is then linked to a Multiple Choice, Priority Ranking or True/False polling slide.
Prerequisites
A presentation must contain at least one demographic and one polling slide or demographics in the selected participant list to set up a demographic comparison.
How to insert a demographic comparison...
1 Select an insertion point in the PowerPoint presentation for the demographic comparison slide.
2 From the TurningPoint ribbon/toolbar, click Tools and select Demographic Comparison.
Tools Menu > Demographic Comparison (Office 2007/2010/2013)
Tools Menu > Demographic Comparison (Office 2003)
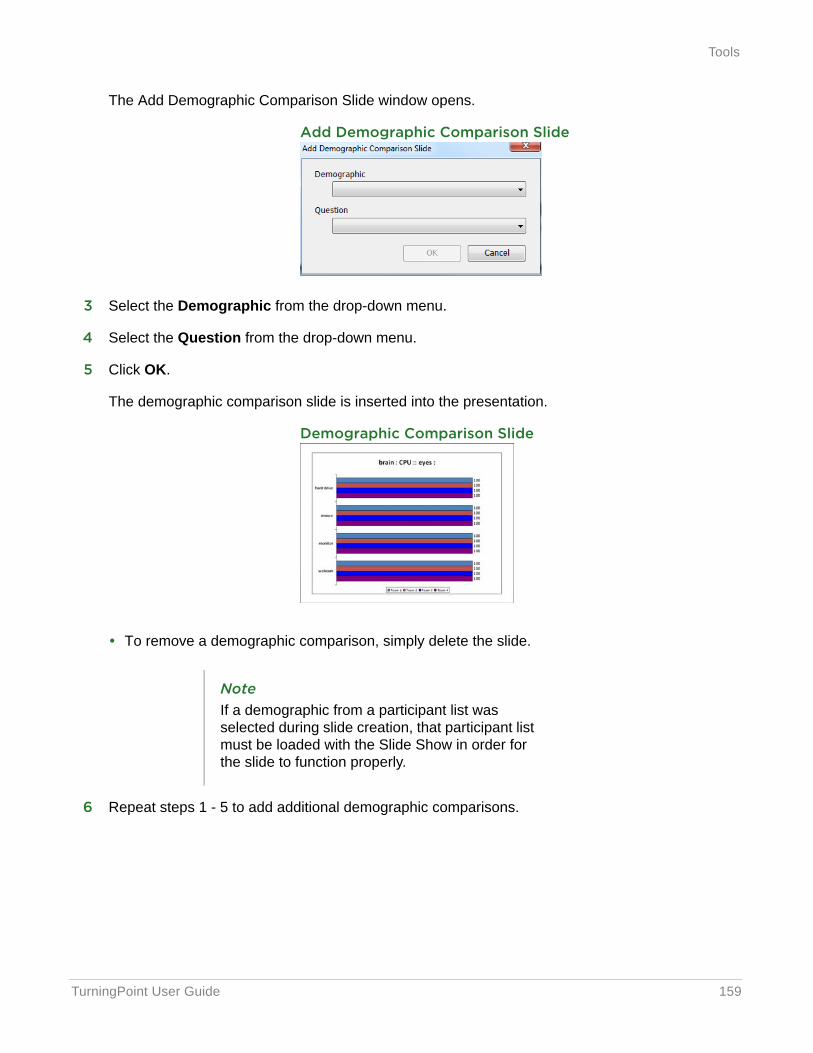
TurningPoint User Guide 159
Tools
The Add Demographic Comparison Slide window opens.
Add Demographic Comparison Slide
3 Select the Demographic from the drop-down menu.
4 Select the Question from the drop-down menu.
5 Click OK.
The demographic comparison slide is inserted into the presentation.
Demographic Comparison Slide
• To remove a demographic comparison, simply delete the slide.
6 Repeat steps 1 - 5 to add additional demographic comparisons.
NoteIf a demographic from a participant list was selected during slide creation, that participant list must be loaded with the Slide Show in order for the slide to function properly.
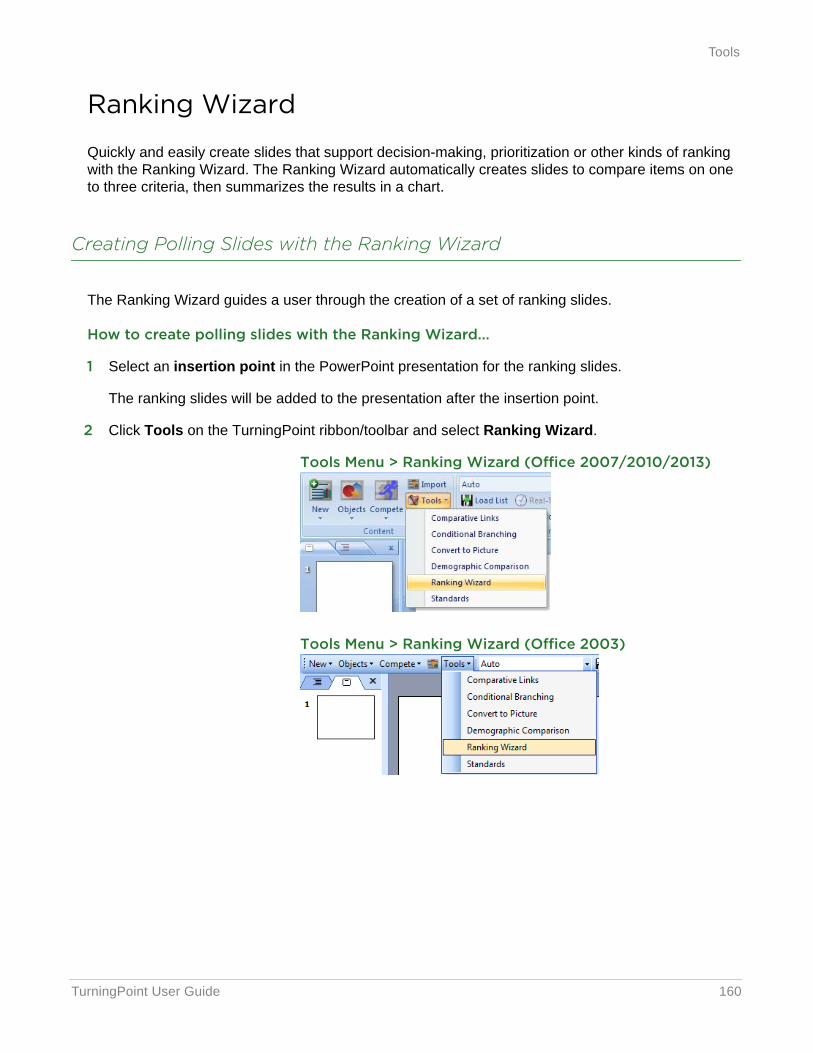
TurningPoint User Guide 160
Tools
Ranking Wizard
Quickly and easily create slides that support decision-making, prioritization or other kinds of ranking with the Ranking Wizard. The Ranking Wizard automatically creates slides to compare items on one to three criteria, then summarizes the results in a chart.
Creating Polling Slides with the Ranking Wizard
The Ranking Wizard guides a user through the creation of a set of ranking slides.
How to create polling slides with the Ranking Wizard...
1 Select an insertion point in the PowerPoint presentation for the ranking slides.
The ranking slides will be added to the presentation after the insertion point.
2 Click Tools on the TurningPoint ribbon/toolbar and select Ranking Wizard.
Tools Menu > Ranking Wizard (Office 2007/2010/2013)
Tools Menu > Ranking Wizard (Office 2003)
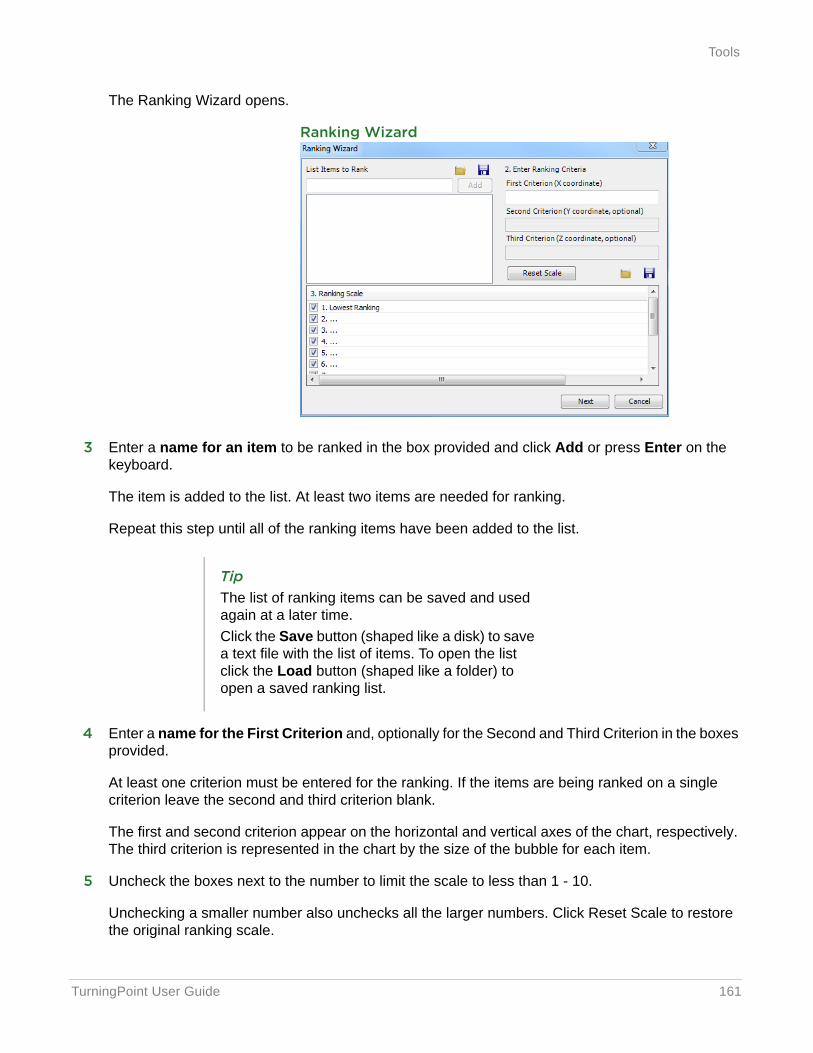
TurningPoint User Guide 161
Tools
The Ranking Wizard opens.
Ranking Wizard
3 Enter a name for an item to be ranked in the box provided and click Add or press Enter on the keyboard.
The item is added to the list. At least two items are needed for ranking.
Repeat this step until all of the ranking items have been added to the list.
4 Enter a name for the First Criterion and, optionally for the Second and Third Criterion in the boxes provided.
At least one criterion must be entered for the ranking. If the items are being ranked on a single criterion leave the second and third criterion blank.
The first and second criterion appear on the horizontal and vertical axes of the chart, respectively. The third criterion is represented in the chart by the size of the bubble for each item.
5 Uncheck the boxes next to the number to limit the scale to less than 1 - 10.
Unchecking a smaller number also unchecks all the larger numbers. Click Reset Scale to restore the original ranking scale.
TipThe list of ranking items can be saved and used again at a later time.Click the Save button (shaped like a disk) to save a text file with the list of items. To open the list click the Load button (shaped like a folder) to open a saved ranking list.
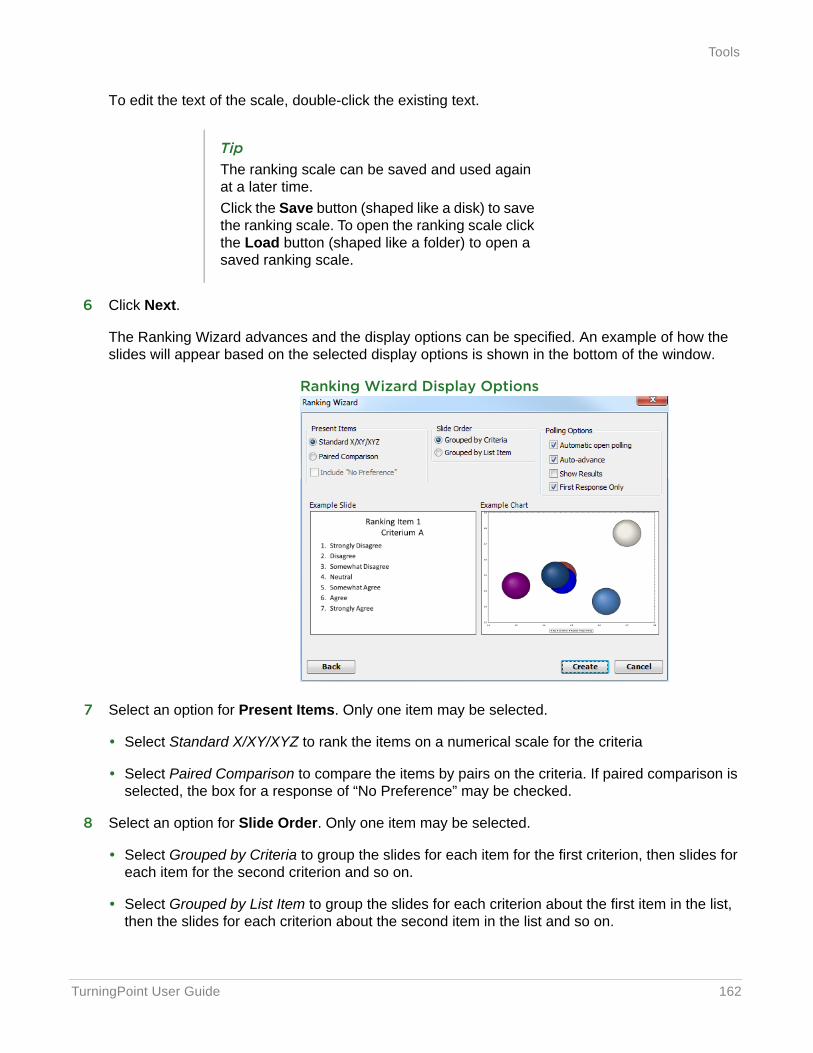
TurningPoint User Guide 162
Tools
To edit the text of the scale, double-click the existing text.
6 Click Next.
The Ranking Wizard advances and the display options can be specified. An example of how the slides will appear based on the selected display options is shown in the bottom of the window.
Ranking Wizard Display Options
7 Select an option for Present Items. Only one item may be selected.
• Select Standard X/XY/XYZ to rank the items on a numerical scale for the criteria
• Select Paired Comparison to compare the items by pairs on the criteria. If paired comparison is selected, the box for a response of “No Preference” may be checked.
8 Select an option for Slide Order. Only one item may be selected.
• Select Grouped by Criteria to group the slides for each item for the first criterion, then slides for each item for the second criterion and so on.
• Select Grouped by List Item to group the slides for each criterion about the first item in the list, then the slides for each criterion about the second item in the list and so on.
TipThe ranking scale can be saved and used again at a later time.Click the Save button (shaped like a disk) to save the ranking scale. To open the ranking scale click the Load button (shaped like a folder) to open a saved ranking scale.
TurningPoint User Guide 163
Tools
9 Select the Polling Options. Multiple items may be selected.
• Automatic open polling will open polling when each slide is displayed.
• Auto-advance automatically advances the slide after all participants have responded to a question if no chart is shown.
• Show Results will display a chart on each polling slide created by the Ranking Wizard.
• First Response Only will only accept the first response sent by each participant.
10 Click Create to create the ranking slides.
The ranking slides and ranking chart are inserted into the presentation. (This may take a few moments if there are a large number of items.)
Next Steps
When the presentation is run containing the ranking slides, the results will be compiled to generate the ranking chart, which is displayed in a slide following the ranking questions.
Standards
The standards tool allows for the use of downloaded K12 standards (per state or country, topic, subject and grade level), or to create a custom standards list on which participants can be evaluated. Standards for training, teaching and testing help organize the material in the presentation into subject areas, competencies and other criteria which the participants should meet.
To open the standards window, click Tools on the TurningPoint ribbon/toolbar and select Standards.
Detailed instructions for the standards tool can be found in Standards in Chapter 2: Content on page 60.
WarningThe slides created by the Ranking Wizard should not be altered because the Ranking Wizard uses the results from the created slides to construct the final chart.
NoteStandards assigned in a question list and imported into PowerPoint do not need to be reassigned.

TurningPoint User Guide 164
Polling
PollingThe polling function in PowerPoint allows a user to poll an audience with questions embedded directly into the PowerPoint presentation.
The Polling section covers the following topics:
• Resetting a PowerPoint Polling Session or Charts
• Continuing a Prior PowerPoint Polling Session
• Using the Real-Time Registration Tool
• Running a Slide Show
• The PowerPoint Polling Showbar
• Viewing a Response Grid
• Using the Participant Monitor
• Messaging
• Inserting New Slides During the Presentation
• Using Data Slicing
• Saving a PowerPoint Polling Session
Resetting a PowerPoint Polling Session or Charts
The reset option on the TurningPoint ribbon/toolbar gives the user the option of removing data from a session so it can be repolled or the option to reset the charts.
How to reset a PowerPoint Polling session...
1 Click Reset on the TurningPoint ribbon/toolbar.
2 Select one of the following options:
WarningOnce the reset function has been performed, it cannot be undone.
TurningPoint User Guide 165
Polling
• Session - All of the results from the session file will be reset and all of the participant data will be removed.
• Selected Charts (Slides) - Any selected chart(s) will be reset but the session data and participant information will NOT be removed. When the presentation is run, the previous session data will also be stored in the session file.
3 If Session was selected in the previous step, click Save or Don’t Save to save the current session data.
Next Steps
Now that the session or charts have been reset, a new session can be run. For more information on running a session, see Running a Slide Show on page 167.
Continuing a Prior PowerPoint Polling Session
TurningPoint can resume a presentation from a saved session file. New session information is appended to the open session file. When saved, the polling results are saved in one session file.
How to continue a prior PowerPoint Polling session...
1 Click Continue Prior Session from the TurningPoint ribbon/toolbar.
2 Select the session file to be continued and click Open.
TurningPoint opens the previously saved session file.
Next Steps
Now that the previous session is open, it can now be continued. For more information on running a session, see Running a Slide Show on page 167.
Using the Real-Time Registration Tool
The Real-Time Registration tool provides a fast and simple way to utilize a participant list for smaller audiences (ideally less than 50 participants). Registration only takes a few moments, thus eliminating the need for a permanent participant list. The steps below can be performed before each presentation to ensure each participant has the appropriate response device.
Prerequisites
A participant list that contains names (Device IDs are optional) is required. For instructions on how to create a participant list, see Chapter 3: Participant Lists.
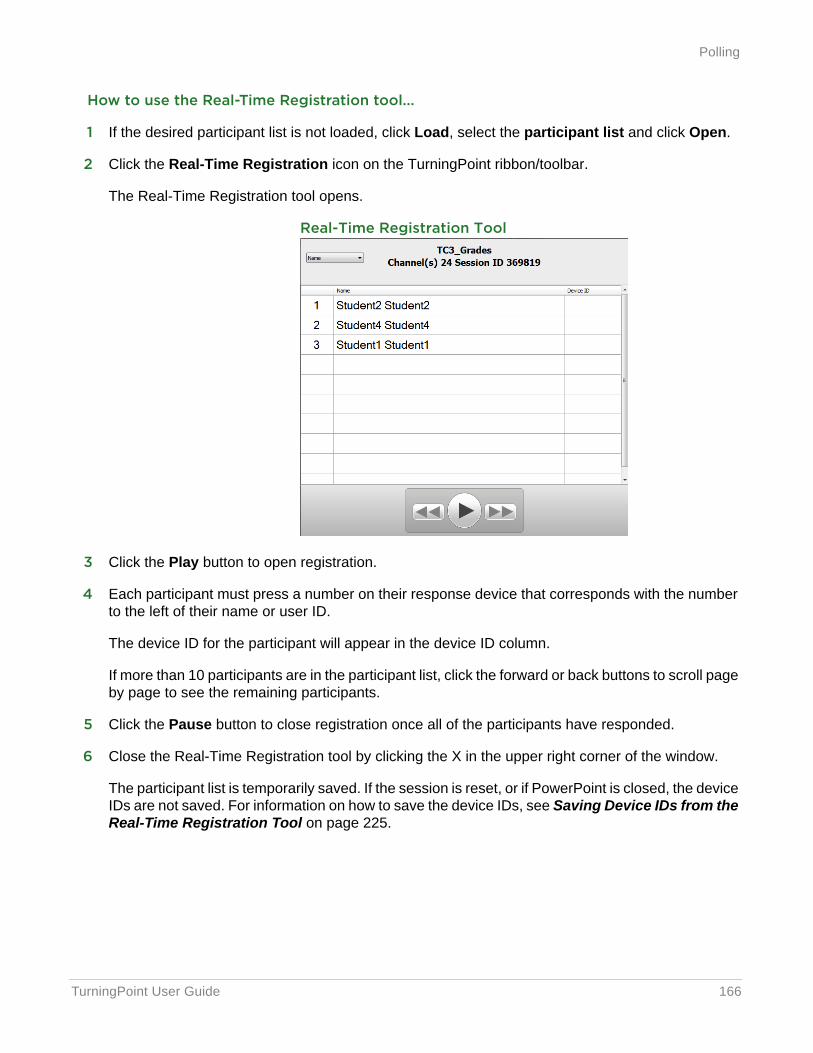
TurningPoint User Guide 166
Polling
How to use the Real-Time Registration tool...
1 If the desired participant list is not loaded, click Load, select the participant list and click Open.
2 Click the Real-Time Registration icon on the TurningPoint ribbon/toolbar.
The Real-Time Registration tool opens.
Real-Time Registration Tool
3 Click the Play button to open registration.
4 Each participant must press a number on their response device that corresponds with the number to the left of their name or user ID.
The device ID for the participant will appear in the device ID column.
If more than 10 participants are in the participant list, click the forward or back buttons to scroll page by page to see the remaining participants.
5 Click the Pause button to close registration once all of the participants have responded.
6 Close the Real-Time Registration tool by clicking the X in the upper right corner of the window.
The participant list is temporarily saved. If the session is reset, or if PowerPoint is closed, the device IDs are not saved. For information on how to save the device IDs, see Saving Device IDs from the Real-Time Registration Tool on page 225.
TurningPoint User Guide 167
Polling
Running a Slide Show
Use the PowerPoint Slide Show functionality to run the polling presentation.
Prerequisites
To poll in PowerPoint, a presentation with polling slides or a question list is required. To track results based on participants, a participant list is also required. For more information on creating a PowerPoint Polling presentation, see Content on page 111.
How to run a PowerPoint Polling Slide Show...
1 Plug in the receiver or establish a ResponseWare session.
2 Open TurningPoint and select a participant list and a question list, or a PowerPoint presentation, if applicable.
3 Click PowerPoint Polling.
The TurningPoint Dashboard closes and PowerPoint opens. If a question list was selected, TurningPoint will automatically parse the content into polling slides. This may take a few moments if there are a large number of questions in the question list.
4 Select the TurningPoint ribbon/toolbar.
5 Open the PowerPoint presentation that contains the question slides if a question list was not selected before PowerPoint was opened.
6 Verify the correct participant list is loaded and Live Polling is selected in the Polling drop-down box.
7 Start the Slide Show.
8 Depending on the Polling Options that were selected during content creation, the slide may need to be advanced to open polling.
9 Continue until the Slide Show is finished.
Next Steps
Now that the Slide Show is finished and the results have been gathered, the session data needs to be saved in order to generate reports and manage results.
For more information on saving session files, see Saving a PowerPoint Polling Session on page 176.
NoteFor information on how to establish a ResponseWare session, see Setting Up ResponseWare on page 17.
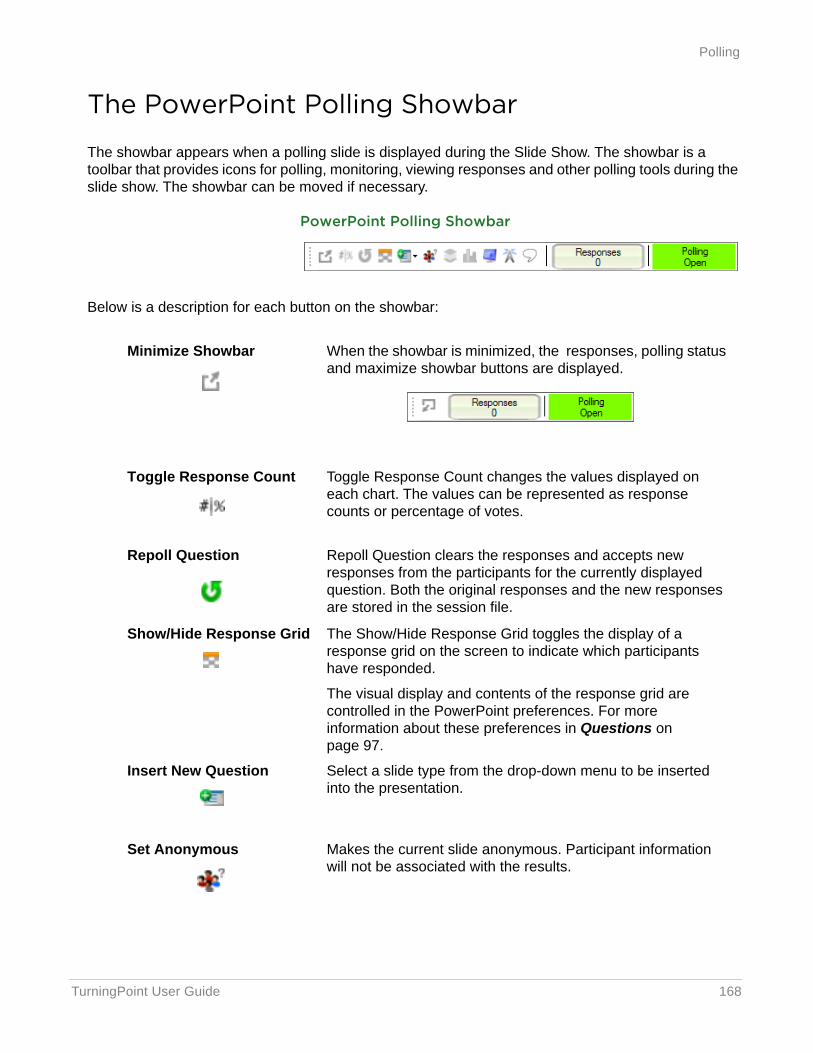
TurningPoint User Guide 168
Polling
The PowerPoint Polling Showbar
The showbar appears when a polling slide is displayed during the Slide Show. The showbar is a toolbar that provides icons for polling, monitoring, viewing responses and other polling tools during the slide show. The showbar can be moved if necessary.
PowerPoint Polling Showbar
Below is a description for each button on the showbar:
Minimize Showbar When the showbar is minimized, the responses, polling status and maximize showbar buttons are displayed.
Toggle Response Count Toggle Response Count changes the values displayed on each chart. The values can be represented as response counts or percentage of votes.
Repoll Question Repoll Question clears the responses and accepts new responses from the participants for the currently displayed question. Both the original responses and the new responses are stored in the session file.
Show/Hide Response Grid The Show/Hide Response Grid toggles the display of a response grid on the screen to indicate which participants have responded.
The visual display and contents of the response grid are controlled in the PowerPoint preferences. For more information about these preferences in Questions on page 97.
Insert New Question Select a slide type from the drop-down menu to be inserted into the presentation.
Set Anonymous Makes the current slide anonymous. Participant information will not be associated with the results.
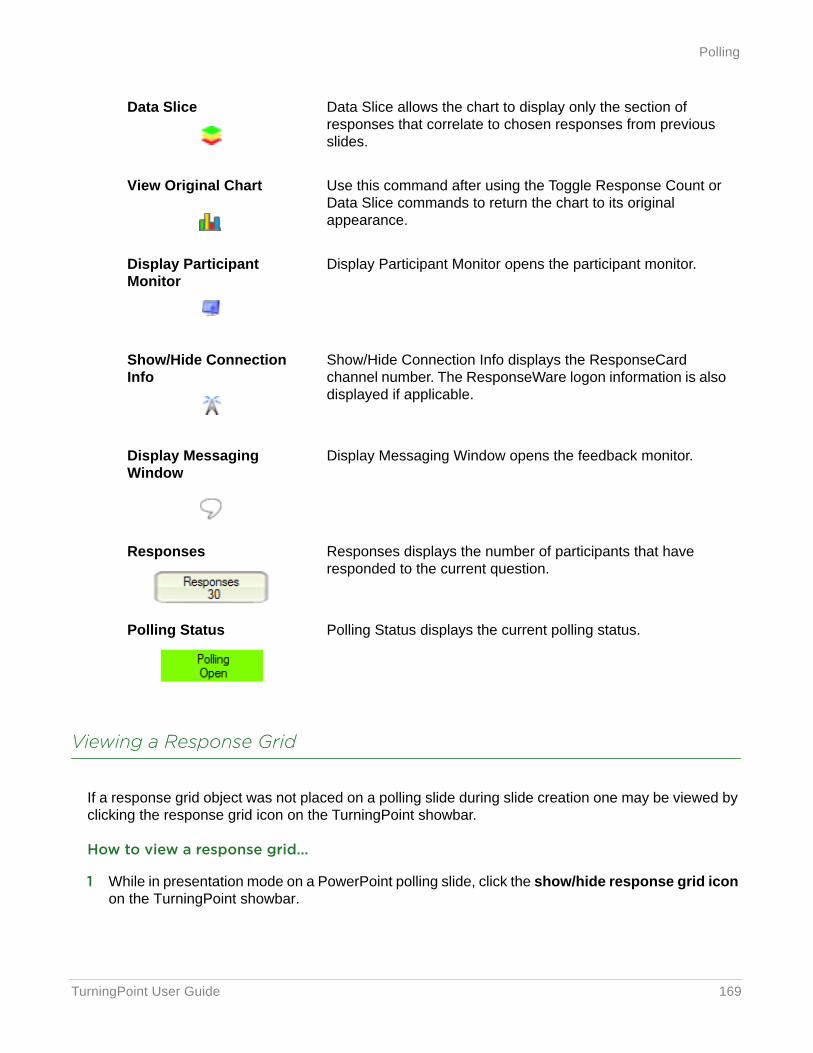
TurningPoint User Guide 169
Polling
Viewing a Response Grid
If a response grid object was not placed on a polling slide during slide creation one may be viewed by clicking the response grid icon on the TurningPoint showbar.
How to view a response grid...
1 While in presentation mode on a PowerPoint polling slide, click the show/hide response grid icon on the TurningPoint showbar.
Data Slice Data Slice allows the chart to display only the section of responses that correlate to chosen responses from previous slides.
View Original Chart Use this command after using the Toggle Response Count or Data Slice commands to return the chart to its original appearance.
Display Participant Monitor
Display Participant Monitor opens the participant monitor.
Show/Hide Connection Info
Show/Hide Connection Info displays the ResponseCard channel number. The ResponseWare logon information is also displayed if applicable.
Display Messaging Window
Display Messaging Window opens the feedback monitor.
Responses Responses displays the number of participants that have responded to the current question.
Polling Status Polling Status displays the current polling status.
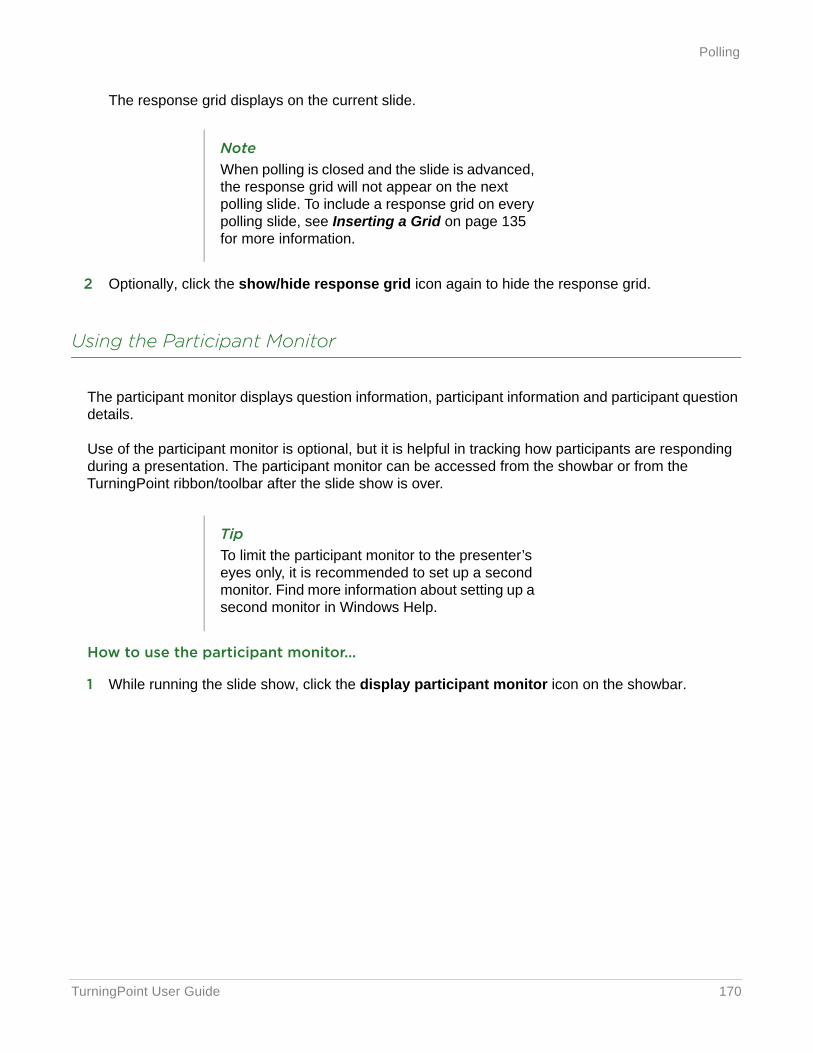
TurningPoint User Guide 170
Polling
The response grid displays on the current slide.
2 Optionally, click the show/hide response grid icon again to hide the response grid.
Using the Participant Monitor
The participant monitor displays question information, participant information and participant question details.
Use of the participant monitor is optional, but it is helpful in tracking how participants are responding during a presentation. The participant monitor can be accessed from the showbar or from the TurningPoint ribbon/toolbar after the slide show is over.
How to use the participant monitor...
1 While running the slide show, click the display participant monitor icon on the showbar.
NoteWhen polling is closed and the slide is advanced, the response grid will not appear on the next polling slide. To include a response grid on every polling slide, see Inserting a Grid on page 135 for more information.
TipTo limit the participant monitor to the presenter’s eyes only, it is recommended to set up a second monitor. Find more information about setting up a second monitor in Windows Help.
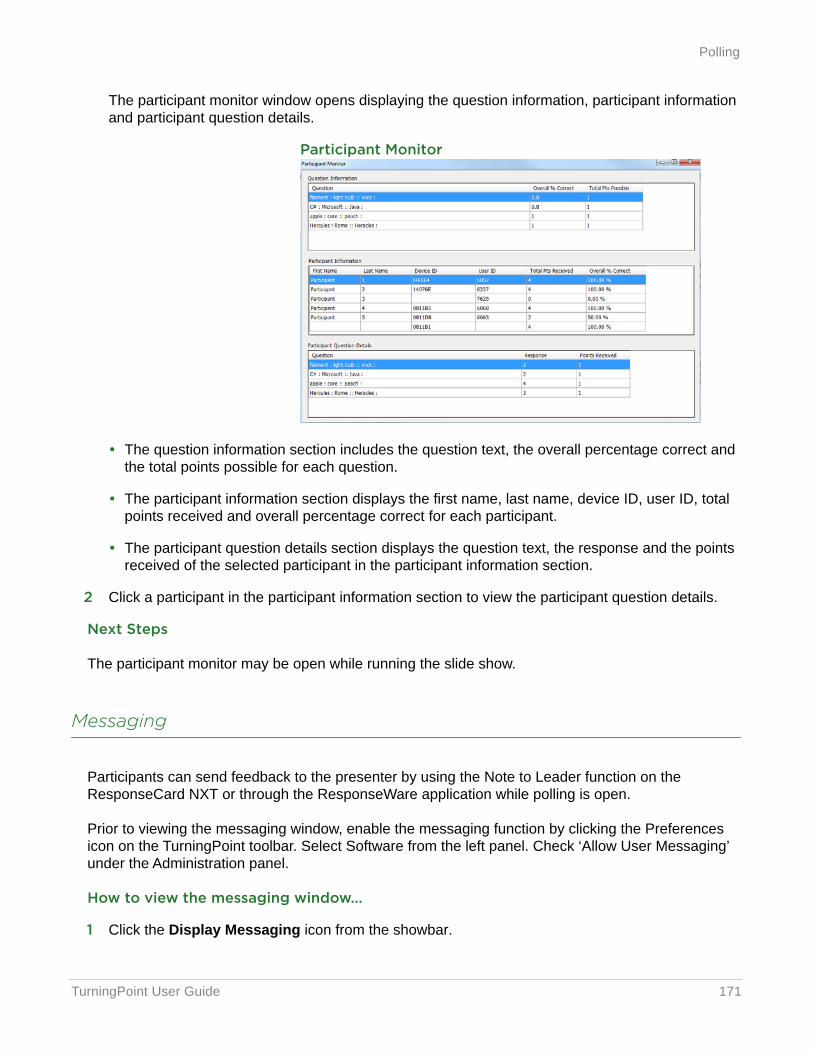
TurningPoint User Guide 171
Polling
The participant monitor window opens displaying the question information, participant information and participant question details.
Participant Monitor
• The question information section includes the question text, the overall percentage correct and the total points possible for each question.
• The participant information section displays the first name, last name, device ID, user ID, total points received and overall percentage correct for each participant.
• The participant question details section displays the question text, the response and the points received of the selected participant in the participant information section.
2 Click a participant in the participant information section to view the participant question details.
Next Steps
The participant monitor may be open while running the slide show.
Messaging
Participants can send feedback to the presenter by using the Note to Leader function on the ResponseCard NXT or through the ResponseWare application while polling is open.
Prior to viewing the messaging window, enable the messaging function by clicking the Preferences icon on the TurningPoint toolbar. Select Software from the left panel. Check ‘Allow User Messaging’ under the Administration panel.
How to view the messaging window...
1 Click the Display Messaging icon from the showbar.
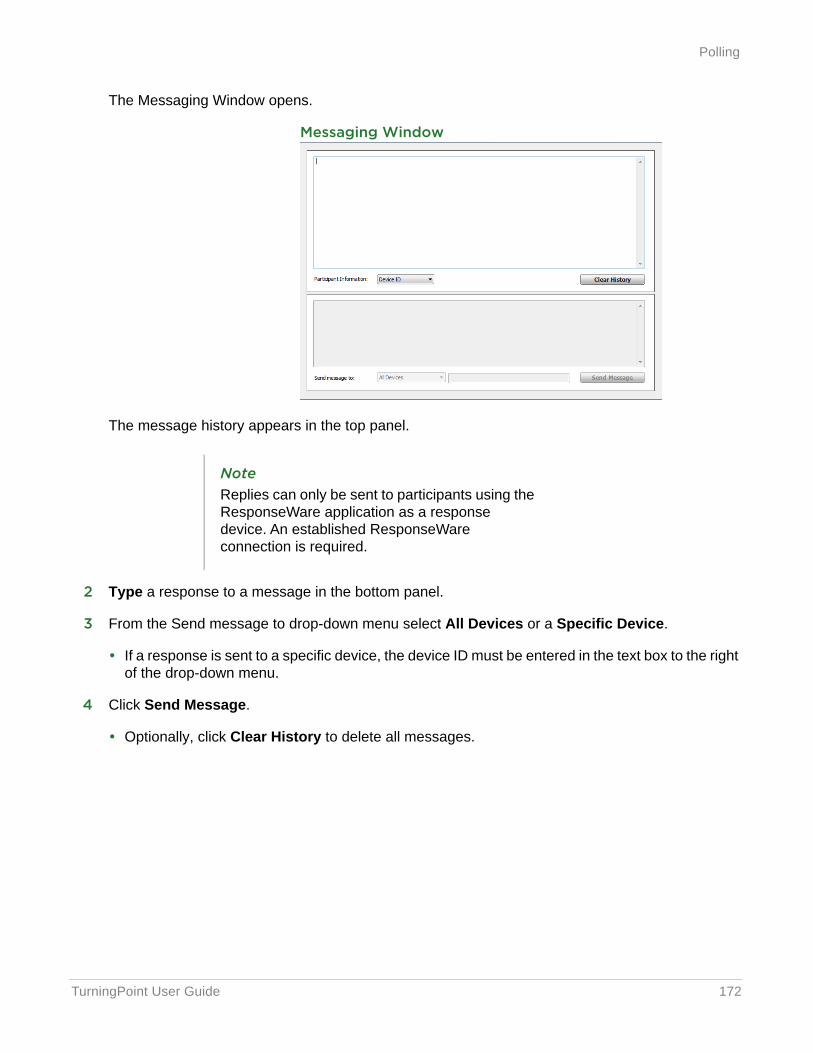
TurningPoint User Guide 172
Polling
The Messaging Window opens.
Messaging Window
The message history appears in the top panel.
2 Type a response to a message in the bottom panel.
3 From the Send message to drop-down menu select All Devices or a Specific Device.
• If a response is sent to a specific device, the device ID must be entered in the text box to the right of the drop-down menu.
4 Click Send Message.
• Optionally, click Clear History to delete all messages.
NoteReplies can only be sent to participants using the ResponseWare application as a response device. An established ResponseWare connection is required.
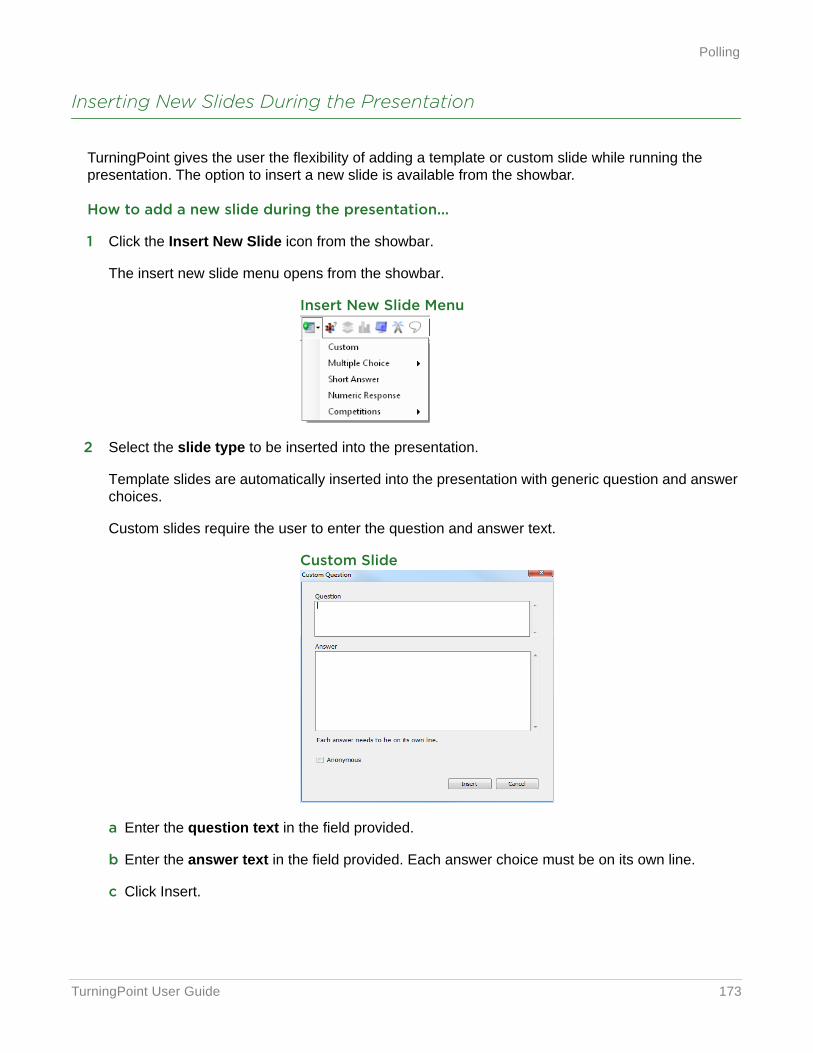
TurningPoint User Guide 173
Polling
Inserting New Slides During the Presentation
TurningPoint gives the user the flexibility of adding a template or custom slide while running the presentation. The option to insert a new slide is available from the showbar.
How to add a new slide during the presentation...
1 Click the Insert New Slide icon from the showbar.
The insert new slide menu opens from the showbar.
Insert New Slide Menu
2 Select the slide type to be inserted into the presentation.
Template slides are automatically inserted into the presentation with generic question and answer choices.
Custom slides require the user to enter the question and answer text.
Custom Slide
a Enter the question text in the field provided.
b Enter the answer text in the field provided. Each answer choice must be on its own line.
c Click Insert.
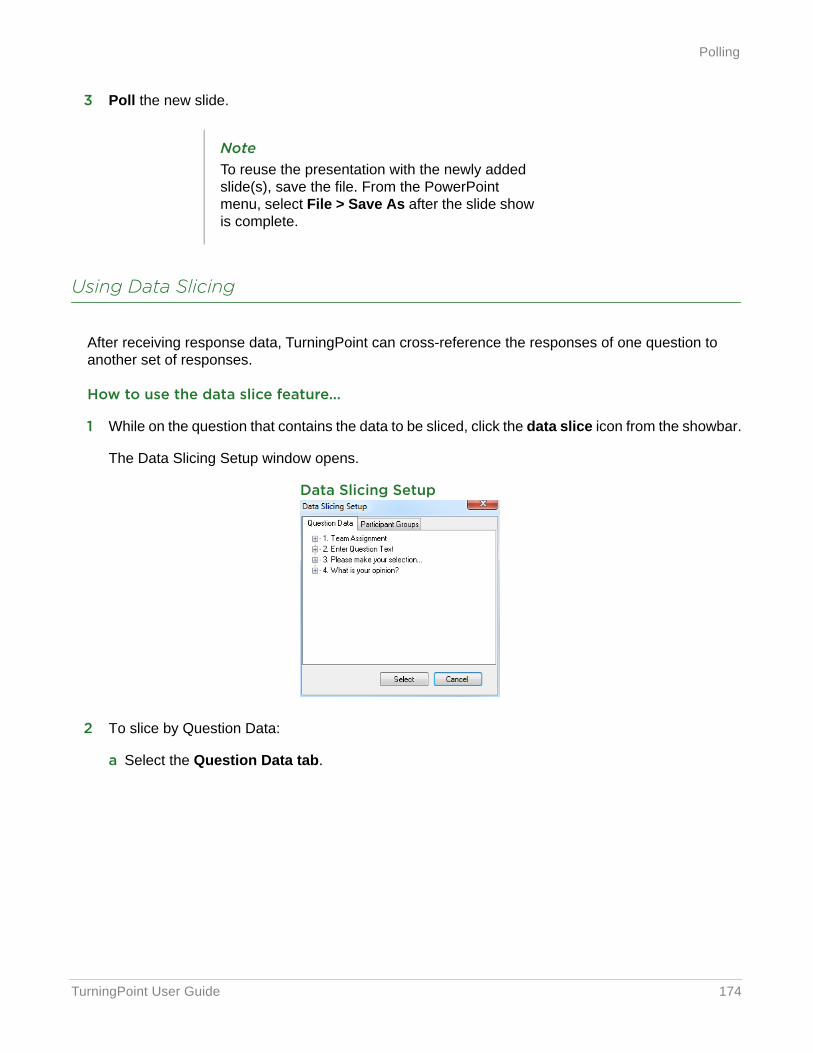
TurningPoint User Guide 174
Polling
3 Poll the new slide.
Using Data Slicing
After receiving response data, TurningPoint can cross-reference the responses of one question to another set of responses.
How to use the data slice feature...
1 While on the question that contains the data to be sliced, click the data slice icon from the showbar.
The Data Slicing Setup window opens.
Data Slicing Setup
2 To slice by Question Data:
a Select the Question Data tab.
NoteTo reuse the presentation with the newly added slide(s), save the file. From the PowerPoint menu, select File > Save As after the slide show is complete.
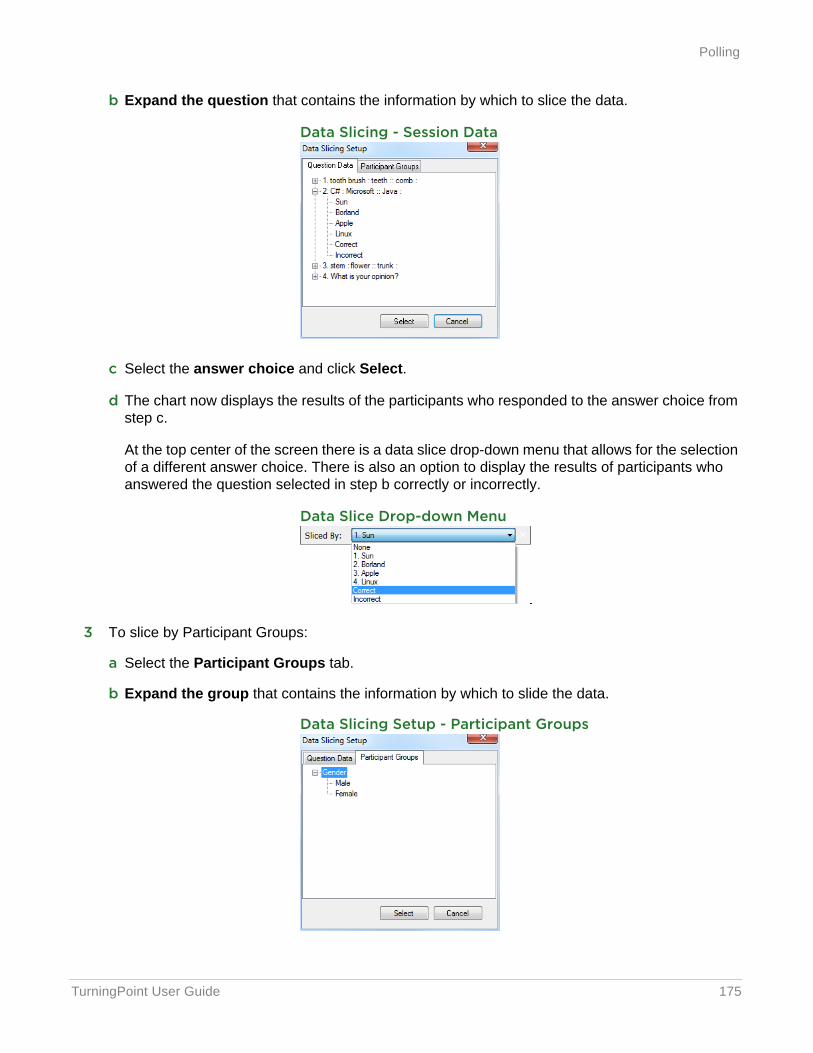
TurningPoint User Guide 175
Polling
b Expand the question that contains the information by which to slice the data.
Data Slicing - Session Data
c Select the answer choice and click Select.
d The chart now displays the results of the participants who responded to the answer choice from step c.
At the top center of the screen there is a data slice drop-down menu that allows for the selection of a different answer choice. There is also an option to display the results of participants who answered the question selected in step b correctly or incorrectly.
Data Slice Drop-down Menu
3 To slice by Participant Groups:
a Select the Participant Groups tab.
b Expand the group that contains the information by which to slide the data.
Data Slicing Setup - Participant Groups
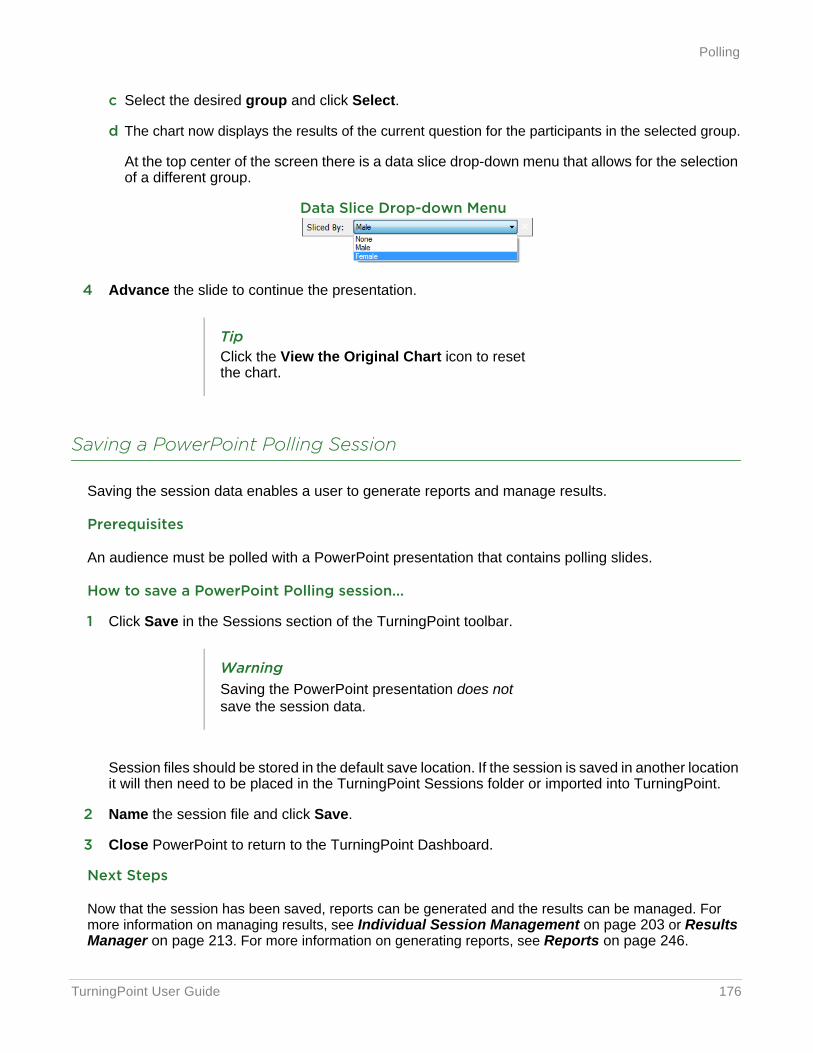
TurningPoint User Guide 176
Polling
c Select the desired group and click Select.
d The chart now displays the results of the current question for the participants in the selected group.
At the top center of the screen there is a data slice drop-down menu that allows for the selection of a different group.
Data Slice Drop-down Menu
4 Advance the slide to continue the presentation.
Saving a PowerPoint Polling Session
Saving the session data enables a user to generate reports and manage results.
Prerequisites
An audience must be polled with a PowerPoint presentation that contains polling slides.
How to save a PowerPoint Polling session...
1 Click Save in the Sessions section of the TurningPoint toolbar.
Session files should be stored in the default save location. If the session is saved in another location it will then need to be placed in the TurningPoint Sessions folder or imported into TurningPoint.
2 Name the session file and click Save.
3 Close PowerPoint to return to the TurningPoint Dashboard.
Next Steps
Now that the session has been saved, reports can be generated and the results can be managed. For more information on managing results, see Individual Session Management on page 203 or Results Manager on page 213. For more information on generating reports, see Reports on page 246.
TipClick the View the Original Chart icon to reset the chart.
WarningSaving the PowerPoint presentation does not save the session data.

TurningPoint User Guide 177
6 Anywhere Polling
Anywhere Polling allows the user to poll atop any application, including web pages, videos and documents, using a floating interactive toolbar.
This chapter covers the following sections:
• Polling
• Sessions
TurningPoint User Guide 178
Polling
PollingThe polling function in Anywhere allows a user to poll an audience with any application.
This section covers the following topics:
• Running a Session
• About the Anywhere Polling Showbar
• About the Chart Window
• Quick Poll Question Types
• Marking a Question as Anonymous
• Using the Real-Time Registration Tool
• Messaging
Running a Session
Anywhere Polling allows for polling atop any application.
How to run an Anywhere Polling session...
1 Plug in the receiver or establish a ResponseWare session.
2 Open TurningPoint and select a participant list and a question list, if applicable.
3 Click Anywhere Polling.
NoteFor information on how to establish a ResponseWare session, see Setting Up ResponseWare on page 17.
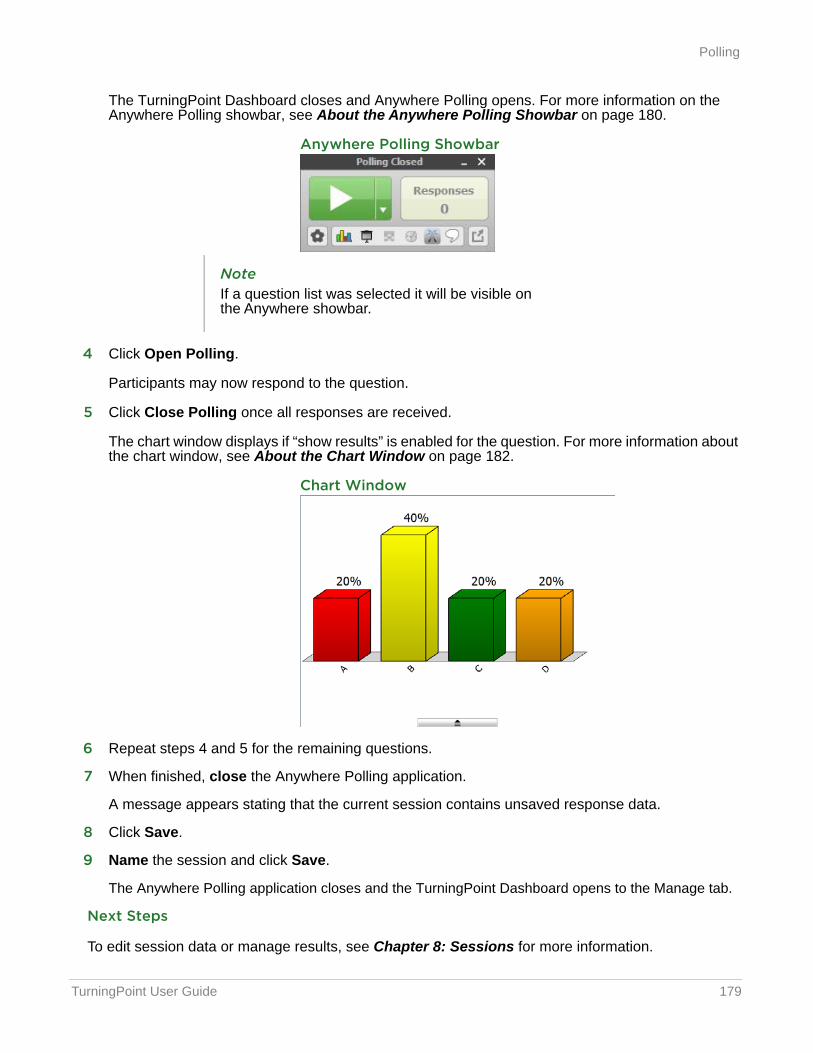
TurningPoint User Guide 179
Polling
The TurningPoint Dashboard closes and Anywhere Polling opens. For more information on the Anywhere Polling showbar, see About the Anywhere Polling Showbar on page 180.
Anywhere Polling Showbar
4 Click Open Polling.
Participants may now respond to the question.
5 Click Close Polling once all responses are received.
The chart window displays if “show results” is enabled for the question. For more information about the chart window, see About the Chart Window on page 182.
Chart Window
6 Repeat steps 4 and 5 for the remaining questions.
7 When finished, close the Anywhere Polling application.
A message appears stating that the current session contains unsaved response data.
8 Click Save.
9 Name the session and click Save.
The Anywhere Polling application closes and the TurningPoint Dashboard opens to the Manage tab.
Next Steps
To edit session data or manage results, see Chapter 8: Sessions for more information.
NoteIf a question list was selected it will be visible on the Anywhere showbar.
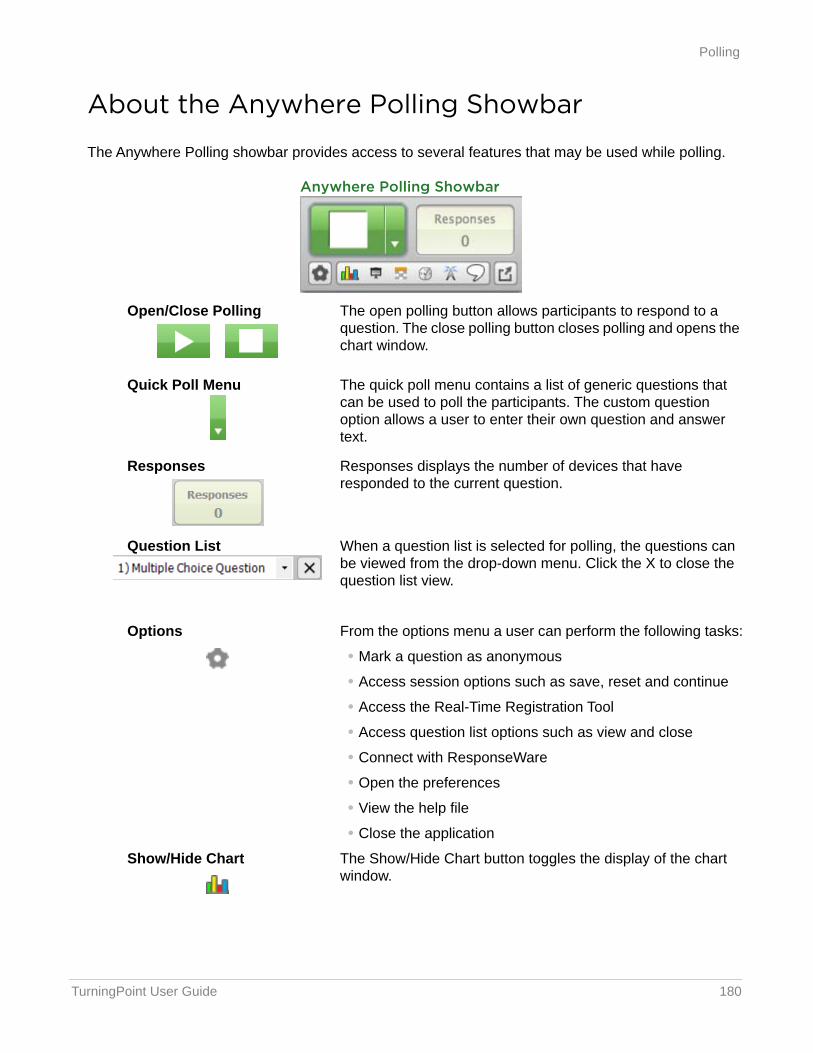
TurningPoint User Guide 180
Polling
About the Anywhere Polling Showbar
The Anywhere Polling showbar provides access to several features that may be used while polling.
Anywhere Polling Showbar
Open/Close Polling The open polling button allows participants to respond to a question. The close polling button closes polling and opens the chart window.
Quick Poll Menu The quick poll menu contains a list of generic questions that can be used to poll the participants. The custom question option allows a user to enter their own question and answer text.
Responses Responses displays the number of devices that have responded to the current question.
Question List When a question list is selected for polling, the questions can be viewed from the drop-down menu. Click the X to close the question list view.
Options From the options menu a user can perform the following tasks:
• Mark a question as anonymous
• Access session options such as save, reset and continue
• Access the Real-Time Registration Tool
• Access question list options such as view and close
• Connect with ResponseWare
• Open the preferences
• View the help file
• Close the application
Show/Hide Chart The Show/Hide Chart button toggles the display of the chart window.
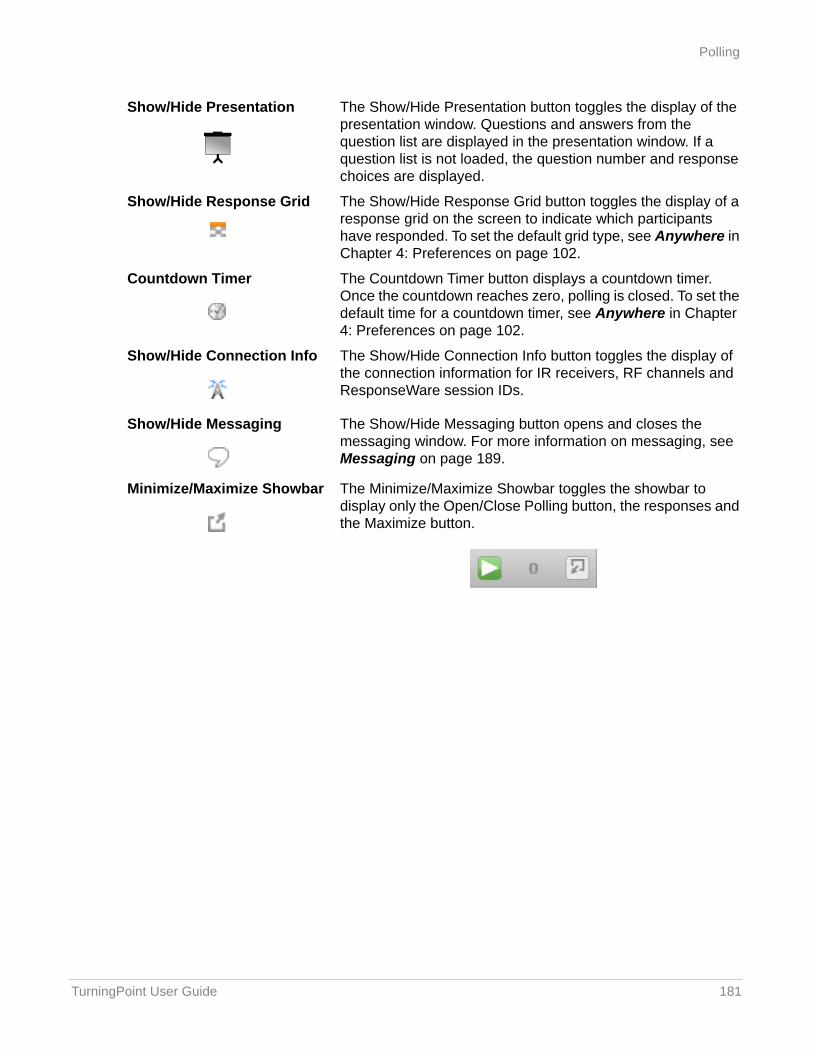
TurningPoint User Guide 181
Polling
Show/Hide Presentation The Show/Hide Presentation button toggles the display of the presentation window. Questions and answers from the question list are displayed in the presentation window. If a question list is not loaded, the question number and response choices are displayed.
Show/Hide Response Grid The Show/Hide Response Grid button toggles the display of a response grid on the screen to indicate which participants have responded. To set the default grid type, see Anywhere in Chapter 4: Preferences on page 102.
Countdown Timer The Countdown Timer button displays a countdown timer. Once the countdown reaches zero, polling is closed. To set the default time for a countdown timer, see Anywhere in Chapter 4: Preferences on page 102.
Show/Hide Connection Info The Show/Hide Connection Info button toggles the display of the connection information for IR receivers, RF channels and ResponseWare session IDs.
Show/Hide Messaging The Show/Hide Messaging button opens and closes the messaging window. For more information on messaging, see Messaging on page 189.
Minimize/Maximize Showbar The Minimize/Maximize Showbar toggles the showbar to display only the Open/Close Polling button, the responses and the Maximize button.
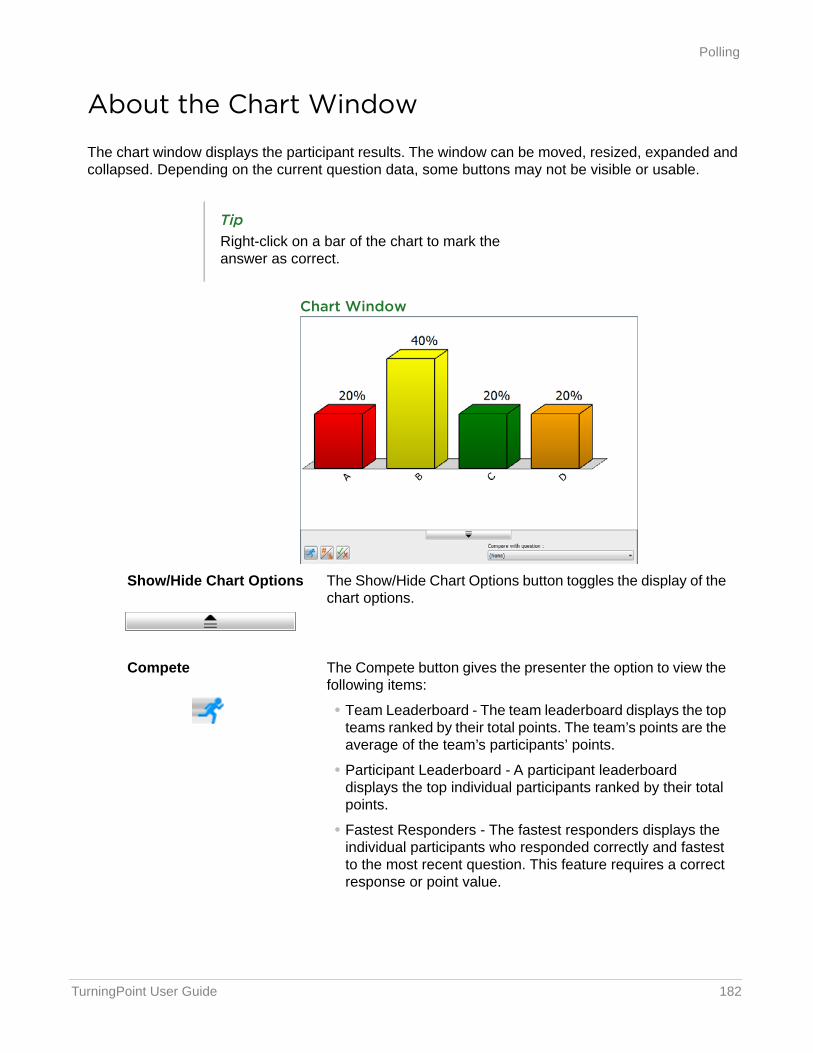
TurningPoint User Guide 182
Polling
About the Chart Window
The chart window displays the participant results. The window can be moved, resized, expanded and collapsed. Depending on the current question data, some buttons may not be visible or usable.
Chart Window
TipRight-click on a bar of the chart to mark the answer as correct.
Show/Hide Chart Options The Show/Hide Chart Options button toggles the display of the chart options.
Compete The Compete button gives the presenter the option to view the following items:
• Team Leaderboard - The team leaderboard displays the top teams ranked by their total points. The team’s points are the average of the team’s participants’ points.
• Participant Leaderboard - A participant leaderboard displays the top individual participants ranked by their total points.
• Fastest Responders - The fastest responders displays the individual participants who responded correctly and fastest to the most recent question. This feature requires a correct response or point value.
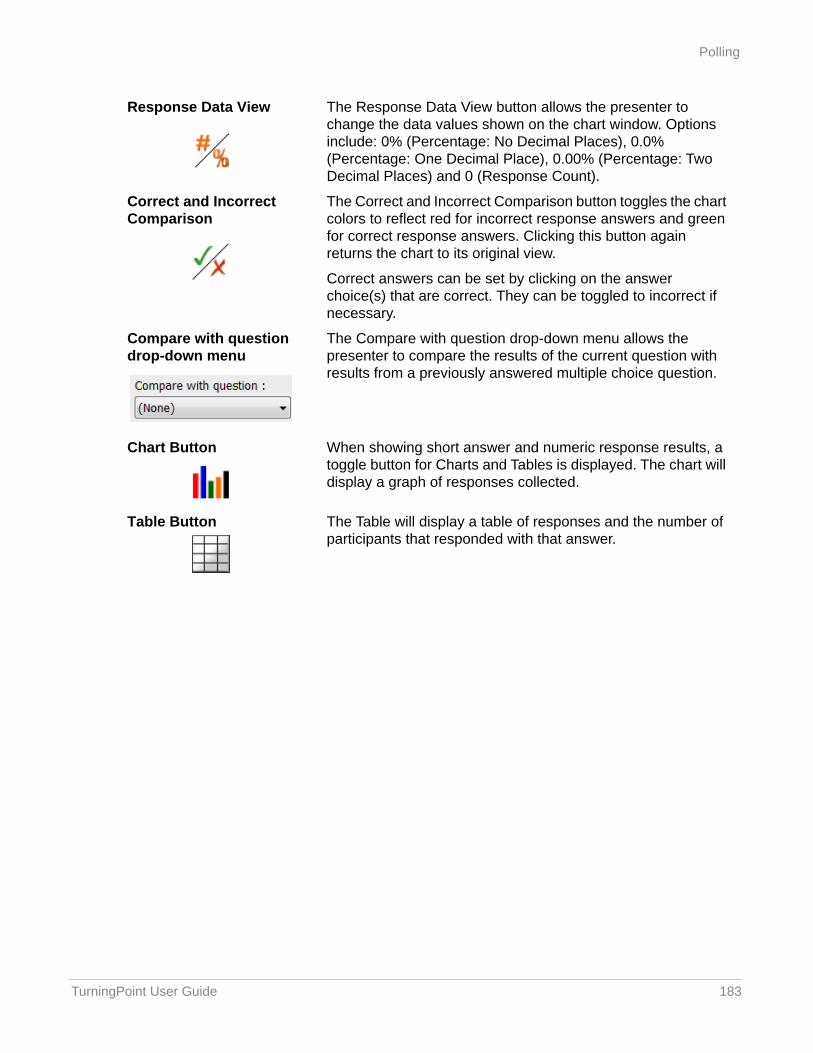
TurningPoint User Guide 183
Polling
Response Data View The Response Data View button allows the presenter to change the data values shown on the chart window. Options include: 0% (Percentage: No Decimal Places), 0.0% (Percentage: One Decimal Place), 0.00% (Percentage: Two Decimal Places) and 0 (Response Count).
Correct and Incorrect Comparison
The Correct and Incorrect Comparison button toggles the chart colors to reflect red for incorrect response answers and green for correct response answers. Clicking this button again returns the chart to its original view.
Correct answers can be set by clicking on the answer choice(s) that are correct. They can be toggled to incorrect if necessary.
Compare with question drop-down menu
The Compare with question drop-down menu allows the presenter to compare the results of the current question with results from a previously answered multiple choice question.
Chart Button When showing short answer and numeric response results, a toggle button for Charts and Tables is displayed. The chart will display a graph of responses collected.
Table Button The Table will display a table of responses and the number of participants that responded with that answer.
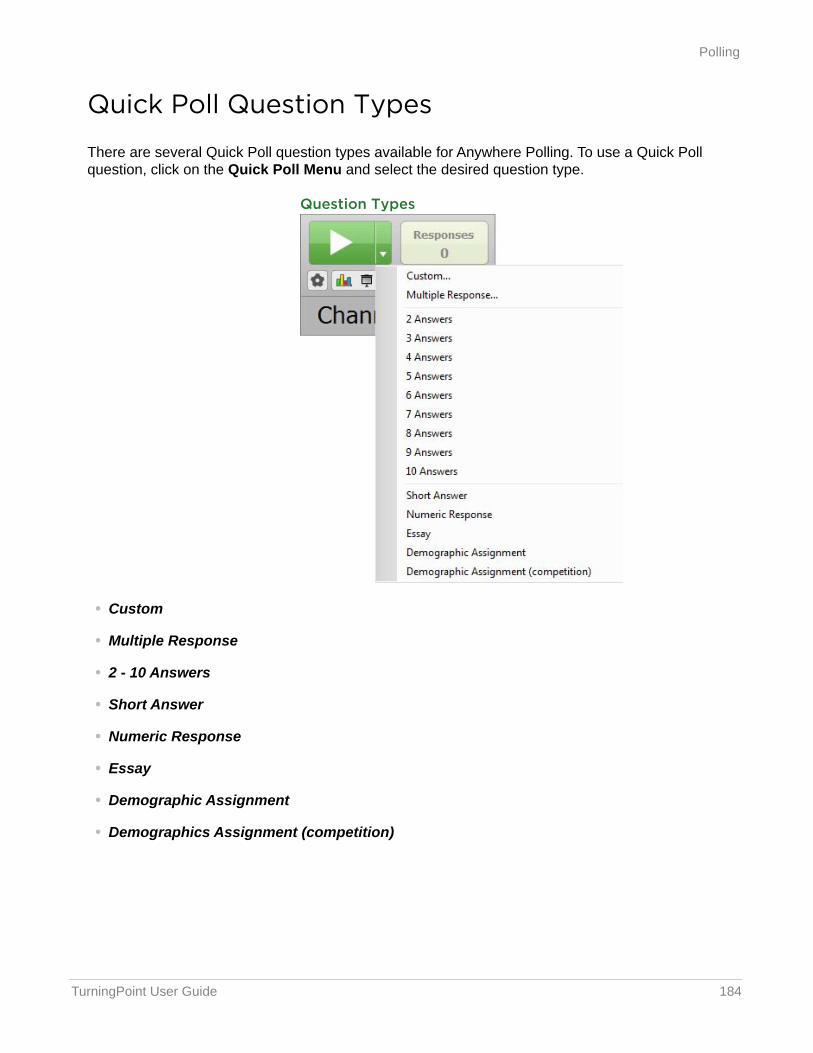
TurningPoint User Guide 184
Polling
Quick Poll Question Types
There are several Quick Poll question types available for Anywhere Polling. To use a Quick Poll question, click on the Quick Poll Menu and select the desired question type.
Question Types
• Custom
• Multiple Response
• 2 - 10 Answers
• Short Answer
• Numeric Response
• Essay
• Demographic Assignment
• Demographics Assignment (competition)
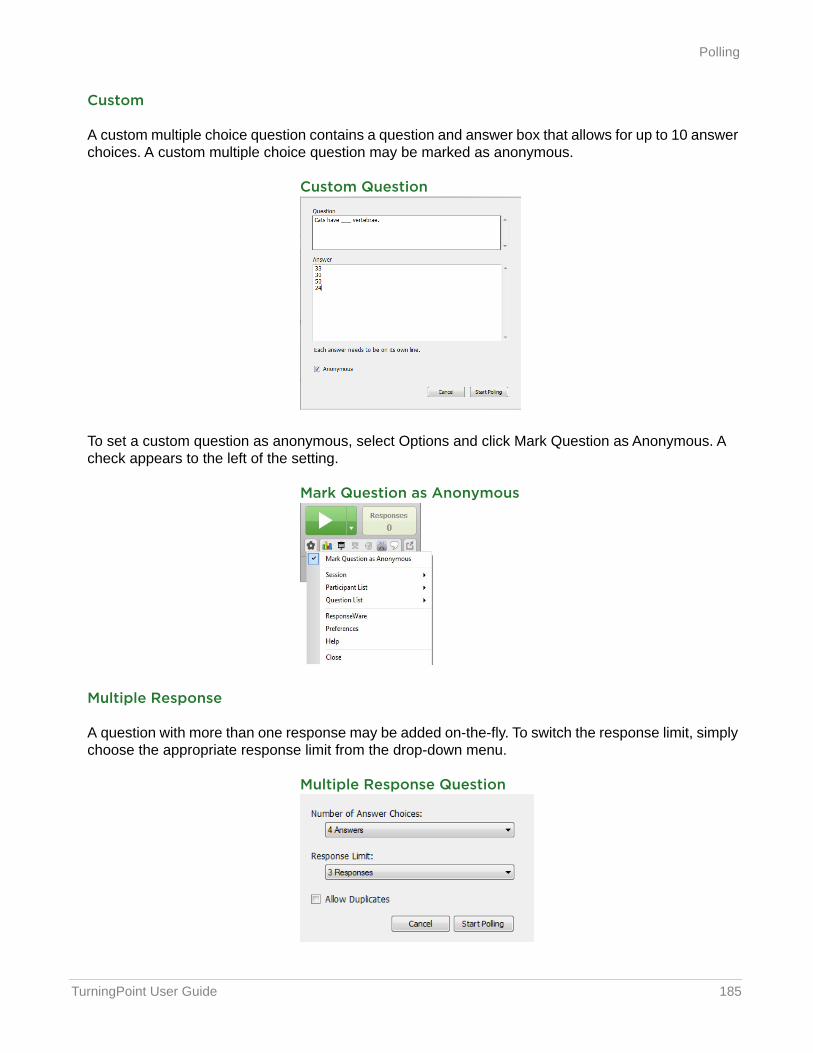
TurningPoint User Guide 185
Polling
Custom
A custom multiple choice question contains a question and answer box that allows for up to 10 answer choices. A custom multiple choice question may be marked as anonymous.
Custom Question
To set a custom question as anonymous, select Options and click Mark Question as Anonymous. A check appears to the left of the setting.
Mark Question as Anonymous
Multiple Response
A question with more than one response may be added on-the-fly. To switch the response limit, simply choose the appropriate response limit from the drop-down menu.
Multiple Response Question
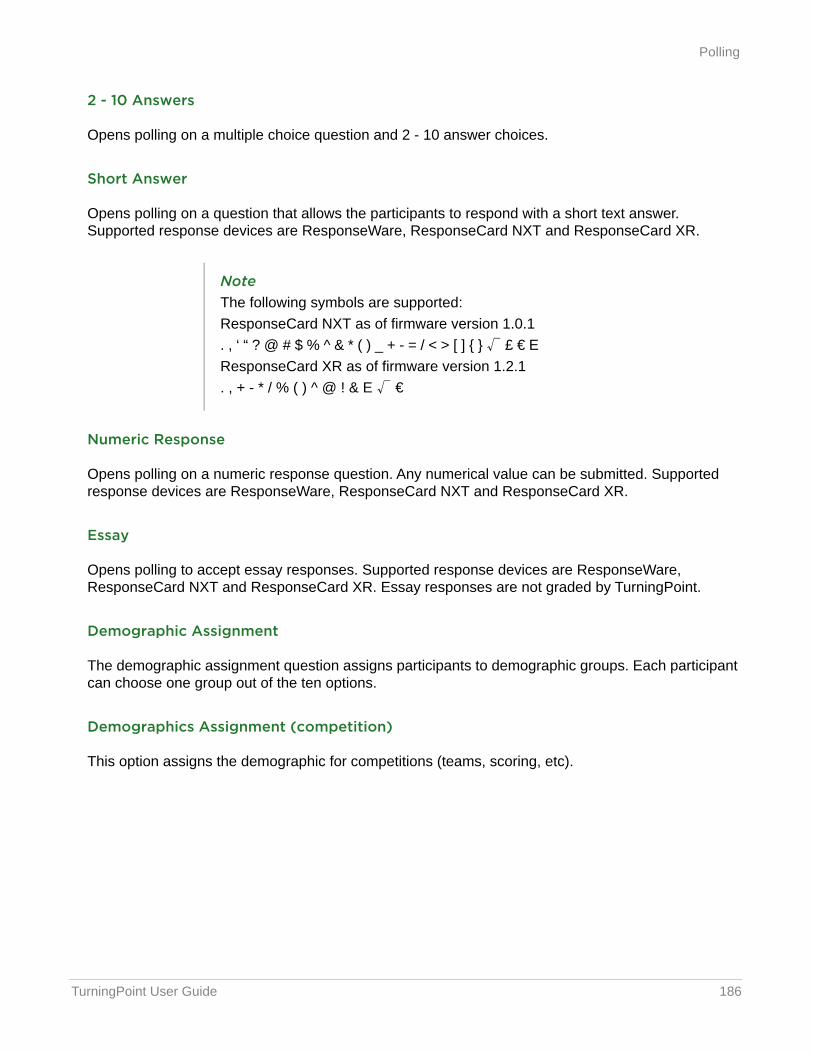
TurningPoint User Guide 186
Polling
2 - 10 Answers
Opens polling on a multiple choice question and 2 - 10 answer choices.
Short Answer
Opens polling on a question that allows the participants to respond with a short text answer. Supported response devices are ResponseWare, ResponseCard NXT and ResponseCard XR.
Numeric Response
Opens polling on a numeric response question. Any numerical value can be submitted. Supported response devices are ResponseWare, ResponseCard NXT and ResponseCard XR.
Essay
Opens polling to accept essay responses. Supported response devices are ResponseWare, ResponseCard NXT and ResponseCard XR. Essay responses are not graded by TurningPoint.
Demographic Assignment
The demographic assignment question assigns participants to demographic groups. Each participant can choose one group out of the ten options.
Demographics Assignment (competition)
This option assigns the demographic for competitions (teams, scoring, etc).
NoteThe following symbols are supported:ResponseCard NXT as of firmware version 1.0.1. , ‘ “ ? @ # $ % ^ & * ( ) _ + - = / < > [ ] { } £ € EResponseCard XR as of firmware version 1.2.1. , + - * / % ( ) ^ @ ! & E €
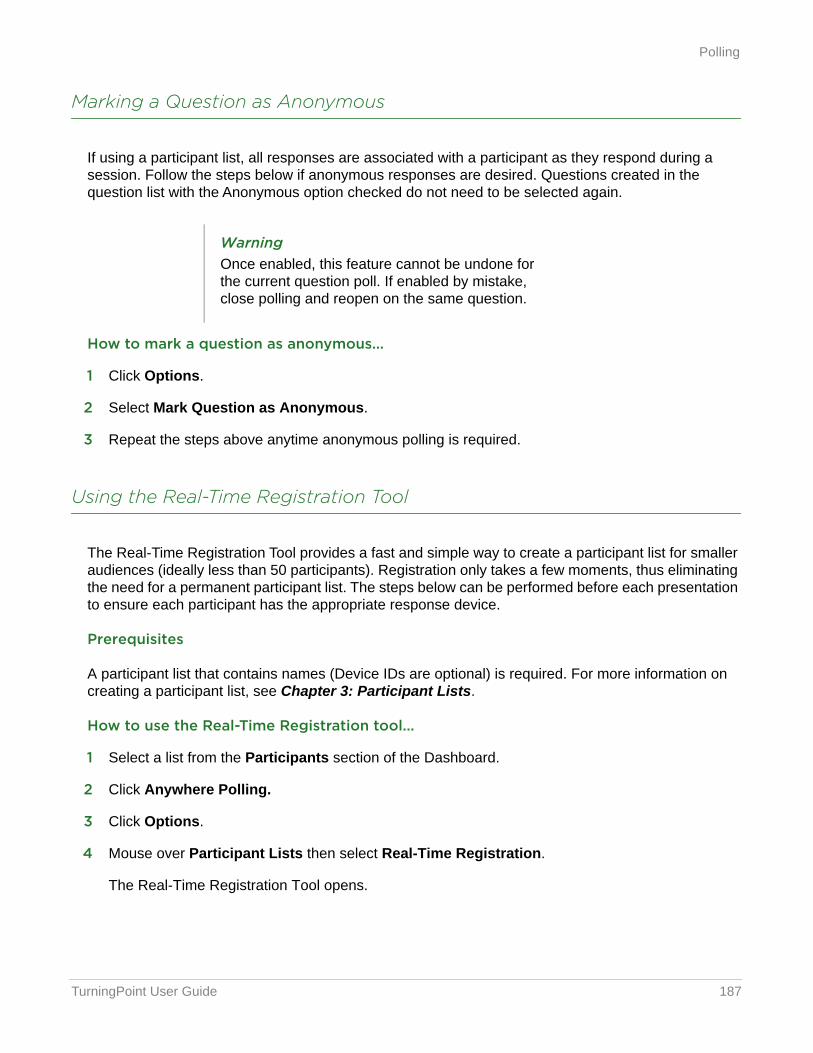
TurningPoint User Guide 187
Polling
Marking a Question as Anonymous
If using a participant list, all responses are associated with a participant as they respond during a session. Follow the steps below if anonymous responses are desired. Questions created in the question list with the Anonymous option checked do not need to be selected again.
How to mark a question as anonymous...
1 Click Options.
2 Select Mark Question as Anonymous.
3 Repeat the steps above anytime anonymous polling is required.
Using the Real-Time Registration Tool
The Real-Time Registration Tool provides a fast and simple way to create a participant list for smaller audiences (ideally less than 50 participants). Registration only takes a few moments, thus eliminating the need for a permanent participant list. The steps below can be performed before each presentation to ensure each participant has the appropriate response device.
Prerequisites
A participant list that contains names (Device IDs are optional) is required. For more information on creating a participant list, see Chapter 3: Participant Lists.
How to use the Real-Time Registration tool...
1 Select a list from the Participants section of the Dashboard.
2 Click Anywhere Polling.
3 Click Options.
4 Mouse over Participant Lists then select Real-Time Registration.
The Real-Time Registration Tool opens.
WarningOnce enabled, this feature cannot be undone for the current question poll. If enabled by mistake, close polling and reopen on the same question.
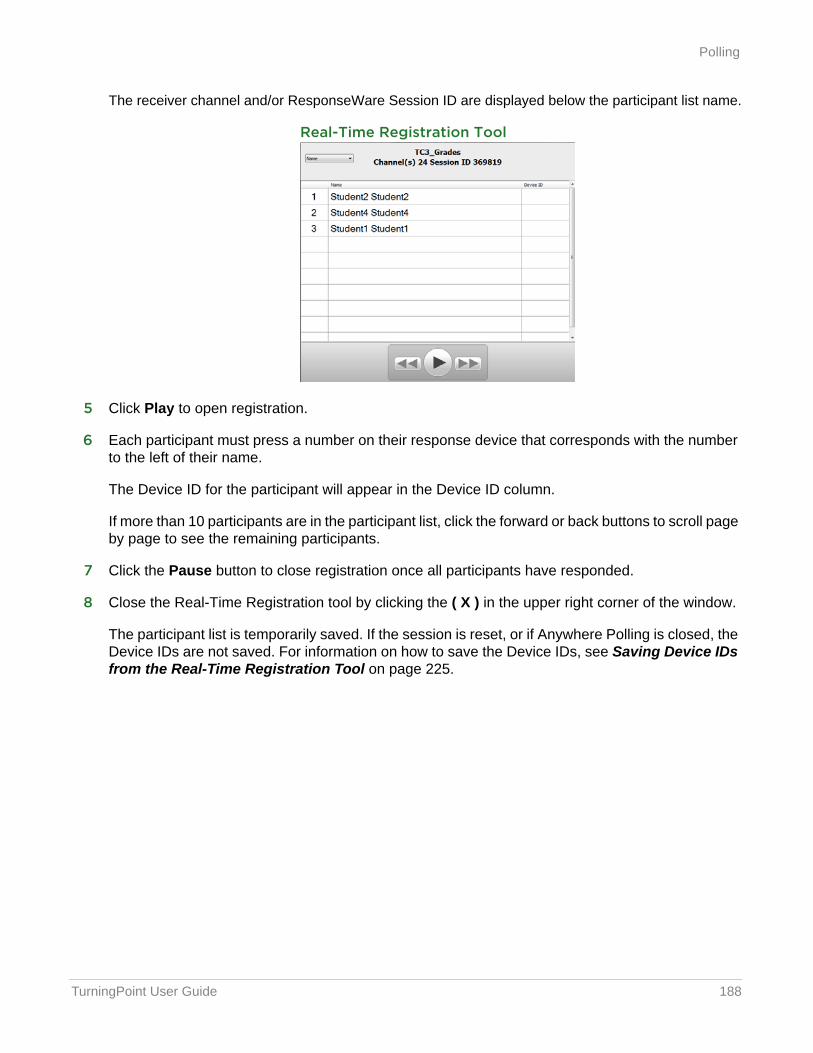
TurningPoint User Guide 188
Polling
The receiver channel and/or ResponseWare Session ID are displayed below the participant list name.
Real-Time Registration Tool
5 Click Play to open registration.
6 Each participant must press a number on their response device that corresponds with the number to the left of their name.
The Device ID for the participant will appear in the Device ID column.
If more than 10 participants are in the participant list, click the forward or back buttons to scroll page by page to see the remaining participants.
7 Click the Pause button to close registration once all participants have responded.
8 Close the Real-Time Registration tool by clicking the ( X ) in the upper right corner of the window.
The participant list is temporarily saved. If the session is reset, or if Anywhere Polling is closed, the Device IDs are not saved. For information on how to save the Device IDs, see Saving Device IDs from the Real-Time Registration Tool on page 225.
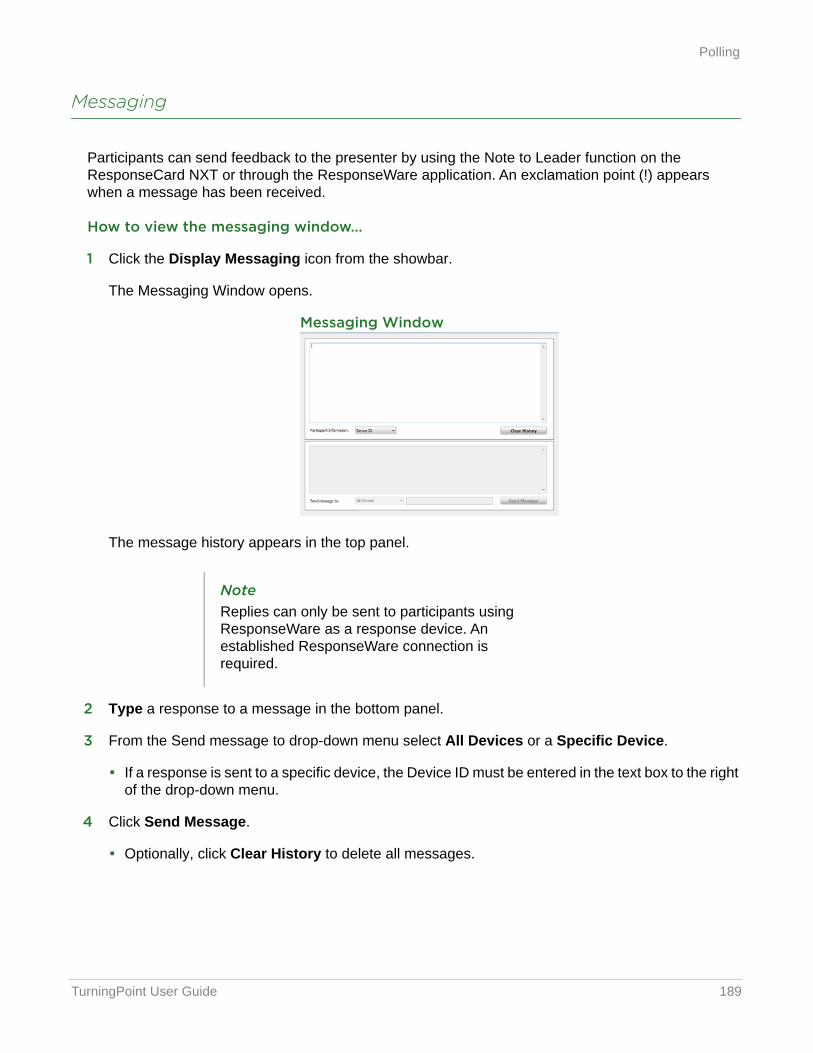
TurningPoint User Guide 189
Polling
Messaging
Participants can send feedback to the presenter by using the Note to Leader function on the ResponseCard NXT or through the ResponseWare application. An exclamation point (!) appears when a message has been received.
How to view the messaging window...
1 Click the Display Messaging icon from the showbar.
The Messaging Window opens.
Messaging Window
The message history appears in the top panel.
2 Type a response to a message in the bottom panel.
3 From the Send message to drop-down menu select All Devices or a Specific Device.
• If a response is sent to a specific device, the Device ID must be entered in the text box to the right of the drop-down menu.
4 Click Send Message.
• Optionally, click Clear History to delete all messages.
NoteReplies can only be sent to participants using ResponseWare as a response device. An established ResponseWare connection is required.
TurningPoint User Guide 190
Sessions
SessionsAnywhere Polling sessions contain all of the response data and screen shots collected during a presentation.
This section covers the following topics:
• Saving an Anywhere Polling Session
• Resetting an Anywhere Polling Session
• Continuing a Prior Anywhere Polling Session
Saving an Anywhere Polling Session
Saving the session data enables a user to generate reports and manage results from the TurningPoint Manage tab.
Prerequisites
An audience must be polled with Anywhere Polling.
How to save an Anywhere Polling session...
1 Click Options.
2 Mouse over Session and select Save Session.
Session files should be stored in the default save location. If the session is saved in another location it will then need to be placed in the TurningPoint Sessions folder or imported into TurningPoint.
3 Name the session file and click Save.
4 Close Anywhere Polling to return to the TurningPoint Dashboard.
TurningPoint User Guide 191
Sessions
Resetting an Anywhere Polling Session
The reset session option gives the user an option of deleting results from questions in order to repoll a session.
How to reset an Anywhere Polling session...
1 Click Options.
2 Mouse over Session and select Reset Session.
If session data is detected, the user will be prompted to save the session.
3 Optionally, save the session file.
Continuing a Prior Anywhere Polling Session
Anywhere Polling can resume a session from a saved session file. New session information is appended to the open session file. When saved, the polling results are saved in one session file.
How to continue a prior Anywhere Polling session...
1 Click Options.
2 Mouse over Session and select Continue Prior Session...
3 Select the session file to be continued and click Open.
The previously saved session file is now open.
Next Steps
Now that the session has been continued, it can be polled. For more information, see Running a Session on page 178.
WarningOnce the reset function has been performed, it cannot be undone.

TurningPoint User Guide 192
7Self-Paced Polling
The Self-Paced Polling environment allows participants to take a paper-based test on an XR or NXT ResponseCard.
This chapter covers:
• Setting Up Self-Paced Polling
• Viewing the Compact Mode
• Manually Setting a Timer
• Polling
• Sessions
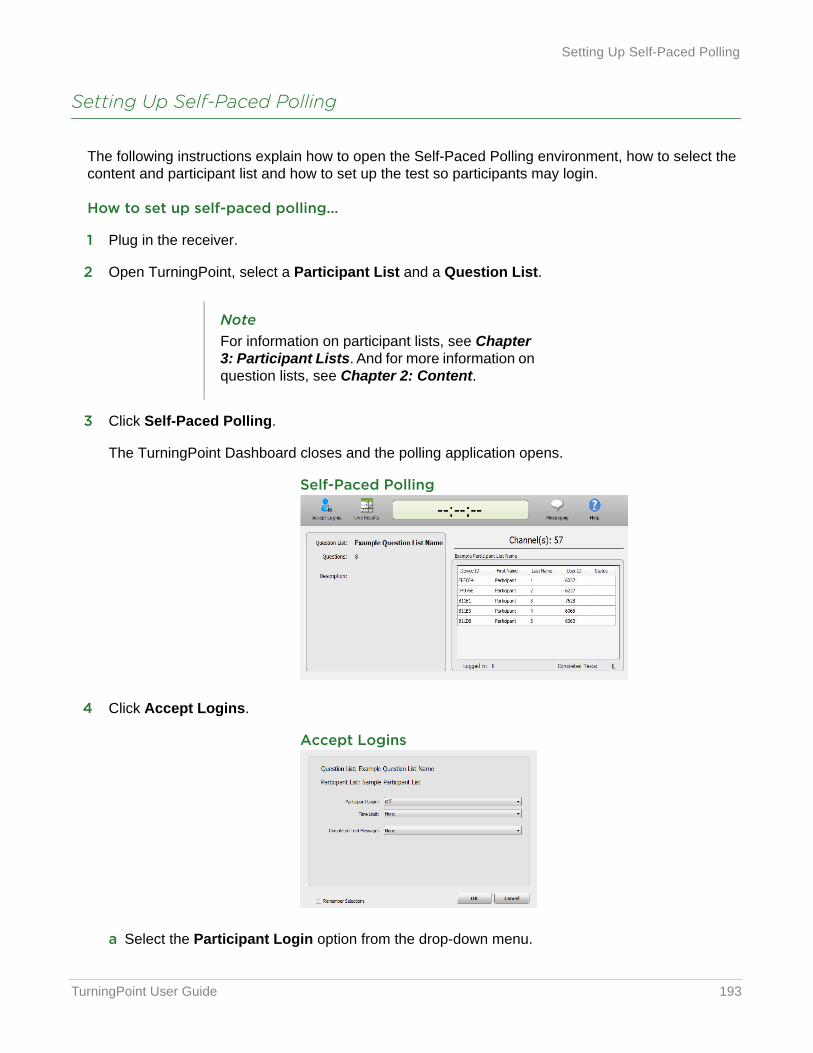
TurningPoint User Guide 193
Setting Up Self-Paced Polling
Setting Up Self-Paced Polling
The following instructions explain how to open the Self-Paced Polling environment, how to select the content and participant list and how to set up the test so participants may login.
How to set up self-paced polling...
1 Plug in the receiver.
2 Open TurningPoint, select a Participant List and a Question List.
3 Click Self-Paced Polling.
The TurningPoint Dashboard closes and the polling application opens.
Self-Paced Polling
4 Click Accept Logins.
Accept Logins
a Select the Participant Login option from the drop-down menu.
NoteFor information on participant lists, see Chapter 3: Participant Lists. And for more information on question lists, see Chapter 2: Content.
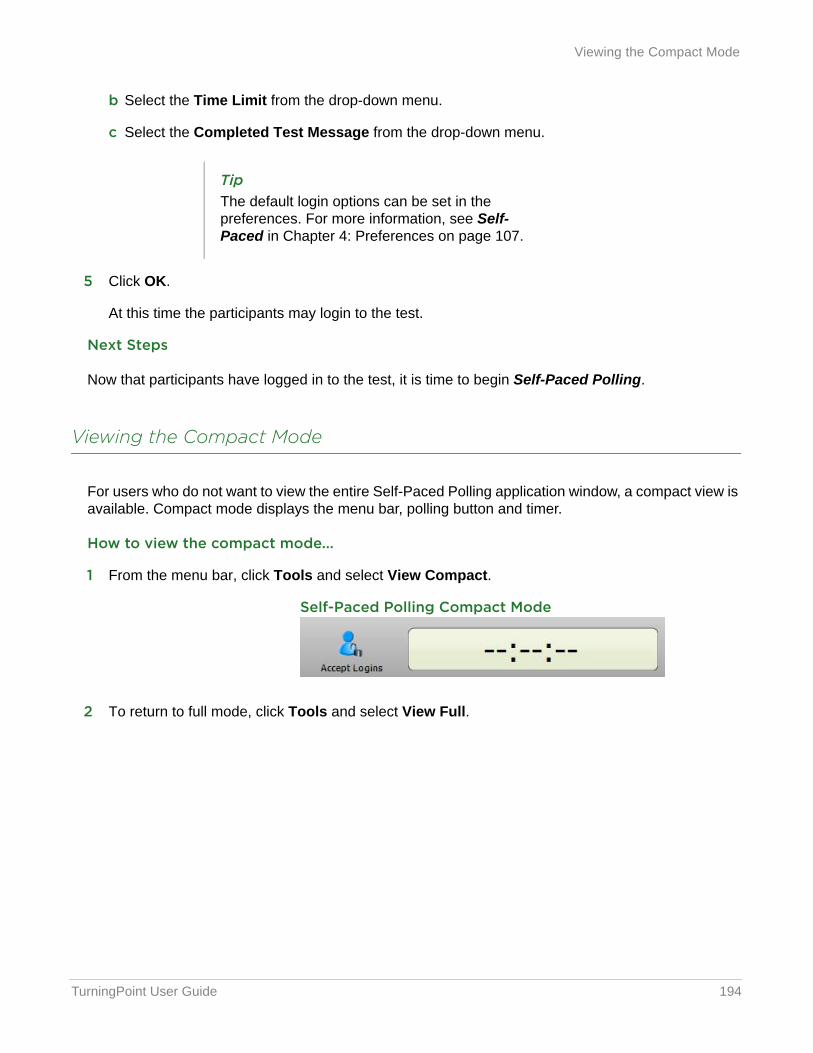
TurningPoint User Guide 194
Viewing the Compact Mode
b Select the Time Limit from the drop-down menu.
c Select the Completed Test Message from the drop-down menu.
5 Click OK.
At this time the participants may login to the test.
Next Steps
Now that participants have logged in to the test, it is time to begin Self-Paced Polling.
Viewing the Compact Mode
For users who do not want to view the entire Self-Paced Polling application window, a compact view is available. Compact mode displays the menu bar, polling button and timer.
How to view the compact mode...
1 From the menu bar, click Tools and select View Compact.
Self-Paced Polling Compact Mode
2 To return to full mode, click Tools and select View Full.
TipThe default login options can be set in the preferences. For more information, see Self-Paced in Chapter 4: Preferences on page 107.
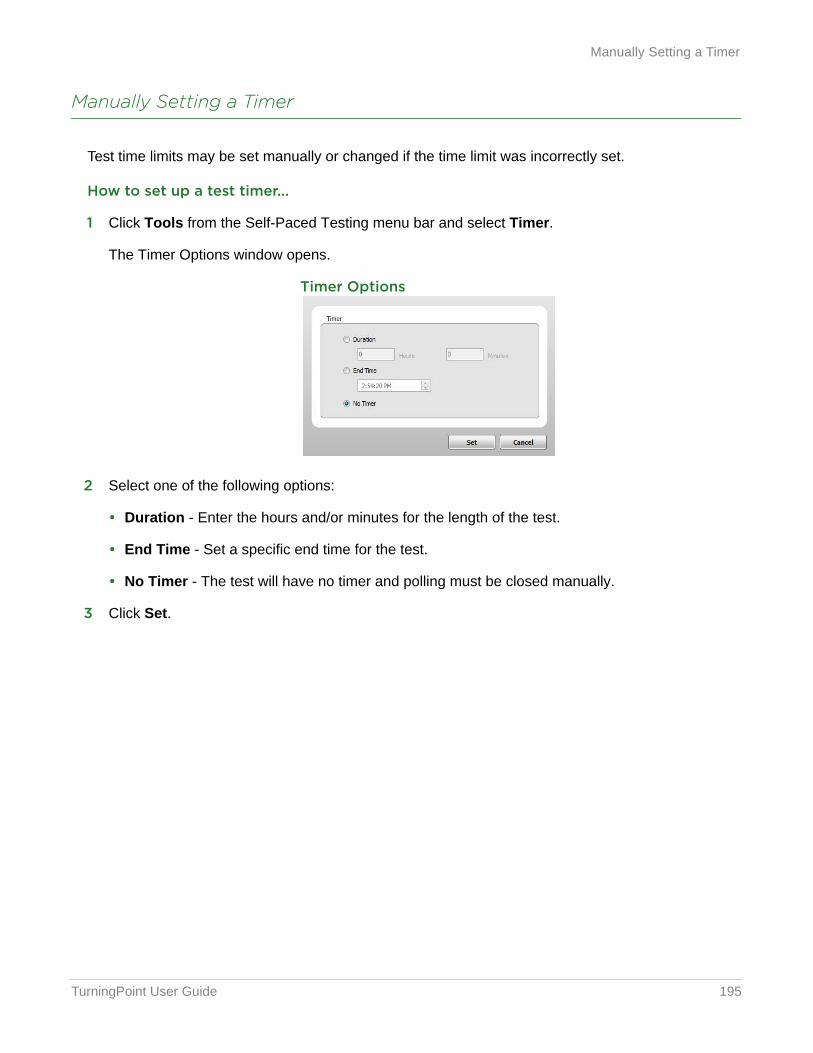
TurningPoint User Guide 195
Manually Setting a Timer
Manually Setting a Timer
Test time limits may be set manually or changed if the time limit was incorrectly set.
How to set up a test timer...
1 Click Tools from the Self-Paced Testing menu bar and select Timer.
The Timer Options window opens.
Timer Options
2 Select one of the following options:
• Duration - Enter the hours and/or minutes for the length of the test.
• End Time - Set a specific end time for the test.
• No Timer - The test will have no timer and polling must be closed manually.
3 Click Set.
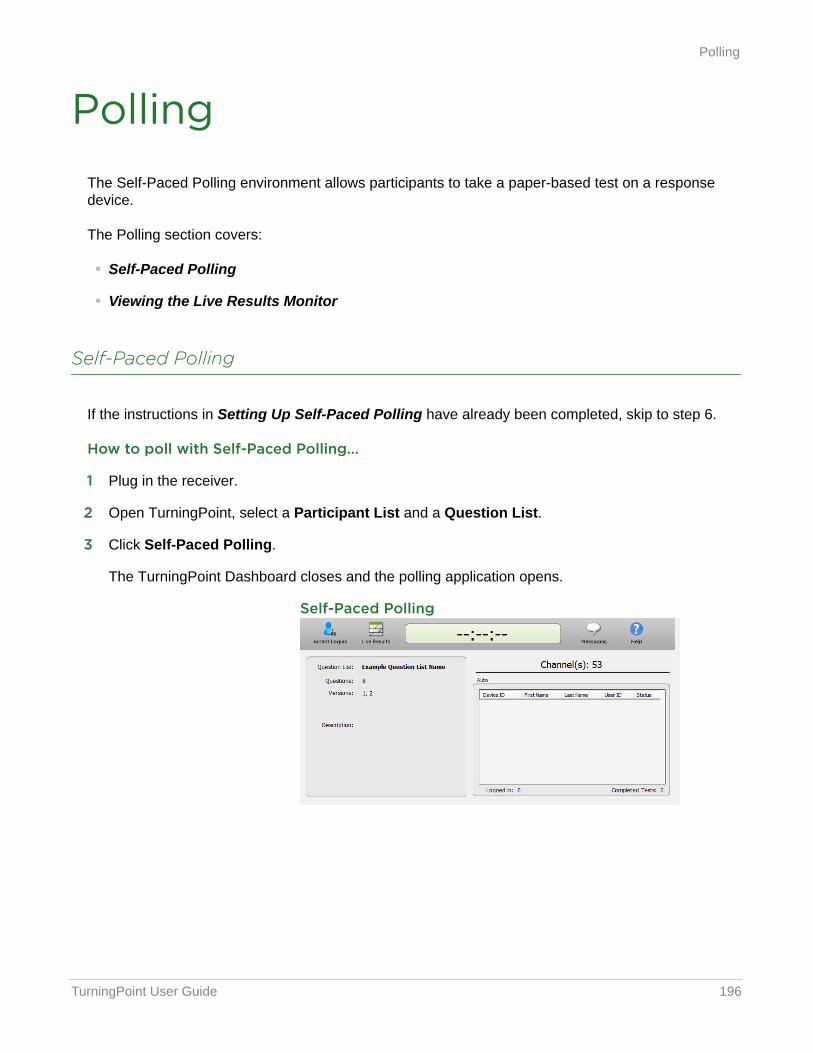
TurningPoint User Guide 196
Polling
PollingThe Self-Paced Polling environment allows participants to take a paper-based test on a response device.
The Polling section covers:
• Self-Paced Polling
• Viewing the Live Results Monitor
Self-Paced Polling
If the instructions in Setting Up Self-Paced Polling have already been completed, skip to step 6.
How to poll with Self-Paced Polling...
1 Plug in the receiver.
2 Open TurningPoint, select a Participant List and a Question List.
3 Click Self-Paced Polling.
The TurningPoint Dashboard closes and the polling application opens.
Self-Paced Polling
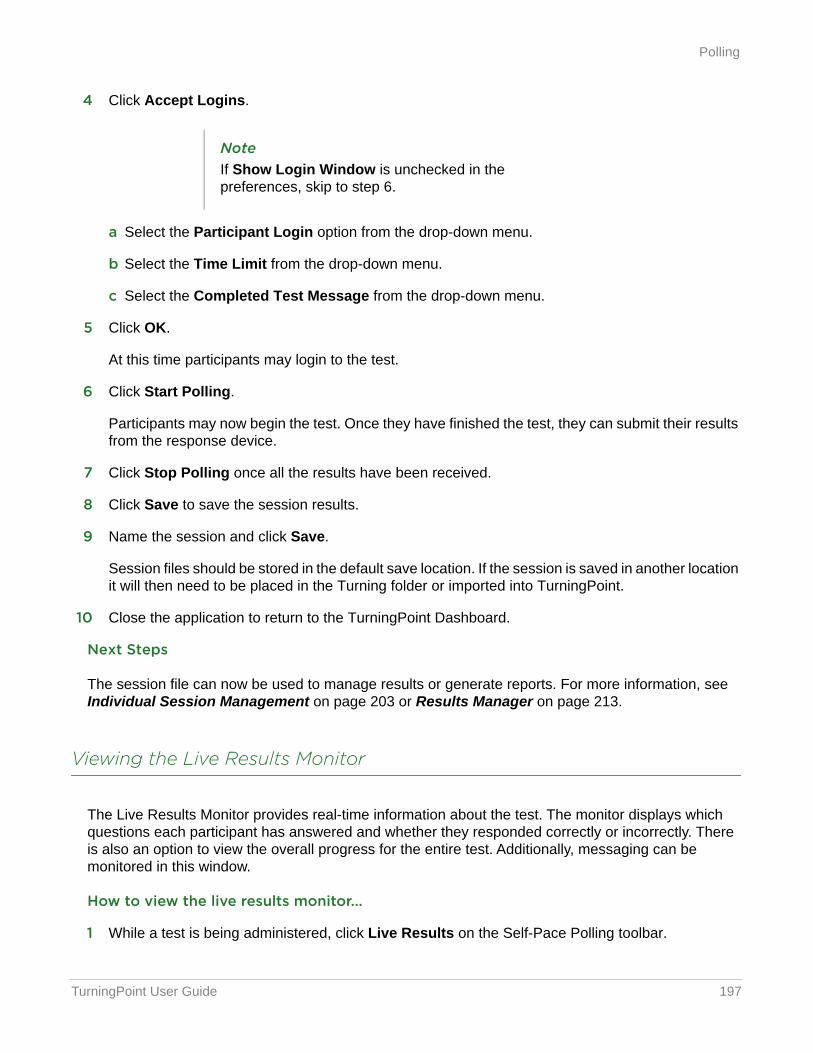
TurningPoint User Guide 197
Polling
4 Click Accept Logins.
a Select the Participant Login option from the drop-down menu.
b Select the Time Limit from the drop-down menu.
c Select the Completed Test Message from the drop-down menu.
5 Click OK.
At this time participants may login to the test.
6 Click Start Polling.
Participants may now begin the test. Once they have finished the test, they can submit their results from the response device.
7 Click Stop Polling once all the results have been received.
8 Click Save to save the session results.
9 Name the session and click Save.
Session files should be stored in the default save location. If the session is saved in another location it will then need to be placed in the Turning folder or imported into TurningPoint.
10 Close the application to return to the TurningPoint Dashboard.
Next Steps
The session file can now be used to manage results or generate reports. For more information, see Individual Session Management on page 203 or Results Manager on page 213.
Viewing the Live Results Monitor
The Live Results Monitor provides real-time information about the test. The monitor displays which questions each participant has answered and whether they responded correctly or incorrectly. There is also an option to view the overall progress for the entire test. Additionally, messaging can be monitored in this window.
How to view the live results monitor...
1 While a test is being administered, click Live Results on the Self-Pace Polling toolbar.
NoteIf Show Login Window is unchecked in the preferences, skip to step 6.
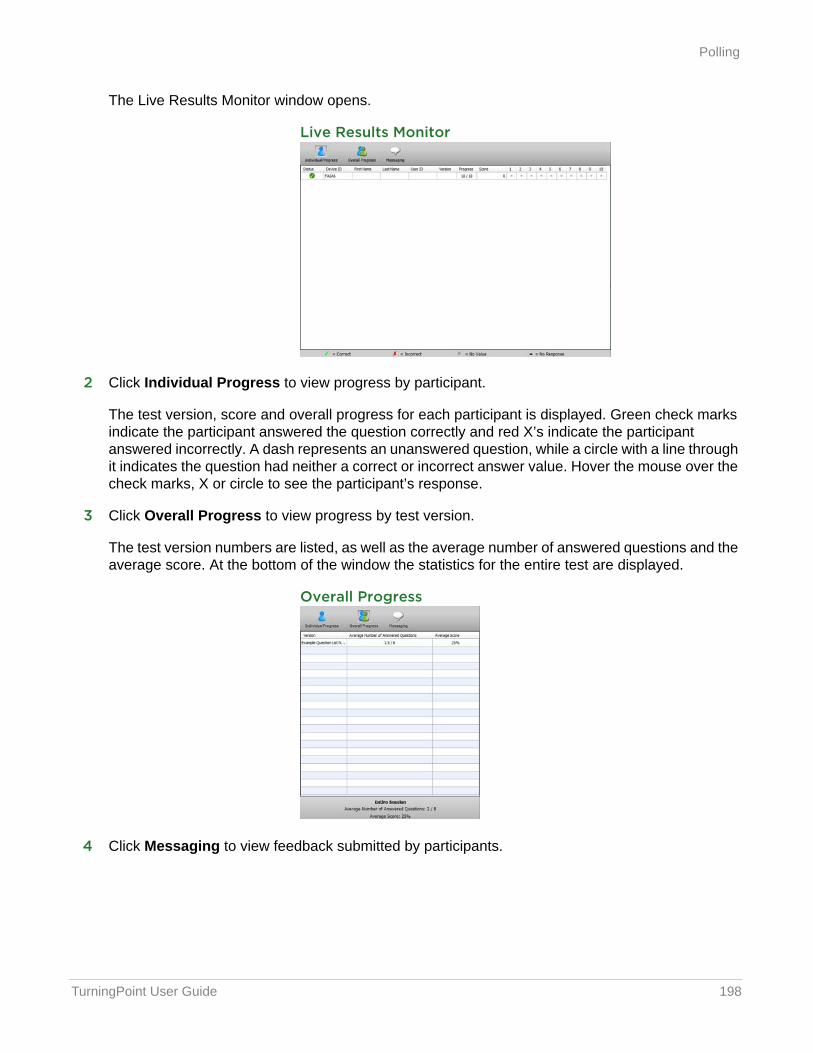
TurningPoint User Guide 198
Polling
The Live Results Monitor window opens.
Live Results Monitor
2 Click Individual Progress to view progress by participant.
The test version, score and overall progress for each participant is displayed. Green check marks indicate the participant answered the question correctly and red X’s indicate the participant answered incorrectly. A dash represents an unanswered question, while a circle with a line through it indicates the question had neither a correct or incorrect answer value. Hover the mouse over the check marks, X or circle to see the participant’s response.
3 Click Overall Progress to view progress by test version.
The test version numbers are listed, as well as the average number of answered questions and the average score. At the bottom of the window the statistics for the entire test are displayed.
Overall Progress
4 Click Messaging to view feedback submitted by participants.
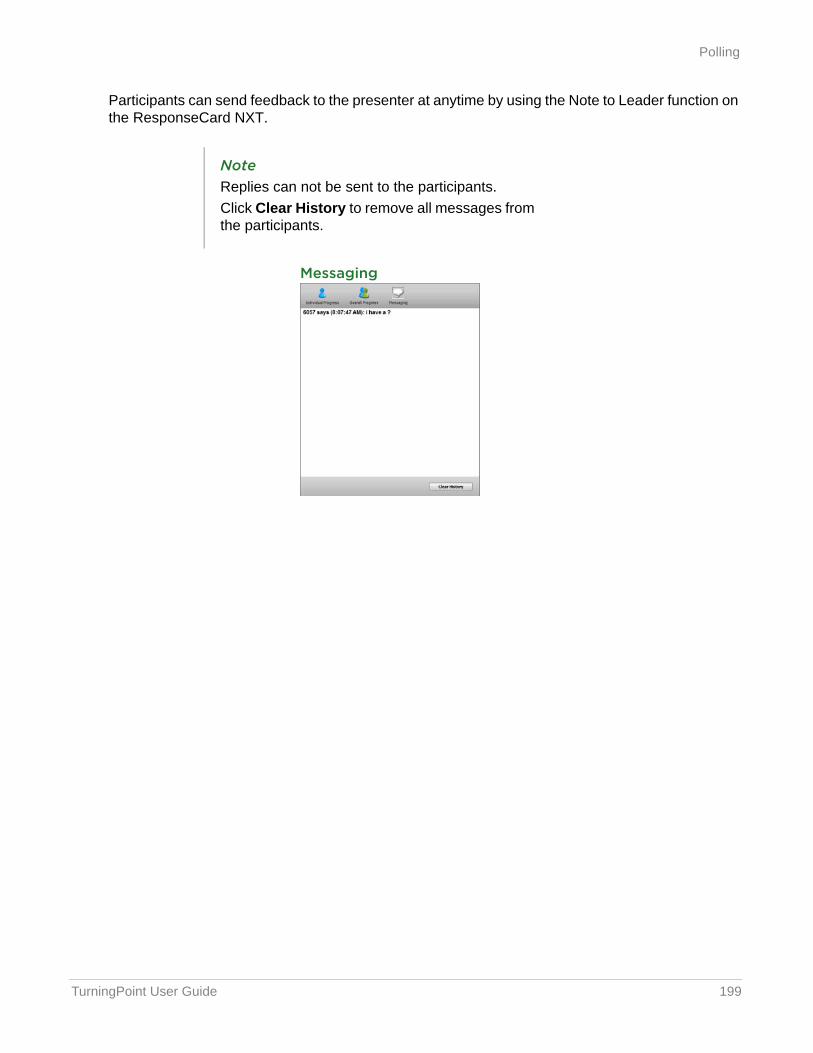
TurningPoint User Guide 199
Polling
Participants can send feedback to the presenter at anytime by using the Note to Leader function on the ResponseCard NXT.
Messaging
NoteReplies can not be sent to the participants. Click Clear History to remove all messages from the participants.
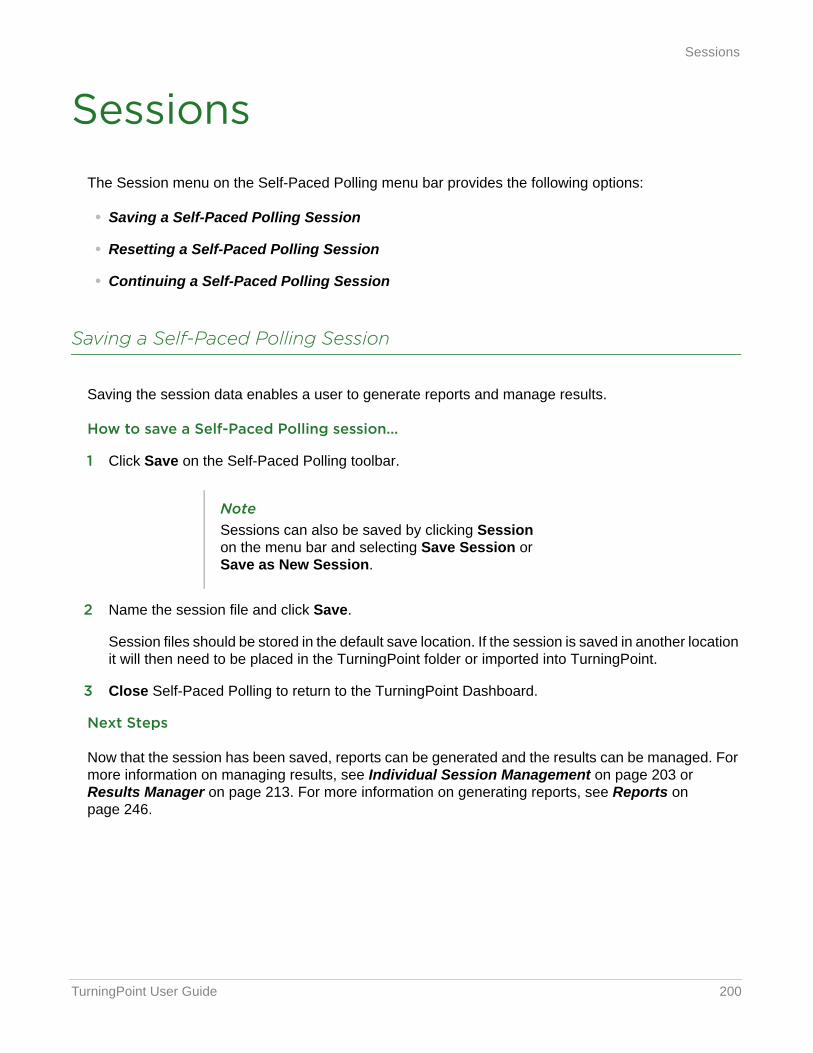
TurningPoint User Guide 200
Sessions
SessionsThe Session menu on the Self-Paced Polling menu bar provides the following options:
• Saving a Self-Paced Polling Session
• Resetting a Self-Paced Polling Session
• Continuing a Self-Paced Polling Session
Saving a Self-Paced Polling Session
Saving the session data enables a user to generate reports and manage results.
How to save a Self-Paced Polling session...
1 Click Save on the Self-Paced Polling toolbar.
2 Name the session file and click Save.
Session files should be stored in the default save location. If the session is saved in another location it will then need to be placed in the TurningPoint folder or imported into TurningPoint.
3 Close Self-Paced Polling to return to the TurningPoint Dashboard.
Next Steps
Now that the session has been saved, reports can be generated and the results can be managed. For more information on managing results, see Individual Session Management on page 203 or Results Manager on page 213. For more information on generating reports, see Reports on page 246.
NoteSessions can also be saved by clicking Session on the menu bar and selecting Save Session or Save as New Session.
TurningPoint User Guide 201
Sessions
Resetting a Self-Paced Polling Session
Resetting a Self-Paced Polling session permanently deletes the responses from the current session.
How to reset a Self-Paced Polling session...
1 From the menu bar, click Session and select Reset Session.
Next Steps
Now that the session has been reset the test is ready for polling.
Continuing a Self-Paced Polling Session
Continuing a session enables a user to collect additional participant responses after the initial test. This feature can be useful when a participant needs to make up a missed test.
How to continue a Self-Paced Polling session...
1 From the menu bar, click Session and select Continue Prior Session.
2 Select a session file and click Open.
The participant list and question list associated with the session file will be loaded.
3 The Login window appears.
• Select the Participant Login, Time Limit and Completed Test Messages from the drop-down menus.
4 Click Start Polling.
Participants may now begin the test. Once finished, participants can submit their results from the response device.
5 Click Stop Polling once all results have been received.
6 Click Save to save the session results.
7 Name the session and click Save.
8 Close the application to return to the TurningPoint Dashboard.
TurningPoint User Guide 202
8 Sessions
This chapter covers the following sections:
• Individual Session Management
• Results Manager
TurningPoint User Guide 203
Individual Session Management
Individual Session ManagementThis section covers the following topics:
• Importing Sessions
• Exporting Sessions
• Extracting Session Information
• Creating a Participant List from an Auto Session
• Merging Sessions
• Deleting Sessions
• Changing a Session Name
• Editing a Session
Importing Sessions
Each time the software is opened, it automatically detects sessions that have been saved in the TurningPoint Sessions folder. If new files are found, a prompt displays with the option to import the files. If the files are not imported through the prompt, they must be manually imported.
How to manually import a session...
1 From the Manage tab, click Session and select Import.
2 Browse to the location of the session(s).
3 Select the session(s) and click Open.
4 Click OK.
The import summary displays the status of each session or sessions that were selected for import.
5 Click OK.
Next Steps
The session(s) are now displayed in the panel on the left. Select the session to view the file location, dates and an overview of the session contents.
TipThe icon to the left of the session information displays the polling environment that generated the session file.
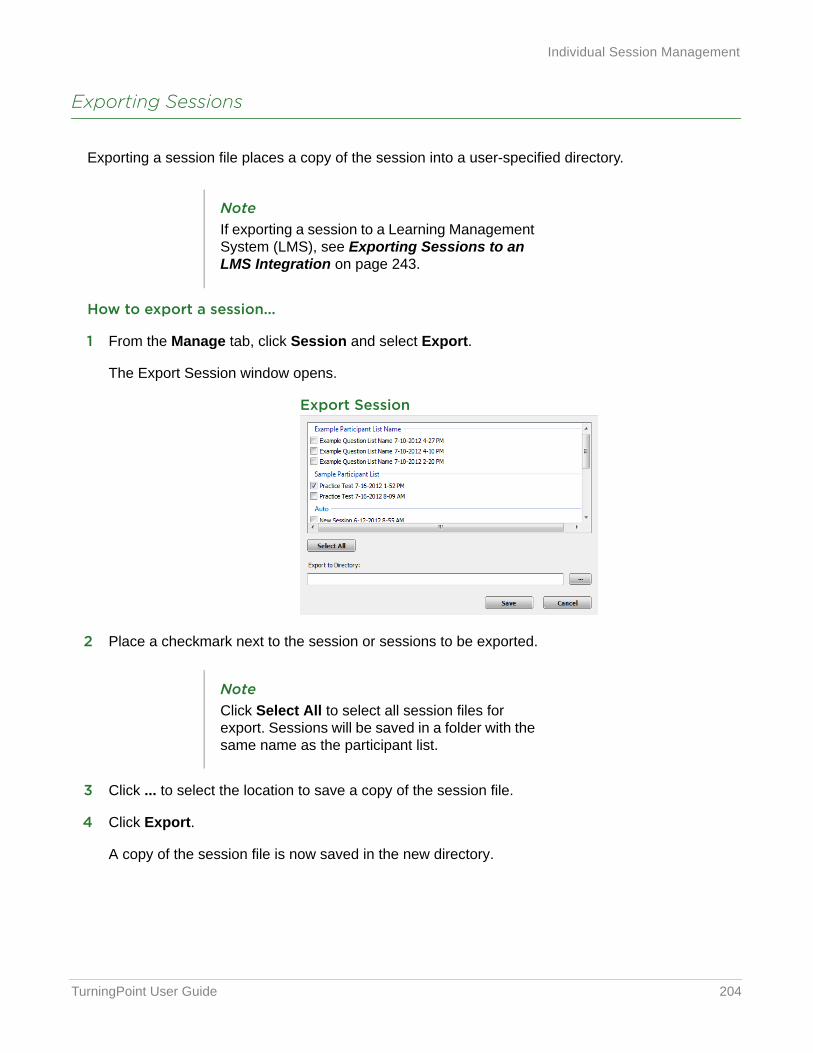
TurningPoint User Guide 204
Individual Session Management
Exporting Sessions
Exporting a session file places a copy of the session into a user-specified directory.
How to export a session...
1 From the Manage tab, click Session and select Export.
The Export Session window opens.
Export Session
2 Place a checkmark next to the session or sessions to be exported.
3 Click ... to select the location to save a copy of the session file.
4 Click Export.
A copy of the session file is now saved in the new directory.
NoteIf exporting a session to a Learning Management System (LMS), see Exporting Sessions to an LMS Integration on page 243.
NoteClick Select All to select all session files for export. Sessions will be saved in a folder with the same name as the participant list.
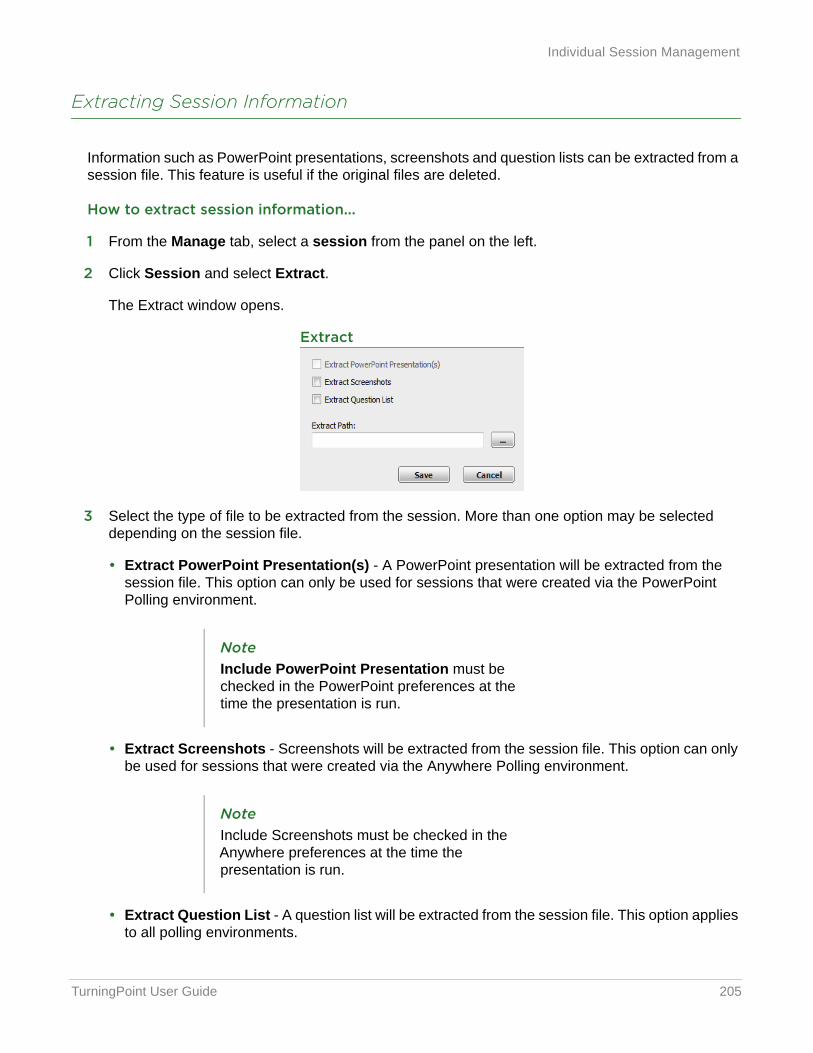
TurningPoint User Guide 205
Individual Session Management
Extracting Session Information
Information such as PowerPoint presentations, screenshots and question lists can be extracted from a session file. This feature is useful if the original files are deleted.
How to extract session information...
1 From the Manage tab, select a session from the panel on the left.
2 Click Session and select Extract.
The Extract window opens.
Extract
3 Select the type of file to be extracted from the session. More than one option may be selected depending on the session file.
• Extract PowerPoint Presentation(s) - A PowerPoint presentation will be extracted from the session file. This option can only be used for sessions that were created via the PowerPoint Polling environment.
• Extract Screenshots - Screenshots will be extracted from the session file. This option can only be used for sessions that were created via the Anywhere Polling environment.
• Extract Question List - A question list will be extracted from the session file. This option applies to all polling environments.
NoteInclude PowerPoint Presentation must be checked in the PowerPoint preferences at the time the presentation is run.
NoteInclude Screenshots must be checked in the Anywhere preferences at the time the presentation is run.
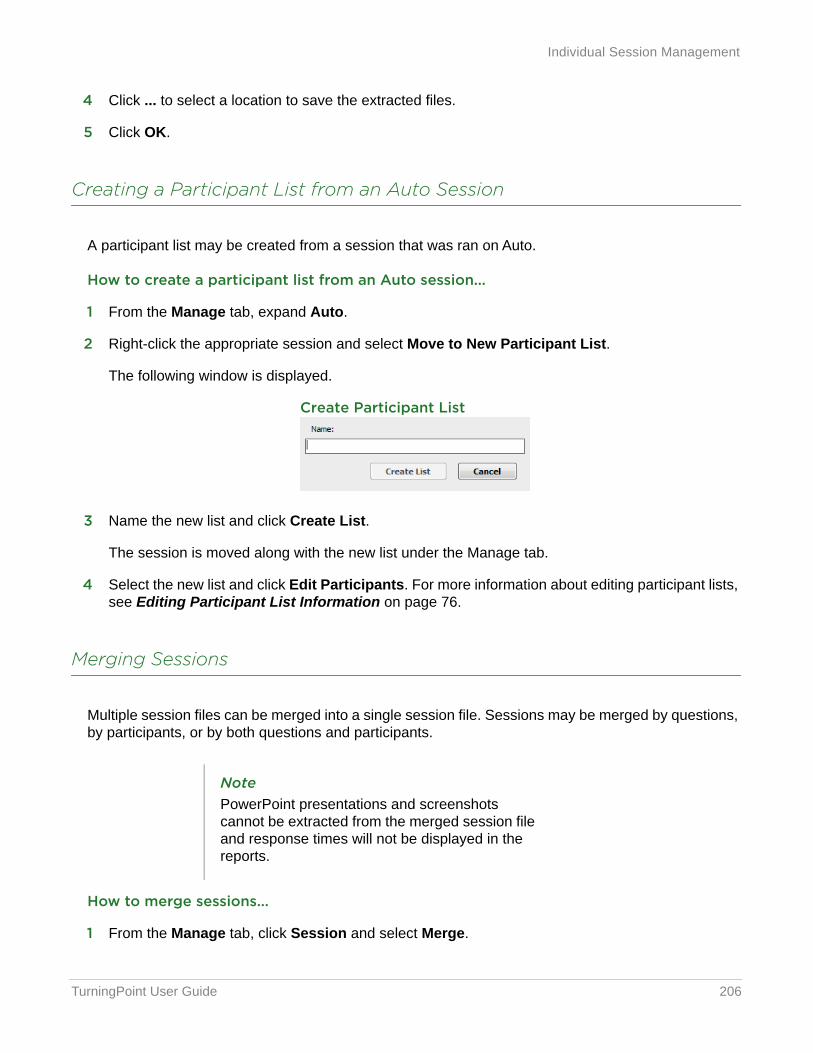
TurningPoint User Guide 206
Individual Session Management
4 Click ... to select a location to save the extracted files.
5 Click OK.
Creating a Participant List from an Auto Session
A participant list may be created from a session that was ran on Auto.
How to create a participant list from an Auto session...
1 From the Manage tab, expand Auto.
2 Right-click the appropriate session and select Move to New Participant List.
The following window is displayed.
Create Participant List
3 Name the new list and click Create List.
The session is moved along with the new list under the Manage tab.
4 Select the new list and click Edit Participants. For more information about editing participant lists, see Editing Participant List Information on page 76.
Merging Sessions
Multiple session files can be merged into a single session file. Sessions may be merged by questions, by participants, or by both questions and participants.
How to merge sessions...
1 From the Manage tab, click Session and select Merge.
NotePowerPoint presentations and screenshots cannot be extracted from the merged session file and response times will not be displayed in the reports.
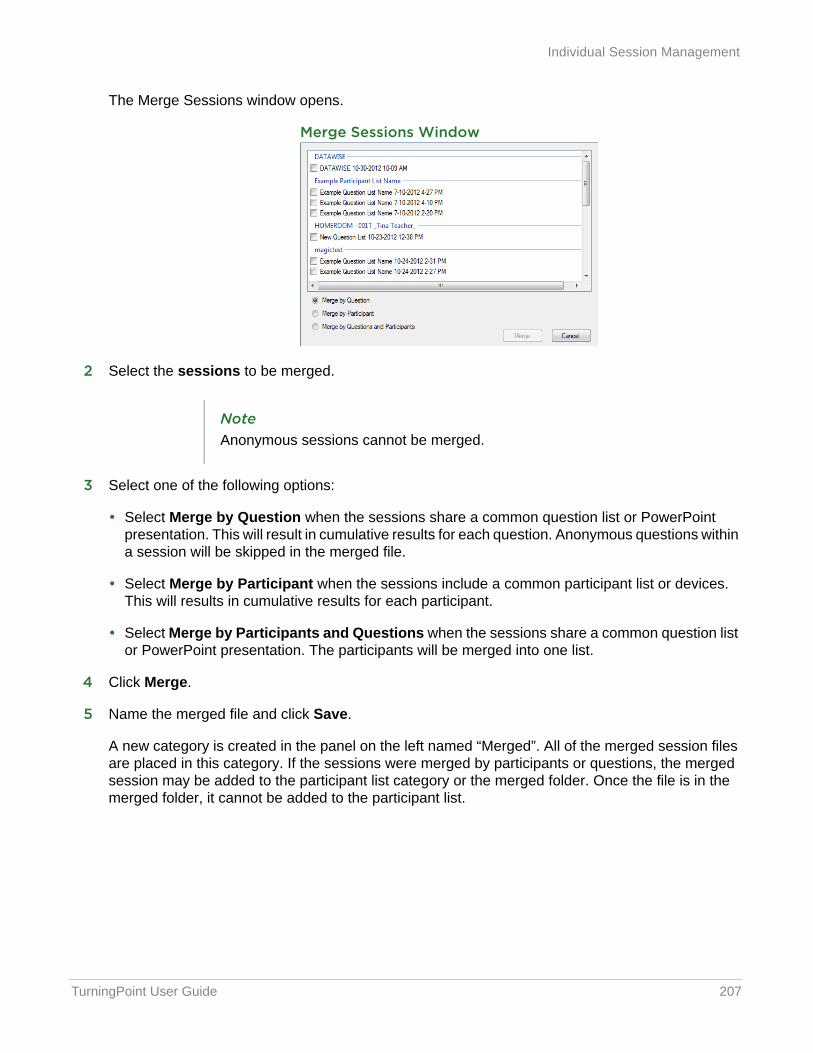
TurningPoint User Guide 207
Individual Session Management
The Merge Sessions window opens.
Merge Sessions Window
2 Select the sessions to be merged.
3 Select one of the following options:
• Select Merge by Question when the sessions share a common question list or PowerPoint presentation. This will result in cumulative results for each question. Anonymous questions within a session will be skipped in the merged file.
• Select Merge by Participant when the sessions include a common participant list or devices. This will results in cumulative results for each participant.
• Select Merge by Participants and Questions when the sessions share a common question list or PowerPoint presentation. The participants will be merged into one list.
4 Click Merge.
5 Name the merged file and click Save.
A new category is created in the panel on the left named “Merged”. All of the merged session files are placed in this category. If the sessions were merged by participants or questions, the merged session may be added to the participant list category or the merged folder. Once the file is in the merged folder, it cannot be added to the participant list.
NoteAnonymous sessions cannot be merged.
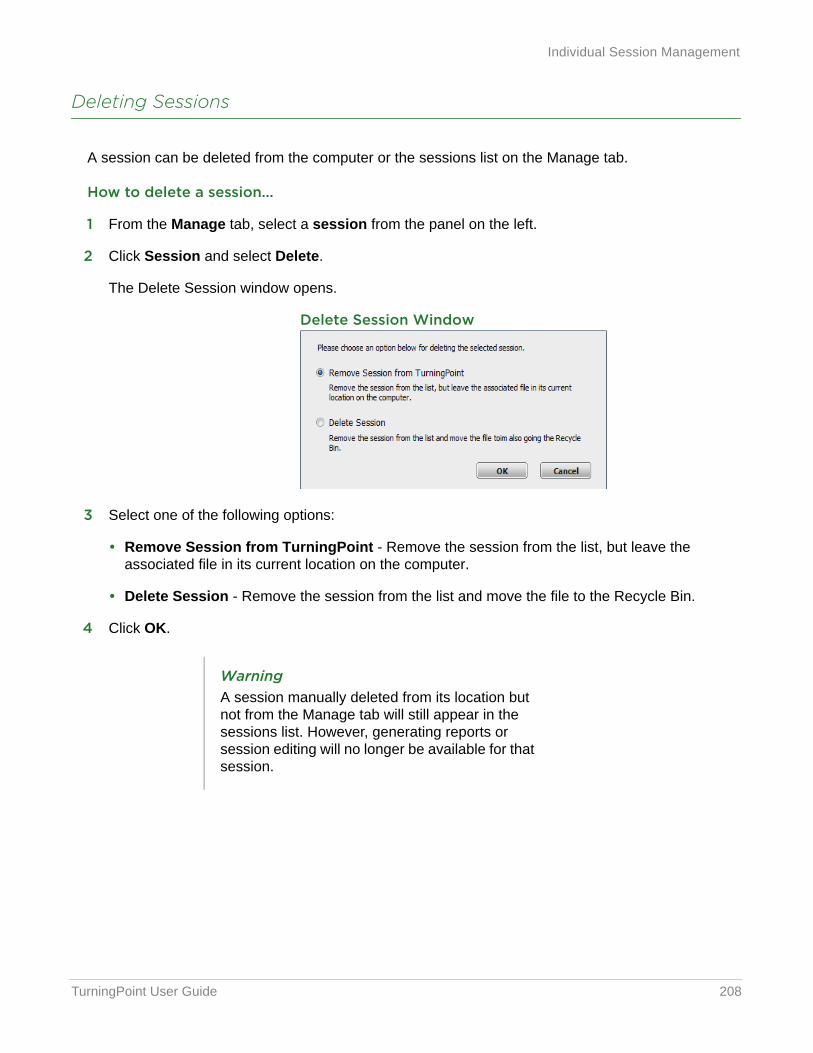
TurningPoint User Guide 208
Individual Session Management
Deleting Sessions
A session can be deleted from the computer or the sessions list on the Manage tab.
How to delete a session...
1 From the Manage tab, select a session from the panel on the left.
2 Click Session and select Delete.
The Delete Session window opens.
Delete Session Window
3 Select one of the following options:
• Remove Session from TurningPoint - Remove the session from the list, but leave the associated file in its current location on the computer.
• Delete Session - Remove the session from the list and move the file to the Recycle Bin.
4 Click OK.
WarningA session manually deleted from its location but not from the Manage tab will still appear in the sessions list. However, generating reports or session editing will no longer be available for that session.
TurningPoint User Guide 209
Individual Session Management
Changing a Session Name
The session name can be changed from the session overview window. Changing the session name only changes the name in the Manage tab; it does not change the file name.
How to change the session name...
1 From the Manage tab, select a session from the panel on the left.
The Session Overview screen is displayed.
2 Click the pencil icon on the top left of the Session Overview screen.
3 Enter a new session name in the box provided.
4 Click Save.
Editing a Session
Editing a session allows a user to exclude questions from grading, remove questions, view the question charts (or screenshots if available), adjust scoring options, edit question and answer text and apply standards.
How to edit a session...
1 From the Manage tab, select a session from the panel on the left.
NoteEditing a question within a session containing versions will make the appropriate adjustment to all connected questions in all versions.
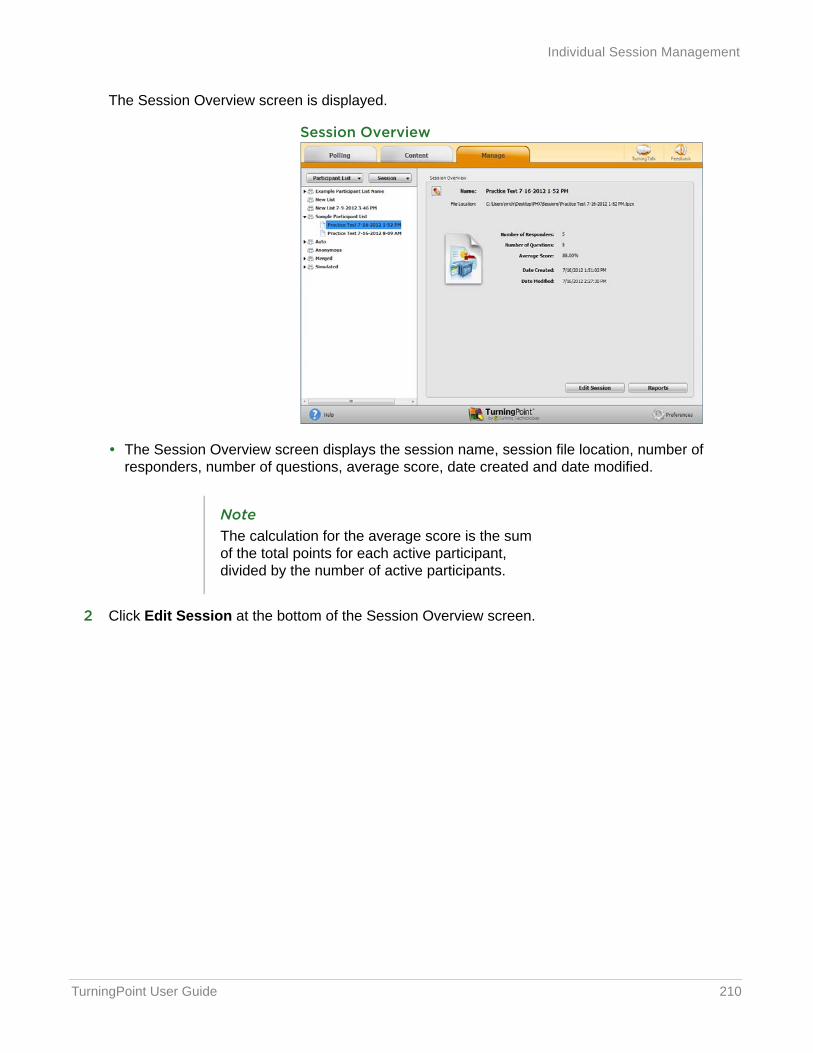
TurningPoint User Guide 210
Individual Session Management
The Session Overview screen is displayed.
Session Overview
• The Session Overview screen displays the session name, session file location, number of responders, number of questions, average score, date created and date modified.
2 Click Edit Session at the bottom of the Session Overview screen.
NoteThe calculation for the average score is the sum of the total points for each active participant, divided by the number of active participants.
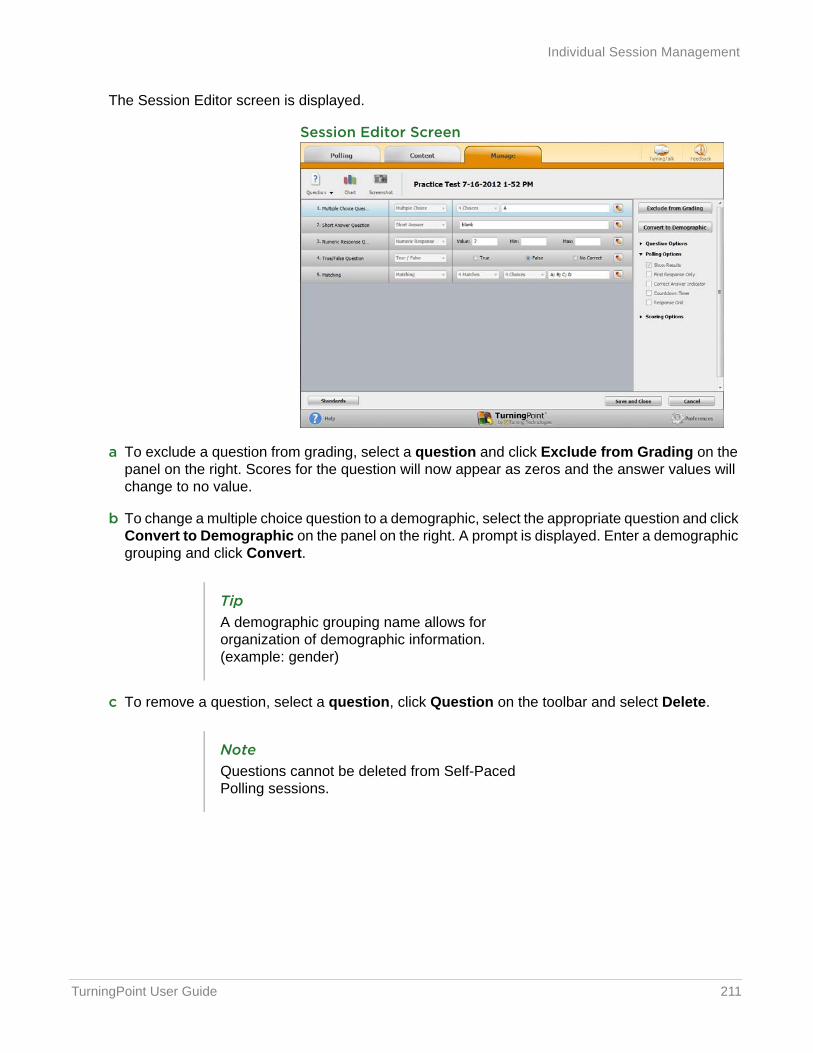
TurningPoint User Guide 211
Individual Session Management
The Session Editor screen is displayed.
Session Editor Screen
a To exclude a question from grading, select a question and click Exclude from Grading on the panel on the right. Scores for the question will now appear as zeros and the answer values will change to no value.
b To change a multiple choice question to a demographic, select the appropriate question and click Convert to Demographic on the panel on the right. A prompt is displayed. Enter a demographic grouping and click Convert.
c To remove a question, select a question, click Question on the toolbar and select Delete.
TipA demographic grouping name allows for organization of demographic information. (example: gender)
NoteQuestions cannot be deleted from Self-Paced Polling sessions.
TurningPoint User Guide 212
Individual Session Management
d To view the question chart or screenshot, select a question and click Chart or Screenshot from the toolbar.
e To adjust answer values, select a question and expand the Scoring Options to the panel on the right. Adjust the correct or incorrect point values and answer values as necessary.
f To edit the question or answer text, select a question and click the pencil icon to the right. Type the new text in the box provided. Click Close to return the question list.
g To adjust standards for the question, click Standards. Assign the standards as necessary. For more information about how to apply standards, see Standards in Chapter 2: Content on page 60.
3 Click Save and Close to save any changes made to the session file.
Next Steps
Question lists can be extracted from an edited session. The extracted question list will contain all changes made while editing the session. For more information on extracting a question list, see Extracting Session Information on page 205.
NoteScreenshots are only available for sessions from the Anywhere Polling environment if Include Screenshots has been checked in the preferences.

TurningPoint User Guide 213
Results Manager
Results ManagerResults Manager allows for the management of all session files associated with a participant list. The content of Results Manager is setup like a grade book. From within Results Manager, session and participant data can be viewed along with information on the standing of each participant.
This section covers the following topics:
• Overview
• Sessions
• Participants
• Unassigned Devices
• Removed Participants
• Export
• Integrations
• Archiving

TurningPoint User Guide 214
Results Manager
Overview
The Results Manager screen displays all sessions associated with a participant list. The top right of the screen displays the participant list name, number of columns, number of participants, maximum points and average score.
Participant names (last name, first name) are displayed in the first column. The User ID is displayed if the participant list does not contain first and last names. The Device ID is displayed if the participant list does not contain names or User IDs.
Columns with white backgrounds represent individual sessions or manual columns. Session columns are arranged by the order in which they were added to the TurningPoint Session folder. The sessions are arranged alphabetically if several sessions are added to the Sessions folder at once. In Results Manager, columns may be manually reordered, if necessary.
Columns with the shaded background are compiled by TurningPoint and can be hidden.
The panel on the right-side of the screen changes depending on the area selected in the Results Manager Overview.
Changes made to the Results Manager screen are automatically saved by TurningPoint.
This section covers the following topics:
• Opening the Results Manager Overview
• Adding a Manual Grade Column
• Reordering the Session Columns
• Overwriting Session Scores
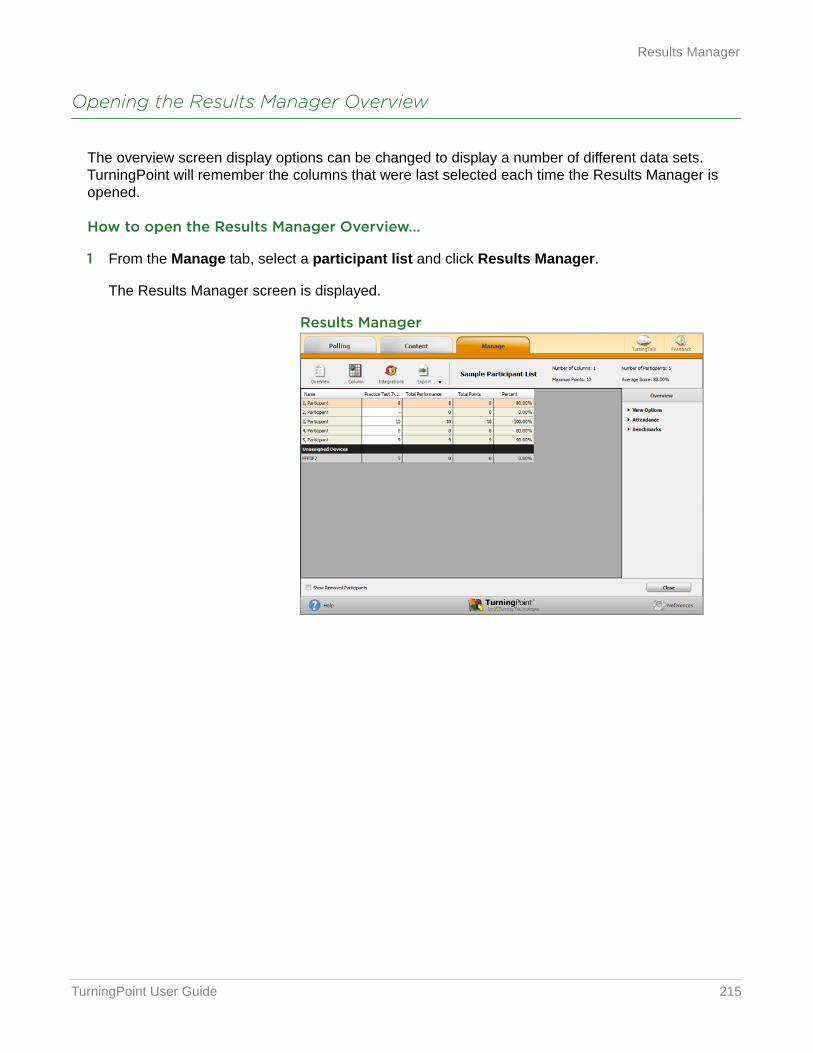
TurningPoint User Guide 215
Results Manager
Opening the Results Manager Overview
The overview screen display options can be changed to display a number of different data sets. TurningPoint will remember the columns that were last selected each time the Results Manager is opened.
How to open the Results Manager Overview...
1 From the Manage tab, select a participant list and click Results Manager.
The Results Manager screen is displayed.
Results Manager
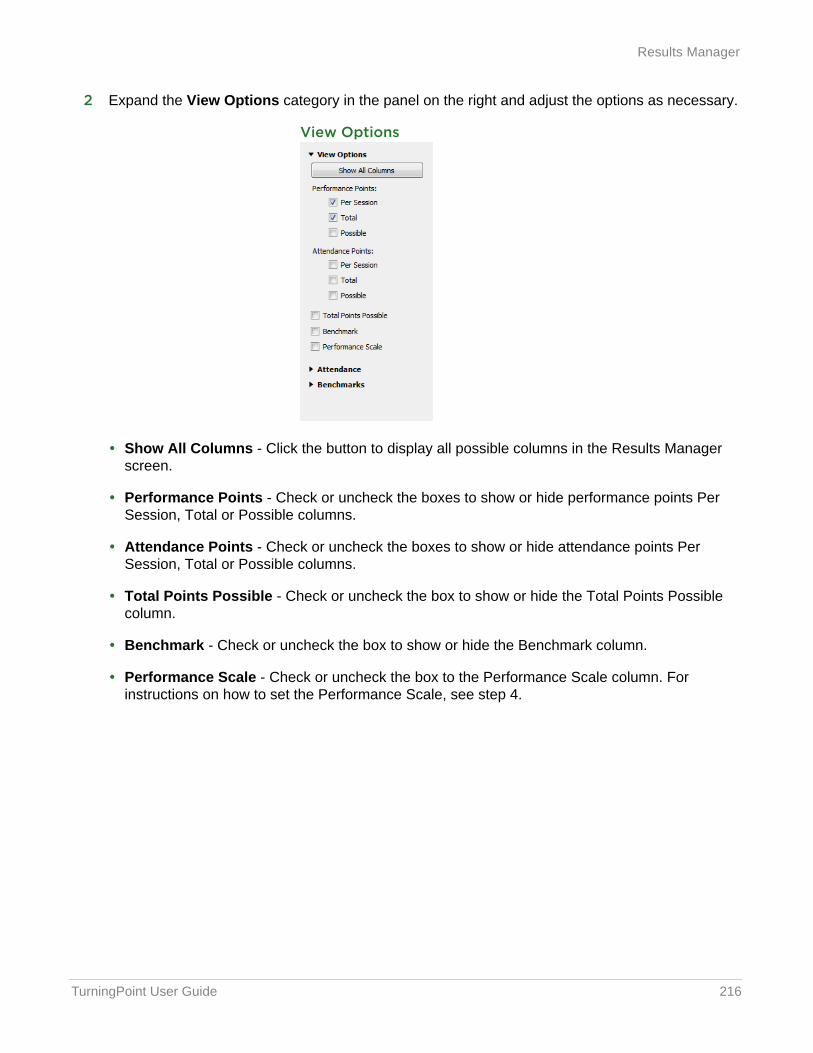
TurningPoint User Guide 216
Results Manager
2 Expand the View Options category in the panel on the right and adjust the options as necessary.
View Options
• Show All Columns - Click the button to display all possible columns in the Results Manager screen.
• Performance Points - Check or uncheck the boxes to show or hide performance points Per Session, Total or Possible columns.
• Attendance Points - Check or uncheck the boxes to show or hide attendance points Per Session, Total or Possible columns.
• Total Points Possible - Check or uncheck the box to show or hide the Total Points Possible column.
• Benchmark - Check or uncheck the box to show or hide the Benchmark column.
• Performance Scale - Check or uncheck the box to the Performance Scale column. For instructions on how to set the Performance Scale, see step 4.
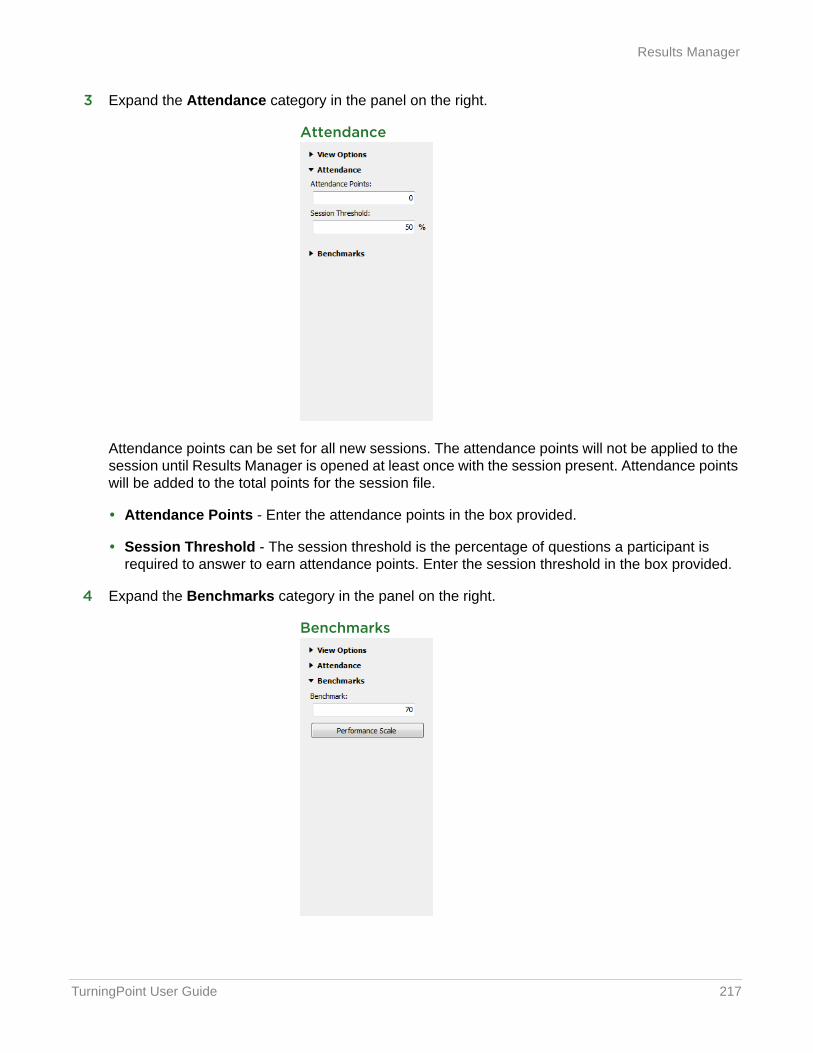
TurningPoint User Guide 217
Results Manager
3 Expand the Attendance category in the panel on the right.
Attendance
Attendance points can be set for all new sessions. The attendance points will not be applied to the session until Results Manager is opened at least once with the session present. Attendance points will be added to the total points for the session file.
• Attendance Points - Enter the attendance points in the box provided.
• Session Threshold - The session threshold is the percentage of questions a participant is required to answer to earn attendance points. Enter the session threshold in the box provided.
4 Expand the Benchmarks category in the panel on the right.
Benchmarks
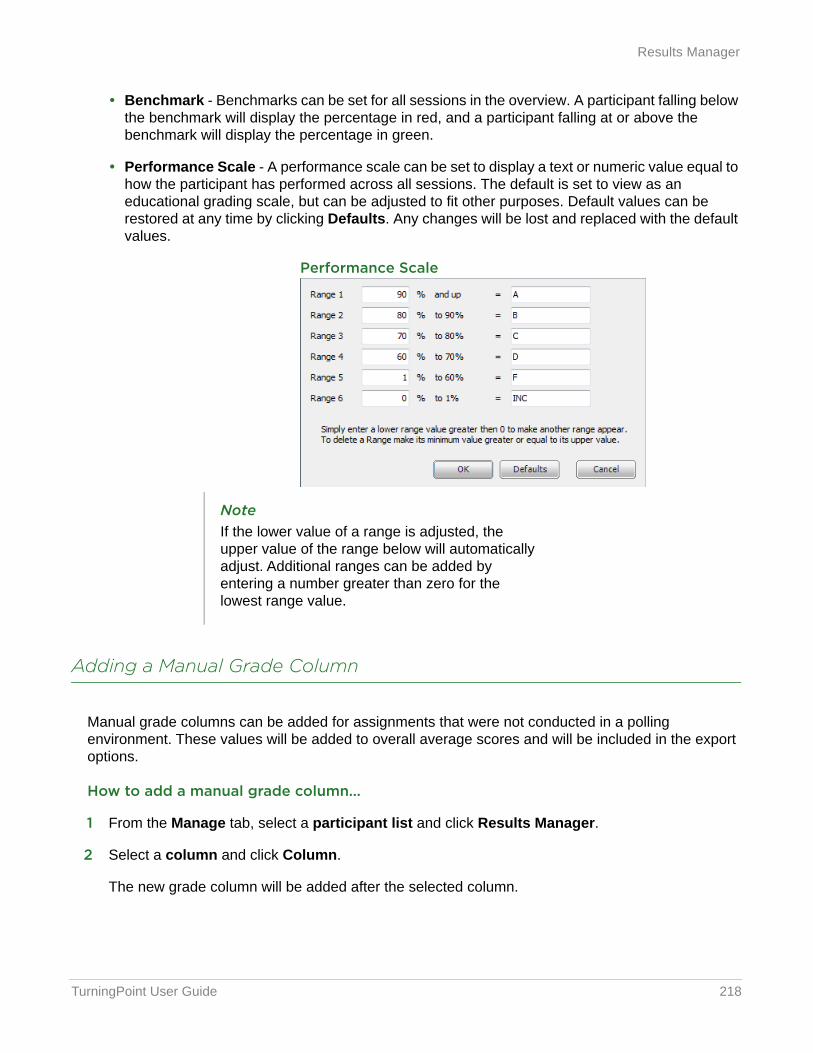
TurningPoint User Guide 218
Results Manager
• Benchmark - Benchmarks can be set for all sessions in the overview. A participant falling below the benchmark will display the percentage in red, and a participant falling at or above the benchmark will display the percentage in green.
• Performance Scale - A performance scale can be set to display a text or numeric value equal to how the participant has performed across all sessions. The default is set to view as an educational grading scale, but can be adjusted to fit other purposes. Default values can be restored at any time by clicking Defaults. Any changes will be lost and replaced with the default values.
Performance Scale
Adding a Manual Grade Column
Manual grade columns can be added for assignments that were not conducted in a polling environment. These values will be added to overall average scores and will be included in the export options.
How to add a manual grade column...
1 From the Manage tab, select a participant list and click Results Manager.
2 Select a column and click Column.
The new grade column will be added after the selected column.
NoteIf the lower value of a range is adjusted, the upper value of the range below will automatically adjust. Additional ranges can be added by entering a number greater than zero for the lowest range value.
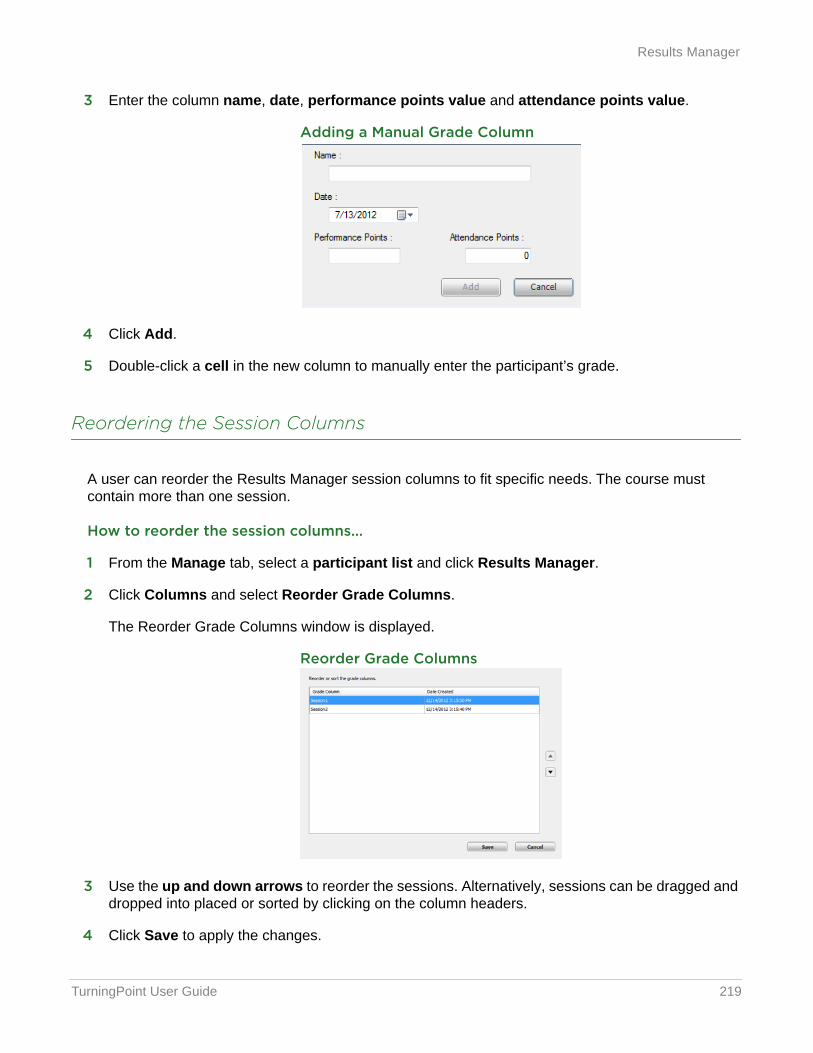
TurningPoint User Guide 219
Results Manager
3 Enter the column name, date, performance points value and attendance points value.
Adding a Manual Grade Column
4 Click Add.
5 Double-click a cell in the new column to manually enter the participant’s grade.
Reordering the Session Columns
A user can reorder the Results Manager session columns to fit specific needs. The course must contain more than one session.
How to reorder the session columns...
1 From the Manage tab, select a participant list and click Results Manager.
2 Click Columns and select Reorder Grade Columns.
The Reorder Grade Columns window is displayed.
Reorder Grade Columns
3 Use the up and down arrows to reorder the sessions. Alternatively, sessions can be dragged and dropped into placed or sorted by clicking on the column headers.
4 Click Save to apply the changes.
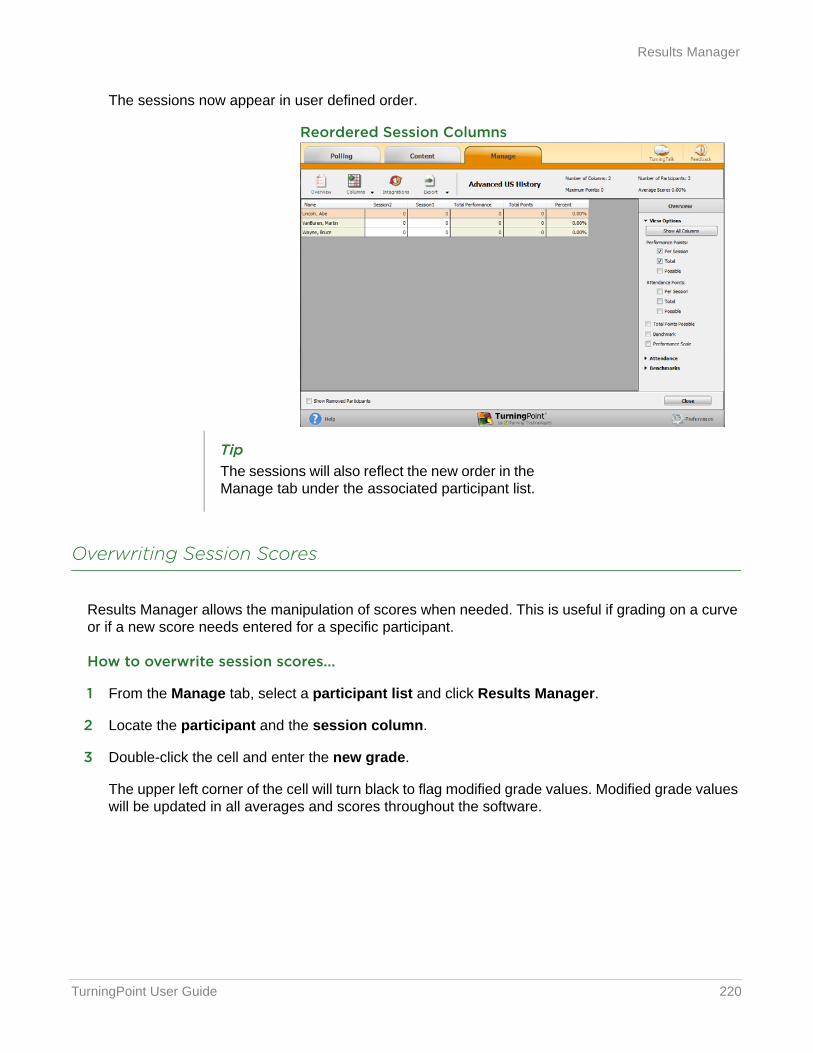
TurningPoint User Guide 220
Results Manager
The sessions now appear in user defined order.
Reordered Session Columns
Overwriting Session Scores
Results Manager allows the manipulation of scores when needed. This is useful if grading on a curve or if a new score needs entered for a specific participant.
How to overwrite session scores...
1 From the Manage tab, select a participant list and click Results Manager.
2 Locate the participant and the session column.
3 Double-click the cell and enter the new grade.
The upper left corner of the cell will turn black to flag modified grade values. Modified grade values will be updated in all averages and scores throughout the software.
TipThe sessions will also reflect the new order in the Manage tab under the associated participant list.
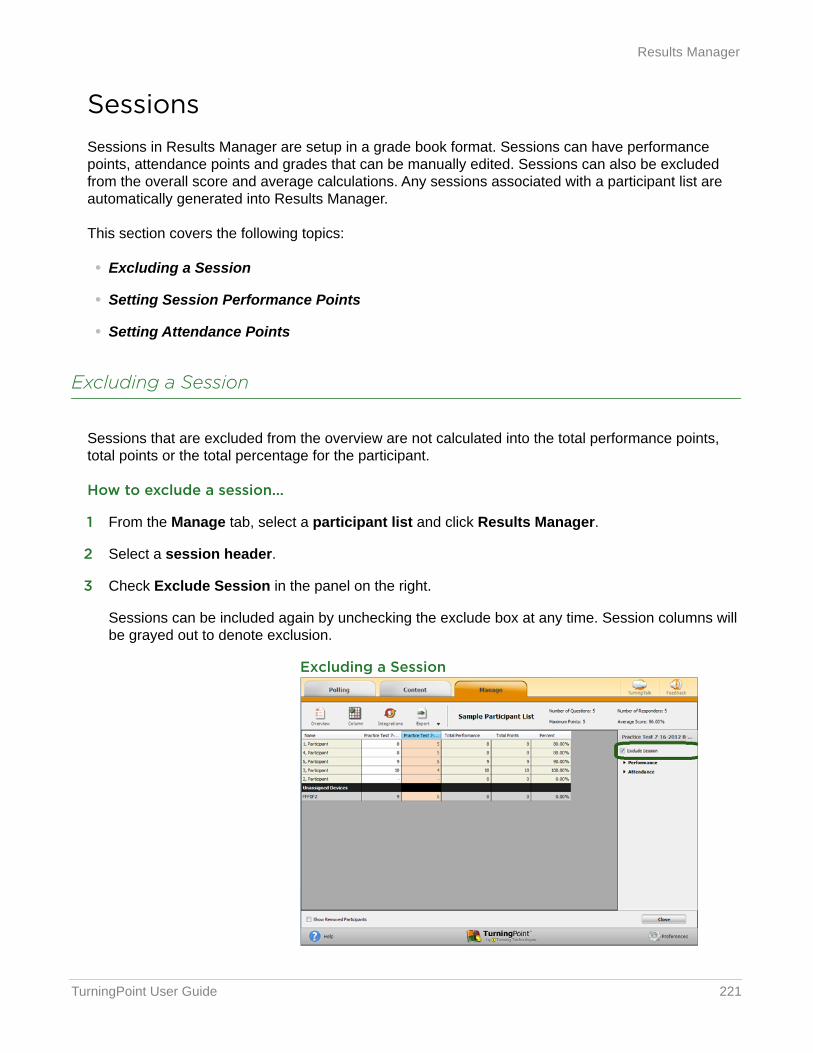
TurningPoint User Guide 221
Results Manager
SessionsSessions in Results Manager are setup in a grade book format. Sessions can have performance points, attendance points and grades that can be manually edited. Sessions can also be excluded from the overall score and average calculations. Any sessions associated with a participant list are automatically generated into Results Manager.
This section covers the following topics:
• Excluding a Session
• Setting Session Performance Points
• Setting Attendance Points
Excluding a Session
Sessions that are excluded from the overview are not calculated into the total performance points, total points or the total percentage for the participant.
How to exclude a session...
1 From the Manage tab, select a participant list and click Results Manager.
2 Select a session header.
3 Check Exclude Session in the panel on the right.
Sessions can be included again by unchecking the exclude box at any time. Session columns will be grayed out to denote exclusion.
Excluding a Session
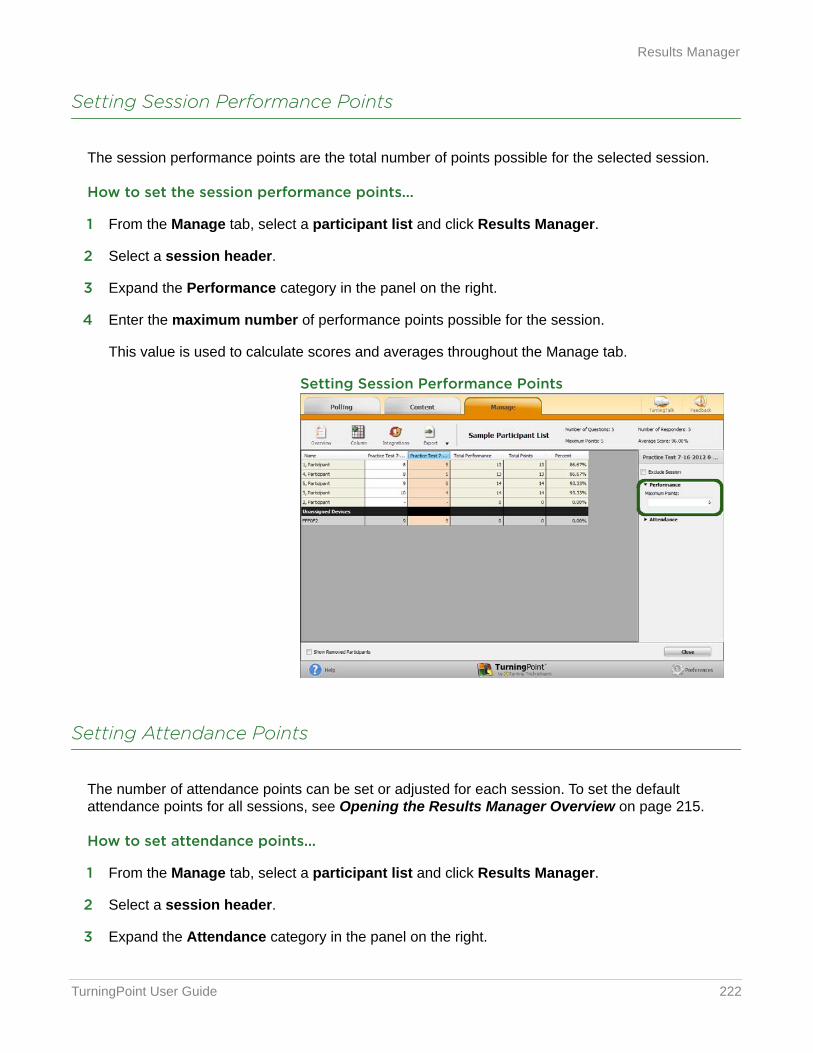
TurningPoint User Guide 222
Results Manager
Setting Session Performance Points
The session performance points are the total number of points possible for the selected session.
How to set the session performance points...
1 From the Manage tab, select a participant list and click Results Manager.
2 Select a session header.
3 Expand the Performance category in the panel on the right.
4 Enter the maximum number of performance points possible for the session.
This value is used to calculate scores and averages throughout the Manage tab.
Setting Session Performance Points
Setting Attendance Points
The number of attendance points can be set or adjusted for each session. To set the default attendance points for all sessions, see Opening the Results Manager Overview on page 215.
How to set attendance points...
1 From the Manage tab, select a participant list and click Results Manager.
2 Select a session header.
3 Expand the Attendance category in the panel on the right.
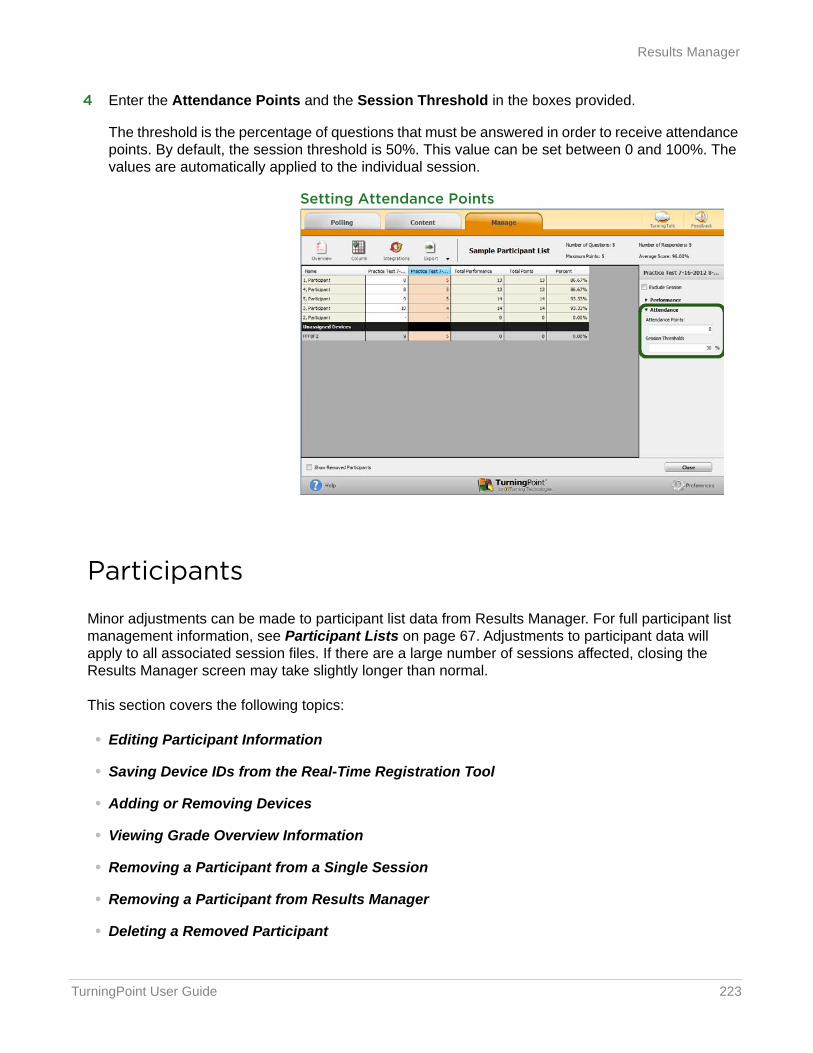
TurningPoint User Guide 223
Results Manager
4 Enter the Attendance Points and the Session Threshold in the boxes provided.
The threshold is the percentage of questions that must be answered in order to receive attendance points. By default, the session threshold is 50%. This value can be set between 0 and 100%. The values are automatically applied to the individual session.
Setting Attendance Points
Participants
Minor adjustments can be made to participant list data from Results Manager. For full participant list management information, see Participant Lists on page 67. Adjustments to participant data will apply to all associated session files. If there are a large number of sessions affected, closing the Results Manager screen may take slightly longer than normal.
This section covers the following topics:
• Editing Participant Information
• Saving Device IDs from the Real-Time Registration Tool
• Adding or Removing Devices
• Viewing Grade Overview Information
• Removing a Participant from a Single Session
• Removing a Participant from Results Manager
• Deleting a Removed Participant
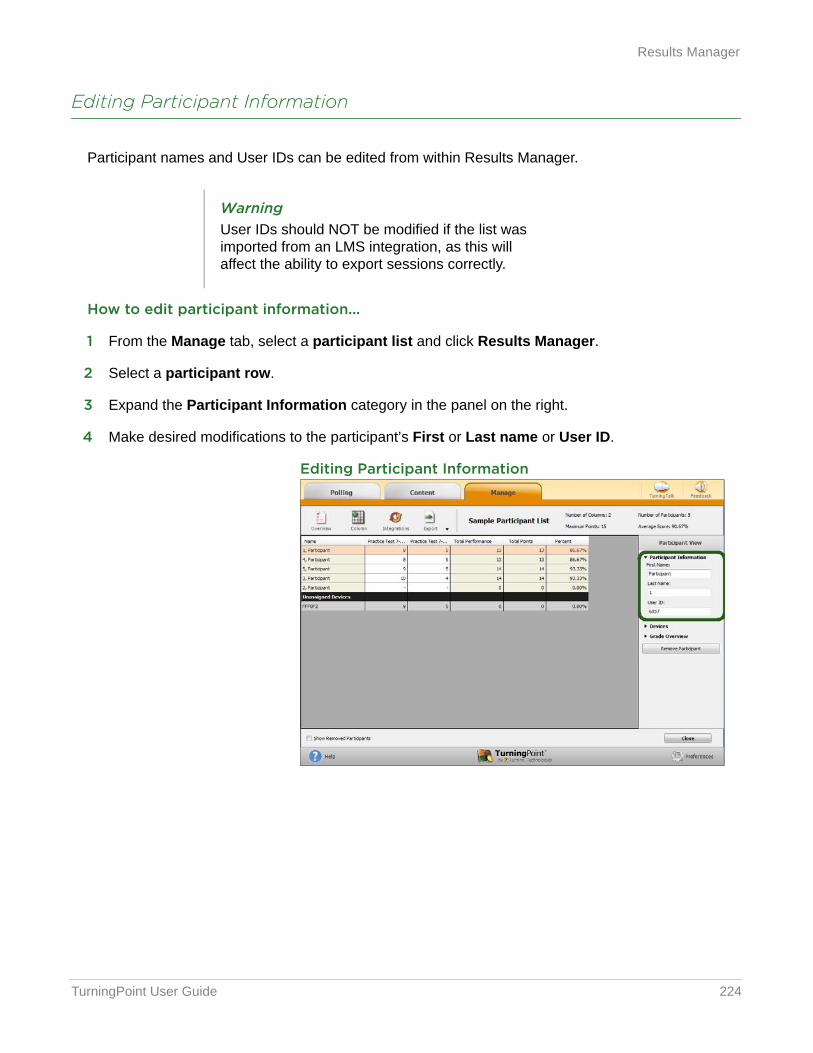
TurningPoint User Guide 224
Results Manager
Editing Participant Information
Participant names and User IDs can be edited from within Results Manager.
How to edit participant information...
1 From the Manage tab, select a participant list and click Results Manager.
2 Select a participant row.
3 Expand the Participant Information category in the panel on the right.
4 Make desired modifications to the participant’s First or Last name or User ID.
Editing Participant Information
WarningUser IDs should NOT be modified if the list was imported from an LMS integration, as this will affect the ability to export sessions correctly.
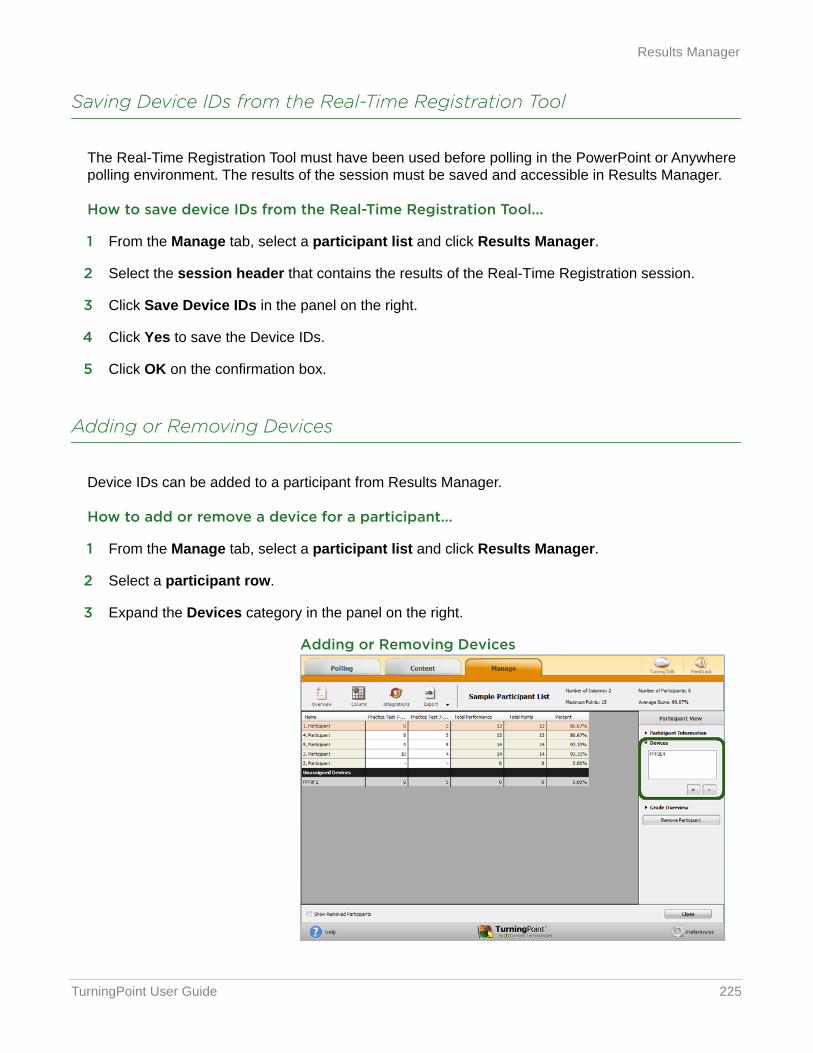
TurningPoint User Guide 225
Results Manager
Saving Device IDs from the Real-Time Registration Tool
The Real-Time Registration Tool must have been used before polling in the PowerPoint or Anywhere polling environment. The results of the session must be saved and accessible in Results Manager.
How to save device IDs from the Real-Time Registration Tool...
1 From the Manage tab, select a participant list and click Results Manager.
2 Select the session header that contains the results of the Real-Time Registration session.
3 Click Save Device IDs in the panel on the right.
4 Click Yes to save the Device IDs.
5 Click OK on the confirmation box.
Adding or Removing Devices
Device IDs can be added to a participant from Results Manager.
How to add or remove a device for a participant...
1 From the Manage tab, select a participant list and click Results Manager.
2 Select a participant row.
3 Expand the Devices category in the panel on the right.
Adding or Removing Devices
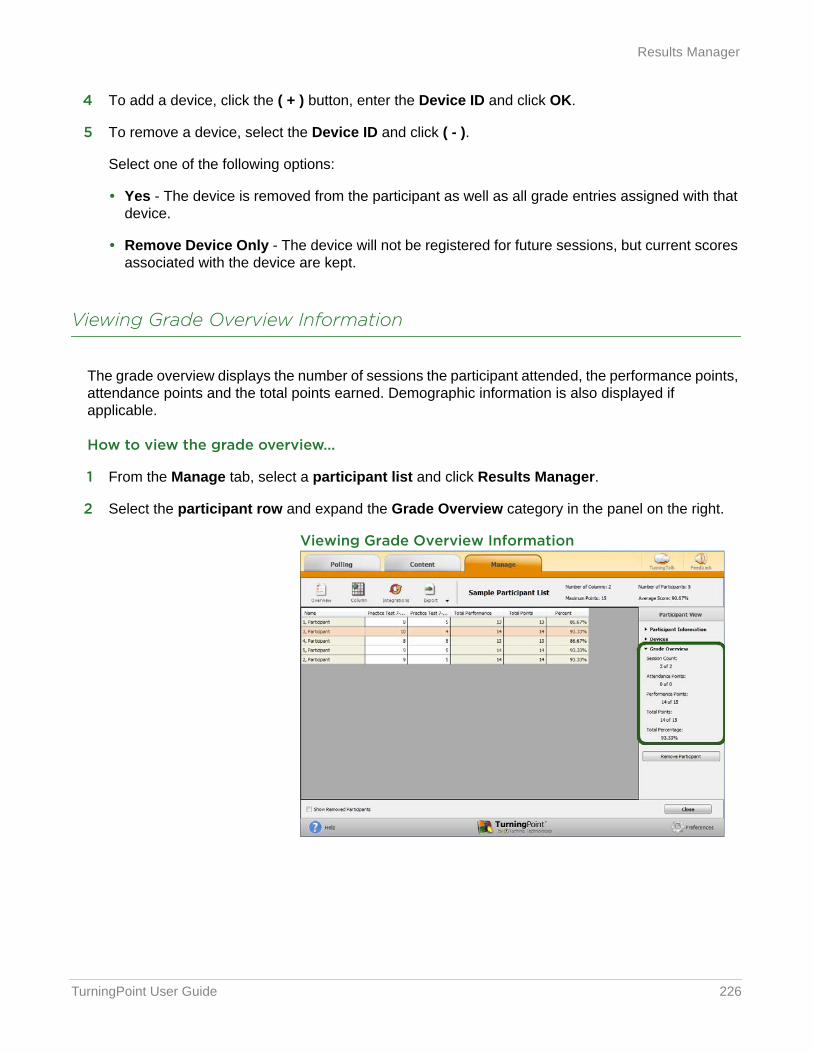
TurningPoint User Guide 226
Results Manager
4 To add a device, click the ( + ) button, enter the Device ID and click OK.
5 To remove a device, select the Device ID and click ( - ).
Select one of the following options:
• Yes - The device is removed from the participant as well as all grade entries assigned with that device.
• Remove Device Only - The device will not be registered for future sessions, but current scores associated with the device are kept.
Viewing Grade Overview Information
The grade overview displays the number of sessions the participant attended, the performance points, attendance points and the total points earned. Demographic information is also displayed if applicable.
How to view the grade overview...
1 From the Manage tab, select a participant list and click Results Manager.
2 Select the participant row and expand the Grade Overview category in the panel on the right.
Viewing Grade Overview Information
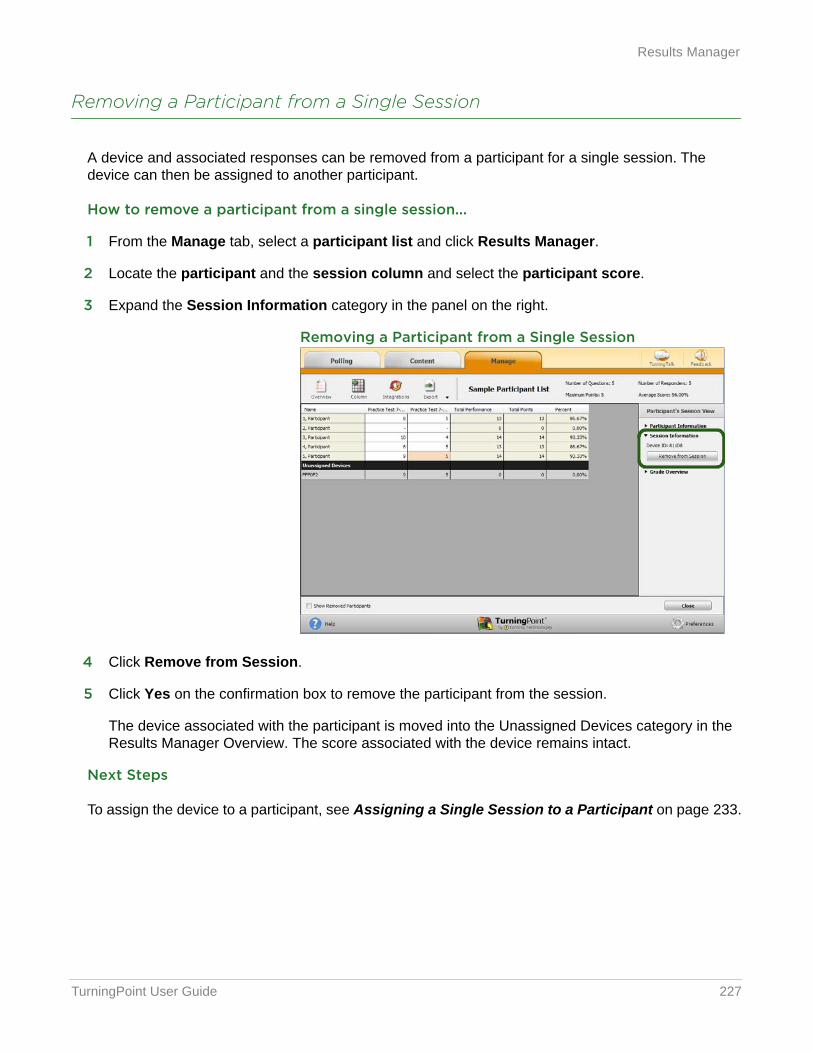
TurningPoint User Guide 227
Results Manager
Removing a Participant from a Single Session
A device and associated responses can be removed from a participant for a single session. The device can then be assigned to another participant.
How to remove a participant from a single session...
1 From the Manage tab, select a participant list and click Results Manager.
2 Locate the participant and the session column and select the participant score.
3 Expand the Session Information category in the panel on the right.
Removing a Participant from a Single Session
4 Click Remove from Session.
5 Click Yes on the confirmation box to remove the participant from the session.
The device associated with the participant is moved into the Unassigned Devices category in the Results Manager Overview. The score associated with the device remains intact.
Next Steps
To assign the device to a participant, see Assigning a Single Session to a Participant on page 233.
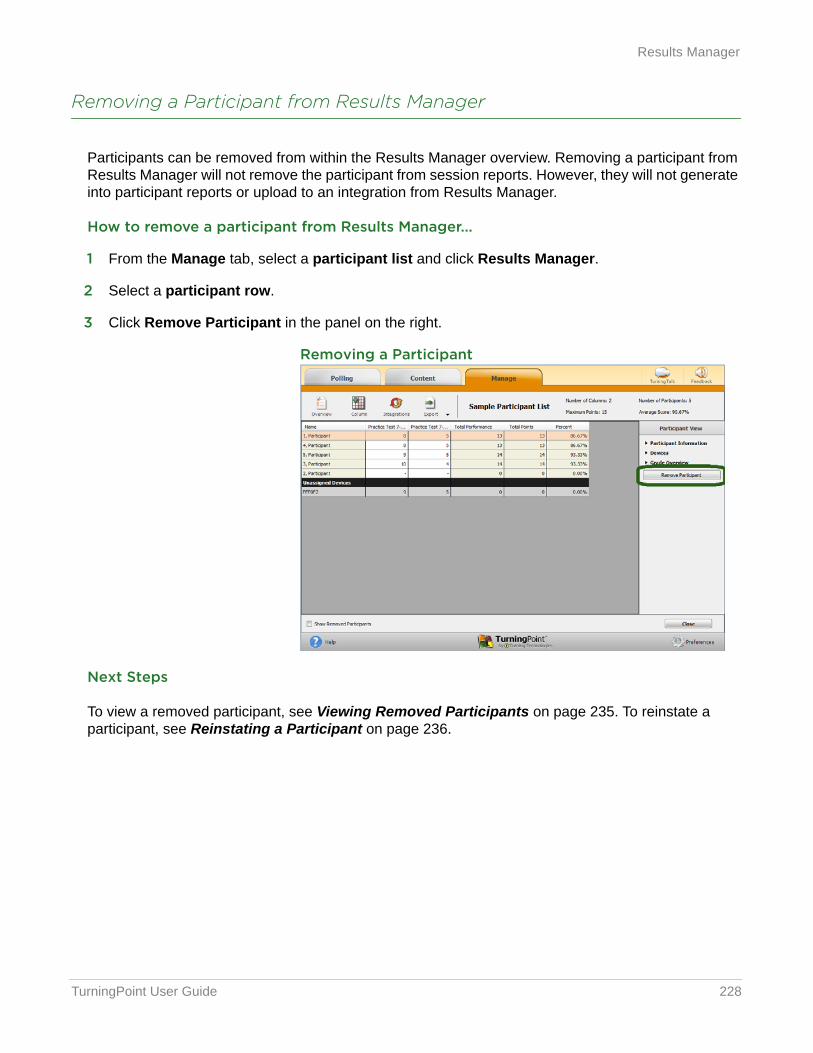
TurningPoint User Guide 228
Results Manager
Removing a Participant from Results Manager
Participants can be removed from within the Results Manager overview. Removing a participant from Results Manager will not remove the participant from session reports. However, they will not generate into participant reports or upload to an integration from Results Manager.
How to remove a participant from Results Manager...
1 From the Manage tab, select a participant list and click Results Manager.
2 Select a participant row.
3 Click Remove Participant in the panel on the right.
Removing a Participant
Next Steps
To view a removed participant, see Viewing Removed Participants on page 235. To reinstate a participant, see Reinstating a Participant on page 236.
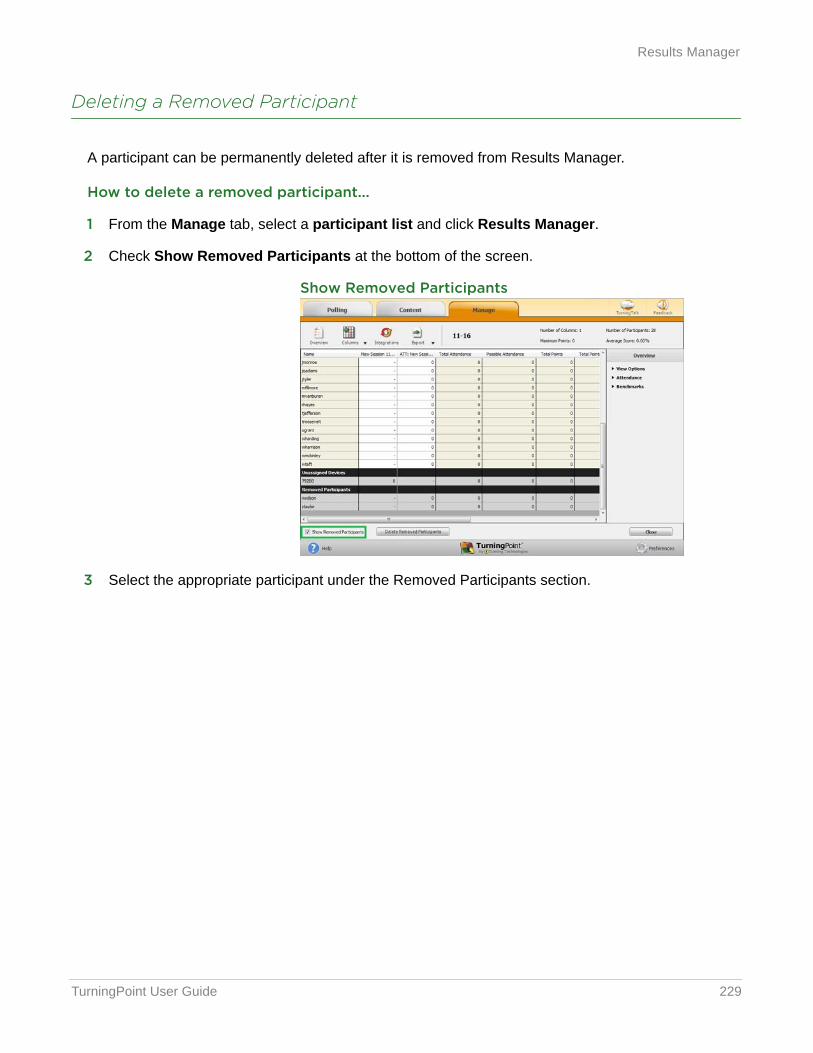
TurningPoint User Guide 229
Results Manager
Deleting a Removed Participant
A participant can be permanently deleted after it is removed from Results Manager.
How to delete a removed participant...
1 From the Manage tab, select a participant list and click Results Manager.
2 Check Show Removed Participants at the bottom of the screen.
Show Removed Participants
3 Select the appropriate participant under the Removed Participants section.
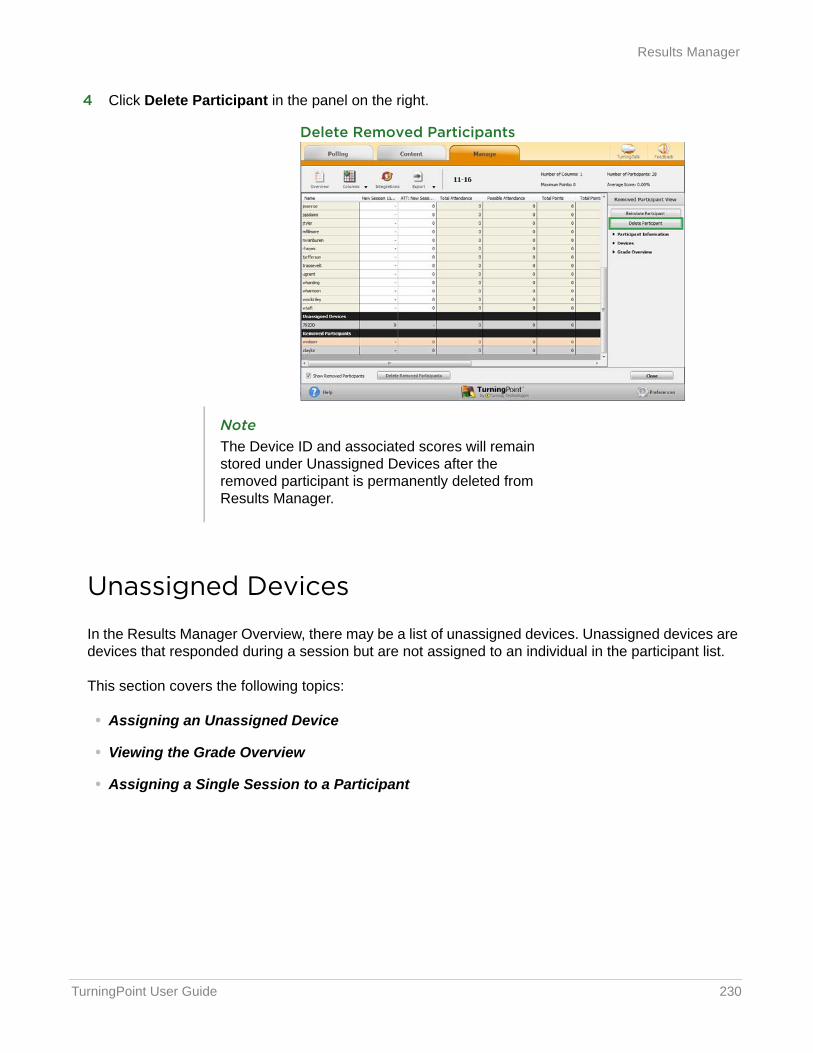
TurningPoint User Guide 230
Results Manager
4 Click Delete Participant in the panel on the right.
Delete Removed Participants
Unassigned Devices
In the Results Manager Overview, there may be a list of unassigned devices. Unassigned devices are devices that responded during a session but are not assigned to an individual in the participant list.
This section covers the following topics:
• Assigning an Unassigned Device
• Viewing the Grade Overview
• Assigning a Single Session to a Participant
NoteThe Device ID and associated scores will remain stored under Unassigned Devices after the removed participant is permanently deleted from Results Manager.
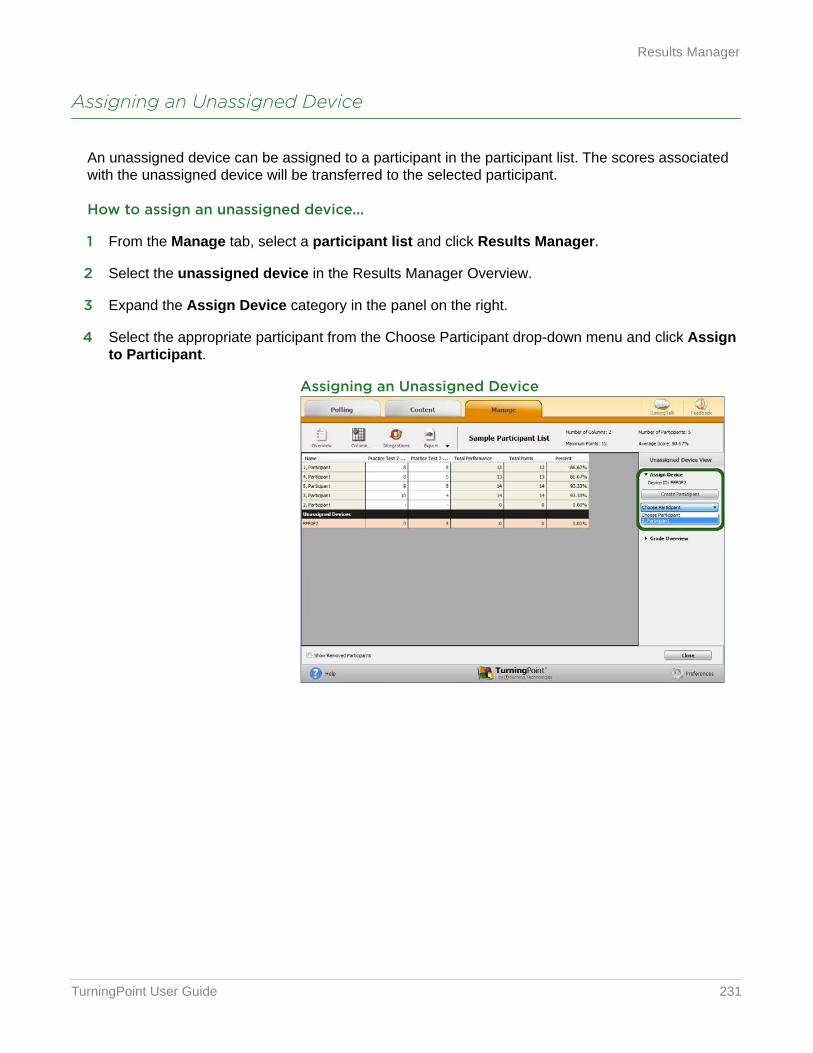
TurningPoint User Guide 231
Results Manager
Assigning an Unassigned Device
An unassigned device can be assigned to a participant in the participant list. The scores associated with the unassigned device will be transferred to the selected participant.
How to assign an unassigned device...
1 From the Manage tab, select a participant list and click Results Manager.
2 Select the unassigned device in the Results Manager Overview.
3 Expand the Assign Device category in the panel on the right.
4 Select the appropriate participant from the Choose Participant drop-down menu and click Assign to Participant.
Assigning an Unassigned Device
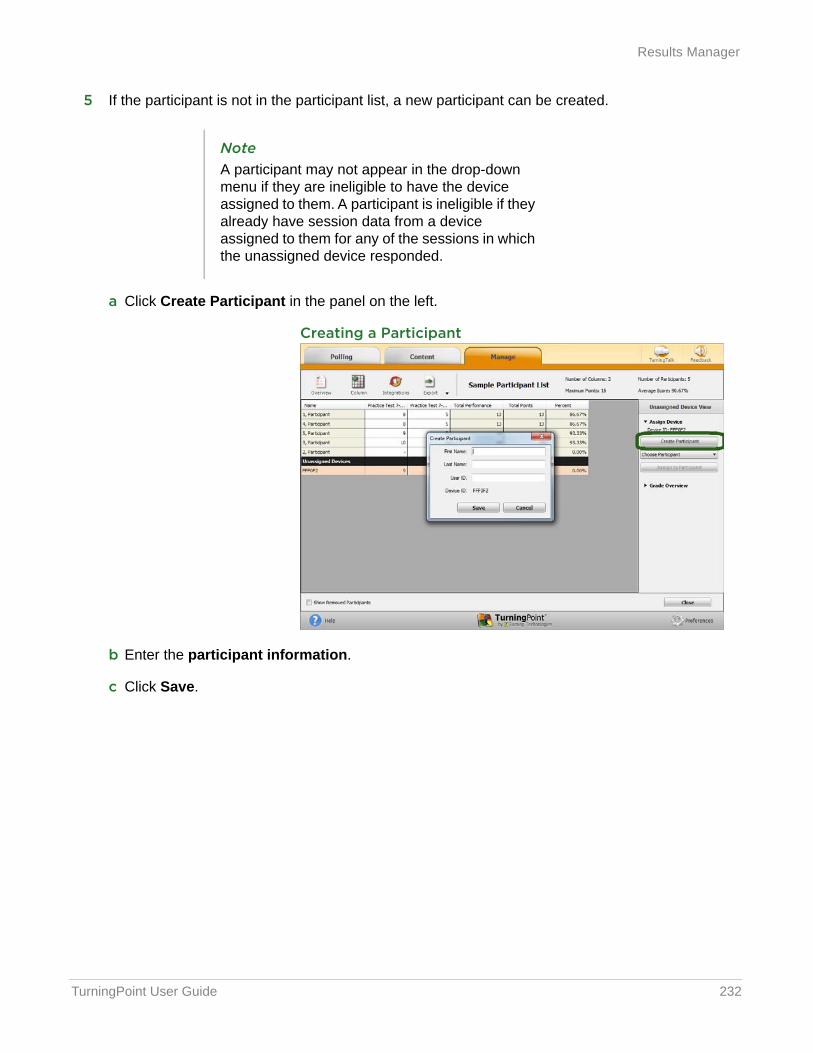
TurningPoint User Guide 232
Results Manager
5 If the participant is not in the participant list, a new participant can be created.
a Click Create Participant in the panel on the left.
Creating a Participant
b Enter the participant information.
c Click Save.
NoteA participant may not appear in the drop-down menu if they are ineligible to have the device assigned to them. A participant is ineligible if they already have session data from a device assigned to them for any of the sessions in which the unassigned device responded.
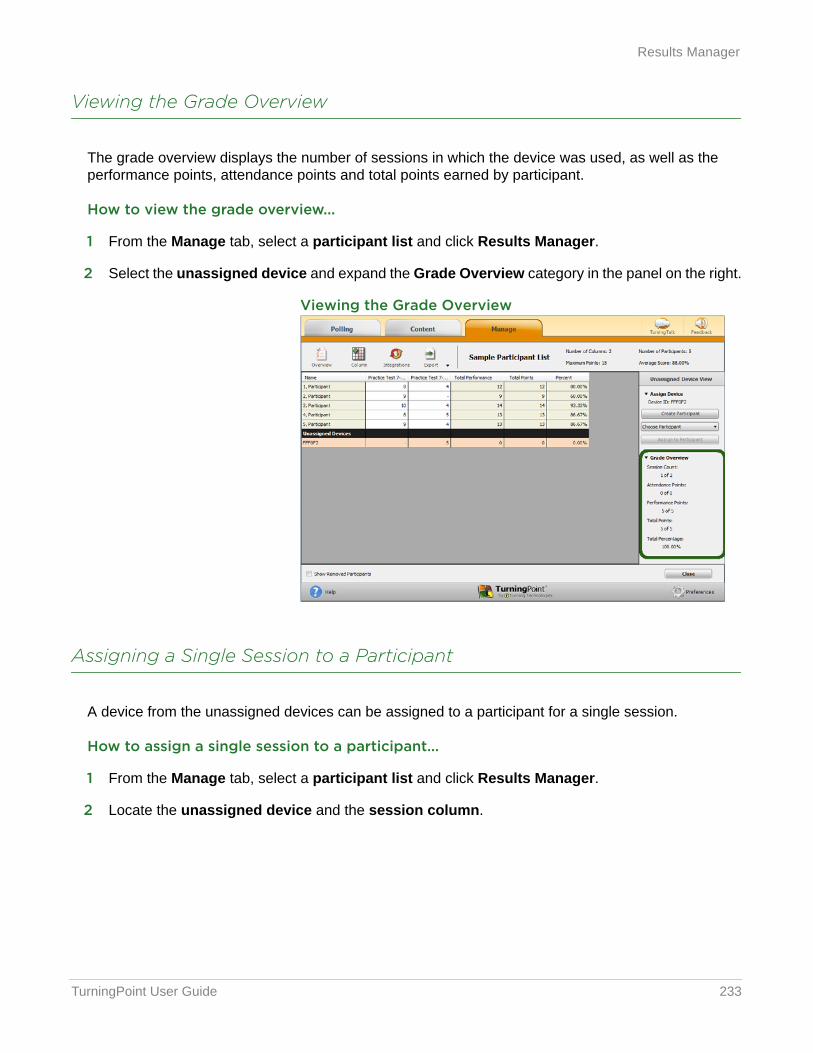
TurningPoint User Guide 233
Results Manager
Viewing the Grade Overview
The grade overview displays the number of sessions in which the device was used, as well as the performance points, attendance points and total points earned by participant.
How to view the grade overview...
1 From the Manage tab, select a participant list and click Results Manager.
2 Select the unassigned device and expand the Grade Overview category in the panel on the right.
Viewing the Grade Overview
Assigning a Single Session to a Participant
A device from the unassigned devices can be assigned to a participant for a single session.
How to assign a single session to a participant...
1 From the Manage tab, select a participant list and click Results Manager.
2 Locate the unassigned device and the session column.
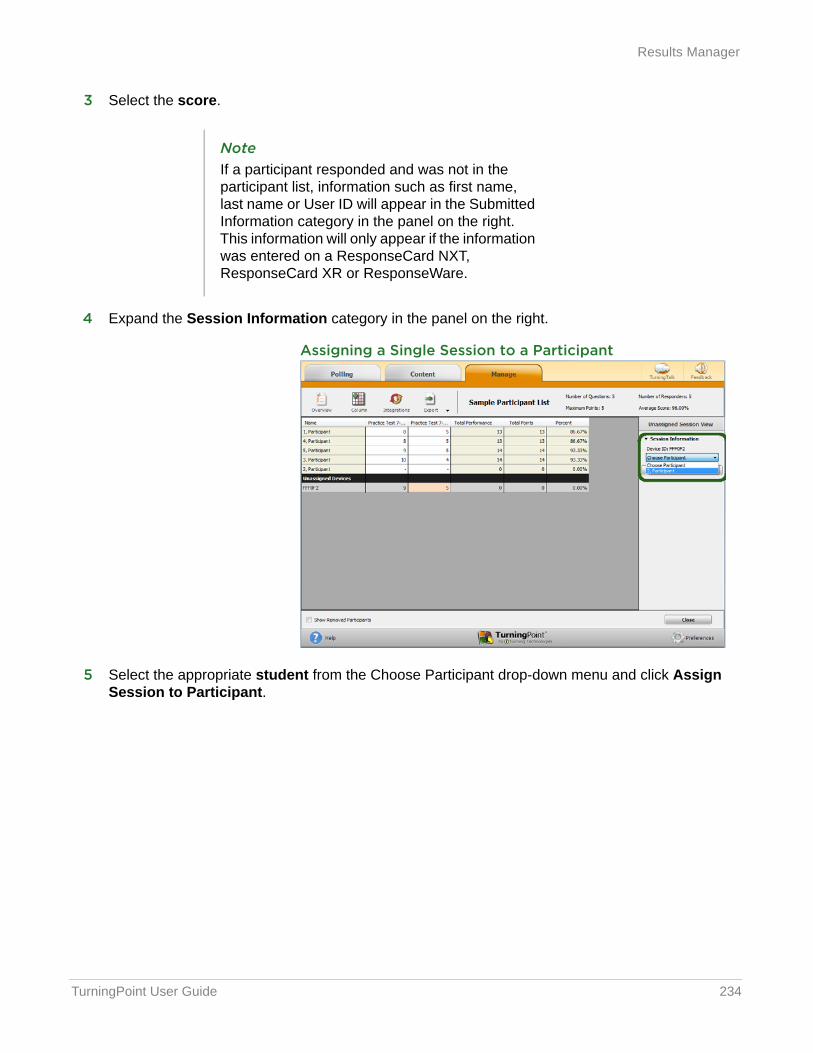
TurningPoint User Guide 234
Results Manager
3 Select the score.
4 Expand the Session Information category in the panel on the right.
Assigning a Single Session to a Participant
5 Select the appropriate student from the Choose Participant drop-down menu and click Assign Session to Participant.
NoteIf a participant responded and was not in the participant list, information such as first name, last name or User ID will appear in the Submitted Information category in the panel on the right. This information will only appear if the information was entered on a ResponseCard NXT, ResponseCard XR or ResponseWare.
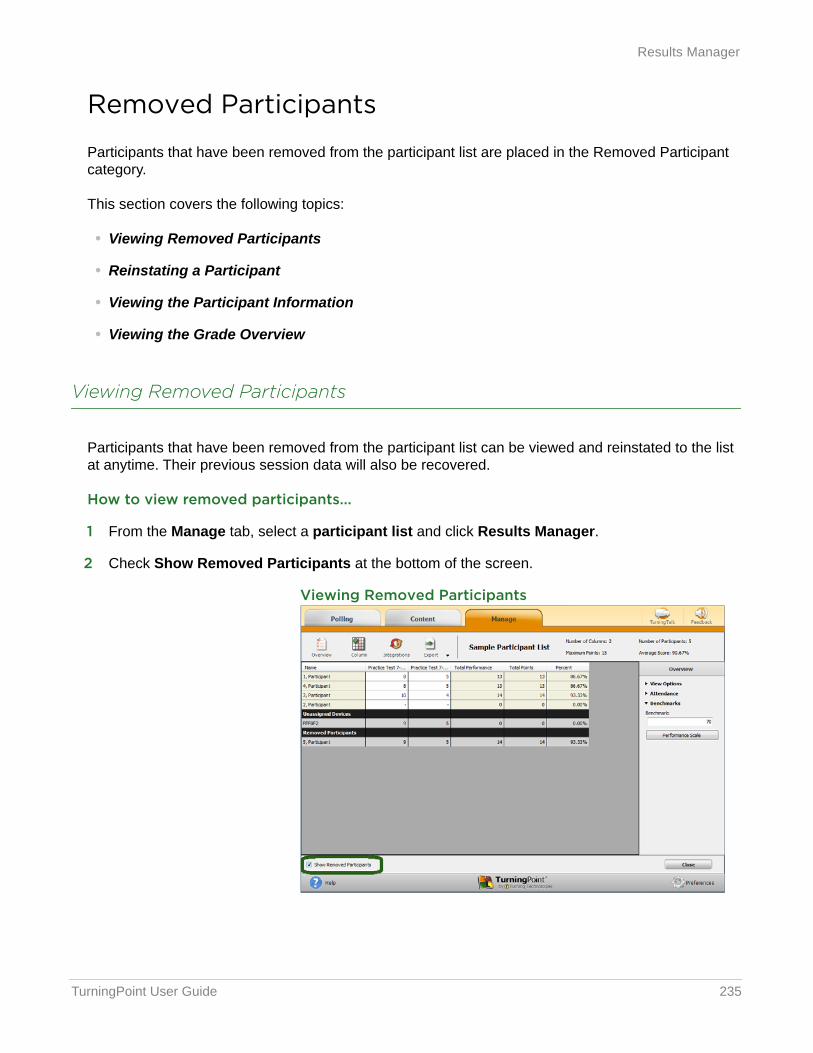
TurningPoint User Guide 235
Results Manager
Removed Participants
Participants that have been removed from the participant list are placed in the Removed Participant category.
This section covers the following topics:
• Viewing Removed Participants
• Reinstating a Participant
• Viewing the Participant Information
• Viewing the Grade Overview
Viewing Removed Participants
Participants that have been removed from the participant list can be viewed and reinstated to the list at anytime. Their previous session data will also be recovered.
How to view removed participants...
1 From the Manage tab, select a participant list and click Results Manager.
2 Check Show Removed Participants at the bottom of the screen.
Viewing Removed Participants
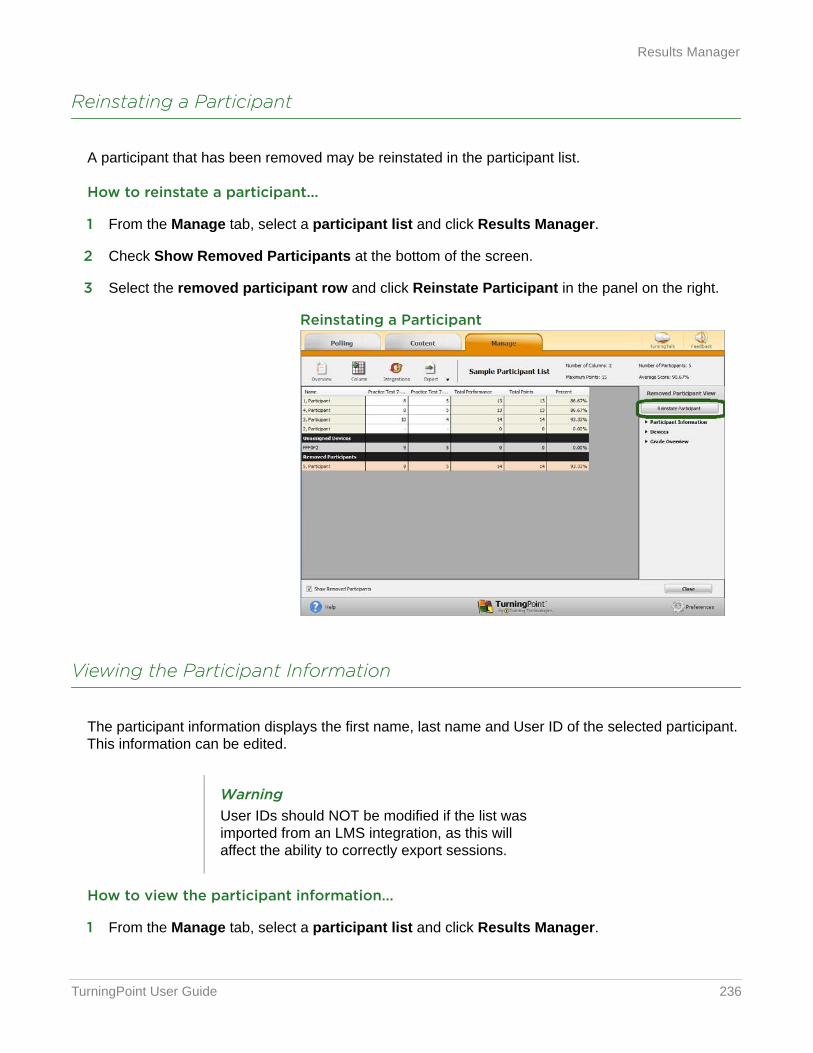
TurningPoint User Guide 236
Results Manager
Reinstating a Participant
A participant that has been removed may be reinstated in the participant list.
How to reinstate a participant...
1 From the Manage tab, select a participant list and click Results Manager.
2 Check Show Removed Participants at the bottom of the screen.
3 Select the removed participant row and click Reinstate Participant in the panel on the right.
Reinstating a Participant
Viewing the Participant Information
The participant information displays the first name, last name and User ID of the selected participant. This information can be edited.
How to view the participant information...
1 From the Manage tab, select a participant list and click Results Manager.
WarningUser IDs should NOT be modified if the list was imported from an LMS integration, as this will affect the ability to correctly export sessions.
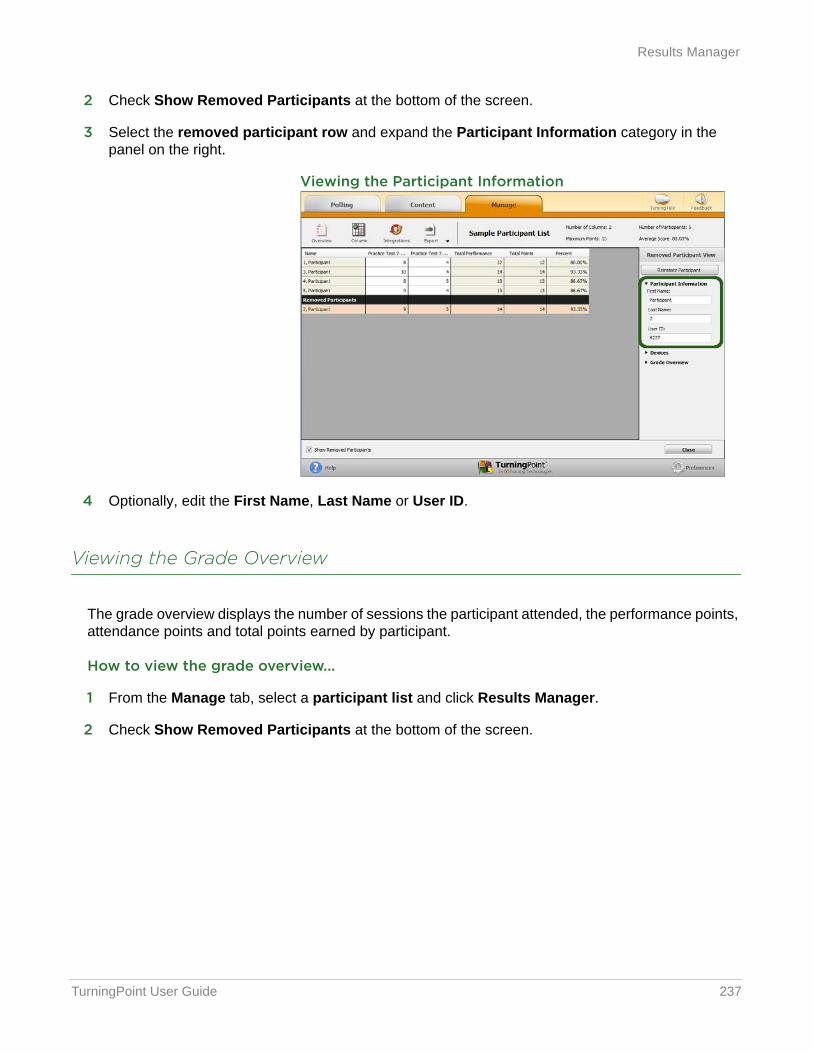
TurningPoint User Guide 237
Results Manager
2 Check Show Removed Participants at the bottom of the screen.
3 Select the removed participant row and expand the Participant Information category in the panel on the right.
Viewing the Participant Information
4 Optionally, edit the First Name, Last Name or User ID.
Viewing the Grade Overview
The grade overview displays the number of sessions the participant attended, the performance points, attendance points and total points earned by participant.
How to view the grade overview...
1 From the Manage tab, select a participant list and click Results Manager.
2 Check Show Removed Participants at the bottom of the screen.
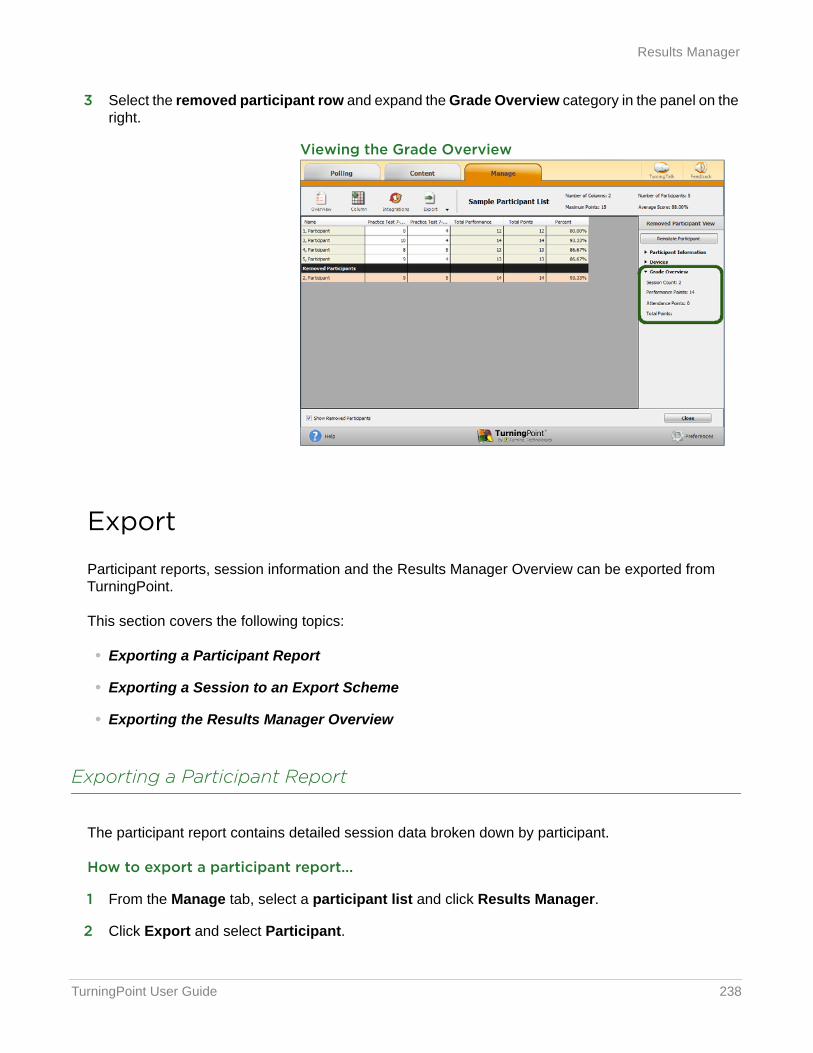
TurningPoint User Guide 238
Results Manager
3 Select the removed participant row and expand the Grade Overview category in the panel on the right.
Viewing the Grade Overview
Export
Participant reports, session information and the Results Manager Overview can be exported from TurningPoint.
This section covers the following topics:
• Exporting a Participant Report
• Exporting a Session to an Export Scheme
• Exporting the Results Manager Overview
Exporting a Participant Report
The participant report contains detailed session data broken down by participant.
How to export a participant report...
1 From the Manage tab, select a participant list and click Results Manager.
2 Click Export and select Participant.
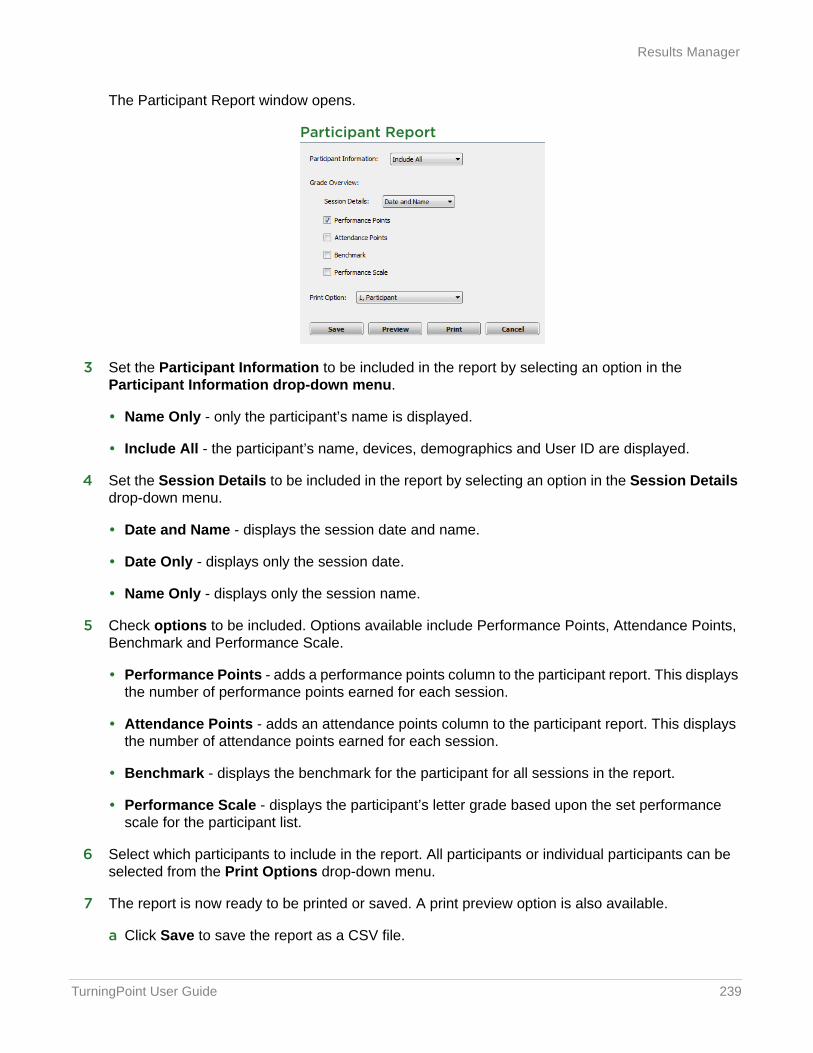
TurningPoint User Guide 239
Results Manager
The Participant Report window opens.
Participant Report
3 Set the Participant Information to be included in the report by selecting an option in the Participant Information drop-down menu.
• Name Only - only the participant’s name is displayed.
• Include All - the participant’s name, devices, demographics and User ID are displayed.
4 Set the Session Details to be included in the report by selecting an option in the Session Details drop-down menu.
• Date and Name - displays the session date and name.
• Date Only - displays only the session date.
• Name Only - displays only the session name.
5 Check options to be included. Options available include Performance Points, Attendance Points, Benchmark and Performance Scale.
• Performance Points - adds a performance points column to the participant report. This displays the number of performance points earned for each session.
• Attendance Points - adds an attendance points column to the participant report. This displays the number of attendance points earned for each session.
• Benchmark - displays the benchmark for the participant for all sessions in the report.
• Performance Scale - displays the participant’s letter grade based upon the set performance scale for the participant list.
6 Select which participants to include in the report. All participants or individual participants can be selected from the Print Options drop-down menu.
7 The report is now ready to be printed or saved. A print preview option is also available.
a Click Save to save the report as a CSV file.
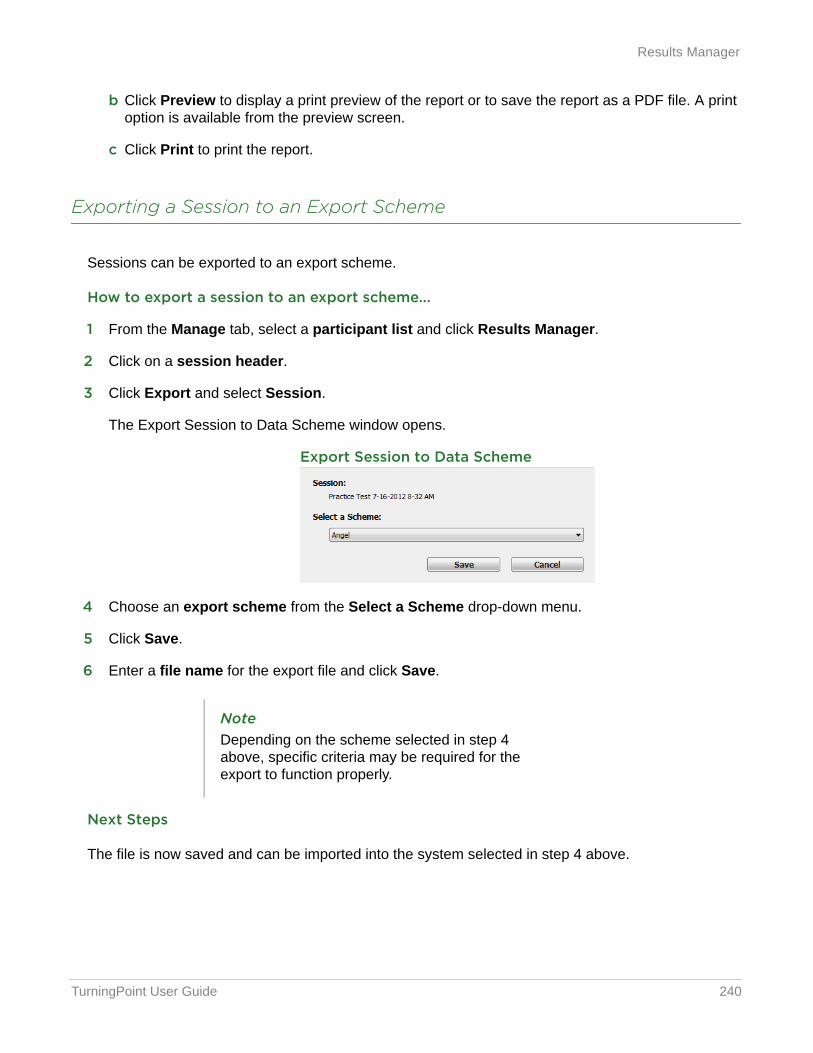
TurningPoint User Guide 240
Results Manager
b Click Preview to display a print preview of the report or to save the report as a PDF file. A print option is available from the preview screen.
c Click Print to print the report.
Exporting a Session to an Export Scheme
Sessions can be exported to an export scheme.
How to export a session to an export scheme...
1 From the Manage tab, select a participant list and click Results Manager.
2 Click on a session header.
3 Click Export and select Session.
The Export Session to Data Scheme window opens.
Export Session to Data Scheme
4 Choose an export scheme from the Select a Scheme drop-down menu.
5 Click Save.
6 Enter a file name for the export file and click Save.
Next Steps
The file is now saved and can be imported into the system selected in step 4 above.
NoteDepending on the scheme selected in step 4 above, specific criteria may be required for the export to function properly.
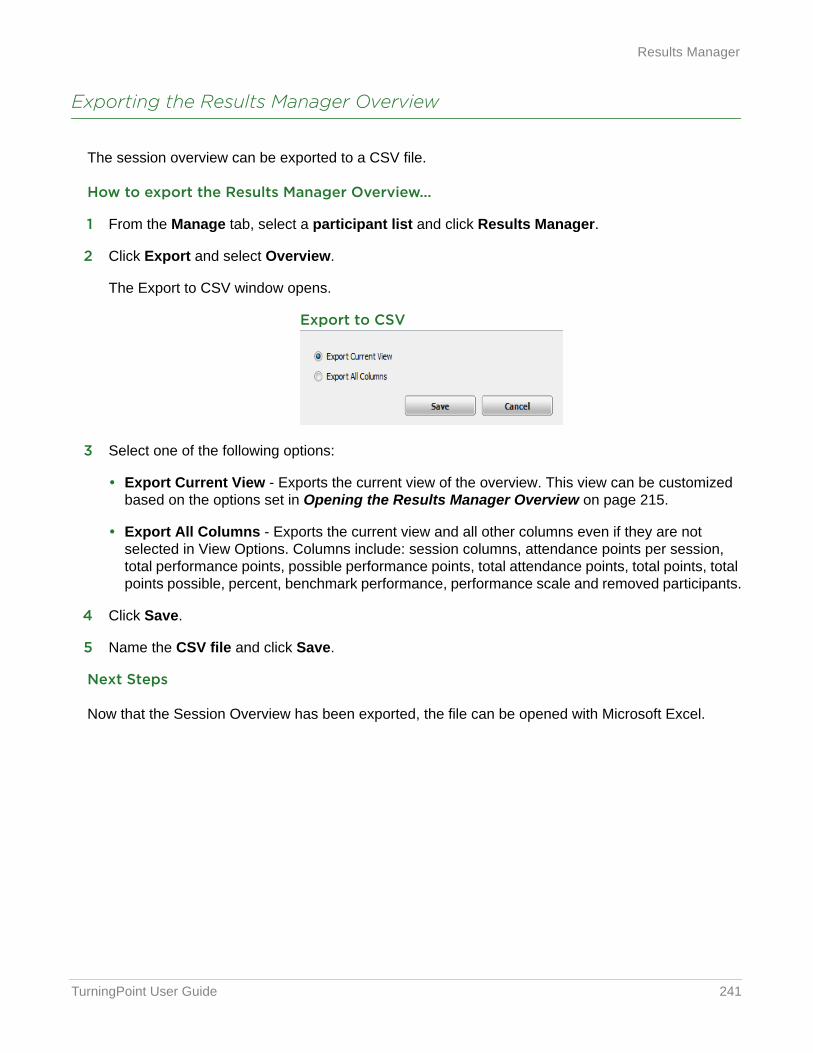
TurningPoint User Guide 241
Results Manager
Exporting the Results Manager Overview
The session overview can be exported to a CSV file.
How to export the Results Manager Overview...
1 From the Manage tab, select a participant list and click Results Manager.
2 Click Export and select Overview.
The Export to CSV window opens.
Export to CSV
3 Select one of the following options:
• Export Current View - Exports the current view of the overview. This view can be customized based on the options set in Opening the Results Manager Overview on page 215.
• Export All Columns - Exports the current view and all other columns even if they are not selected in View Options. Columns include: session columns, attendance points per session, total performance points, possible performance points, total attendance points, total points, total points possible, percent, benchmark performance, performance scale and removed participants.
4 Click Save.
5 Name the CSV file and click Save.
Next Steps
Now that the Session Overview has been exported, the file can be opened with Microsoft Excel.
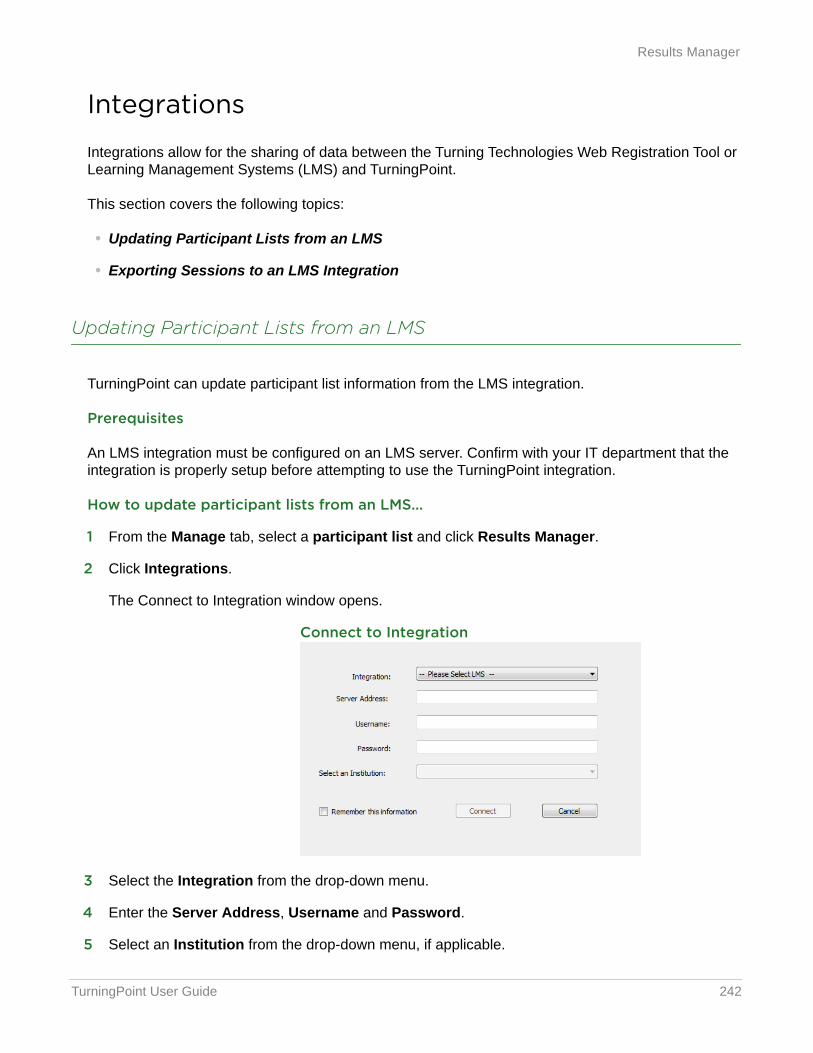
TurningPoint User Guide 242
Results Manager
Integrations
Integrations allow for the sharing of data between the Turning Technologies Web Registration Tool or Learning Management Systems (LMS) and TurningPoint.
This section covers the following topics:
• Updating Participant Lists from an LMS
• Exporting Sessions to an LMS Integration
Updating Participant Lists from an LMS
TurningPoint can update participant list information from the LMS integration.
Prerequisites
An LMS integration must be configured on an LMS server. Confirm with your IT department that the integration is properly setup before attempting to use the TurningPoint integration.
How to update participant lists from an LMS...
1 From the Manage tab, select a participant list and click Results Manager.
2 Click Integrations.
The Connect to Integration window opens.
Connect to Integration
3 Select the Integration from the drop-down menu.
4 Enter the Server Address, Username and Password.
5 Select an Institution from the drop-down menu, if applicable.
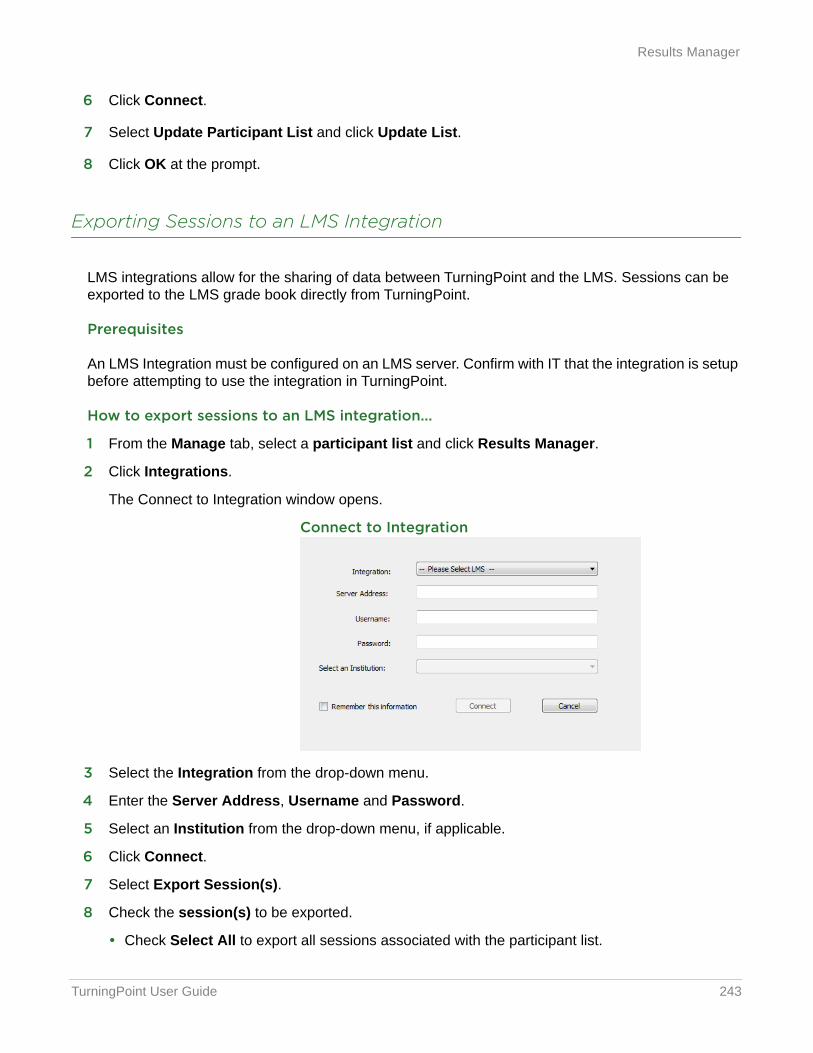
TurningPoint User Guide 243
Results Manager
6 Click Connect.
7 Select Update Participant List and click Update List.
8 Click OK at the prompt.
Exporting Sessions to an LMS Integration
LMS integrations allow for the sharing of data between TurningPoint and the LMS. Sessions can be exported to the LMS grade book directly from TurningPoint.
Prerequisites
An LMS Integration must be configured on an LMS server. Confirm with IT that the integration is setup before attempting to use the integration in TurningPoint.
How to export sessions to an LMS integration...
1 From the Manage tab, select a participant list and click Results Manager.
2 Click Integrations.
The Connect to Integration window opens.
Connect to Integration
3 Select the Integration from the drop-down menu.
4 Enter the Server Address, Username and Password.
5 Select an Institution from the drop-down menu, if applicable.
6 Click Connect.
7 Select Export Session(s).
8 Check the session(s) to be exported.
• Check Select All to export all sessions associated with the participant list.
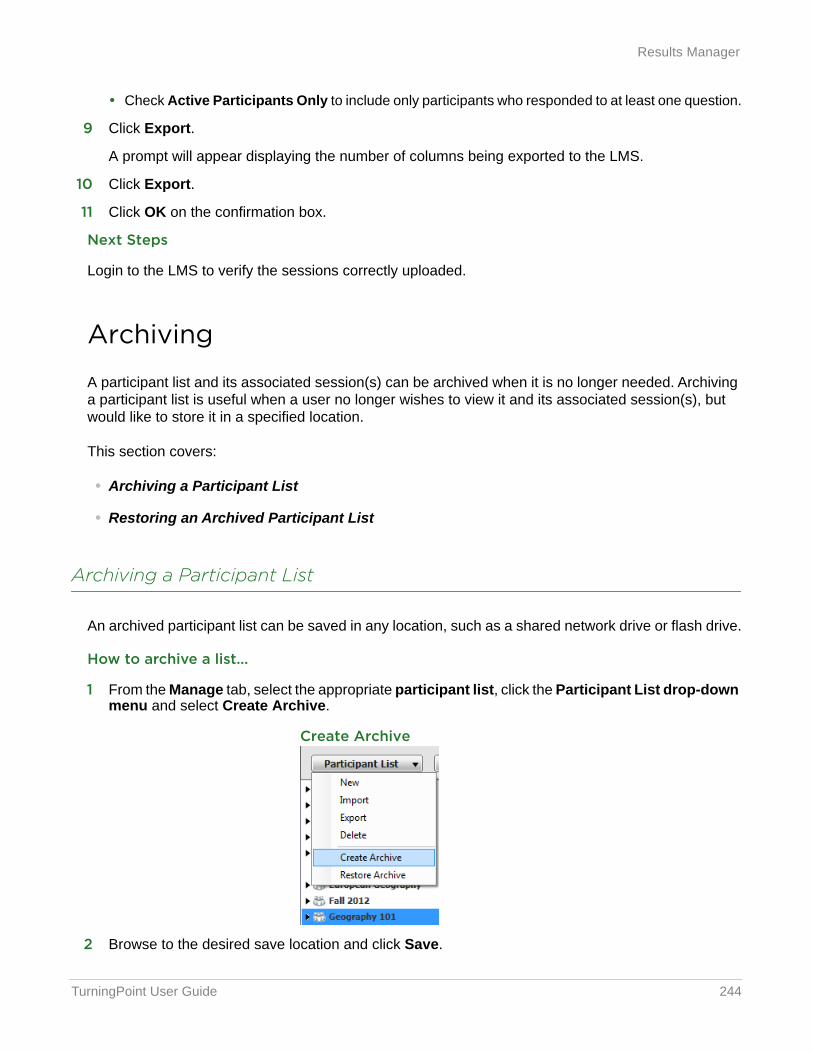
TurningPoint User Guide 244
Results Manager
• Check Active Participants Only to include only participants who responded to at least one question.
9 Click Export.
A prompt will appear displaying the number of columns being exported to the LMS.
10 Click Export.
11 Click OK on the confirmation box.
Next Steps
Login to the LMS to verify the sessions correctly uploaded.
Archiving
A participant list and its associated session(s) can be archived when it is no longer needed. Archiving a participant list is useful when a user no longer wishes to view it and its associated session(s), but would like to store it in a specified location.
This section covers:
• Archiving a Participant List
• Restoring an Archived Participant List
Archiving a Participant List
An archived participant list can be saved in any location, such as a shared network drive or flash drive.
How to archive a list...
1 From the Manage tab, select the appropriate participant list, click the Participant List drop-down menu and select Create Archive.
Create Archive
2 Browse to the desired save location and click Save.
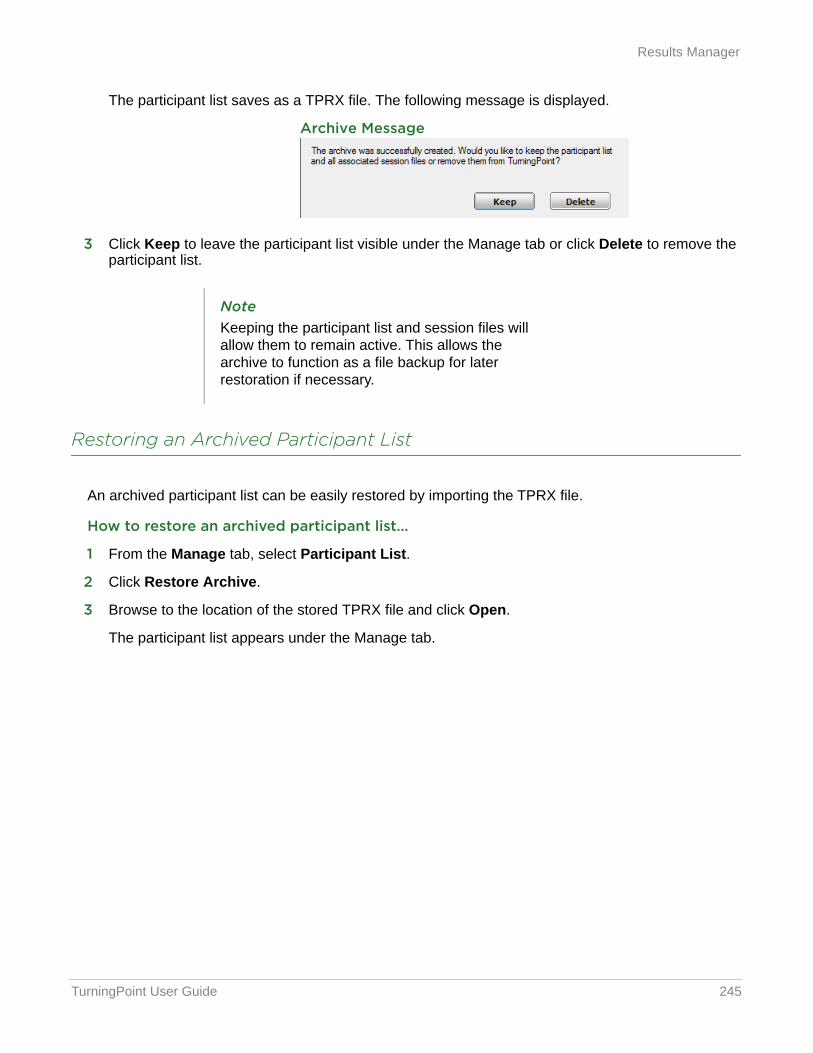
TurningPoint User Guide 245
Results Manager
The participant list saves as a TPRX file. The following message is displayed.
Archive Message
3 Click Keep to leave the participant list visible under the Manage tab or click Delete to remove the participant list.
Restoring an Archived Participant List
An archived participant list can be easily restored by importing the TPRX file.
How to restore an archived participant list...
1 From the Manage tab, select Participant List.
2 Click Restore Archive.
3 Browse to the location of the stored TPRX file and click Open.
The participant list appears under the Manage tab.
NoteKeeping the participant list and session files will allow them to remain active. This allows the archive to function as a file backup for later restoration if necessary.

TurningPoint User Guide 246
9 Reports
There are six types of reports available:
• Results by Question
• Results by Participant
• Results Detail
• Results by Demographic
• Comparative Results
• Session Log Report
Each report can be customized by selecting the data options on the right side of the reports window.
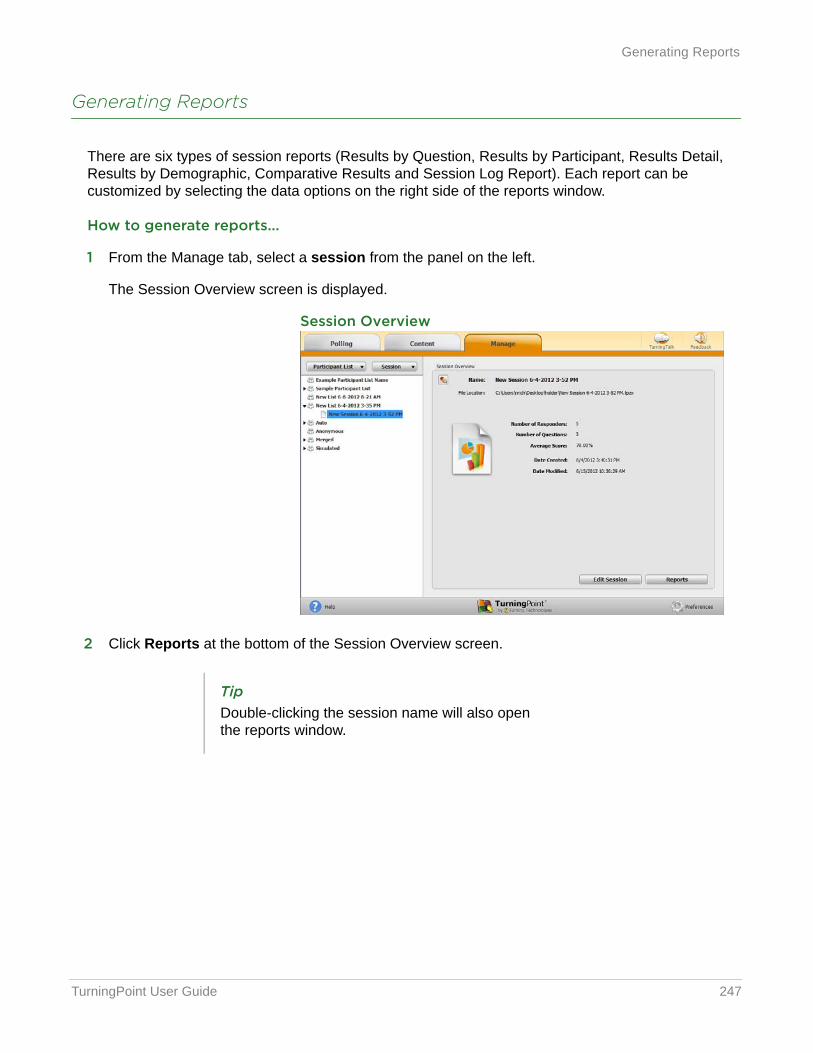
TurningPoint User Guide 247
Generating Reports
Generating Reports
There are six types of session reports (Results by Question, Results by Participant, Results Detail, Results by Demographic, Comparative Results and Session Log Report). Each report can be customized by selecting the data options on the right side of the reports window.
How to generate reports...
1 From the Manage tab, select a session from the panel on the left.
The Session Overview screen is displayed.
Session Overview
2 Click Reports at the bottom of the Session Overview screen.
TipDouble-clicking the session name will also open the reports window.
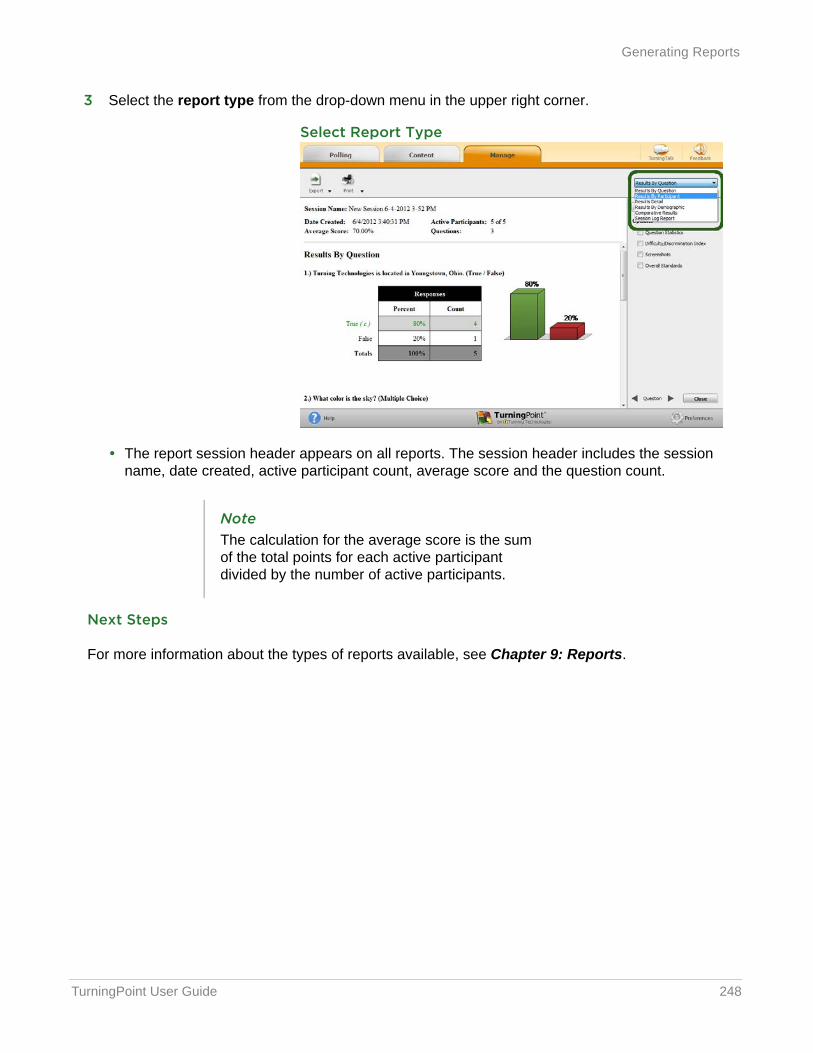
TurningPoint User Guide 248
Generating Reports
3 Select the report type from the drop-down menu in the upper right corner.
Select Report Type
• The report session header appears on all reports. The session header includes the session name, date created, active participant count, average score and the question count.
Next Steps
For more information about the types of reports available, see Chapter 9: Reports.
NoteThe calculation for the average score is the sum of the total points for each active participant divided by the number of active participants.
TurningPoint User Guide 249
Exporting a Report
Exporting a Report
Reports can be exported as a CSV, Excel or HTML file.
How to export a report...
1 While in the reports window, click Export and select one of the following options:
• CSV - CSV files are plain text files that can be opened with various programs.
• Excel - Saves the file as a Microsoft Excel spreadsheet with native Excel charts for manual manipulation.
• HTML - HTML files can be opened with an Internet browser.
2 Name the file and click Save.
Saving and Printing a PDF Report
TurningPoint allows the user to print a hard copy of the reports. The reports are printed as PDF files.
How to print a report...
1 While in the reports window, click Print and select Print.
2 Make any necessary adjustments in the Print window.
3 Click Print.
NoteJava must be installed to export a report as a CSV or Excel file.
TipClick Print and select Preview to view the report before printing or to save the report as a PDF.
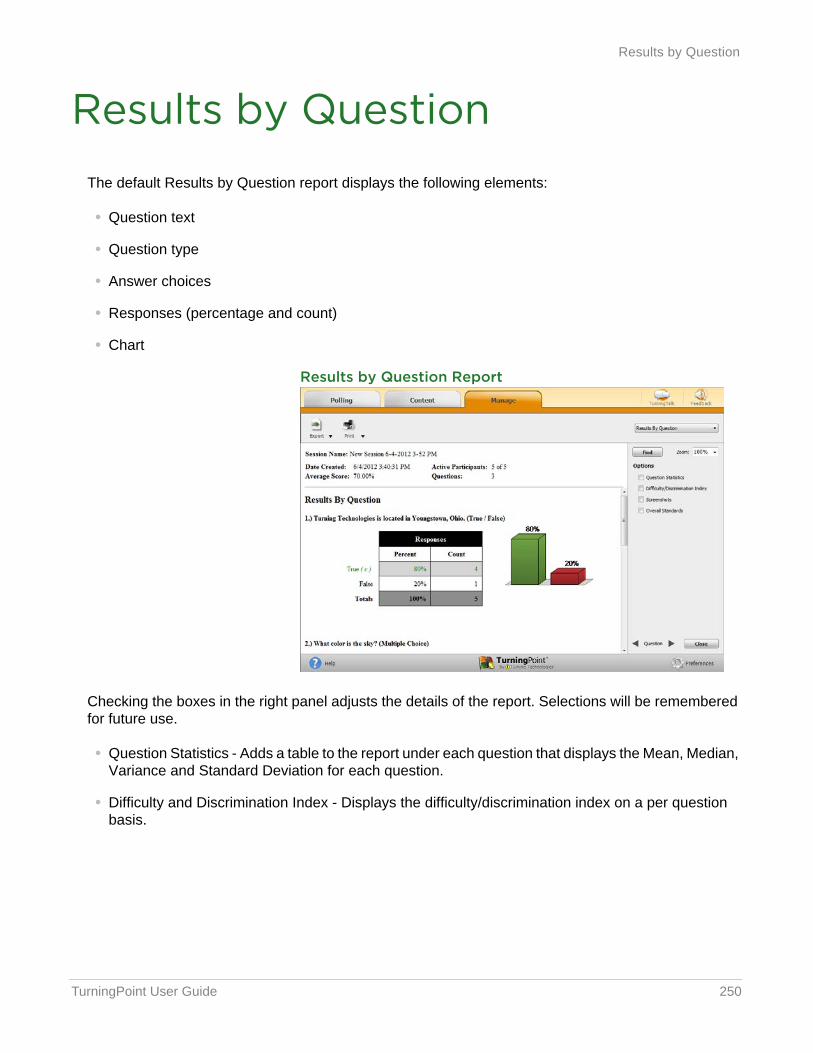
TurningPoint User Guide 250
Results by Question
Results by QuestionThe default Results by Question report displays the following elements:
• Question text
• Question type
• Answer choices
• Responses (percentage and count)
• Chart
Results by Question Report
Checking the boxes in the right panel adjusts the details of the report. Selections will be remembered for future use.
• Question Statistics - Adds a table to the report under each question that displays the Mean, Median, Variance and Standard Deviation for each question.
• Difficulty and Discrimination Index - Displays the difficulty/discrimination index on a per question basis.

TurningPoint User Guide 251
Results by Question
The Difficulty Index1is a measure of how difficult the question was to correctly answer. It shows the percentage of participants that answered the question correctly based on the entire group of active participants. The Difficulty Index is calculated using the following formula: D = c / n
• D = Difficulty Index
• c = Number of participants that answered the question correctly
• n = Total number of active participants
The Discrimination Index2 for a particular question is based on the point biserial correlation coefficient, which measures the correlation between the correct answer on a question and the total test scores of the active participants.
To calculate this statistic, you must first determine the following:
• Total number of Participants that answered the question correctly
• Total number of Participants that answered the question incorrectly
A Participant that has not responded to a question is considered to have answered incorrectly.
• Mean total score of the group of Participants that have answered the question correctly*
• Mean total score of the group of Participants that answered the question incorrectly*
• Mean total score of all active Participants*
• Standard Deviation
standard deviation ( ) = ( ((x - )²) / n)
• x = a Participant’s score
• = mean total score
• n = total number of Participants
The discrimination index can then be computed with the following formula:
discrimination index = ((Mp-Mq) / ) * ((Np*Nq)/ ((Np+Nq) * (Np+Nq-1))
• Mp = mean total score of the group of Participants that answered question the correctly*
• Mq = mean total score of the group of Participants that answered the question incorrectly*
• Np = total number of Participants that answered the question correctly
• Nq = total number of Participants that answered the question incorrectly
• = standard deviation of scores for the entire set
1. Kenneth D. Hopkins, Educational and Psychological Measurement and Evaluation, 8th ed. (Needham Heights, MA: Allyn and Bacon, 1998), 256 - 260.
2. Hopkins, 256 - 260.

TurningPoint User Guide 252
Results by Question
• Screenshots - Displays the screenshot with each question.
• Overall Standards - Displays the percentage of overall comprehension for each standard.
NoteInclude Screenshots must be checked in the Anywhere preferences.
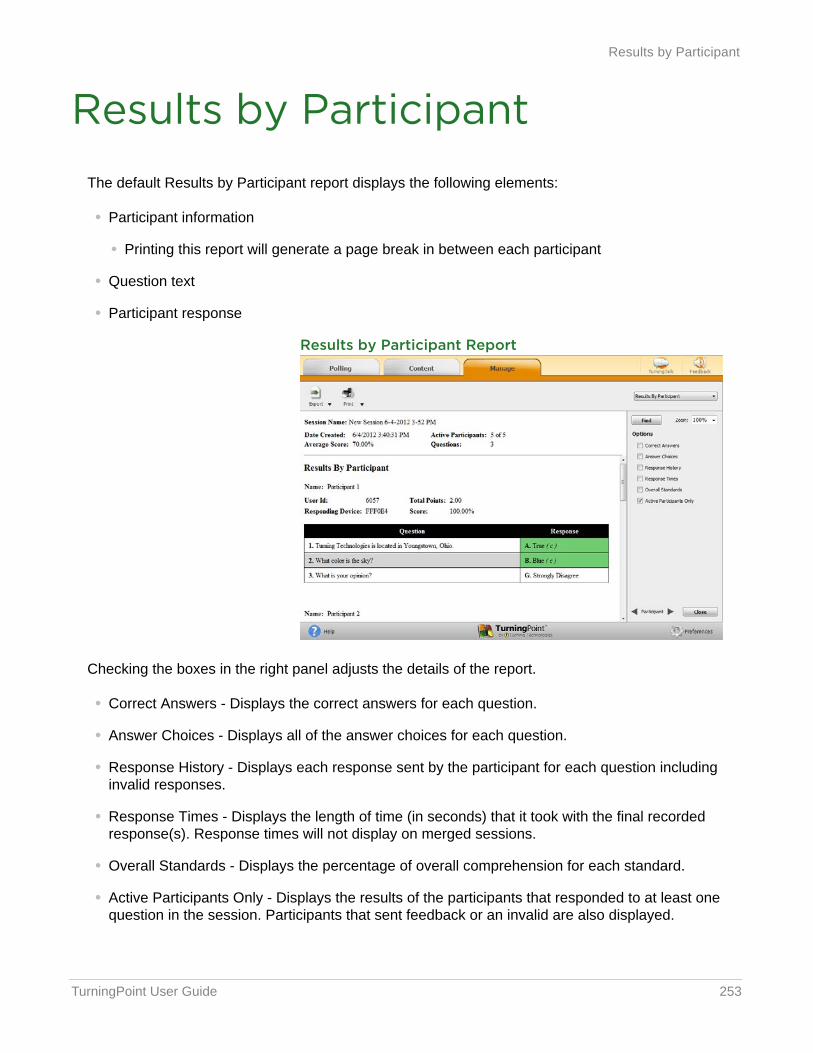
TurningPoint User Guide 253
Results by Participant
Results by ParticipantThe default Results by Participant report displays the following elements:
• Participant information
• Printing this report will generate a page break in between each participant
• Question text
• Participant response
Results by Participant Report
Checking the boxes in the right panel adjusts the details of the report.
• Correct Answers - Displays the correct answers for each question.
• Answer Choices - Displays all of the answer choices for each question.
• Response History - Displays each response sent by the participant for each question including invalid responses.
• Response Times - Displays the length of time (in seconds) that it took with the final recorded response(s). Response times will not display on merged sessions.
• Overall Standards - Displays the percentage of overall comprehension for each standard.
• Active Participants Only - Displays the results of the participants that responded to at least one question in the session. Participants that sent feedback or an invalid are also displayed.
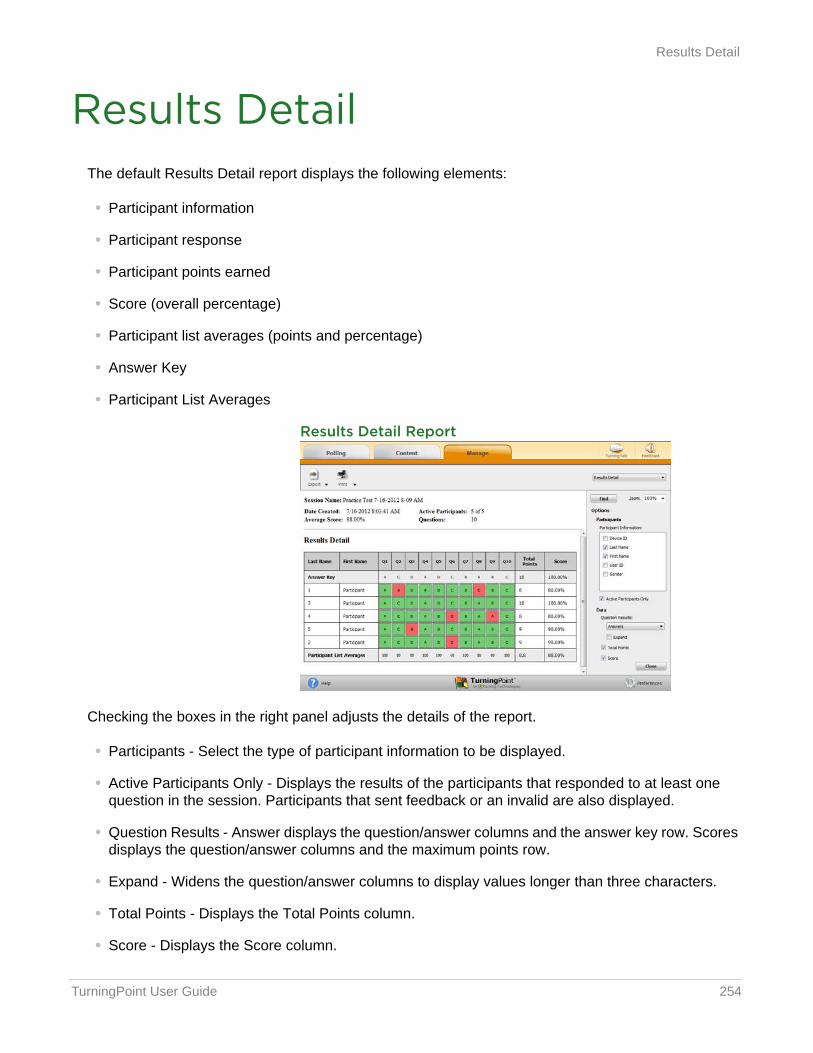
TurningPoint User Guide 254
Results Detail
Results DetailThe default Results Detail report displays the following elements:
• Participant information
• Participant response
• Participant points earned
• Score (overall percentage)
• Participant list averages (points and percentage)
• Answer Key
• Participant List Averages
Results Detail Report
Checking the boxes in the right panel adjusts the details of the report.
• Participants - Select the type of participant information to be displayed.
• Active Participants Only - Displays the results of the participants that responded to at least one question in the session. Participants that sent feedback or an invalid are also displayed.
• Question Results - Answer displays the question/answer columns and the answer key row. Scores displays the question/answer columns and the maximum points row.
• Expand - Widens the question/answer columns to display values longer than three characters.
• Total Points - Displays the Total Points column.
• Score - Displays the Score column.
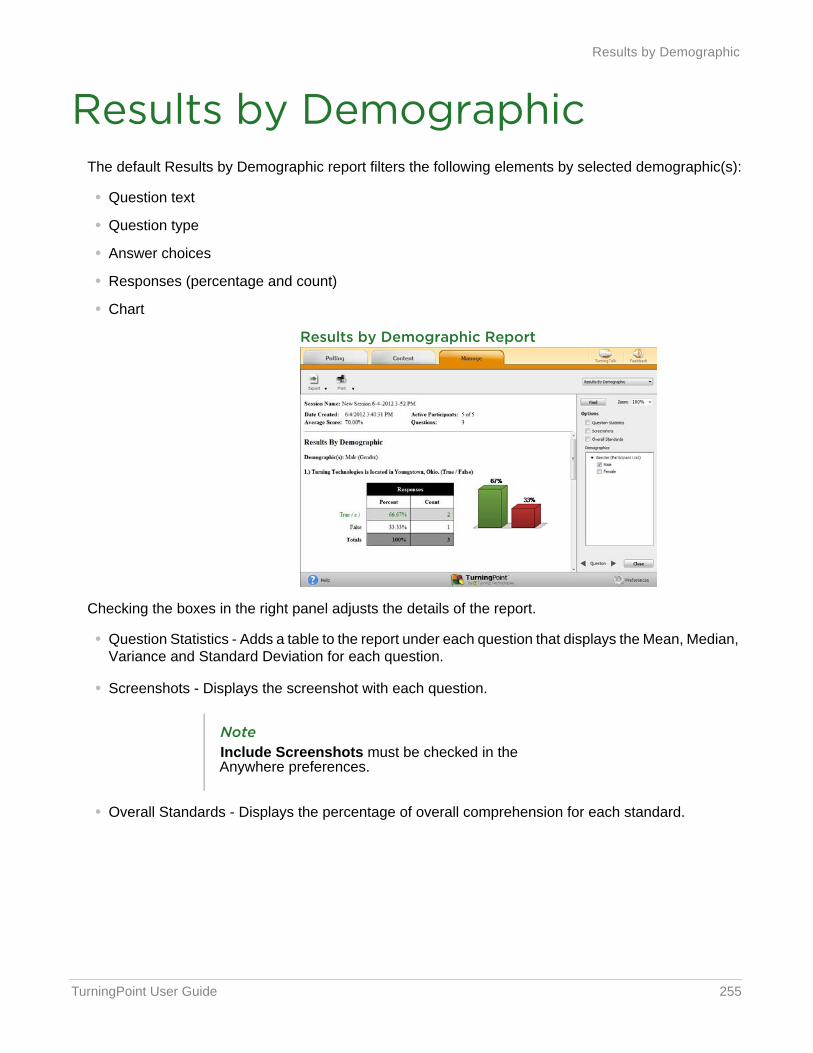
TurningPoint User Guide 255
Results by Demographic
Results by DemographicThe default Results by Demographic report filters the following elements by selected demographic(s):
• Question text
• Question type
• Answer choices
• Responses (percentage and count)
• Chart
Results by Demographic Report
Checking the boxes in the right panel adjusts the details of the report.
• Question Statistics - Adds a table to the report under each question that displays the Mean, Median, Variance and Standard Deviation for each question.
• Screenshots - Displays the screenshot with each question.
• Overall Standards - Displays the percentage of overall comprehension for each standard.
NoteInclude Screenshots must be checked in the Anywhere preferences.

TurningPoint User Guide 256
Results by Demographic
• Demographics - Check a box next to the demographic(s) to be displayed.
NoteAny demographic assigned from a slide or a participant list will be displayed. If a slide was selected to “save to participant list” and is present in the session, it will be displayed twice.
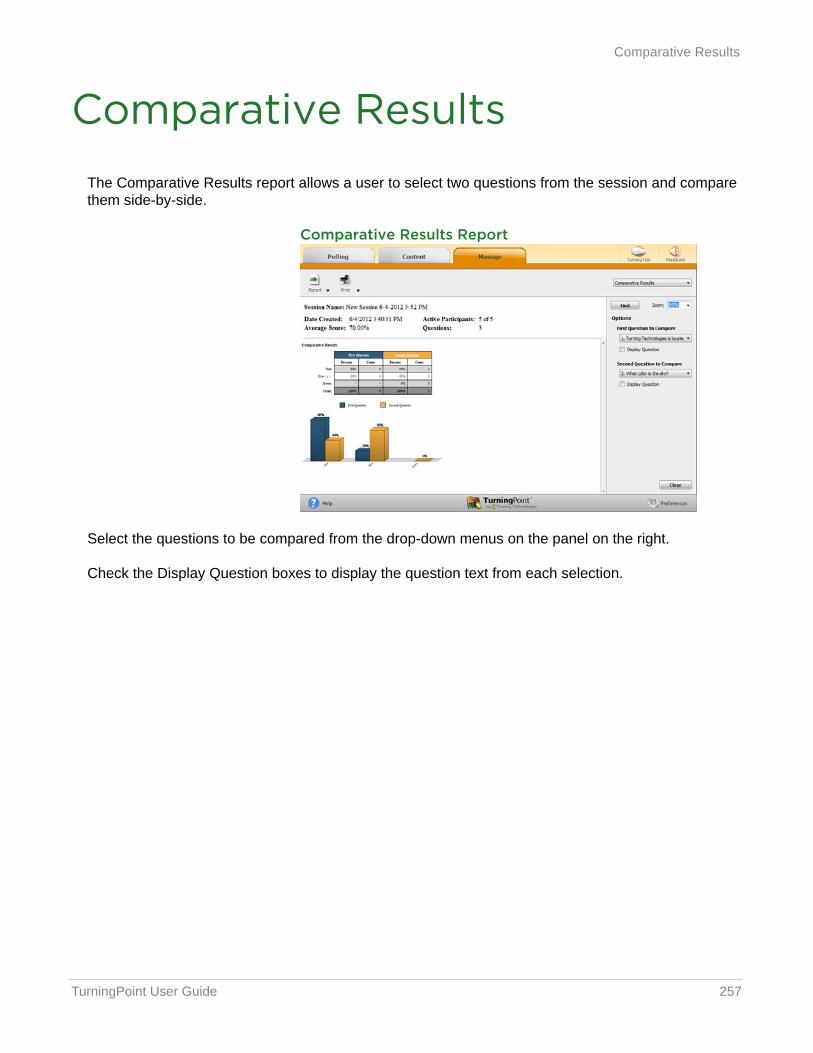
TurningPoint User Guide 257
Comparative Results
Comparative ResultsThe Comparative Results report allows a user to select two questions from the session and compare them side-by-side.
Comparative Results Report
Select the questions to be compared from the drop-down menus on the panel on the right.
Check the Display Question boxes to display the question text from each selection.
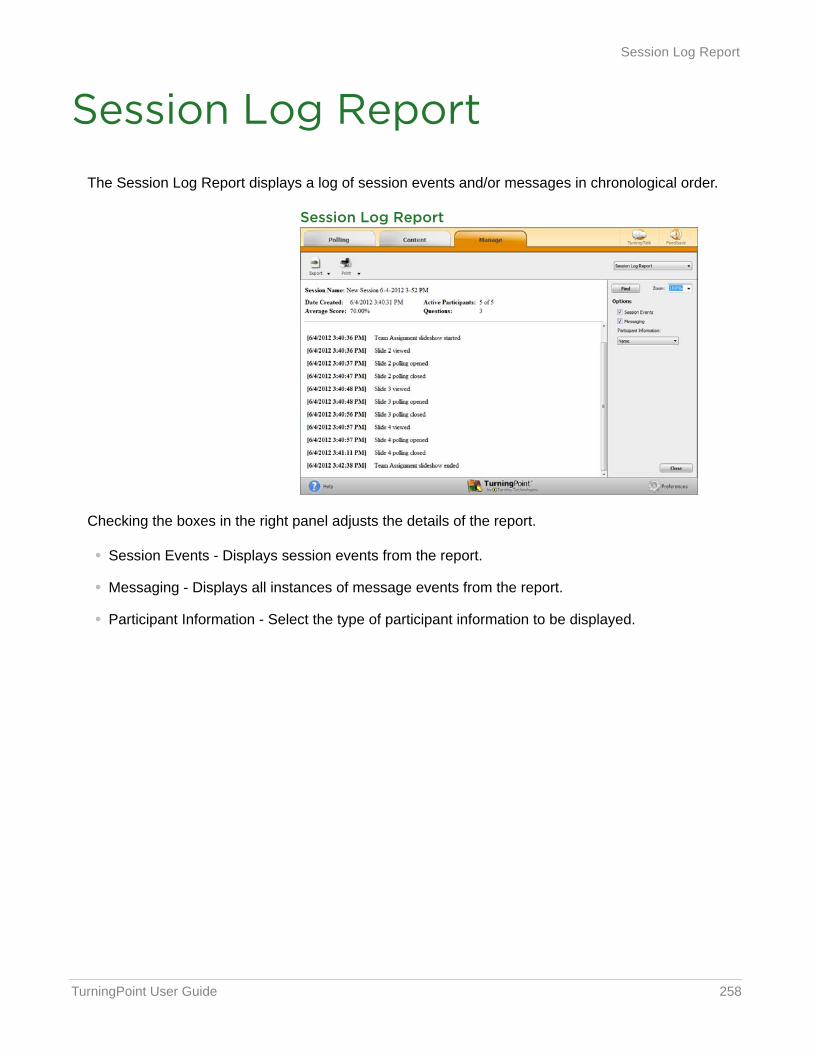
TurningPoint User Guide 258
Session Log Report
Session Log ReportThe Session Log Report displays a log of session events and/or messages in chronological order.
Session Log Report
Checking the boxes in the right panel adjusts the details of the report.
• Session Events - Displays session events from the report.
• Messaging - Displays all instances of message events from the report.
• Participant Information - Select the type of participant information to be displayed.

TurningPoint User Guide 259
10 Contact Us
If you have questions or concerns, additional resources are available online or by calling a Turning Technologies representative.
Online Assistance
Turning Technologies offers online assistance through its website: www.turningtechnologies.com.
Go to the Support tab on the website to find more information about using TurningPoint, such as support guides and manuals, online tutorials and product training.
TurningPoint User Guide 260
Customer Support
Turning Technologies’ Customer Service Department offers first class technical support second to none.
Technical Support is available Monday - Friday, 7:00 a.m. - 9:00 p.m. EST.
For your convenience we offer several methods of communication for technical support. From within the contiguous United States, you can reach Customer Service toll-free by calling 1.866.746.3015.
If calling from outside the United States please call +1.330.746.3015.
Customer Service may also be reached via e-mail at [email protected]. Please note, it may take up to two business days for a reply if contacted via e-mail.
Mailing Address:
Turning Technologies
255 West Federal Street
Youngstown, Ohio 44503

TurningPoint User Guide 261
11 Glossary
The following is a list of terms commonly used within TurningPoint.
AAcceptable Range
Applies to a numeric response question. If a specific value is not required for a correct answer, a participant’s response must fall between the minimum and maximum values set to be counted as correct.
Acceptable Value
Applies to a numeric response question. A participant’s response must be equal to the value to be counted as correct.
Active Participants
Participants who have responded to at least one question in the session, sent feedback and/or invalid responses are considered Active Participants.
TurningPoint User Guide 262
Advanced Scoring
An option for multiple choice and matching questions that allows point values to be set for each response. This preference is not valid when All or Nothing Scoring is checked.
All or Nothing Scoring
An option for multiple response and matching questions that, when checked, requires a participant to respond correctly to a question that has more than one correct answer to receive the full amount of points.
Allow Duplicates
Allow Duplicates permits participants to respond with the same answer choice more than once.
Animated Chart
An Animated Chart is a flash object that appears over the slide show in full screen.
Anonymous Questions
A question marked Anonymous does not track participant list information when polling.
Anonymous (Participant List)
An Anonymous Participant List allows the polling of responses without associating responses to response devices.
Answer Key
Located within the Question List Editor, this preference prints the selected test header information, question numbers and correct answers.
Anywhere Polling
The polling environment that allows polling independent of other applications. An interactive, floating toolbar displays polling with or without question lists on top of any application. For more information, see Chapter 6: Anywhere Polling.
Anywhere Polling Showbar
The Anywhere Polling showbar provides access to several features that may be used while polling in the Anywhere Polling environment. For more information, see About the Anywhere Polling Showbar in Chapter 6: Anywhere Polling on page 180.
Attendance Points
Attendance Points can be delegated to track attendance in Results Manager. These points are added to the overall session points earned for each participant. Attendance points can be hidden or shown by checking the option in the Results Manager Overview.
TurningPoint User Guide 263
Auto (Participant List)
A participant list option that allows the polling of responses, tracking of responses with Device ID and any user information that was sent from the response device.
BBenchmark
Benchmarks can be set for all sessions in the Results Manager Overview. A participant falling below the benchmark will display the percentage in red; a participant falling at or above the benchmark will display the percentage in green.
Bullet Format
Determines the type of answer bullets to be displayed. The available options include: alphabetic uppercase [A, B, C, D], alphabetic lowercase [a, b, c, d], numeric starting at 1 [1, 2, 3, 4] or numeric starting at 0 [0, 1, 2, 3].
CChart Window
The Chart Window displays participant results in the Anywhere Polling environment. The window can be moved, resized, expanded and collapsed. Depending on the current question type, some buttons may not be visible or usable.
Comparative Links
Comparative Links can be used to display the results from two separate questions on one chart. If a question is asked at the beginning of the presentation and then again towards the end, a comparative chart will display the results from each question. For more information, see Comparative Links in Chapter 5: PowerPoint Polling on page 149.
Comparative Results
The Comparative Results report allows a user to select two questions from the session and compare them side-by-side. For more information, see Comparative Results in Chapter 9: Reports on page 257.
Compete
The Compete button on the Anywhere Polling chart window and the PowerPoint Polling toolbar allows a user to insert a Team Leaderboard, Team MVP Leaderboard, Racing Leaderboard, Participant Leaderboard and Fastest Responders slide.
TurningPoint User Guide 264
Conditional Branching
Conditional Branching allows a user to control the order of slides in their PowerPoint Polling presentation based on participant responses. For more information, see Conditional Branching in Chapter 5: PowerPoint Polling on page 151.
Content
Content consists of question lists and PowerPoint presentations that can be created, edited and organized into folders under the Content tab. For more information, see Chapter 2: Content.
Continue Prior Session
A previously run session can be continued, allowing for new response data to be added to the existing data.
Convert to Picture
In the PowerPoint Polling environment, text-based answer options can be converted to pictures when visual aids would be beneficial to the audience. For more information, see Convert to Picture in Chapter 5: PowerPoint Polling on page 156.
Correct Answer Indicator
A Correct Answer Indicator allows the participants to see the correct answer(s) after polling is closed.
Correct Point Value
The Correct Point Value indicates the number of points awarded to a participant for responding to a question correctly.
DDemographic
Demographics group participants by a specific criteria, i.e. male or female. Demographics can be assigned in a participant list or from a polling question.
Demographic Comparison
In the PowerPoint Polling environment, the Demographic Comparison slide displays the responses based on the specified demographic.
Demographic Grouping
The Demographic Grouping is the overall categorization of a group of demographics. For example, the demographic grouping “gender” groups the demographics “male” and “female.”
TurningPoint User Guide 265
Device ID
A Device ID is the unique six to eight-digit hexadecimal character set that distinguishes every response device. On ResponseCards, the Device ID is found on the back below the barcode. In ResponseWare, the Device ID is displayed when a participant creates an account or logs into ResponseWare.
Duplicate (Question List and Participant List)
An option in the Question List Editor and the Participant List Editor that duplicates the current question list or participant list as a new list to facilitate the ease of creating multiple lists with the same data or format.
EEnforce Capitalization
An option that requires participants to respond to short answer questions with proper punctuation.
Essay
A question type that allows for an open ended response. TurningPoint does not grade essay responses. Only XR, NXT and ResponseWare devices are able to respond to essay questions.
Exclude from Grading
In the Session Editor, questions that are excluded from grading will not figure into the overall session percentages, points possible or points earned if this option is selected. If a session is excluded from grading, it cannot be included again.
Exclude Session
In Results Manager, sessions that are excluded from grading will not figure into the overall percentages, points possible or points earned if this option is selected.
Expected File Location
This is the location that TurningPoint expects to find the selected session. If the session is not found in that location, a “locate” button will appear to allow for the redirection to the session’s location.
Export Overview
Export Overview is an option in Results Manager that allows the export of the Participant List Overview to a CSV.
TurningPoint User Guide 266
Export Participant
Export Participant is an option in Results Manager that allows the export of multi-session information for each participant to a CSV or PDF.
Export Session
Export Session is an option in Results Manager that allows the export of the selected session’s column results to a CSV in a predefined format.
Extract Session
A session can be selected and its data extracted from that file. Extract options include the PowerPoint presentation, screenshots and the session’s question list.
FFastest Responders Slide
The Fastest Responders slide displays the individual participants who responded correctly and fastest to the most recent question. This feature requires a correct response or point value.
GGroup Options
Group Options denotes the individual demographic designation for assigning groups, i.e. “Male” and “Female” are group options assigned to the demographic grouping “Gender.”
IIncorrect Point Value
Incorrect Point Value denotes the number of points awarded to a participant for responding to a question incorrectly.
Integration
Integrations allow for the sharing of data between the Turning Technologies Web Registration Tool or Learning Management Systems (LMS) and TurningPoint. For more information, see Integrations in Chapter 8: Sessions on page 242.
TurningPoint User Guide 267
IR
IR is the abbreviation for Infrared. This refers to all Turning Technologies IR receivers and response devices.
KKeyword
When set on a short answer question, a participant’s response must equal the keyword to be counted as correct. Multiple keywords can be set.
LLive Polling
PowerPoint Polling offers the option to poll the presentation with live participant responses or simulated computer responses. By default, Live Polling is selected.
MMatching
A question type that allows for the matching of two columns of information. Responding to a matching question operates in the same manner of all other multiple response questions. All response devices are able to respond to a matching question, however a matching question is only supported in the Anywhere and Self-paced environments.
Merge Session
Multiple session files can be merged into a single session file. Sessions may be merged by questions or participants. For more information, see Merging Sessions in Chapter 8: Sessions on page 206.
Merged (Session Manager)
After the merge, a new category is created in the left panel named “Merged.” Merged sessions that are not added to a participant list are found in this category. Once in this category, sessions cannot be moved to a participant list.
TurningPoint User Guide 268
Messaging
Participants can send feedback/messages to the presenter by using the Note to Leader function on the ResponseCard NXT or through the ResponseWare application during a session. For more information, see Messaging in Chapter 5: PowerPoint Polling on page 171, Messaging in Chapter 6: Anywhere Polling on page 189 or Viewing the Live Results Monitor in Chapter 7: Self-Paced Polling on page 197.
Moment to Moment
In PowerPoint Polling, the Moment to Moment slide can be used to have participants rate something on a scale of 1 to 5 over a period of time. The slide contains a question text box and a chart that shows the average response at each polling interval.
Multiple Choice
A question type that allows for several answers from which the correct one(s) can be selected by the participant.
Multiple Responses
Multiple Responses allow participants to send more than one response to a multiple choice question.
NNo Value
When an answer choice is neither correct nor incorrect, the answer is considered to have no value.
Numeric Response
A Numeric Response question requires the participants to respond with a numeric value. Only participants using a ResponseCard XR, ResponseCard NXT or ResponseWare may respond to a numeric response question.
NXT
A ResponseCard that allows for all of the functionality of the IR and RF ResponseCards, but also offers numeric response, short answer and essay responses, as well as messaging and Self-Paced Polling capability.
TurningPoint User Guide 269
OOverview
In Results Manager, the Overview displays the details and options for the participant list and sessions. This can be viewed by clicking the Overview button or any of the shaded columns.
PParticipant
Any individual who may respond to questions during a session.
Participant Leaderboard
A Participant Leaderboard displays the top individual participants ranked by their total points.
Participant List
A list of participants that are expected to be part of a session. Information about participants may be entered for precise tracking and reporting.
Participant List Overview
This information is displayed when a participant list is selected from the Manage tab. Information includes details about the list as well as a preview of the contents.
Participant Monitor
The Participant Monitor displays question information, participant information and participant question details. For more information, see Using the Participant Monitor in Chapter 5: PowerPoint Polling on page 170.
Participant View
In Results Manager, the Participant View displays the view and options of an individual participant.
Participant’s Session View
In Results Manager, the participant’s session view displays the view and options of an individual participant’s session entry.
Performance Points
Performance Points are assigned to a participant in Results Manager for performance in a specific session. For more information, see Setting Session Performance Points on page 222.
TurningPoint User Guide 270
Performance Scale
A scale set to display a text or numeric value equal to how the participant has performed across all sessions.
PowerPoint Polling
The PowerPoint Polling environment allows polling as an integrated part of a PowerPoint presentation. Polling slides are created from a that is embedded into PowerPoint. For more information, see Chapter 5: PowerPoint Polling.
PowerPoint Showbar
The PowerPoint showbar appears automatically when a polling slide is displayed during the Slide Show. The showbar is a toolbar that provides buttons for polling, monitoring, viewing responses and other polling tools during the slide show. For more information, see The PowerPoint Polling Showbar in Chapter 5: PowerPoint Polling on page 168.
Preferences
TurningPoint features various settings that control the behavior of the software and each polling environment. For more information, see Chapter 4: Preferences.
Presentation Window
This window displays the question and answer text of the currently polled question in the Anywhere environment.
PresenterCard
An RF (Radio Frequency) device that allows the control of live polling presentations via TurningPoint.
PresenterWare
PresenterWare is a separate mobile device application that allows the control of live polling presentations via TurningPoint. PresenterWare is available for Android and iOS devices.
Priority Ranking
A question type that allows participants to vote multiple times, ranking items by response weights. For more information, see Priority Ranking in Chapter 2: Content on page 45.
Prompt
An object that can be added to a PowerPoint Polling slide which alerts the participants that the current slide is a polling slide.
TurningPoint User Guide 271
Proxy Server
In computer networks, a proxy server is a server (a computer system or an application program) that acts as an intermediary for requests from clients seeking resources from other servers.
QQuestion List
A Question List is a list of questions created from the Content tab. A question list can be used to poll questions in Anywhere Polling and Self-Paced Polling, or to create slides in PowerPoint Polling.
Question List Overview
The Question List Overview displays details about the list as well as a preview of the contents.
RRacing Leaderboard
In the PowerPoint Polling environment, the Racing Leaderboard slide presents a visual representation of the team scores. An image to represent the teams is selected in the Slide Preferences Panel. When the slide is advanced, the images move in relation to the number of points earned.
Real-Time Registration Tool
The Real-Time Registration Tool, found in PowerPoint Polling and Anywhere Polling, provides a fast and simple way to utilize a participant list for smaller audiences (ideally less than 50 participants). It allows participants to respond with their device, temporarily assigning the device to their name for the duration of the session. Assignments can be saved permanently in Results Manager. For more information, see Using the Real-Time Registration Tool in Chapter 5: PowerPoint Polling on page 165 or Using the Real-Time Registration Tool in Chapter 6: Anywhere Polling on page 187.
Receiver
A USB device that receives RF (Radio Frequency) or IR (Infrared) signals from response devices and communicates them to TurningPoint. A receiver is required for use with all ResponseCards and PresenterCards.
Refresh
From the Content tab, the Refresh option allows the user to update the display of content if changes to the content folders have been made outside of TurningPoint on the local computer. For more information, see Refreshing Folder Content in Chapter 2: Content on page 31.
TurningPoint User Guide 272
Removed Participants
Participants with session data associated to them but have been removed from a participant list are considered removed participants.
Reports
There are six types of session reports (Results by Question, Results by Participant, Results Detail, Results by Demographic, Comparative Results and Session Log Report). Each report can be customized by selecting the data options on the right side of the reports window. For more information, see Chapter 9: Reports.
Reserved Session ID
A unique ResponseWare Session ID created by the presenter. The reserved Session ID must be set from the presenter’s account at www.rwpoll.com.
Reset Slides
A PowerPoint Polling feature that allows selected slides to be reset while retaining the session data.
Reset Session
A feature that resets the charts to zero percent and clears all session data.
Response Grid
In the PowerPoint and Anywhere Polling environments, a Response Grid displays which participants have or have not responded to a question.
Response History
A Results by Participant report option that displays the last 10 responses from a participant to any given question.
Response Times
In the Results by Participant report, response times display the number of seconds it took each participant to respond to a question with their final valid response.
Response Weights
For priority ranking questions, the response weight designates the number of votes each participant’s first, second, third, etc. responses may receive. For example, a response weight of 10 for a first choice (response) equals 10 votes for every participant’s first choice (response).
TurningPoint User Guide 273
ResponseWare
A ResponseCard alternative that operates from a web-enabled device. ResponseWare offers the same functionality as IR and RF ResponseCards, but also offers numeric response, short answer and essay responses as well as messaging between the participant and presenter.
Results Manager
A compilation of all sessions associated to a single participant list. Cumulative scores from multiple sessions and other tools are also available within Results Manager. For more information, see Results Manager on page 213.
RF
RF is the abbreviation for Radio Frequency. This refers to all Turning Technologies RF receivers and response devices.
SSave Session
An option in each polling environment that is required if saved response data is desired for reporting or exporting.
Screenshot
An image snapshot of the computer screen contents at the moment polling is closed in Anywhere Polling.
Self-Paced Polling
The polling environment that allows participants to proceed through a polling session at their own pace. Question lists/tests are usually printed and distributed as participants answer questions on their XR or NXT ResponseCards.
Session
A Session is the collection of response data from a polling session. Saving the data will result in a session file.
Session Events
Events that occur and are logged during a session, such as the beginning and end times of a poll and messages received or sent, are referred to as session events. These items can be viewed from the Session Log report.
TurningPoint User Guide 274
Session ID
A code that is generated in ResponseWare and used by all participants in order to gain access to the session.
Short Answer
A question type that requires participants to respond with a short text answer. Only participants using a ResponseCard XR, NXT or ResponseWare may respond to a short answer question.
Simulated Polling
PowerPoint Polling offers the option to poll the presentation with simulated computer responses. By selecting Simulated Polling, TurningPoint automatically populates the charts with response data.
Simulated (Session Manager)
Sessions run in PowerPoint Polling with Simulated Polling will be grouped together under the same heading for reporting and session editing.
Slide Preferences Panel
The Slide Preferences Panel is a movable, floating panel in the PowerPoint Polling environment that is displayed when a TurningPoint slide is selected. It offers the ability to customize the slide options.
Standards
Set learning benchmarks that can be attached to individual questions or slides. Standards achievement levels can be reviewed in Reports. For more information on Standards, see Standards on page 60.
• Custom Standards - Any standard created to suit specific user needs. Custom Standards can be created manually or imported from another location.
• Downloaded Standards - These standards are available via the Turning Technologies software, QuestionPoint.
TTeam Leaderboard
The Team Leaderboard displays the top teams ranked by their total points. The team’s points are the average of the team’s participants’ points.
TurningPoint User Guide 275
Team MVP
In the PowerPoint Polling environment, the Team MVP Leaderboard displays the top scoring participant for each team.
Tools
The menu of additional features available for presentation enhancement in PowerPoint Polling is referred to as Tools. These features include: Convert to Picture, Ranking Wizard and Comparative Links.
Total Points Possible
In ResultsManager, this is the column that displays the total number of points (performance plus attendance) possible for each participant across all sessions.
True/False
A question type that requires a true or false response.
TurningTalk
Turning Talk is Turning Technologies’ user community available at turningtalk.turningtechnologies.com. Turning Talk contains shared content, forums and QuestionPoint.
UUnassigned Devices
In Results Manager, any device that is not permanently assigned to a participant can be found below the participant list as an Unassigned Device. These devices may be associated to a participant at any time.
Unassigned Session View
In Results Manager, an unassigned device may also have unassigned sessions. Any session individually selected may then be assigned to a participant on a per session basis.
Use in Competition
This check box is found in the Demographic Options section of the Question List Editor. Use in Competition allows for demographics to also be used as teams in competitions.
TurningPoint User Guide 276
User ID
A User ID is a unique identifier for a participant. This is not a required participant list field, however when present in a participant list and sent from a device, it can be used to match an unassigned device to the appropriate participant for that session.
VVersion
Question lists are able to have multiple versions created, allowing different test versions to be given simultaneously in the Self-Paced Polling environment.
Voting Weight
A voting weight allows the adjustment of a participant’s vote to equal the same weight as that of a specified number of votes. For example, a voting weight of “4” would be equal to four votes.
XXR
A ResponseCard that allows for all of the functionality of the IR and RF ResponseCards, but also offers numeric response, short answer and essay responses, as well as messaging and Self-Paced Polling capability. The XR ResponseCard is an older generation of the NXT ResponseCard.