università degli studi di napoli federico ii - unina.itamato_valentina_23.pdf · università degli...
TRANSCRIPT
Università degli Studi di Napoli Federico II Dipartimento di Biologia e Patologia Cellulare e
Molecolare “L. Califano”
Doctorate School in Molecular Medicine
PhD Program in
Genetics and Molecular Medicine Coordinator: Prof. Lucio Nitsch
XXIII Cycle
Alterations of microRNAs expression profile
induced by oncogenic Ras
Supervisor: PhD student: Ch.mo Prof. Roberto Di Lauro Dr. Valentina D’Amato Co-Supervisor: Dott.ssa Gabriella De Vita

2
Ph.D.inGeneticsandMolecularMedicineMembers
Prof.StefanoBonatti
DipartimentodiBiochimicaeBiotecnologieMediche,UniversitàdiNapoli
Prof.CarmeloBrunoBruni
DipartimentodiBiologiaePatologiaCellulareeMolecolare“L.Califano”UniversitàdiNapoli
Prof.RobertoDiLauro
DipartimentodiBiologiaePatologiaCellulareeMolecolare“L.Califano”UniversitàdiNapoli
Prof.PaolaDiNatale
DipartimentodiBiochimicaeBiotecnologieMediche,UniversitàdiNapoli
Prof.PierpaoloDiNocera
DipartimentodiBiologiaePatologiaCellulareeMolecolare“L.Califano”UniversitàdiNapoli
Prof.MariaFuria
DipartimentodiGenetica,BiologiaStrutturaleeFunzionale,UniversitàdiNapoli
Prof.GirolamaLaMantia
DipartimentodiGenetica,BiologiaStrutturaleeFunzionale,UniversitàdiNapoli
Prof.LuigiLania
DipartimentodiGenetica,BiologiaStrutturaleeFunzionale,UniversitàdiNapoli
Prof.LucioNitschDipartimentodiBiologiaePatologiaCellulareeMolecolare“L.Califano”UniversitàdiNapoli

3
Prof.LucioPastoreDipartimentodiBiochimicaeBiotecnologie
Mediche,UniversitàdiNapoli
Prof.JohnPulitzerFinaliDipartimentodiBiologiaStrutturaleeFunzionale,
UniversitàdiNapoli
Prof.FabioRossanoDipartimentodiBiologiaePatologiaCellulareeMolecolare“L.Califano”UniversitàdiNapoli
Prof.TommasoRusso
DipartimentodiBiochimicaeBiotecnologieMediche,UniversitàdiNapoli
Prof.LuciaSacchetti
DipartimentodiBiochimicaeBiotecnologieMediche,UniversitàdiNapoli
Prof.FrancescoSalvatore
DipartimentodiBiochimicaeBiotecnologieMediche,UniversitàdiNapoli
Prof.PaolaSalvatore
DipartimentodiBiologiaePatologiaCellulareeMolecolare“L.Califano”UniversitàdiNapoli
Dr.MariaStellaZanniniPrimoRicercatoreCNR
DipartimentodiBiologiaePatologiaCellulareeMolecolare“L.Califano”UniversitàdiNapoli
Prof.ChiaraZurzolo
DipartimentodiBiologiaePatologiaCellulareeMolecolare“L.Califano”UniversitàdiNapoli
4
INDEX Abbreviations 5Abstract 61. Introduction 8
1.1 MicroRNAs 81.2 Genomic localization of microRNAs 81.3 MicroRNA biogenesis 91.4 microRNA function 121.5 microRNAs: tumour suppressors and oncogenes 141.6 Thyroid cancer 151.7 miRNA in Thyroid Cancer 161.8 Role of Ras oncogenes 191.9 Ras genes 201.10 Ras proteins signal transduction pathways 221.11 The FRTL-5 thyroid cell line 241.12 Transformation of FRTL-5 cells by Ras oncogene 24
2. Aim of the Study 263. Materials and methods 27
3.1 Cell culture. 273.2 Vectors. 273.3 Transfections. 283.4 Chromatin Immuno-Precipitation (ChIP) 29
3.4.1 Crosslinked chromatin preparation. 293.4.2 Transcription rate measurement. 29
3.5 RNA extraction and Real-Time PCR. 303.6 Protein studies. 323.7 Immunoblot. 323.8 Proliferation analysis. 323.9 Motility assay. 33
4. Results and Discussion 344.1 Screening of microRNA regulated by Ras. 354.2 Generation of miR135a over expressing clones. 384.3 Functional studies of miR135a. 39
4.3. 1. miR135a and Proliferation 404.3. 2. miR135a and Differentiation. 424.3. 3. miR135a and Cell Motility. 44
4.4 Regulation of miR-21 is cell-type specific. 474.5 miR21 induction by Ras in FRTL-5 is mediated by transcriptional regulation. 484.6 miR21 promoter is responsive to oncogenic Ras expression. 504.7 Identification of miR21 regulatory regions responsive to Ras. 51
5.Conclusion 54

5
6. Bibliography 557. Acknowledgement 64
Abbreviations
The abbreviations used are: microRNA, miRNA; Papillary carcinoma, PC; Follicular carcinoma, FC; poorly differentiated carcinoma, PDC; anaplastic carcinoma, AC; Medullary carcinoma, MC; Follicular thyroid cell, TFC; Follicular Rat thyroid epithelial cell line, FRTL-5; Oncogenic human h-ras (G12V) fused to the ERTM Ligand binding domain, ER-RasV12; FRTL5 derived stable cell line expressing ER-RasV12, Cl11; FRTL5 derived stable cell lines expressing oncogenic human h-ras (G12V), RasV12 clones (V27, V29 or V39); Tamoxifen, 4OHT; Thyroperoxidase, TPO; Sodium-Iodide symporter, NIS; TSH receptor, TSHr; thyroglobulin, Tg; V29 derived stable cell lines expressing miR135a, miR135a clones.
6
Abstract
Literature emphasizes the key role of miRNAs in cancer development. Moreover it has been demonstrated that oncogenes and tumorsuppressors can act also by regulating the expression of specific miRNAs. Previous results published by Landgraf et al., using the FRTL-5 ER-H-RasV12 inducible system highlighted that Ras is able to induce aberrant expression of microRNAs during the transformation of thyroid epithelial cells. Taking advantage of the inducible system FRTL-5 ER-H-RasV12 we decided to study the miRNAs involved in Ras-induced transformation. The aim of my project was to identify Ras-regulated miRNAs and study their functional or transcriptional role in transformation of thyroid epithelial cells. We decided first to validate the Landgraf’s libraries data by Real-Time PCR, later we selected microRNAs of interest to study their functional role in Ras-induced transformation. We measured the level of expression of miR15b, miR16, miR27a, miR27b, miR29b, miR99b, miR135a, miR135b, miR324-5p in inducible systems FRTL-5 ER-Ras clone (Cl11) treated with 4OHT for 24h, 48h, 72h, 96h and 7days, in FRTL-5 parental cell line and in FRTL-5 clones constitutively expressing human H-RasV12. From the screening by Real-Time PCR we identified two microRNAs particularly regulated by oncogenic Ras: miR135a resulted down-regulated in chronically transformed cells by Ras oncogene meanwhile miR21 resulted up-regulated by Ras oncogene in the inducible system. We over expressed miR135a in the chronically transformed FRTL-5 H-RasV12
clone V29 to test the possibility that miR135a rescue could interfere with at least one of the phenotypes induced by oncogenic Ras. We proceeded to analyze proliferation, differentiation and cell motility of FRTL-5 RasV12 miR135a cells. We observed a little reduction of proliferation and migration in miR135a clones compared to FRTL-5 RasV12. It is known that Ras is able to promote miR21 expression in an epithelial system we asked if this regulation was cell-type specific. The Real-Time PCR results highlights that even though the two inducible systems analyzed (FRTL-5 ER-Ras and NIH ER-Ras) have a different basal level of miR21, in NIH ER-Ras cells 4OHT treatment do not lead to a significant increase of miR21, suggesting that Ras-induced miR21 up-regulation is cell-type specific. Once established the effects of oncogenic Ras on mature miR21 expression the following step was to study the mechanism through which this regulation takes place. Our data obtained by Real-Time PCR and chromatin immuno-precipitation (ChIP) suggests that miR21 induction by Ras in FRTL-5 cells is a transcriptional phenomenon. By luciferase assay we analyzed the miR21 promoter responsive to Ras oncogene and we verified if also its activation was cell-type specific. To this purpose we used FRTL-5, NIH3T3 and Rat2 cell

7
lines. The data obtained suggests that even though oncogenic Ras is able to lightly regulate the activity of miR21 promoter in fibroblasts, the activation displayed in FRTL-5 is much stronger and significant. The final step was the identification of potential regulatory regions, aside from the promoter already identified, responsive to oncogenic Ras.

8
1. Introduction
1.1 MicroRNAs MicroRNAs (miRNAs) are endogenous non-coding RNAs of about 22 nucleotides, regulating genes in animals and plants by pairing to the 3’UTR regions of messenger RNAs (Zeng et al. 2002) of target genes and specifying mRNA cleavage or repression of protein synthesis. There is increasing evidence that miRNAs have an important regulatory role in a broad range of biological processes, including cellular differentiation, proliferation, apoptosis and cancer development (Bartel 2004). After the initial genetic discovery in nematodes (Lee et al. 1993), it was soon confirmed that all investigated higher eukaryotes, including plants and mammals, contain miRNA genes (Ambros et al. 2003). miRNA genes represent only a small part of the genome (3%), but they regulate approximately from 20% to 30% of all human genes and there is an average of 200 predicted targets per miRNA (Carthew 2006). The microRNAs discovery has been an exciting breakthrough in Biological Sciences of the past decade, culminating in Nobel Prize in Physiology or Medicine awarded to Andrew Fire and Craig Mello. Building on previous work mainly in plants (Lindbo et al. 1993), Fire discovered that exogenous double-stranded RNA can be used to specifically interfere with gene function. This phenomenon was called RNA interference (RNAi) (Fire et al. 1998). They also speculated that organisms might use double-stranded RNA naturally as a way of silencing genes. It was then shown that RNA interference was mediated by 22 nucleotide single-stranded RNAs termed small interfering RNAs (siRNAs) derived from the longer double-stranded RNA precursors (Zamore et al. 2000). Computational predictions of miRNA targets suggest that up to 30% of human protein coding genes may be regulated by miRNAs (Rajewsky 2006). This makes miRNAs one of the most abundant classes of regulatory genes in humans. MicroRNAs are now perceived as a key layer of post-transcriptional control within the networks of gene regulation.
1.2 Genomic localization of microRNAs Micro-RNAs are initially transcribed as precursor molecules in the nucleus, where many are organized in genomic cluster, while others exist as individual genes. Besides miRNAs that are non linked to any other transcription unit, it has been reported that miRNA genes are located in exons or introns of non-
9
coding genes (Rodriguez et al. 2004), as well as protein-coding genes (Smalheiser 2003). Expression studies on miRNAs and host mRNAs revealed that miRNAs are frequently co-expressed with their host genes (Baskerville and Bartel 2005). About a quarter of the human miRNAs genes are in the introns of pre-mRNAs. These are preferentially in the same orientation as the predicted mRNAs, suggesting that most of these miRNAs are not transcribed from their own promoters but are instead processed from introns. This arrangement provides a convenient mechanism for the coordinated expression of a miRNA and a protein (Lagos-Quintana et al. 2003). Some mammalian miRNA genes are located in repetitive genomic regions as well, and it has been suggested that repetitive elements such as transposons may be the driving force that creates new miRNAs during mammalian evolution (Smalheiser and Torvik 2005). MicroRNAs can be grouped into families on the basis of sequence homology, which is found primarily at the 5′ end of the mature miRNAs, but whether members of the same miRNA family control similar biological events remains to be seen. Many miRNAs are evolutionarily conserved from worms to humans, which implies that these miRNAs direct essential processes both during development and in the adult body (Esquela-Kerscher and Slack 2006).
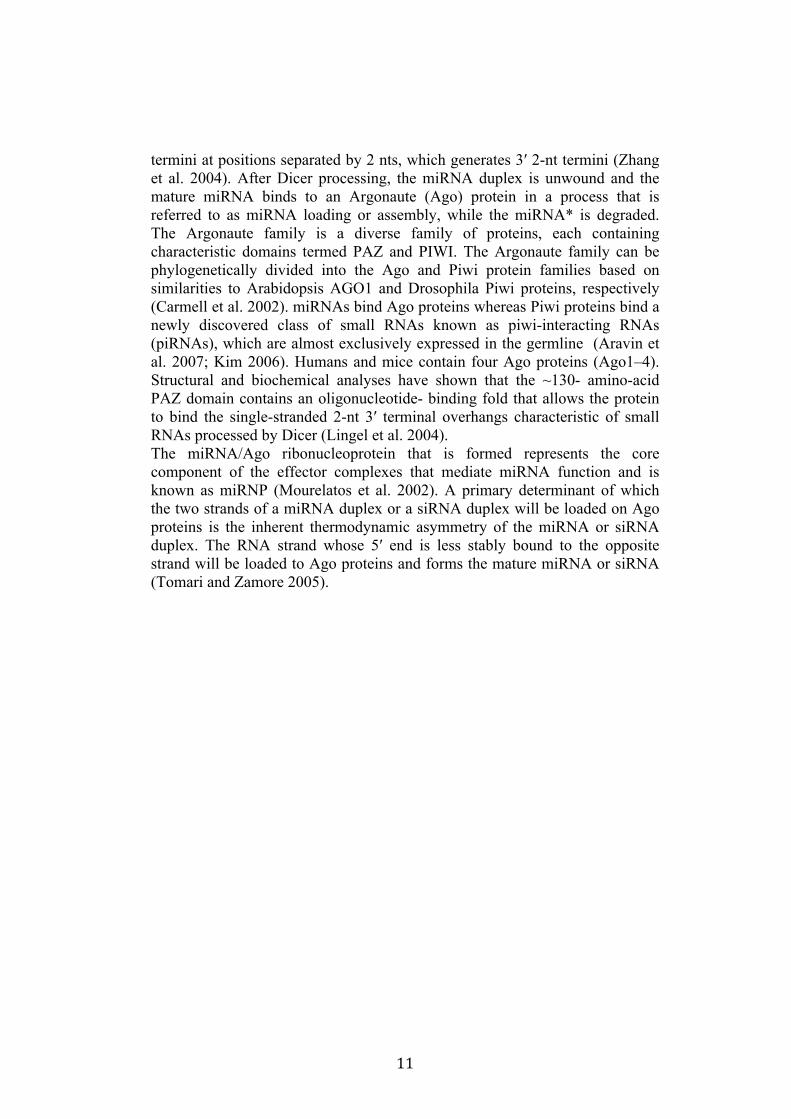
1.3 MicroRNA biogenesis The maturation of microRNA is a multi-step process that begins in the nucleus and ends in the cytoplasm (Novina and Sharp 2004) (Figure 1). Analyses have shown that human primary miRNA transcripts (pri-miRNAs) contain cap structures as well as poly (A) tails which are the unique properties of class II gene transcripts. These data indicate that pol II is the main RNA polymerase for miRNA gene transcription (Lee et al. 2004). Animal miRNAs are initially transcribed as part of a long RNA precursor, defined as “primary miRNA” (pri-miRNA). Within the pri-miRNA, the ~22-nt mature miRNA forms part of one arm of a ~80-nt imperfect stem-loop sequence (Cullen 2004). The first step is the nuclear cleavage of the pri-miRNA, which liberates a ~60-70nt stem loop intermediate, known as pre-miRNA (Zeng 2006). This processing is performed by Drosha, an RNase III-type endonuclease that contains two RNase III domains and a dsRNA binding domain in the C-terminal half, a proline-rich domain and an argininerich (R-rich) domain in the N-terminal half of the protein. It cleaves both strands of stem at sites near the base of the primary stem loop, leaving a 5’ phosphate and a 2-nt 3’ overhang (Basyuk et al. 2003). It has been demonstrated that for a pri-miRNA to be efficiently processed by Drosha the targeted hairpin must consist of a large terminal loop of ≥10 nt and a stem region somewhat longer than the

10
one present in the final pre-miRNA (Zeng and Cullen 2005). The class 3 RNase III Drosha forms a complex (microprocessor) with a double-stranded RNA-binding protein, termed DGCR8 in humans and Pasha in flies and worms (Han et al. 2004). Cleavage of a pri-miRNA by microprocessor begins with DGCR8 recognizing the ssRNA-dsRNA junction typical of a pri-miRNA. Then, Drosha is brought close to its substrate through interaction with DGCR8 and cleaves the stem of a pri-miRNA ~11 nt away from the two single stranded segments (Han et al. 2006). Although microprocessor is already sufficient for conversion of a pri-miRNA into a pre-miRNAs in vitro, cleavage of pri-miRNA in vivo does not depend on Drosha and DGCR8 only, but also on other accessory proteins, such as the RNA binding protein hnRNP A1 and the p68 and p72 RNA helicases. A subclass of pre-miRNAs, pre-miRNA/introns (mirtrons), have recently been shown to depend on the RNA splicing machinery for their biogenesis in Drosophila, Caenorhabditis elegans and mammals (Berezikov et al. 2007). Mirtrons are derived from certain debranched introns that fold into hairpin structures with 5′ monophosphates and 3′ 2-nt hydroxyl overhangs, which mimic the structural hallmarks of pre-miRNAs and enter the miRNA processing pathway (Okamura et al. 2007; Ruby et al. 2007). The discovery of mirtrons suggests that any RNA, with a size comparable to a pre-miRNA and all the structural features of a pre-miRNA, can be utilized by the miRNA processing machinery, and potentially give rise to a functional miRNA. After initial nuclear processing, the pre-miRNA is exported to the cytoplasm by the export receptor Exportin-5 (Exp-5). This step is a Ran-dependent and requires the hydrolysis of GTP (Yi et al. 2003). The interaction of Exportin-5 with the pre-miRNA requires a 3’ overhang and the stem of the precursor for efficient export (Zeng and Cullen 2004). Exp-5 is also important for stabilizing pre-miRNAs in the nucleus. When Exp-5 is knocked down by siRNAs, the levels of pre-miRNAs are reduced not only in the cytoplasm, but also in the nucleus, suggesting that binding of pre-miRNAs to Exp-5 protects them from degradation (Yi et al. 2003). In the cytoplasm, another RNAse III endonuclease termed Dicer is responsible for dicing pre-miRNAs into short RNA duplexes termed miRNA duplexes (Bernstein et al. 2001). The RNA strand of the miRNA duplex that is complementary to the mature miRNA is depicted with a star symbol (miRNA*). In addition to two RNase III signature domains, mammalian Dicer has a N- terminal ATPase/helicase domain, a DUF 283 domain, a PAZ domain and a C-terminal dsRNA binding domain (dsRBD) (Provost et al. 2002). Biochemical experiments have revealed that both PAZ domain and dsRBD are essential for the interaction of Dicer with pre-miRNAs and long dsRNAs. PAZ domain functions in recognizing the 2-nt 3′ overhang signature generated by Drosha, while dsRBD is critical for binding long dsRNAs. After capturing pre-miRNAs or long dsRNAs with its PAZ domain and dsRBD, Dicer dimerizes its two RNase III domains intra-molecularly to form a single processing center, and cuts the stem of pre-miRNAs or long dsRNAs ~22 nt away from their
11
termini at positions separated by 2 nts, which generates 3′ 2-nt termini (Zhang et al. 2004). After Dicer processing, the miRNA duplex is unwound and the mature miRNA binds to an Argonaute (Ago) protein in a process that is referred to as miRNA loading or assembly, while the miRNA* is degraded. The Argonaute family is a diverse family of proteins, each containing characteristic domains termed PAZ and PIWI. The Argonaute family can be phylogenetically divided into the Ago and Piwi protein families based on similarities to Arabidopsis AGO1 and Drosophila Piwi proteins, respectively (Carmell et al. 2002). miRNAs bind Ago proteins whereas Piwi proteins bind a newly discovered class of small RNAs known as piwi-interacting RNAs (piRNAs), which are almost exclusively expressed in the germline (Aravin et al. 2007; Kim 2006). Humans and mice contain four Ago proteins (Ago1–4). Structural and biochemical analyses have shown that the ~130- amino-acid PAZ domain contains an oligonucleotide- binding fold that allows the protein to bind the single-stranded 2-nt 3′ terminal overhangs characteristic of small RNAs processed by Dicer (Lingel et al. 2004). The miRNA/Ago ribonucleoprotein that is formed represents the core component of the effector complexes that mediate miRNA function and is known as miRNP (Mourelatos et al. 2002). A primary determinant of which the two strands of a miRNA duplex or a siRNA duplex will be loaded on Ago proteins is the inherent thermodynamic asymmetry of the miRNA or siRNA duplex. The RNA strand whose 5′ end is less stably bound to the opposite strand will be loaded to Ago proteins and forms the mature miRNA or siRNA (Tomari and Zamore 2005).
12
Figure 1
The biogenesis of microRNAs. miRNA genes are generally transcribed by RNA Polymerase II (Pol II) in the nucleus to form large pri-miRNA transcripts, which are capped (7MGpppG) and polyadenylated (AAAAA). These pri-miRNA transcripts are processed by the RNase III (Drosha-Pasha), to release the pre-miRNA (~70nt). RAN–GTP and exportin 5 transport the pre-miRNA into the cytoplasm. RNase III enzyme (Dicer) processes the pre-miRNA to generate a transient ~22nt miRNA:miRNA* duplex. This duplex is then loaded into the miRISC (light blue). The mature miRNA then binds to complementary sites in the mRNA target. miRNAs that bind to mRNA targets with imperfect complementarity block target gene expression at the level of protein translation (lower left). miRNAs that bind to their mRNA targets with perfect (or nearly perfect) complementarity induce target-mRNA cleavage (lower right). (Aurora Esquela-Kerscher and Frank J. Slack Nature reviews Cancer vol 6 April 2006).
1.4 microRNA function miRNAs base-pair with miRNA recognition elements (MREs) found in their
13
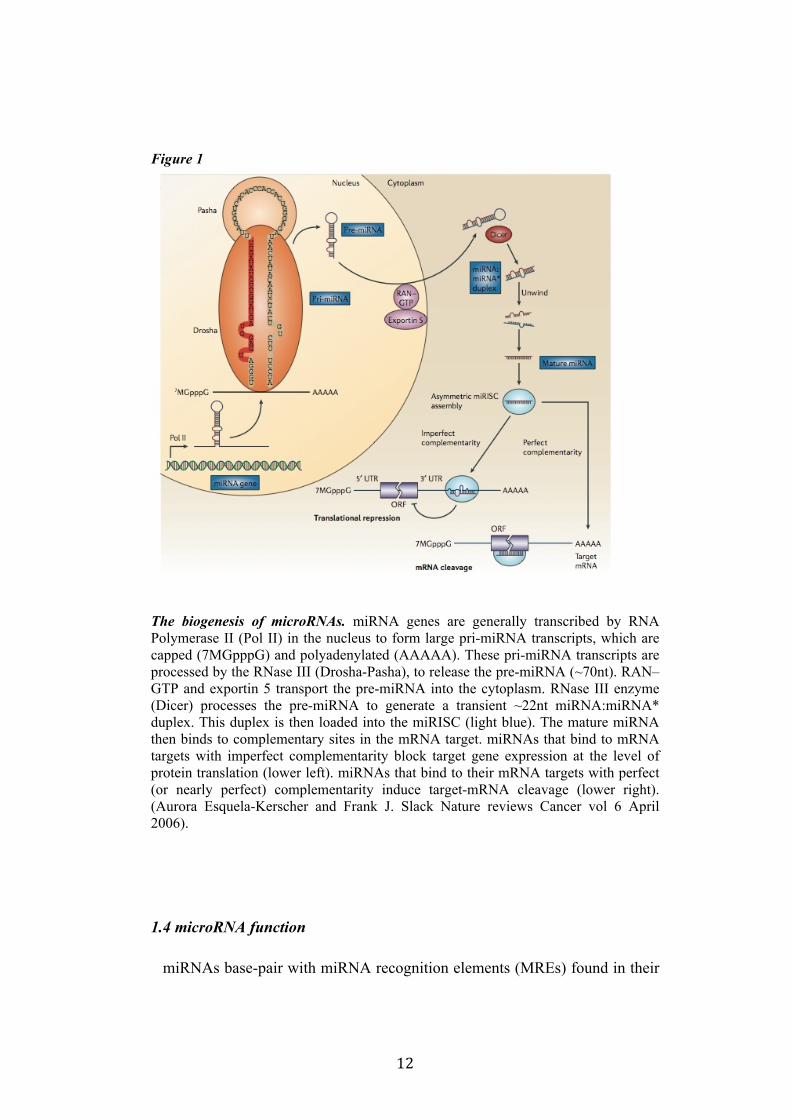
mRNA targets, typically in the 3′UTR region, and deposit their bound Ago proteins onto mRNA targets. The result is translational repression of the targeted mRNA, often followed by mRNA destabilization or endonucleolytic cleavage of the targeted mRNA. The exact molecular function is dependent upon how extensive the complementarity of the miRNA or siRNA is with its mRNA target and which Ago protein is deposited on the mRNA target. If an miRNA or siRNA bound to Ago2 pairs with extensive complementarity with a mRNA target, then the mRNA is cleaved at a position across from nucleotides 10 and 11 of the miRNA (or siRNA), while the miRNA remains intact (Liu et al. 2004). This cleavage event produces 5′-phosphate and 3′- hydroxyl terminal products, characteristic of other RNase H-like enzymes (Martinez and Tuschl 2004). The target mRNA is subsequently degraded via routine cellular pathways. Experimental and bioinformatics approaches have shown that the most important determinant of target RNA recognition by a miRNA is perfect or near-perfect complementarity between the proximal (5′) region of the miRNA and the mRNA, also known as the “seed” region or the “nucleus” (Lai 2002). Initial studies suggested that miRNA-mediated translational repression occurred at a step following the initiation of translation (Seggerson et al. 2002). More recent studies have lent additional support to the model of miRNA mediated repression occurring at a post-initiation step (Petersen et al. 2006). miRNA mediated translational repression results in decreased levels of the targeted protein. Thus, the model of miRNA function occurring at a post-initiation step would require the release of and subsequent destruction of the resulting polypeptide (Nottrott et al. 2006). Target mRNAs are recognized by miRNAs in the form of ribonucleoprotein complexes (miRNPs), through sequence complementarity, usually between the miRNA and sequences in the 3′-UTR of the mRNA. The interaction between the miRNP and the mRNA can have direct and indirect effects on translation. Direct effects occur either through inhibition of initiation of translation, which results in prevention of ribosome association with the target mRNA, or through inhibition of translation post-initiation. In the case of post-initiation repression – which includes premature ribosome drop off, slowed or stalled elongation, and cotranslational protein degradation – the repressed mRNA seems to be present in polysomes. In addition to direct effects on translation (or protein accumulation), miRNPs can have other effects on targeted mRNAs, including promoting de-adenylation, which might result in degradation (increased turnover). Both de-adenylation and degradation might take place in P bodies (denoted by P), which are cytoplasmic foci enriched for factors involved in mRNA degradation. It is possible that miRNA-targeted mRNAs could be sequestered from the translational machinery and degraded or stored for subsequent use. Alternatively, targeted mRNAs might be sequestered as a consequence of inhibition of initiation of translation. (Figure 2).
14
Figure 2
Mechanism of miRNA Function The interaction between the miRNP and the mRNA can have direct and indirect effects on translation. Direct effects occur either through inhibition of initiation of translation, or through inhibition of translation post-initiation which includes premature ribosome drop off, slowed or stalled elongation, and cotranslational protein degradation Indirect effects on translation: de-adenylation, both might take place in P bodies. (Yoontae Lee et al. EMBO J. 2004).
1.5 microRNAs: tumour suppressors and oncogenes
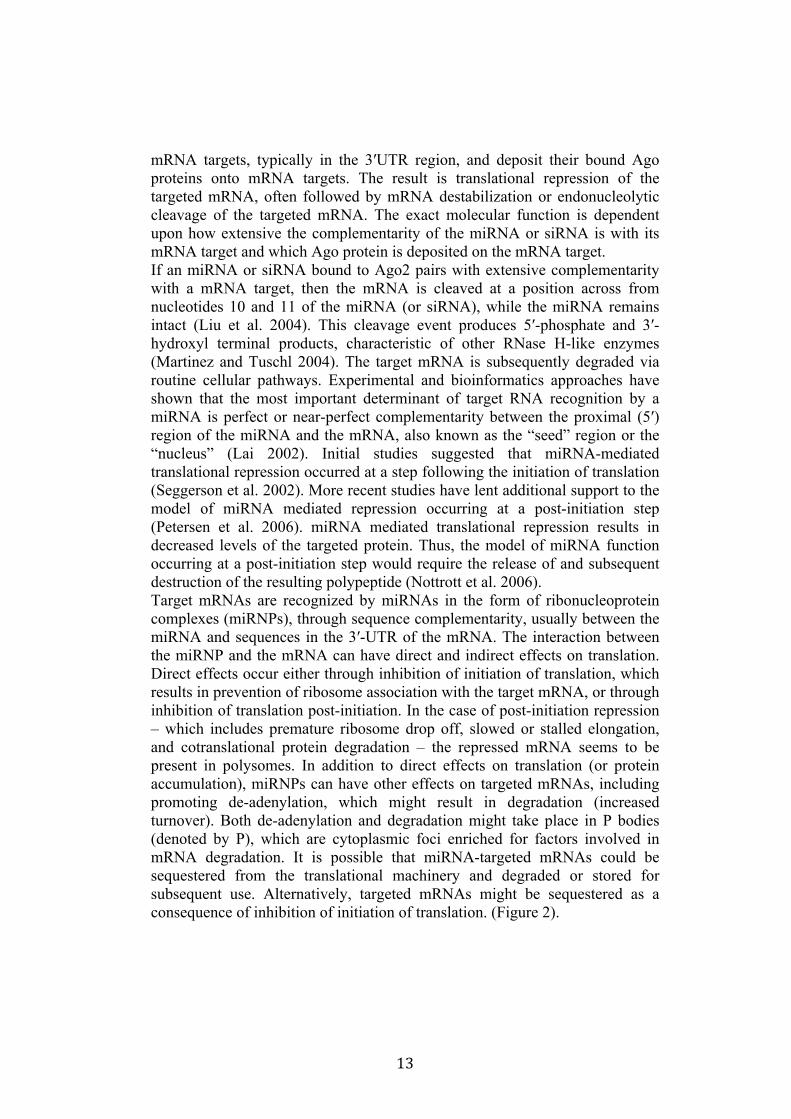
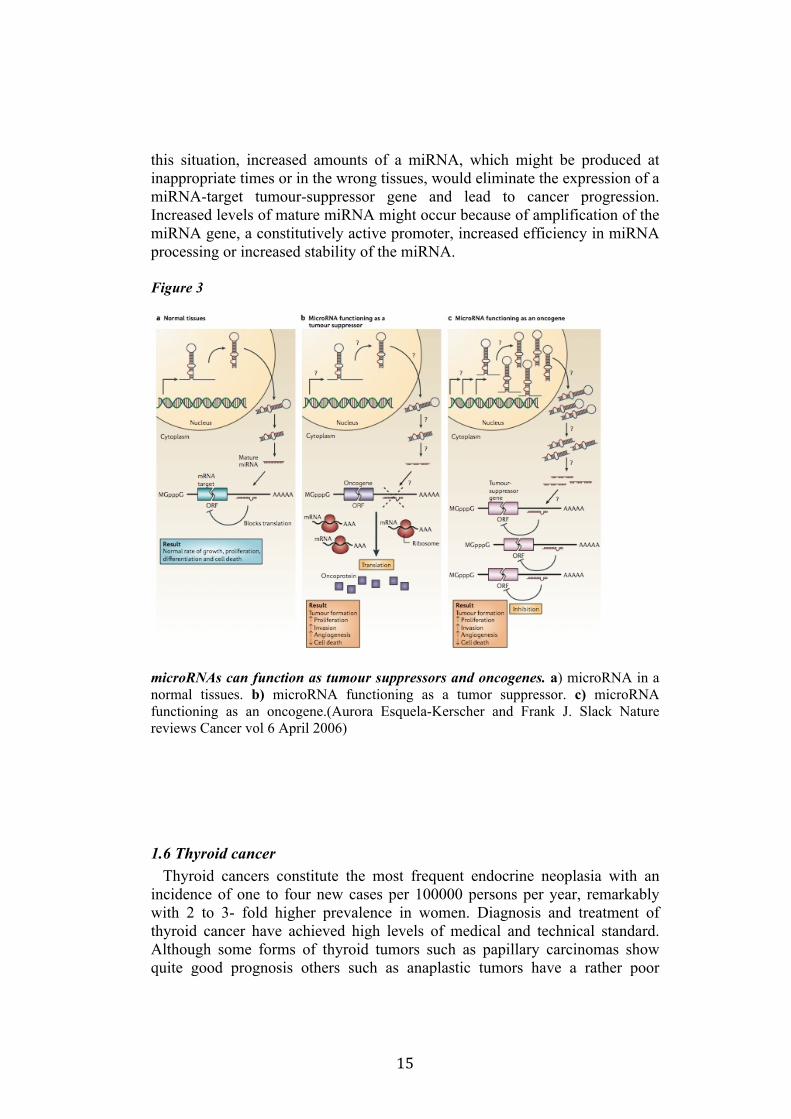
microRNAs can function as tumour suppressors and oncogenes (Figure 3). In normal tissues, proper microRNA (miRNA) transcription, processing and binding to complementary sequences on the target mRNA results in the repression of target-gene expression through a block in protein translation or altered mRNA stability. The overall result is normal rates of cellular growth, proliferation, differentiation and cell death. The reduction or deletion of a miRNA that functions as a tumour suppressor leads to tumour formation. A reduction in or elimination of mature miRNA levels can occur because of defects at any stage of miRNA biogenesis and ultimately leads to the inappropriate expression of the miRNA-target oncoprotein. The overall outcome might involve increased proliferation, invasiveness or angiogenesis, decreased levels of apoptosis, or undifferentiated or de-differentiated tissue, ultimately leading to tumour formation. The amplification or overexpression of a miRNA that has an oncogenic role would also result in tumour formation. In
15
this situation, increased amounts of a miRNA, which might be produced at inappropriate times or in the wrong tissues, would eliminate the expression of a miRNA-target tumour-suppressor gene and lead to cancer progression. Increased levels of mature miRNA might occur because of amplification of the miRNA gene, a constitutively active promoter, increased efficiency in miRNA processing or increased stability of the miRNA.
Figure 3
microRNAs can function as tumour suppressors and oncogenes. a) microRNA in a normal tissues. b) microRNA functioning as a tumor suppressor. c) microRNA functioning as an oncogene.(Aurora Esquela-Kerscher and Frank J. Slack Nature reviews Cancer vol 6 April 2006)
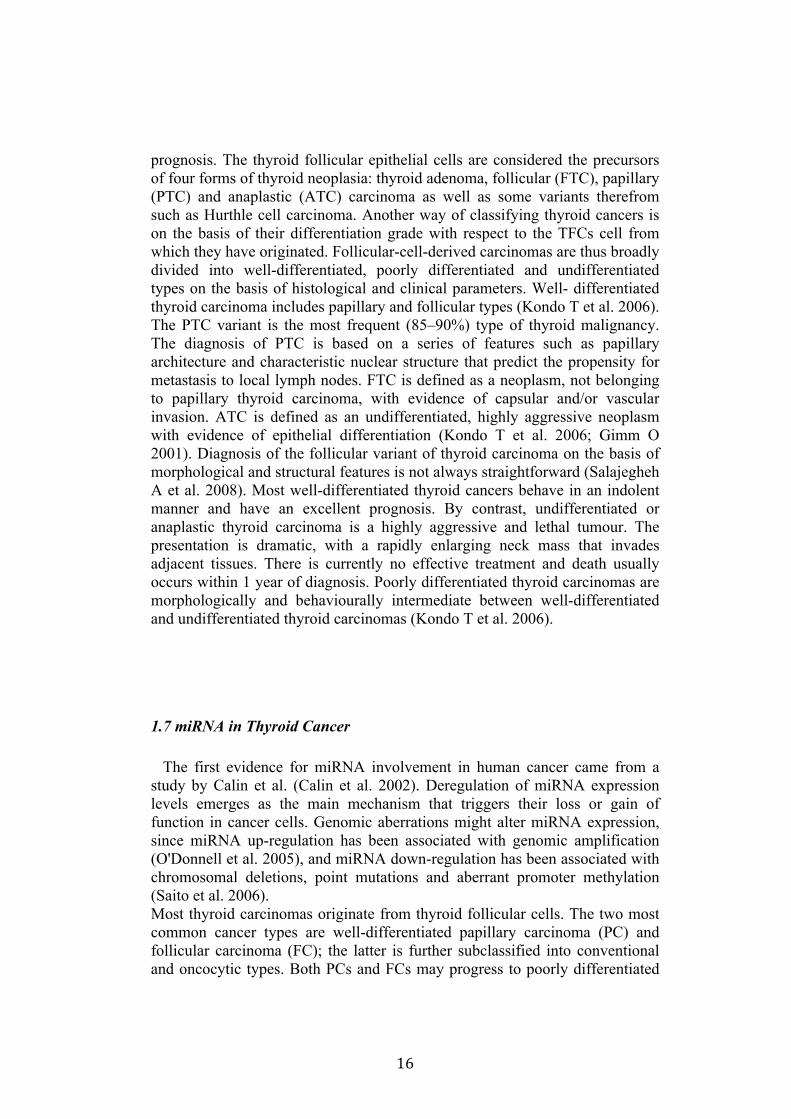
1.6 Thyroid cancer Thyroid cancers constitute the most frequent endocrine neoplasia with an incidence of one to four new cases per 100000 persons per year, remarkably with 2 to 3- fold higher prevalence in women. Diagnosis and treatment of thyroid cancer have achieved high levels of medical and technical standard. Although some forms of thyroid tumors such as papillary carcinomas show quite good prognosis others such as anaplastic tumors have a rather poor
16
prognosis. The thyroid follicular epithelial cells are considered the precursors of four forms of thyroid neoplasia: thyroid adenoma, follicular (FTC), papillary (PTC) and anaplastic (ATC) carcinoma as well as some variants therefrom such as Hurthle cell carcinoma. Another way of classifying thyroid cancers is on the basis of their differentiation grade with respect to the TFCs cell from which they have originated. Follicular-cell-derived carcinomas are thus broadly divided into well-differentiated, poorly differentiated and undifferentiated types on the basis of histological and clinical parameters. Well- differentiated thyroid carcinoma includes papillary and follicular types (Kondo T et al. 2006). The PTC variant is the most frequent (85–90%) type of thyroid malignancy. The diagnosis of PTC is based on a series of features such as papillary architecture and characteristic nuclear structure that predict the propensity for metastasis to local lymph nodes. FTC is defined as a neoplasm, not belonging to papillary thyroid carcinoma, with evidence of capsular and/or vascular invasion. ATC is defined as an undifferentiated, highly aggressive neoplasm with evidence of epithelial differentiation (Kondo T et al. 2006; Gimm O 2001). Diagnosis of the follicular variant of thyroid carcinoma on the basis of morphological and structural features is not always straightforward (Salajegheh A et al. 2008). Most well-differentiated thyroid cancers behave in an indolent manner and have an excellent prognosis. By contrast, undifferentiated or anaplastic thyroid carcinoma is a highly aggressive and lethal tumour. The presentation is dramatic, with a rapidly enlarging neck mass that invades adjacent tissues. There is currently no effective treatment and death usually occurs within 1 year of diagnosis. Poorly differentiated thyroid carcinomas are morphologically and behaviourally intermediate between well-differentiated and undifferentiated thyroid carcinomas (Kondo T et al. 2006).
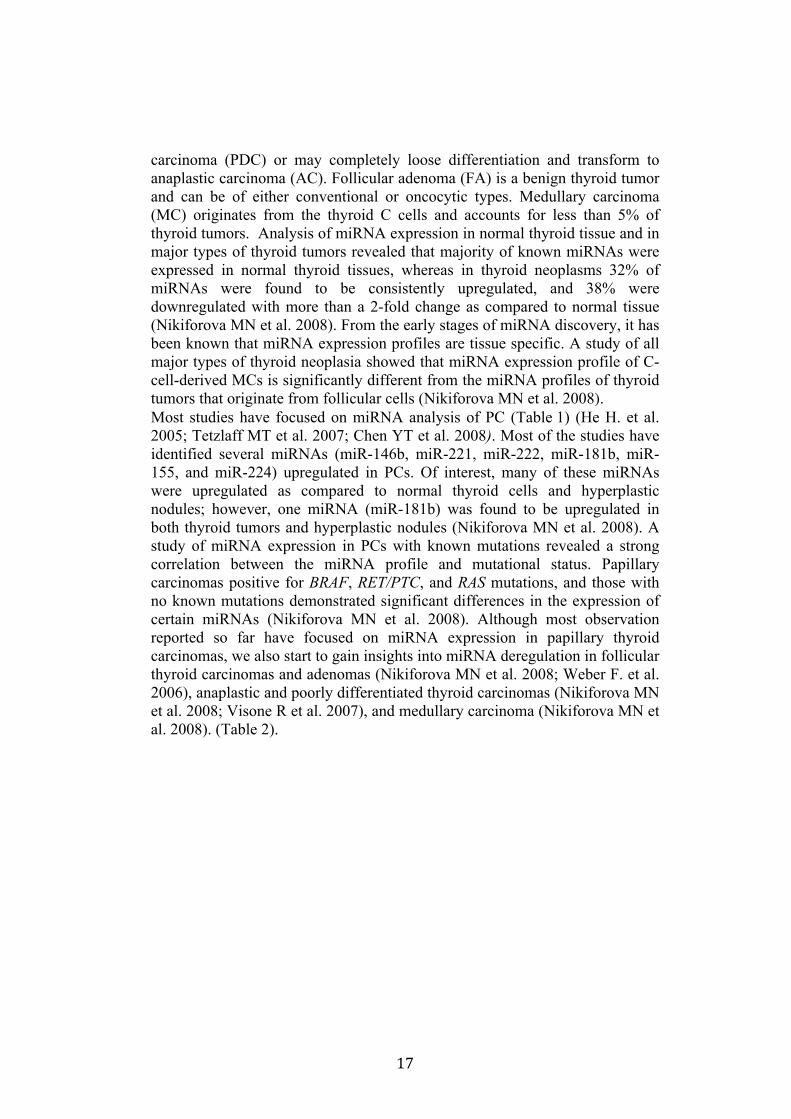
1.7 miRNA in Thyroid Cancer The first evidence for miRNA involvement in human cancer came from a study by Calin et al. (Calin et al. 2002). Deregulation of miRNA expression levels emerges as the main mechanism that triggers their loss or gain of function in cancer cells. Genomic aberrations might alter miRNA expression, since miRNA up-regulation has been associated with genomic amplification (O'Donnell et al. 2005), and miRNA down-regulation has been associated with chromosomal deletions, point mutations and aberrant promoter methylation (Saito et al. 2006). Most thyroid carcinomas originate from thyroid follicular cells. The two most common cancer types are well-differentiated papillary carcinoma (PC) and follicular carcinoma (FC); the latter is further subclassified into conventional and oncocytic types. Both PCs and FCs may progress to poorly differentiated
17
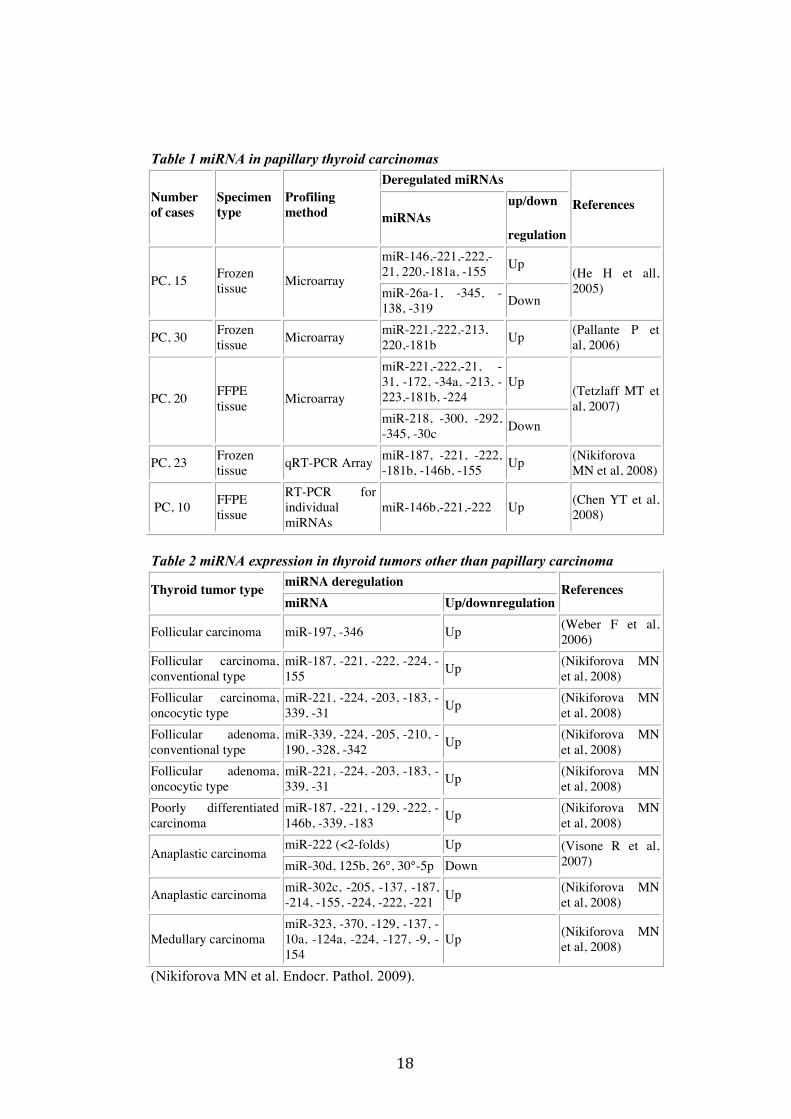
carcinoma (PDC) or may completely loose differentiation and transform to anaplastic carcinoma (AC). Follicular adenoma (FA) is a benign thyroid tumor and can be of either conventional or oncocytic types. Medullary carcinoma (MC) originates from the thyroid C cells and accounts for less than 5% of thyroid tumors. Analysis of miRNA expression in normal thyroid tissue and in major types of thyroid tumors revealed that majority of known miRNAs were expressed in normal thyroid tissues, whereas in thyroid neoplasms 32% of miRNAs were found to be consistently upregulated, and 38% were downregulated with more than a 2-fold change as compared to normal tissue (Nikiforova MN et al. 2008). From the early stages of miRNA discovery, it has been known that miRNA expression profiles are tissue specific. A study of all major types of thyroid neoplasia showed that miRNA expression profile of C-cell-derived MCs is significantly different from the miRNA profiles of thyroid tumors that originate from follicular cells (Nikiforova MN et al. 2008). Most studies have focused on miRNA analysis of PC (Table 1) (He H. et al. 2005; Tetzlaff MT et al. 2007; Chen YT et al. 2008). Most of the studies have identified several miRNAs (miR-146b, miR-221, miR-222, miR-181b, miR-155, and miR-224) upregulated in PCs. Of interest, many of these miRNAs were upregulated as compared to normal thyroid cells and hyperplastic nodules; however, one miRNA (miR-181b) was found to be upregulated in both thyroid tumors and hyperplastic nodules (Nikiforova MN et al. 2008). A study of miRNA expression in PCs with known mutations revealed a strong correlation between the miRNA profile and mutational status. Papillary carcinomas positive for BRAF, RET/PTC, and RAS mutations, and those with no known mutations demonstrated significant differences in the expression of certain miRNAs (Nikiforova MN et al. 2008). Although most observation reported so far have focused on miRNA expression in papillary thyroid carcinomas, we also start to gain insights into miRNA deregulation in follicular thyroid carcinomas and adenomas (Nikiforova MN et al. 2008; Weber F. et al. 2006), anaplastic and poorly differentiated thyroid carcinomas (Nikiforova MN et al. 2008; Visone R et al. 2007), and medullary carcinoma (Nikiforova MN et al. 2008). (Table 2).
18
Table 1 miRNA in papillary thyroid carcinomas Deregulated miRNAs
Number of cases
Specimen type
Profiling method miRNAs
up/down
regulation
References
miR-146,-221,-222,-21, 220,-181a, -155 Up
PC, 15 Frozen tissue Microarray
miR-26a-1, -345, -138, -319 Down
(He H et all, 2005)
PC, 30 Frozen tissue Microarray miR-221,-222,-213,
220,-181b Up (Pallante P et al, 2006)
miR-221,-222,-21, -31, -172, -34a, -213, -223,-181b, -224
Up PC, 20 FFPE
tissue Microarray miR-218, -300, -292, -345, -30c Down
(Tetzlaff MT et al, 2007)
PC, 23 Frozen tissue qRT-PCR Array miR-187, -221, -222,
-181b, -146b, -155 Up (Nikiforova MN et al, 2008)
PC, 10 FFPE tissue
RT-PCR for individual miRNAs
miR-146b,-221,-222 Up (Chen YT et al, 2008)
Table 2 miRNA expression in thyroid tumors other than papillary carcinoma
miRNA deregulation Thyroid tumor type miRNA Up/downregulation
References
Follicular carcinoma miR-197, -346 Up (Weber F et al, 2006)
Follicular carcinoma, conventional type
miR-187, -221, -222, -224, -155 Up (Nikiforova MN
et al, 2008) Follicular carcinoma, oncocytic type
miR-221, -224, -203, -183, -339, -31 Up (Nikiforova MN
et al, 2008) Follicular adenoma, conventional type
miR-339, -224, -205, -210, -190, -328, -342 Up (Nikiforova MN
et al, 2008) Follicular adenoma, oncocytic type
miR-221, -224, -203, -183, -339, -31 Up (Nikiforova MN
et al, 2008) Poorly differentiated carcinoma
miR-187, -221, -129, -222, -146b, -339, -183 Up (Nikiforova MN
et al, 2008) miR-222 (<2-folds) Up
Anaplastic carcinoma miR-30d, 125b, 26°, 30°-5p Down
(Visone R et al, 2007)
Anaplastic carcinoma miR-302c, -205, -137, -187, -214, -155, -224, -222, -221 Up (Nikiforova MN
et al, 2008)
Medullary carcinoma miR-323, -370, -129, -137, -10a, -124a, -224, -127, -9, -154
Up (Nikiforova MN et al, 2008)
(Nikiforova MN et al. Endocr. Pathol. 2009).
19
1.8 Role of Ras oncogenes Constitutive activation of all three Ras oncogenes (H-, K- and N-Ras) is known to occur among tumors that originated from the thyroid follicular epithelium of the thyroid gland (Lemoine NR et al. 1988). However, there are significant discrepancies related to the overall frequency of Ras mutations (from 7% to 62%) and their prevalence in specific thyroid tumors (Horie H et al. 1995; Pilotti S et al. 1997). Although it is difficult to explain this lack of consistency, the mutation screening methods, the selection of patients, and the design of individual studies are critical to identify specific association between mutational status and clinical or pathological parameters. However in one of these studies involving highly specific analysis and performed on a large number of patients haboring tumors that included the full spectrum of differentiation observed in thyroid cancer of follicular cell derivation, Ras mutations were found to be associated with aggressive cancer behaviour, loss of differentiated phenotype and with the presence of distant metastasis (Garcia-Rostan G et al. 2003). The presence of Ras mutations in benign tumours suggested that this could have been an early event in thyroid tumorigenesis. However, besides the considerable variability in the prevalence of Ras mutations in different series of thyroid cancers as mentioned above, the high degree of observer variation in the diagnosis of follicular adenoma and follicular-variant papillary thyroid carcinoma might also explain this finding (Hirokawa M et al. 2002; Lloyd RV et al. 2004). It should be considered then that highly specific analysis indicates that Ras mutations are more common in poorly differentiated and undifferentiated thyroid carcinoma (Table 3), implicating this phenomenon in tumour progression rather than in tumor initiation (Kondo T et al. 2006). Studies in vivo with transgenic mice have also given valuable information. A transgenic mouse line in which a human N-RAS (Gln61Lys) oncogene was expressed in thyroid follicular cells under control of the Tg promoter (Tg-N-RAS) was developed by Santoro’s group. Significantly, Tg-N-RAS mice developed thyroid follicular neoplasms; 11% developed follicular adenomas and 40% developed invasive follicular carcinomas, in some cases with a mixed papillary/follicular morphology. About 25% of the Tg-N-RAS carcinomas displayed large, poorly differentiated areas, featuring vascular invasion and forming distant metastases in lung, bone or liver (Vitagliano D et al. 2006). Ras oncogene in this mouse model appears to contribute both to tumor initiation and progression. However level of expression of Ras oncogene should be taken into account. It was indeed demonstrated in immortalized rat follicular thyroid cells that RAS oncogene induces de-differentiation in a dose-dependent manner, although TSH-independent growth appears to be induced in the presence of both low and high levels of oncogenic RAS expression (De Vita G et al. 2005). Thus a reasonable explanation to fit the data would be that low levels of Ras oncogene would allow thyroid tumor initiation while higher levels of expression or higher activity through additional mutation on the same

20
pathway would allow tumor progression.
Table 3. Genetic defects in thyroid cancer. Kondo T. et al. Nature Cancer Reviews Vol.6 April 2006.
1.9 Ras genes
The Ras genes were first identified as the transforming oncogenes, responsible for the cancer-causing activities of the Harvey (the HRAS oncogene) and Kirsten (KRAS) sarcoma viruses, by Edward M. Scolnick and colleagues at the National Institutes of Health (NIH). These viruses were discovered originally in rats during the 1960s by Jennifer Harvey and Werner Kirsten, respectively, hence the name Rat sarcoma. In 1982, activated and transforming human Ras genes were discovered in human cancer cells by Geoffrey M. Cooper at Harvard, Mariano Barbacid and Stuart A. Aaronson at the NIH and by Robert Weinberg of MIT. Subsequent studies identified a third human RAS gene, designated NRAS, for its initial identification in human neuroblastoma cells. The Ras protein is a monomeric globular protein of 189 amino acids (21kDa) which is associated with the plasma membrane and which binds either GDP or GTP. Ras acts as a molecular switch. When Ras contains bound GDP it is in the resting or off position and is "inactive". In response to exposure of the cell to certain growth promoting stimuli, Ras is induced to exchange its bound GDP for a GTP. With GTP bound, Ras is "switched on" and is able to interact with and activate other proteins. In biological process, any on switch must be balanced by an off switch. In the case of Ras, the protein itself has a very low intrinsic ability to hydrolyze GTP back to GDP, thus turning itself into the off state. However, in the case of Ras this intrinsic activity is quite low and switching Ras off requires extrinsic proteins termed GTPase-activating proteins (GAPs) that interact with Ras and greatly
21
accelerate the conversion of GTP to GDP. Any mutation in Ras which affects its ability to interact with GAP or to convert GTP back to GDP will result in a prolonged activation of the protein and consequently a prolonged signal to the cell telling it to continue to grow and divide. The three human RAS genes encode highly related 188 to 189 amino acid proteins. The four mammalian Ras isoforms (H-,N- and the two alternative splicing poduct of the K-Ras locus K-Ras4A and KRas4B) are identical in their first 85 aminoacid and have >90% identity in the following 80 aminoacid. The principal divergence is restricted to the last 24 amino acids which contains signal sequences for post-translational modifications (Prior IA et al. 2001). A key determinant of Ras functioning is indeed post-translational lipid processing of its C-terminal that is a prerequisite for membrane recruitment and its consequent biochemical activation. The C-terminal CAAX motif is the target of the farnesyl transferase enzyme that catalyze the addition of a farnesil isoprenoid lipid followed by proteolitic cleavage of AAX sequence (Ras converting enzyme I) and carboxymethylation of the now terminal Cys residue by the isoprenylcysteine carboxymethyltransferase. An additional signal in the C-terminal is required for full membrane recruitment. Prenylated K-Ras-4A and H-ras require a further palmitoylation step in which a palmitol moiety is attached to upstream C-terminal Cys residues while for prenylated K-Ras-4B a string of positively charged Lys residue upstream of the C-terminus is sufficient to mediate its anchoring to the membrane (Karnoub AE et al. 2008). The Ras structure consist of a hydrophobic core of six stranded β-sheets and 5 α-helices that are interconnected by a series of 10 loops. Ras protein has a very inefficient GTPase activity by itself, but it interacts with another protein, GAP, which enhances GTP hydrolysis. There are two inportant classes of proteins: the G-nucleotide exchange proteins (GEFs) and the GTPase activating proteins (GAPs). The function of GEFs is to promote dissociation of bound GDP and thus functioning as a positive regulator of Ras protein. The function of GAPs is on the contrary to increase the rate of GTP hydrolysis thus working as a negative regulator of Ras protein activity. The coupled activity of both class of proteins, tightly controlled within the cells, determines the time window of Ras activation (Krauss G ed. 2001; Schubbert S et al. 2007). Regulation of GEFs and GAPs activity in the cell can be achieved with very different mechanisms. Their activity can be regulated through coupling to membrane receptors or through second messangers such as DAG and Ca2+ (Malumbres Met al. 2003; Karnoub AE et al. 2008; Downward J 2003). The best characterized example of such regulation is the recruitment of the GEF protein Sos by Tyrosine Kinase membrane receptors (RTK). RTKs activated by extracellular signals recruit Sos to the plasma membrane through the adaptor protein Grb2. Once recruited to the membrane, where Ras is localized, Sos protein determines Ras activation by promoting dissociation of GDP (Downward J 2003). Mutated Ras proteins have been described in a variety of cancer types. It has been shown that oncogenic activity correlates with an increased lifetime of the GTP-bound Ras form. Oncogenic mutations of Ras proteins are found in particular at
22
position 12, 13 and 61 (Schubbert S et al. 2007). When Gly12 is replaced by other amino acids the conformation of the active site does not allow anymore the intearaction with upstream positive regulators (GAP) necessary to stimulate Ras GTP-ase activity thus fixing Ras in the active GTP-bound form. The Gln at position 61 is necessary to stabilize the transition state of the GTP hydrolytic reaction. When this aminoacid is substituted the intrinsic GTP-hydrolysis activity of Ras is basically abolished and cannot be stimulated further neither by GAPs proteins (Krauss G ed. 2001).
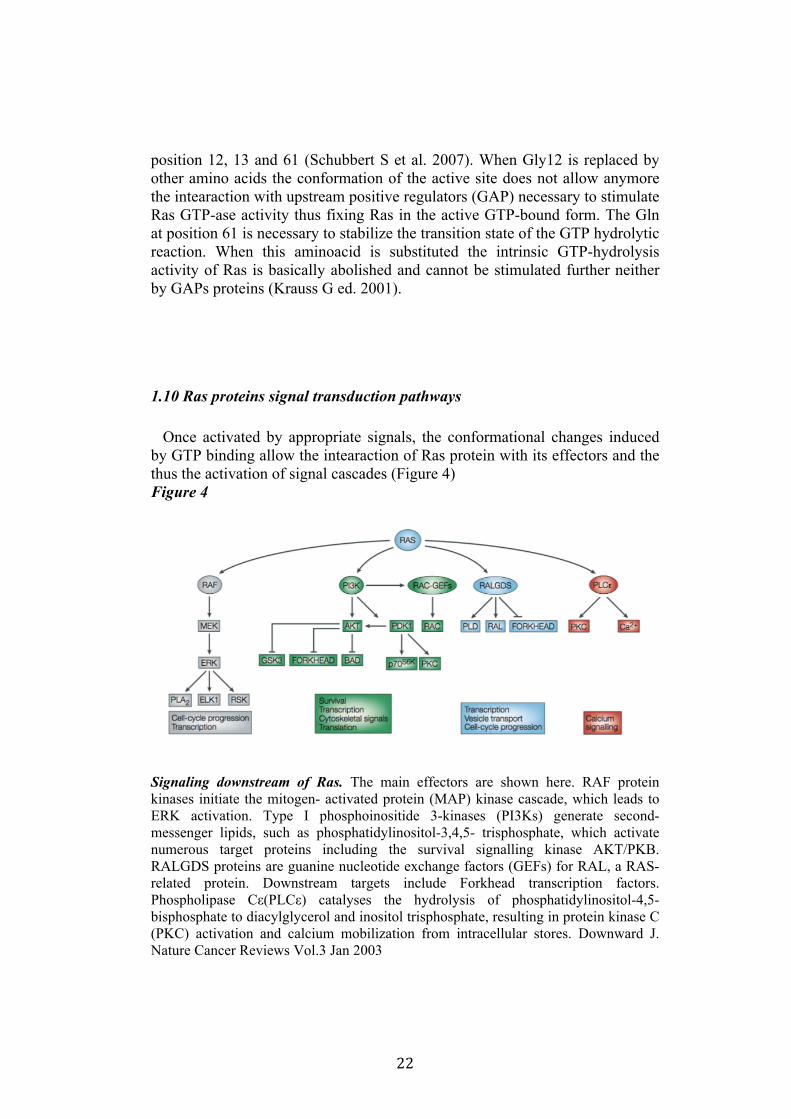
1.10 Ras proteins signal transduction pathways Once activated by appropriate signals, the conformational changes induced by GTP binding allow the intearaction of Ras protein with its effectors and the thus the activation of signal cascades (Figure 4) Figure 4
Signaling downstream of Ras. The main effectors are shown here. RAF protein kinases initiate the mitogen- activated protein (MAP) kinase cascade, which leads to ERK activation. Type I phosphoinositide 3-kinases (PI3Ks) generate second-messenger lipids, such as phosphatidylinositol-3,4,5- trisphosphate, which activate numerous target proteins including the survival signalling kinase AKT/PKB. RALGDS proteins are guanine nucleotide exchange factors (GEFs) for RAL, a RAS- related protein. Downstream targets include Forkhead transcription factors. Phospholipase Cε(PLCε) catalyses the hydrolysis of phosphatidylinositol-4,5- bisphosphate to diacylglycerol and inositol trisphosphate, resulting in protein kinase C (PKC) activation and calcium mobilization from intracellular stores. Downward J. Nature Cancer Reviews Vol.3 Jan 2003

23
The MAPK cascade: The first Ras effector characterized in mammals was the Ser/Thr kinase Raf. In mammals there are three Raf isoforms cRaf-1, B-Raf and A-Raf (Schreck R et al. 2006; Wellbrock C et al. 2004). Activated Ras interacts with Raf kinases thus facilitating plasma membrane association of normally citosolic Raf. Full activation of c-Raf-1 and A- Raf is a very complex phenomena that requires multiple signals involving both phosphorylation and dephosphorylation events, however Ras recruitment to the plasma membrane is a necessary pre- requisite for their activation and a sufficient event for B-Raf activation (Wellbrock C et al. 2004; Mercer KE et al. 2003). Activated Raf kinase phosphorylate and activate the MEK1 and MEK2 dual-specificity protein kinases. MEK1/2 then phosphorylate and activate ERK1 and ER2 MAPKs. Activated ERKs can translocate to the nucleus where they phosphorylate and regulate various transcription factors such as Ets family transcription factors, ultimately leading to change in gene expression (Zuber J et al. 2000; Schulze A et al. 2001). The majority of ERK substrates are nuclear proteins and are estimated to comprise over 160 proteins (Yoon S et al. 2006). The Raf-MEK-ERK cascade has a key role in Ras normal and neoplastic function. It has infact been shown that constututely activated Raf and MEK can transform rodent fibroblast and that MEK and ERK are necessary for Ras-mediated transformation. Further evidences suggesting that mutationally activated Ras and Raf are functionally equivalent come from their incidence in the same types of human cancers in which mutations of the two genes are never overlapping (Repasky GA et al. 2004). The PI3K pathway: A second class of Ras effectors is represented by the Phosphatidylinositol-3-kinases (PI3K) made up of a regulatory (p85) and a catalytic (p110) subunit. Ras mediated PI3K activation is obtained through recruitment of PI3K at the plasma membrane through interaction with the p110 catalytic subunit (Krauss G ed. 2001). Once activated PI3K converts the second messenger phosphatidylinositol (4,5) biphosphate (PIP2) into phosphatidylinositol (3,4,5) triphosphate (PIP3) which recruits and activates the PDK1 kinase which in turns activatre AKT kinase whose activity promotes cell proliferation and survival through activation of the mTOR kinase and inhibition of FoxO transcription factors (Shaw RJ et al. 2006). The PI3K pathway is an important driver of cell proliferation and survival. Numerous types of human tumors, both sporadic or arising as a component of a cancer predisposition syndrome, shows upregulation of the PI3K pathway. The RAL pathway: The Ras-like (Ral) guanyl nucleotide-binding proteins RALA and RALB are activated by Ras through its direct interaction with a class of GEFs (for example RalGDS) that have biochemical specificity for Ral proteins. Thus Ras activation promotes accumulation of Ral proteins in their active GTP-bound form. Ral proteins engage multiple effectors and their suggested role is to deflect induction of programmed cell death that occour in response to aberrant mitogenic signal (Bodemann 2008). The number of Ras effectors have been increasing during the years. Some of the best characterized additional effectors are PLCε and TIAM1. The

24
phospholipase PLCε once activated by Ras cleave PtdIns(4,5)P2 into inositol-1,4,5-triphosphate (Ins (1,4,5)P3 and diacylglicerol (DAG) promoting releasing of Ca2+ and and activation of PKC respecrively. TIAM1 is a Rho GTPase family GEF and serves as one rout to activate the Rac and Rho GTPase downstream of Ras. Some of the less characterized Ras effectors are AF-6, RIN1 and the RASSF proteins (Karnoub AE et al. 2008; Repasky GA et al. 2004).
1.11 The FRTL-5 thyroid cell line The availability of cultured, differentiated thyroid cell lines offers an amenable system to study the action of activated Ras proteins on the differentiated phenotype of an epithelial cell type. The FRTL-5 cell line derive from spontaneous immortalization of a 3 weeks old rat epithelial follicular thyroid cells (Ambesi-Impiombato FS et al. 1980). These cells retains in culture the expression of all known thyroid differentiation markers such as Tg, NIS, TPO and TSHr as well as the thyroid specific combination of transcriptiona factors Titf-1, Foxe1, Hhex and Pax8. Despite showing some thyroid functional properties such as the ability of concentrate iodide and to secrete thyroglobulin, these cells do nor show the charctaristic polarization observed in the TFCs and in the standard culture condition do not organize into follicular structures. FRTL5 cells rapidly proliferates (duplication time about 36h) and their proliferation as well as their differentiation is dependent upon TSH presence in the culture medium (Fusco A et al. 1987).
1.12 Transformation of FRTL-5 cells by Ras oncogene It was previously shown that Ras oncogene expression in FRTL5 cells determines neoplastic transformation. Such transformation involve the acquiring of the following properties: TSH- independent growth, anchorage-independent growth, morphological alterations and the ability of giving rise to tumors when injected in nude mice. Ras oncogene mediated transformation of FRTL5 cells is associated with the silencing of thyroid-specific genes such as Tg, TPO and NIS (Fusco A et al. 1987; Francis-Lang H et al. 1992). Studies aimed to characterized the pathways through which Ras oncogene induces transformation and dedifferentiation of FRTL-5 cells have highlighted that, though in fibroblasts constitutive activation of MEK (downstream of Raf)
25
and Rac (downstream of PI3K and Tiam1) is sufficient to recapitulate Ras effects, in FRTL-5 cells these pathways can reproduce only the oncogenic Ras-induced proliferative phenotype but do not have consequences on FRTL-5 differentiation (Cobellis G et al. 1998). It was indeed demonstrated through the use of Ras effector domain mutants that Ras oncogene induced dedifferentiation requires activation of the Raf/MEK/ERK pathway plus an additional uncharacterized pathway (Missero C et al. 2000). Furthermore, it was shown that loss of differentiation is an early event, thus not the result of chronic exposure to the activated oncogene, induced exclusively by high levels of Ras oncogene (De Vita G et al. 2005). Ras is one of the oncogenes most frequently activated in Human cancers, which, because of its central role in the transduction of extracellular signals, is able to re-programme the transcriptome of cells when constitu-tively activated. Ras is able to induce aberrant expression of miRNAs during the transformation of thyroid epithelial cells (Landgraf et al. 2007). The top-scored upregulated miRNA is miR21, a miRNA found overexpressed in several solid and hematopoietic malignancies (Krichevs- kyandGabriely 2009). In vitro studies have demonstrated that miR21 knockdown in tumor cell lines leads to increaseed apoptotic cell death (Seike et al. 2009). Several target mRNAs have already been validated for miR21, among which there are at least four known tumor suppressors (PTEN, TPM1, PDCD4). The transcription of miR21 primary RNA is controlled by a conserved upstream enhancer, which has been demonstrated to be regulated by gp130-activated Stat3 in myeloma cells, and by AP-1 in promyelocitic differentiation induced by TPA (Loffler et al. 2007; Fujita et al. 2008). Recently study demonstrate that AP-1activity is necessary but not sufficient, for the induction of miR21 triggered by Ras (Talotta et al. 2009). The induction of miR21 by Ras is mediated by at least two different downstream pathways, the Raf-MAPK (mitogen-activated protein kinase) and the phosphati-dylinositol 3-kinase (PI3K) pathways (Frezzetti et al. 2010).

26
2. Aim of the Study
H-Ras, K-Ras and N-Ras are three highly related genes that encode for small monmeric GTPases involved in the regulation of several biological process as: cell proliferation, differentiation, motility and survival. RAS regulated pathways are aberrant in most human tumors due both to mutations in Ras genes themeselves or Ras effectors. Literature emphasizes the key role of miRNAs in cancer development. Moreover it has been demonstrated that oncogenes and tumorsuppressors can act also by regulating the expression of specific miRNAs. Previous results published by Landgraf et al., using the FRTL-5 ER-H-RasV12 inducible system highlighted that Ras is able to induce aberrant expression of microRNAs during the transformation of thyroid epithelial cells. Taking advantage of the inducible system FRTL-5 ER-H-RasV12 we decided to study the miRNAs involved in Ras-induced transformation. The aim of my project was to identify Ras-regulated miRNAs and study their functional or transcriptional role in transformation of thyroid epithelial cells.
27
3. Materials and methods
3.1 Cell culture. Rat thyroid follicular FRTL-5-derived cell lines were maintained in Coon’s modified F12 medium (EuroClone, Milano, Italy) supplemented with 5% newborn bovine serum (HyClone, Logan, UT), penicillin and streptomycin 100X (EuroClone, Milano, Italy), 20ng/ml Glycyl-histydyl-lysine (SIGMA), 3.6ng/ml hydrocortisone (SIGMA), 10µg/ml bovine pancreas insulin (SIGMA), 5µg/ml Apo-Transferrin Human, 10ng/ml Somatostatin (SIGMA) and 0.5mU/ml TSH. "6H medium" refers to above described medium; "5H medium" refers instead to above described medium without TSH. Tamoxifen treatments, where indicated, were performed by addition of 100 nM 4- hydroxytamoxifen (4OHT) (Sigma-Aldrich) to the culture medium. NIH 3T3 mouse fibroblasts were maintained in Dulbecco’s Modified Eagle’s Medium High Glucose supplemented with 10% fetal bovine serum (EuroClone, Wetherby, UK).
3.2 Vectors. pCEFL miR135a expression vector was generated by PCR amplification from thyroid rat genome using the forward primer 5'ATATAGGATCCCACGTTCCAGAG3' and the reverse primer 5'ATATAGCGGCCGCTGGAAATGGTT3'. The PCR product was digested with BamHI and NotI restriction enzymes and cloned in the pCEFL Neo vector. The TK-renilla reporter vector was purchased from Promega Corporation (phRL-TK); pCMV RasV12. pGL3 reporter vectors were generated by PCR amplification from thyroid rat genome using: pGL3 promoter miR21: forward primer 5'TATCCGAGCTCCAAGCTGTTATAATGTACAGG3' and the reverse primer 5'TAGTTCTCGAGCACACTGCTGTGGCACAAAG3'. pGL3 1Kb Prom mir21 vector was generated by PCR amplification from thyroid rat genome using the forward primer 5'TGAGCTCTTAACTCTCAGGTCACTTGC3' and the reverse primer 5'TCTCGAGTGCTGTGGCACAAAGAAGAA3'.
28
pGL3 1Kb NO Prom miR21: forward primer 5’TATCCGAGCTCTTAACTCTCAGGTCACTTGC3’ and the reverse primer 5’TAGTTCTCGAGGTTCCAAGATGTCTGGATAG3’. pGL3 624bp Prom miR21: forward primer 5’TATCCGAGCTCGAAGGAGGGAAGGGTGTTTA3’ and the reverse primer 5’TAGTTCTCGAGCACACTGCTGTGGCACAAAG3’. pGL3 870bp Prom miR21: forward primer 5’TATCCGAGCTCGCCAACAATTGCGAAGTTGC3’ and the reverse primer 5’TAGTTCTCGAGCACACTGCTGTGGCACAAAG3’. The PCR products were digested with SacI and XhoI restriction enzymes and cloned in the pGL3 SV40 promoter Promega Corporation.
3.3 Transfections. All transfections were carried out by the use of FuGene 6 (Roche Molecular Biochemicals, Indianapolis, IN) following the manufacturer’s instructions. For stable transfection experiments, 2x10⁶ cells were seeded on 100-mm dishes 24hours prior to transfection and transfected with 4 µg/dish of the indicated expression vector. Forty-eight hours later, transfected cells were selected in the presence of 1µg/ml of Neomycin (Sigma-Aldrich). After 3 weeks of continuous selection single clones were picked, screened for expression of the transgene and amplified individually. For transient transfections 250*10^3 cells (FRTL-5 cells) or 55*10^3 cells (NIH cells) were seeded on 6 multiwell 24hours prior to transfection. Transfections were performed with 2 µg/dish of Total DNA consisting of 1µg of reporter vector encoding Firefly Luciferase (FF luc); 0.5 µg of pCMV RasV12 vector; 0.5 µg of TK-Renilla vector to follow transfection efficiency, cotransfecting vectors or empty vector up to 2 µg. Transfection medium was replaced 15hours later with standard culture medium, supplemented or not with additional drugs as indicated in the text, and cells cultured for additional 48 hours. Cells were lysed in 50µL/dish PLB buffer 1x (Promega Corporation) and Firefly and Renilla Luciferase activity were assayed respectively on 10µL of each sample with the “luciferase Assay system” (Promega Corporation) and the “Renilla assay system” (Promega Corporation) following manufacturer’s instructions. Luminescence was measured with LUMAT LB 9507 luminometer (Berthold technologies). Firefly Luciferase activity was normalized on the activity of TK-renilla vector in order to correct each sample for transfection efficiency. Data were obtained from at least two independent experiments with triplicate samples.

29
3.4 Chromatin Immuno-Precipitation (ChIP)
3.4.1 Crosslinked chromatin preparation. Briefly 4x10⁶ cells were seeded on 100-mm dishes and cultured 24hours with or without additional drugs for the time indicated in the text. At the end of the treatment formaldehyde was added to the cells to final 1% for 10 min to crosslink the chromatin and the reaction was stopped by adding glycine to a final concentration of 0.125 M. Cells were washed twice with PBS, and collected in cell lysis buffer (85 mM KCl, 0.5% NP40, 5 mM HEPES pH 8.0) (1.5mL /dish) supplemented with a protease inhibitor cocktail (sigma), homogenized by Dounce, incubated on ice for 15 min and centrifuged at 3500 g for 5 min to pellet the nuclei. The pellet was resuspended in nuclear lysis buffer (10 mM EDTA, 1% SDS, 50 mM Tris–HCl, pH 8.1) in a ratio 400µL/107cells. Crosslinked chromatin aliquots were stored at - 80°C or either processed directly.
3.4.2 Transcription rate measurement. Transcription rate measurement was performed through an RNA-polymeraseII-based Chromatin-IP as previously described (232). Crosslinked chromatin (400 µL aliquotes) was sonicated on ice with 8 pulses of 30% amplitude in a BRANSON 250 sonicator . The average chromatin size of the fragments obtained was about 300 bp. The sonified chromatin was centrifuged at 14,000 g for 10 min and the supernatants, containing soluble chromatin fragments, were diluted 10-fold with dilution buffer (165 mM NaCl, 0.01% SDS, 1.1% Triton X, 1.2 mM EDTA, 16.7 mM Tris–HCl, pH 8.0) supplemented with protease inhibitor cocktail (Sigma-Aldrich). Diluted samples were precleared with 50µL/mL of Salmon sperm DNA/proteinA agarose (Upstate) and left 1h under rotation at 4°C. After centrifuging 1 min at 3000g at 4°C aliquots from the supernatant of each sample (1mL each) were incubated with 2.5 µg of RNA pol II antibody (Santa Cruz, sc-899), or as negative controls with 2.5 µg of Normal Rabbitt IgG (Upstate) or in the absence of any antibody and left to stay overnight at 4°C under rotation (An aliquote of the supernatant was stored at 4°C to evaluate INPUT DNA for each sample). The samples were then incubated with 30 µl of Salmon sperm DNA/proteinA agarose (Upstate) under rotation for an additional period of 1h. Immunocomplex were then recovered and washed as suggested by Upstate. Eluition was performed with 2x100 µl of elution buffer (1% SDS, 100 mM NaHCO3). Both Immunoprecipitated Chromatin and Input Chromatin were incubated at 65°C overnight to reverse formaldehyde crosslinks. DNA purification was performed as suggested by Upstate and resuspended in 100µL TE buffer. The entire chromatin-IP procedure has been repeated on independent tween samples. All obtained DNA samples have been analysed in triplicates by Real-Time PCR. Real-time PCR was performed and analysed as
30
described in the previous paragraph using 5µL of DNA as template for each reaction. Primer pairs were designed with the Primer express software (Applied Biosystem) to amplify a region of 157 bp in length, corresponding to Transcription start site (miR21F 5’-agaaagagggagggcagttt-3’/miR21R 5’- acactgctgtggcacaaaga-3’). For each sample immunoprecipitated DNA levels have been reported as percent of Total INPUT DNA and the average value has been calculated on the two independent chromatin IP.
3.5 RNA extraction and Real-Time PCR. RNA was extracted using TRIZOL Reagent (Invitrogen) following the manufactures instructions. Four micrograms of total RNA from each cell line was used as a template for the synthesis of the first strand cDNA, starting from random hexamers, using the Superscript II Reverse Transcriptase kit (Invitrogen Life Technologies, Carlsbad, CA) according to manufacturer’s instructions. Real-Time RT-PCR was conducted on iCycler iQTM Multi-Color Real Time PCR Detection System (Biorad) using the iQ SYBR Green Supermix (Biorad). Each reaction was carried out in triplicate, using 100ng of cDNA as template. Specific primers pair for each gene analyzed were used at 130nM. Results were analyzed using α-1 tubulin mRNA as reference gene. Analysis of results was performed following Real-Time relative-quantitation guidelines through the relative Standard curve method as suggested by Applied Biosystem. Briefly, amplification efficiency was calculated from triplicates relative standard curves for each primer pairs and then used to convert Ct values obtained from each reaction into relative-expression units. Data obtained in this way were then normalized on the relative-expression of reference gene. Statistical analysis was performed on normalized relative-expression values of each gene. The following primers were utilized: Rno-pri-miR-21 upper 5’-GCTTTGCTTTAAACCCCGCC-3’ lower 5’-TGACTGCAAACCATGATGCTG-3’ Product size: 225bp TTF1 Fwd 5’-GGTGCCCTCTGGCCCTATAG-3’ Rev 5’-GCTTGTCGATGATGCCCTTTT-3’ Product size: 201bp TTF2 Fwd 5’-TTCGTGTCTGCCATGTGAGC-3’ Rev 5’-GCCCACGTCCAAAGCAAATC-3’ Product size: 201bp
31
Pax8 Fwd 5’-GGCCACCAAATCTCTGAGCC-3’ Rev 5’-TGGGAATCGATGCTCAGTCG-3’ Product size: 201bp Tg Fwd 5’-GGGACTCGTGTGGTAGGCAC-3’ Rev 5’-CAGGTTACAAATCAGTGGCCCT-3’ Product size: 201bp NIS Fwd 5’-TTGTGGTAATGCTCGTTGGC-3’ Rev 5’-TCACACCGTACATGGAGAGCC-3’ Product size: 201bp TSHR Fwd 5’-AGGACATGGTGTGTACCCCC-3’ Rev 5’-AATCTGCAAAGGCCAGGTTG-3’ Product size: 201bp TPO Fwd 5’-AAGATGCTGAACAGGAACCGG-3’ Rev 5’-ATGGAACTCAGCTATGCAGCC-3’ Product size: 201bp Tubulin Fwd 5’-CAACACCTTCTTCAGTGAGACAGG-3’ Rev 5’-TCAATGATCTCCTTGCCAATGGT-3’ Product size:201bp For microRNA, single stranded cDNA Syntesis was performed using the TaqMan MicroRNA Reverse Transcription Kit (Applied Biosystem). The 15µl of RT reaction included 0,15µl 100mM dNTPs, 1µl MultiScribe Reverse Transcriptase 50U/µl, 1,50µl 10X Reverse Transcription Buffer, 0,19µl RNase Inhibitor 20U/µl, 3µl RT primer, 10ng total RNA. The reactions were incubated at 16˚C for 30min, 42˚C for 30min, 85˚C for 5min. Real-time PCR was performed using a TaqMan MicroRNA Assays protocol on an Applied Biosystems 7900HT Fast Real-Time PCR System (P/N: 4351684, Applied Biosystems). The 20µl PCR reaction included 1,33µl RT product (minimum 1:15 diluition from RT reaction, 10µl TaqMan 2X Universal PCR Master Mix (No AmpErase UNG), 1µl probe TaqMan microRNA Assay 20X. The reactions were incubated in a 96- well plate at 95˚C for 10min, followed by 40 cycles of 95 ˚C for 15s and 60˚C for 1min. All reactions were run in duplicate. The threshold cycle (CT) is defined as the fractional cycle number at which the fluorescence passes the fixed threshold. To normalize the expression levels of target genes, Let7a has been used.
32
3.6 Protein studies. Cells were washed in cold PBS. Total protein extraction was carried out using the Tissue Lysis Buffer: 50mM Tris HCl pH 8, 5mM MgCl2, 150mM NaCl, 0.5% Deoxycholic Acid, 01% SDS, 1% Triton. Before use to the above described buffer were added 100X protease inhibitor cocktail (Sigma) at 1X final concentration, 0.5mM PMSF, 5mM sodium orthovanadate (Na3VO4), 10mM sodium fluoride (NaF), 0.5mM sodium pyrophosphate (Na4P2O7), and 1mM dithiothreitol (DTT). The lysis buffer for extraction of phosphorylated proteins was composed by: HEPES 50mM pH 7.5, 150mM NaCl, 10% glycerol, 1% Triton X-100, 1mM EGTA, 1.5mM MgCl2, 10mM NaF, 10mM sodium pyrophosphate, 1mM Na3VO4, inhibitor protease cocktail 1X (Sigma). Lysis was allowed to continue for 15 min on ice, samples were centrifuged at full speed at 4°C for 25 min. Protein concentration was estimated using the BCA Protein Assay Kit (Pierce) following manufacturer instruction. For monodimensional Western blot analysis 30µg were loaded on SDS-PAGE performed using precasted NuPAGE 4-12% Bis-Tris gels (Invitrogen, Carlsbad, CA).
3.7 Immunoblot. Gels were elettroblotted on PVDF membranes (Immobilon-P, Millipore, Bedford, ME) and screened for different antibodies. Rabbit polyclonal antibodies against Tg (DACO), Pax8, TTF1 and TTF2, previously produced in our laboratory, were used respectively at 1 µg/ml, 0.5 µg/ml, 0.2µg/ml, 0.8 µg/ml and 0.2 µg/ml. Primary antibodies against GAPDH (ImmunoChemical), HRas Specific (Santa Cruz), α1 Tubulin (Sigma), were used as suggested by manufactures. Secondary antibodies Mouse IgG Horseradish peroxidase linked whole antibody (GE Healthcare), Rabbit IgG Horseradish peroxidase linked whole antibody (GE Healthcare) were used as suggested by manufacturers. Chemiluminescence was detected using either Pierce ECL Western Blotting Substrate (Pierce) or ECLplus Western Blotting Detection system (GE Healthcare).
3.8 Proliferation analysis. Cell Proliferation rate was determined either by standard growth curve
33
analysis or by Cell Titer 96 AQueous One Solution Cell Proliferation Assay (Promega). For standard growth curve 100.000 cells were plated on 60mm dishes in 6H medium for 24h hours. Cell Titer 96 AQueous One Solution Cell Proliferation Assay is a colorimetric method for determining the number of viable cells in proliferation assays. The Cell Titer 96 AQueous One Solution Reagent contains a tetrazolium compound (MTS) and an electron coupling reagent (PES). 50.000 cells/well were plated in a 96 well, the assay was performed adding 20µl of Cell Titer 96 AQueous One Solution directly to culture wells, incubate for 2h and then recording absorbance at 490nm with a 96 well-plate reader. The 96 well plate reader was blanked using fresh culture medium. Data were obtained from at least two independent experiments with triplicate samples.
3.9 Motility assay. Cell migration was estimated by Transwell Assay using the Transwell Permeable Support 8 µm polycarbonate membrane 6.5mm Insert provided by Corning Incorporated. For transwell assay 50.000 cells were plated in the transwell insert and directly treated with the specific medium. After 24h from the plating, cells were wiped off from the inner membrane the migrated cells were than fixed and stained using a crystal violet and methanol solution (50% crystal violet, 10% methanol) for 30min. Quantification of the migrated cells was performed destaining the crystal violet solution in 1% SDS solution and reading the relative absorbance at 570nm. The data shown are the result of two independent experiments performed in triplicate.
34
4. Results and Discussion
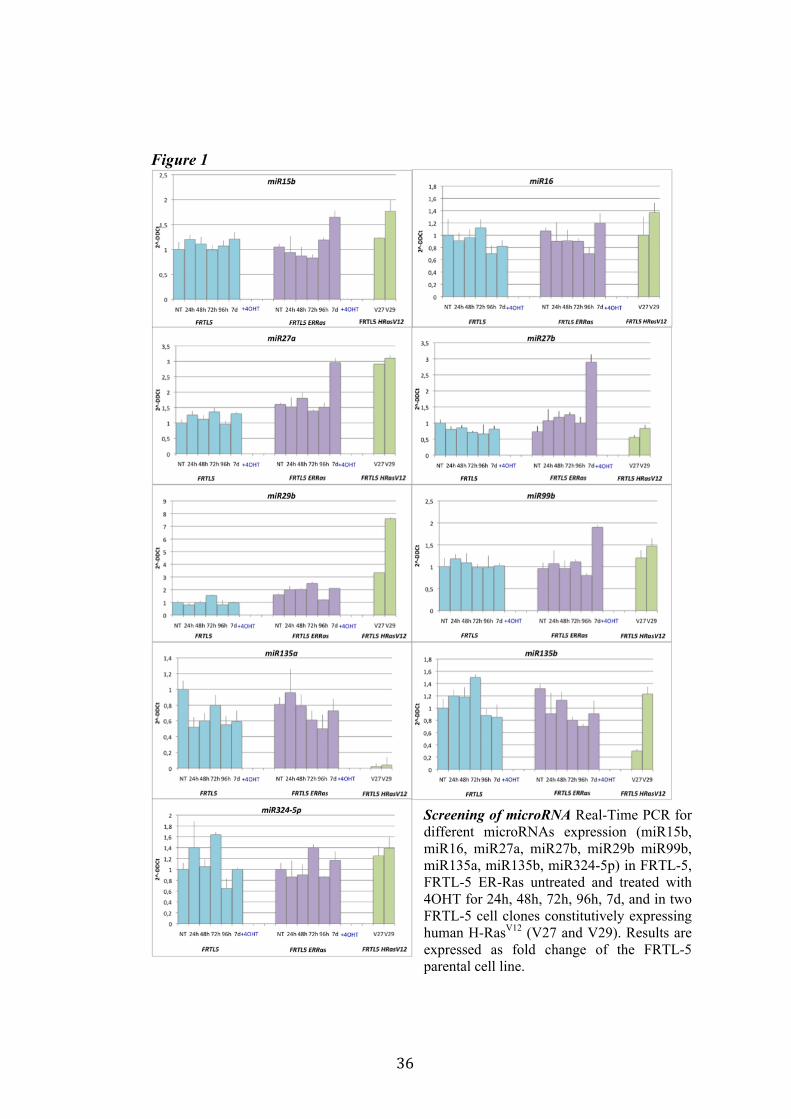
In the inducible FRTL-5 ER-H-RasV12 system, De Vita et al. highlighted that TSH-independent proliferation and loss of differentiation are two early and direct effects of oncogenic Ras expression. Although the effects of oncogenic Ras in thyroid epithelial cells have been extensively studied little still is known about the mechanism through which oncogenic Ras is able to promote these effects. Our knowledge is constantly increasing about miRNA and their potential role in neoplastic transformation. By taking advantage of the inducible system FRTL-5 ER-H-RasV12 we decided to study the miRNA involved in Ras-induced transformation. The aim of my project was to identify miRNAs and study their functional role in Ras-induced transformation of thyroid epithelial cells. As a tool we used the FRTL-5 ER-H-RasV12 system in which the expression of oncogenic H-RasV12 is under the control of the mutant ligand binding domain (LBD) of the estrogen receptor (ERTM). The TM mutation in the LBD of ER makes the receptor sensitive only to tamoxifen (4OHT) and no longer to estrogen (De Vita G. et. al. 2005). Previous results published by Landgraf et al., using the FRTL-5 ER-H-RasV12 system highlighted that Ras is able to induce aberrant expression of microRNAs during the transformation of thyroid epithelial cells. They cloned and sequenced more then 330,000 independent small RNA sequences from 256 small RNA libraries prepared from 26 distinct organ systems and cell types of human and/or rodents, and also re-analyzed some previously described small RNA libraries. They examined a restricted thyroid cell line FRTL-5 after the induction of a stable, ectopic tamoxifen-regulated RAS oncogene (De Vita et al., 2005). Ras induction leads to upregulation of miR-21 after 2 and 7 days from 0.3% to 4% and 11% total miRNA content. The most strongly regulated miRNA by Ras were validated by Real-Time PCR and selected for further functional and transcriptional studies.

35
4.1 Screening of microRNA regulated by Ras. Recently Landgraf et al. demonstrated that Ras is able to induce aberrant expression of microRNAs during transformation of thyroid epithelial cells. We decided first to validate the previously described small RNA libraries data by Real-Time PCR, and later we selected microRNAs of interest to study their functional role in Ras-induced transformation. We measured the level of expression of miR15b, miR16, miR27a, miR27b, miR29b, miR99b, miR135a, miR135b, miR324-5p in FRTL-5 ER-Ras clone (Cl11) treated with 4OHT for 24h, 48h, 72h, 96h and 7days. To rule out the possibility that the regulations observed could be due to 4OHT treatment, the parental cell line FRTL-5 was also treated as FRTL-5 ER-Ras Cl11. We then asked if the microRNAs expression profile observed in Cl11 was also associated with chronic thyroid epithelial cell transformation. To this aim we measured the level of expression of each of previously shown microRNAs in two FRTL-5 clones constitutively expressing human H-RasV12 (V27 and V29) (Figure 1). Interestingly the screening highlighted that miR135a is slightly down-regulated in FRTL-5 ER-Ras Cl11 until 4 days of treatment with 4OHT, then at 7 days of treatment the levels of mir135a returned comparable to untreated cells. On the other hand miR135a is strongly down-regulated in the chronically transformed clones V27 and V29. In order to examine when between 4 and 7 days of treatment with 4OHT miR135a starts to rise again we treated FRTL-5 ER-Ras Cl11 for 1, 2, 3, 4, 5, 6 and 7days with 4OHT (Figure 2). The same graph also shows the levels of expression of miR135a in three chronically transformed clones V27, V29 and V39. The results are expressed as fold change of parental cell line FRTL-5. In order to establish if miR135a down-regulation was necessary for Ras-induced transformation we decided to over-express the above-mentioned microRNA in the chronically transformed clone V29.
36
Figure 1
Screening of microRNA Real-Time PCR for different microRNAs expression (miR15b, miR16, miR27a, miR27b, miR29b miR99b, miR135a, miR135b, miR324-5p) in FRTL-5, FRTL-5 ER-Ras untreated and treated with 4OHT for 24h, 48h, 72h, 96h, 7d, and in two FRTL-5 cell clones constitutively expressing human H-RasV12 (V27 and V29). Results are expressed as fold change of the FRTL-5 parental cell line.
37
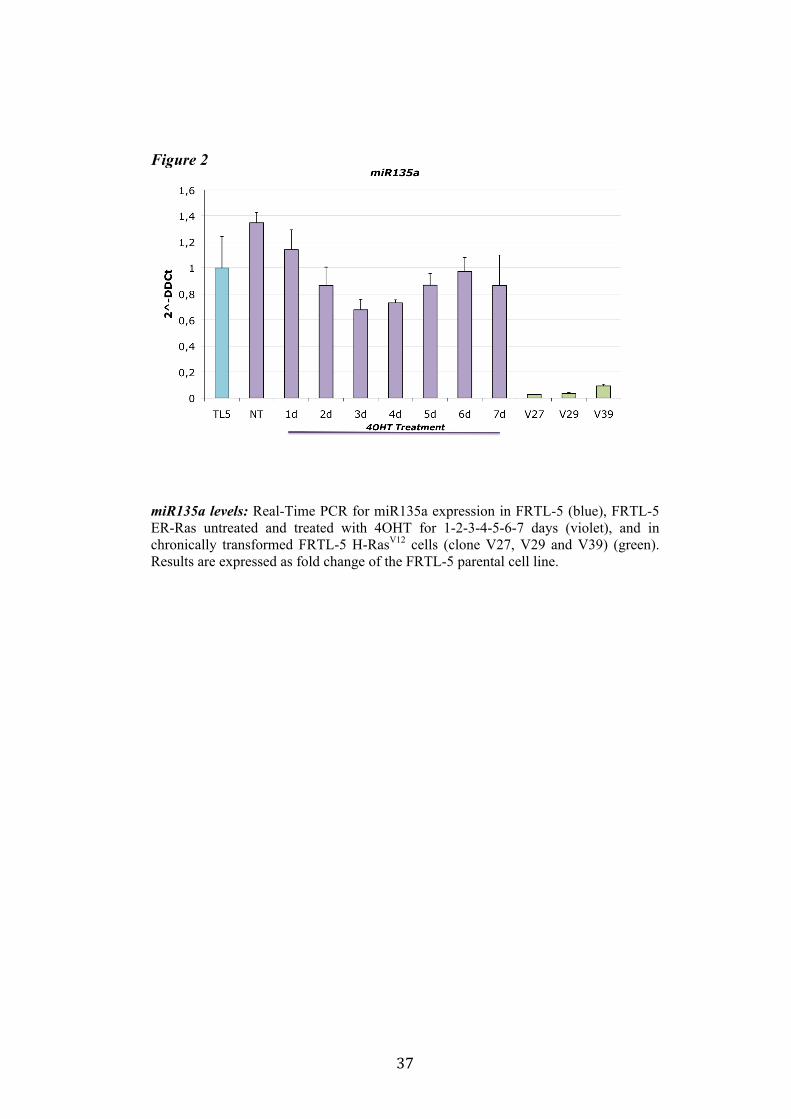
Figure 2
miR135a levels: Real-Time PCR for miR135a expression in FRTL-5 (blue), FRTL-5 ER-Ras untreated and treated with 4OHT for 1-2-3-4-5-6-7 days (violet), and in chronically transformed FRTL-5 H-RasV12 cells (clone V27, V29 and V39) (green). Results are expressed as fold change of the FRTL-5 parental cell line.

38
4.2 Generation of miR135a over expressing clones. As evident from the screening analysis miR135a was strongly down-regulated in chronically transformed FRTL-5 H-RasV12 cells (clone V27, V29, V39) (Figure 2). To explore a possible functional role to miR135a down-regulation we decided to stably transfect rat miR135a in FRTL-5 H-RasV12 clone V29. For this purpose the pre-miR135a sequence was amplified from rat genomic sequence and cloned in pCEFL-Neo expression vector between BamHI and NotI sites. FRTL-5 H-RasV12 cells were stably transfected with pCEFL-Neo-miR135a, and Neo-resistant clones were analyzed for miR135a expression by Real-Time PCR (Figure 3). Results are expressed as fold change of miR135a expression in FRTL-5 H-RasV12 clone V29 (Figure 3a) and as fold change of miR135a expression in FRTL-5 parental cell line (Figure 3b). From this analysis the miR135a results over express compared to FRTL-5 H-RasV12 clone V29, even though the levels of miR135a expression are not comparable to miR135a endogen expression in FRTL-5 cells. Figure 3
miR135a levels in FRTL-5 H-RasV12 miR135a clones: Real-Time PCR for miR135a expression in different FRTL-5 H-RasV12 miR135a clones. In fig. a) Results are expressed as a fold change of miR135a expression in FRTL-5 H-RasV12 clone V29. In fig. b) Results are expressed as a fold change of miR135a expression in FRTL-5 parental cell line.
b)
a)
39
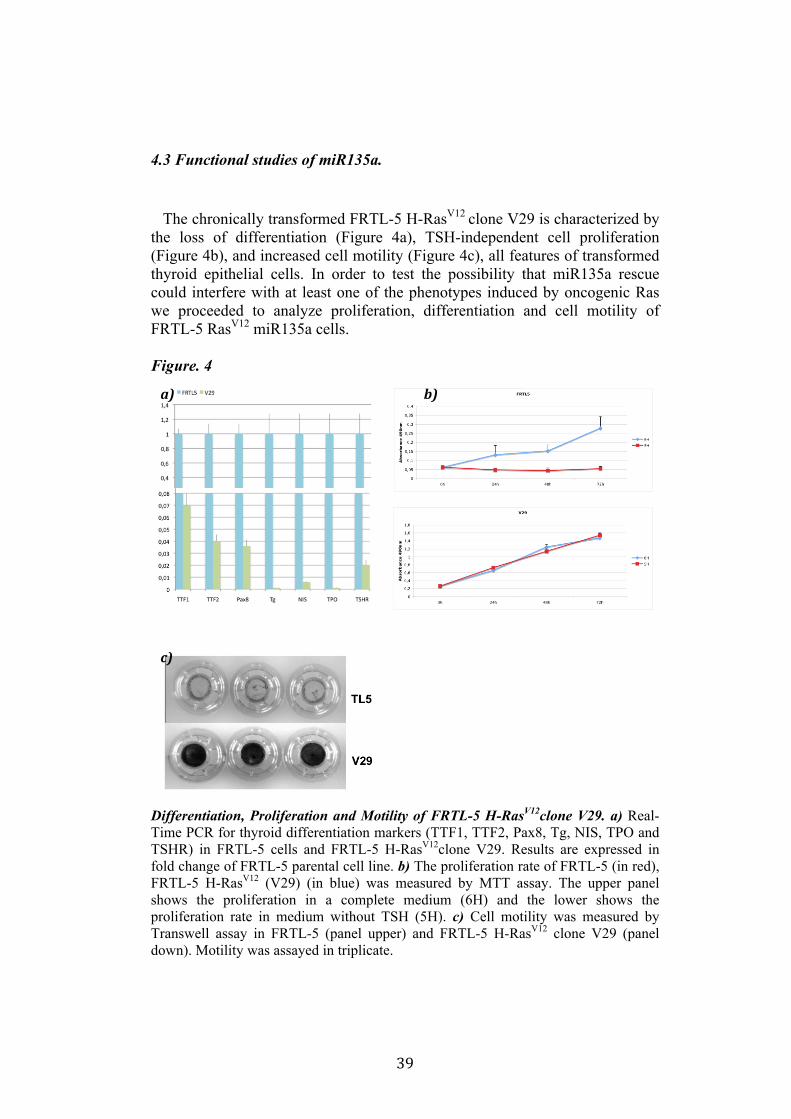
4.3 Functional studies of miR135a. The chronically transformed FRTL-5 H-RasV12 clone V29 is characterized by the loss of differentiation (Figure 4a), TSH-independent cell proliferation (Figure 4b), and increased cell motility (Figure 4c), all features of transformed thyroid epithelial cells. In order to test the possibility that miR135a rescue could interfere with at least one of the phenotypes induced by oncogenic Ras we proceeded to analyze proliferation, differentiation and cell motility of FRTL-5 RasV12 miR135a cells. Figure. 4
Differentiation, Proliferation and Motility of FRTL-5 H-RasV12clone V29. a) Real-Time PCR for thyroid differentiation markers (TTF1, TTF2, Pax8, Tg, NIS, TPO and TSHR) in FRTL-5 cells and FRTL-5 H-RasV12clone V29. Results are expressed in fold change of FRTL-5 parental cell line. b) The proliferation rate of FRTL-5 (in red), FRTL-5 H-RasV12 (V29) (in blue) was measured by MTT assay. The upper panel shows the proliferation in a complete medium (6H) and the lower shows the proliferation rate in medium without TSH (5H). c) Cell motility was measured by Transwell assay in FRTL-5 (panel upper) and FRTL-5 H-RasV12 clone V29 (panel down). Motility was assayed in triplicate.
a) b)
c)
40
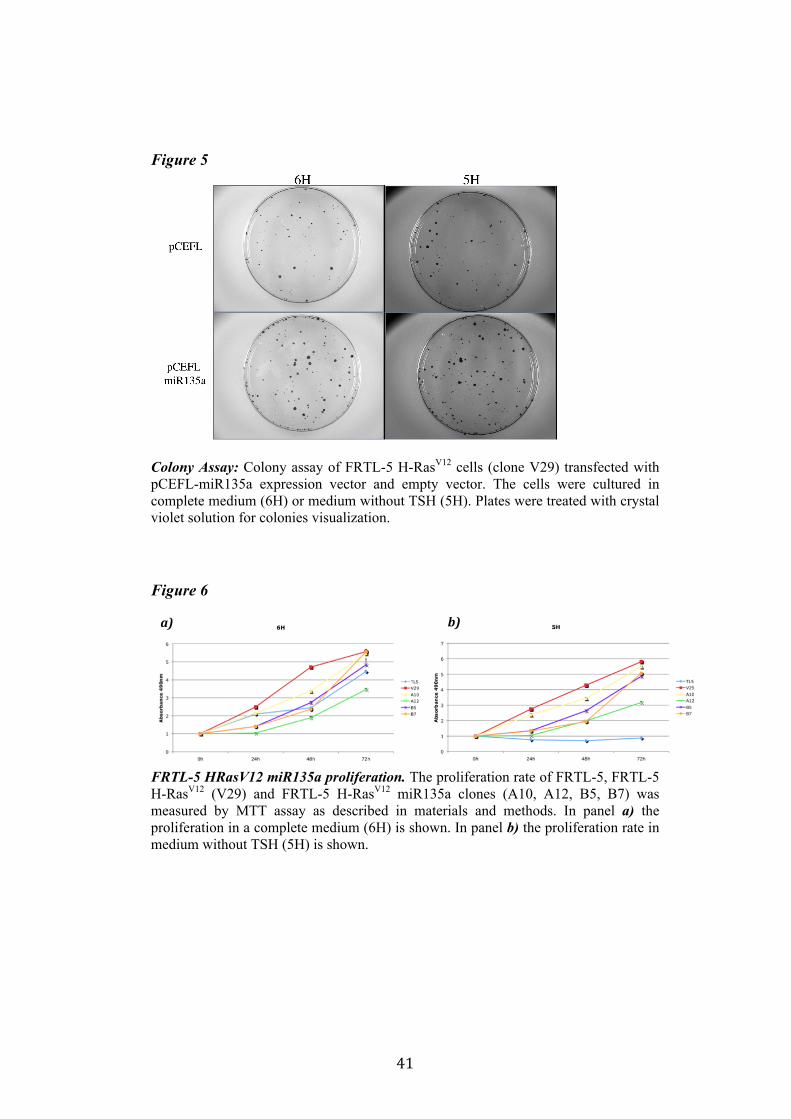
4.3. 1. miR135a and Proliferation One of the features of FRTL-5 H-RasV12 cells is the TSH-independent proliferation. We analyzed the capacity of proliferation of FRTL-5 H-RasV12 miR135a with two methods. In the colony assay FRTL-5 H-RasV12 cells were transfected with pCEFL-Neo-miR135a and empty vector, and were cultured in complete medium (6H) or medium without TSH (5H) to test whether miR135a is able to inhibit TSH-independent proliferation promoted by oncogenic H-RasV12 (figure 5). The colony assay did not highlight any significant differences in the proliferation rate of these cells, moreover there were not any differences even between proliferation in complete medium (6H) and medium without TSH (5H). The second method used to test proliferation was MMT assay described in materials and methods. We analyzed the proliferation rate of four FRTL-5 H-RasV12 miR135a clones (A10, A12, B5 and B7), as control we used FRTL-5 cells and FRTL-5 H-RasV12 clone V29. The assay showed that miR135a negatively influenced proliferation when compared to V29. However there were no evident differences in the proliferation between the two mediums: complete medium (6H) and medium without TSH (5H) (figure 6). Indeed none of these clones recovered completely its need of TSH. Suggesting that miR135a expression reduces cell proliferation but not specifically Ras-induced proliferation.
41
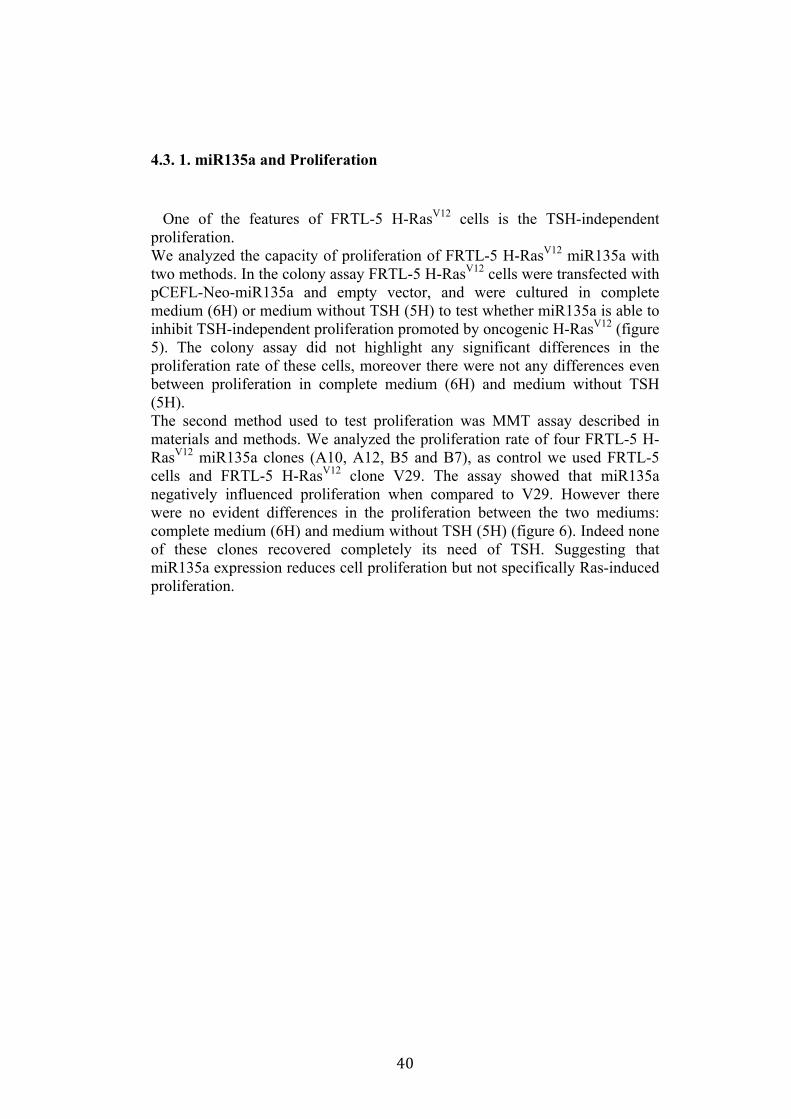
Figure 5
Colony Assay: Colony assay of FRTL-5 H-RasV12 cells (clone V29) transfected with pCEFL-miR135a expression vector and empty vector. The cells were cultured in complete medium (6H) or medium without TSH (5H). Plates were treated with crystal violet solution for colonies visualization. Figure 6
FRTL-5 HRasV12 miR135a proliferation. The proliferation rate of FRTL-5, FRTL-5 H-RasV12 (V29) and FRTL-5 H-RasV12 miR135a clones (A10, A12, B5, B7) was measured by MTT assay as described in materials and methods. In panel a) the proliferation in a complete medium (6H) is shown. In panel b) the proliferation rate in medium without TSH (5H) is shown.
a) b)
42
4.3. 2. miR135a and Differentiation. Oncogenic Ras induces the loss of differentiation of FRTL-5 cells. Indeed in V29 clone we can observe a significant decrease at both the mRNA and protein (where shown) level of several thyroid differentiation markers: thyroid transcription factors TTF1, TTF2, Pax8, thyroglobulin (Tg), TSH receptor (rTSH), sodium iodide symporter (NIS) and the thyroperoxidase (TPO). In order to establish if miR135a was able to affect the loss of differentiation induced by oncogenic Ras the state of differentiation of FRTL-5 H-RasV12 miR135a clones was analyzed both at the mRNA and protein level. By Real-Time PCR we measured TTF1, TTF2, Pax8, Tg, NIS, TSHr and TPO mRNA in four FRTL-5 H-RasV12 miR135a clones (A10, A12, B5 and B7 clones) expressing different levels of miR135a. The results were compared with the level of expression in both V29 clone and parental FRTL-5 cells (figure 7). Apparently in none of these clones there is evidence of a significant rescue of the above-mentioned thyroid differentiation markers. Similar results were obtained at the protein level by western blot. Indeed miR135a expression is not able to interfere with TTF1, TTF2, Pax8 and Tg protein down-regulation. In conclusion, we do not have evidence that supports the hypothesis of an involvement of miR135a in a loss of differentiation induced by Ras.

43
Figure 7
Differentiation in FRTL-5 H-RasV12 miR135a clones: Real-Time PCR for TTF1, TTF2, Pax8, Tg, NIS, TSHR and TPO in FRTL-5, FRTL-5 H-RasV12 and FRTL-5 H-RasV12 miR135a clones. TTF1, TTF2, Pax8 and Tg were analyzed also with western blot analysis. As control GAPDH was used as loading control.
44
4.3. 3. miR135a and Cell Motility. Since it is known that oncogenic Ras is involved in cell motility control we investigated also if miR135a can alterate the Ras-induced cell motility of FRTL-5 cells. To this purpose we tested the motility of four FRTL-5 RasV12 miR135a clones (A10, A12, B5 and B7) and we compared to both V29 and parental FRTL-5 cells. Cell migration was estimated by Transwell Assay described in materials and methods. Migrated cells were stained with crystal-violet solution (figure 8a). Quantification of migrated cells was obtained by destining with 1% SDS and reading the relative absorbance at 570nm (Figure 8b). In FRTL-5 parental cells line no motility was observed, they were used as negative control of migration, in FRTL-5 transformed by Ras (FRTL-5 H-RasV12) cells migration is visible indeed this clone was used as positive control of migration. In FRTL-5 H-RasV12 miR135a clones migration is slightly reduced respect to FRTL-5 H-RasV12 (V29 clone). Moreover it seems that cell motility impairment is related to the amount of miR135a, indeed A10 and A12, that express on higher amount of miR135a respect to B5 and B7 clones, shown a more significant reduction of cell motility (Figure 8).

45
Figure 8
FRTL-5 H-RasV12 miR135a Cell Motility. Cell motility was measured by Transwell assay. Motility was assayed in triplicate. In panel a) were shown the relative transwell after crystalviolet the parental cell line FRTL-5; FRTL-5 H-RasV12 (V29); FRTL-5 H-RasV12 miR135a clones (A10, A12, B5, B7). b) Quantification of the migrated cells performed with crystal violet solution. The results are expressed as relative absorbance at 570nm.
a)
b)
46
In conclusion the chronically transformed FRTL-5 H-RasV12 clone V29 is characterized by loss of differentiation, TSH-independent cell proliferation, and increased cell motility, all features of transformed thyroid epithelial cells. These cells express very low levels of miR135a. We tested the possibility that miR135a rescue could interfere with at least one of the phenotypes induced by oncogenic Ras. To this purpose we analyzed proliferation, differentiation and cell motility of FRTL-5 RasV12 miR135a cells. We observed a moderate reduction of proliferation and migration in miR135a clones compared to FRTL-5 RasV12. This reduction of proliferation and migration are not so strong, for this reason we decided to analyze the over-expression of the microRNA in exam in miR135a clones compared to FRTL-5 parental cell line by Real-Time PCR analysis. Results are expressed as fold change of miR135a expression in FRTL-5 parental cell line (Figure 3b). From this analysis results, none of the analyzed clones express miR135a at a level at least comparable to the endogenous miR135a in the parental FRTL-5 cells. This observation leads to the possibility that the mild effects observed on proliferation and migration of miR135a clones could be a consequence of the low over-expression of miR135a achieved. A possible explanation of this phenomenon could be that co-expression of oncogenic Ras and high levels miR135a is not compatible with survival, leading to a selection of clones that express only low levels of miR135a.
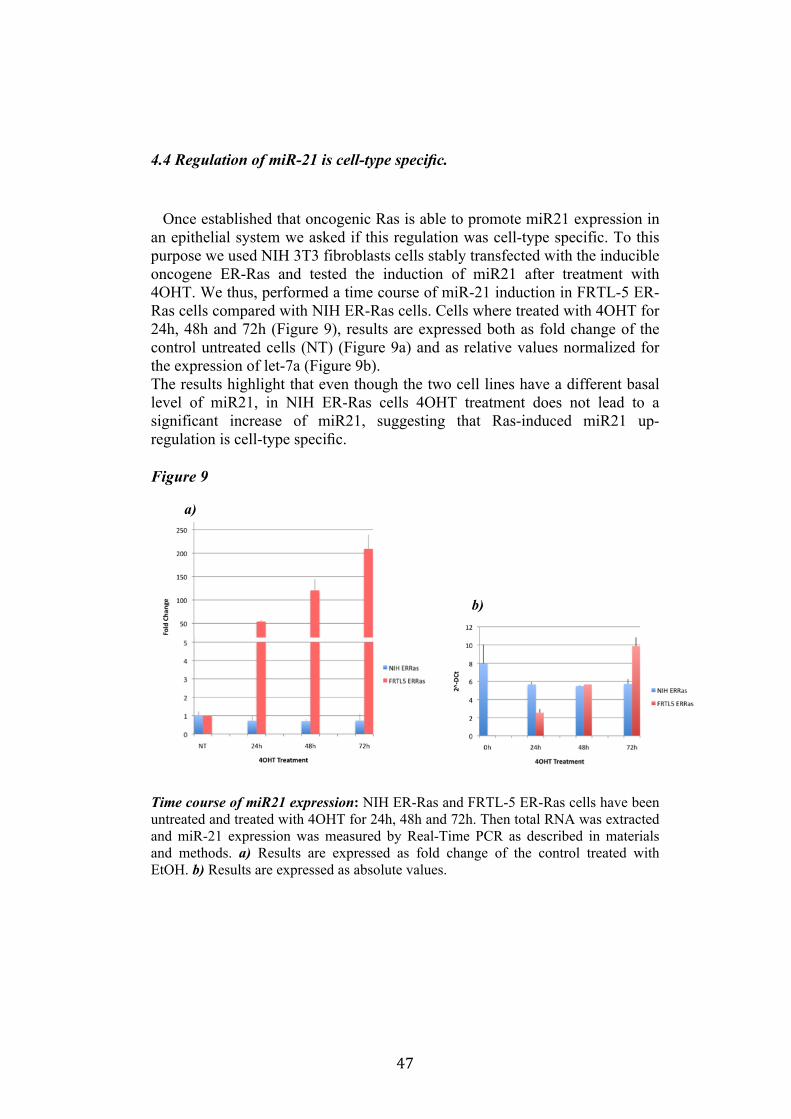
47
4.4 Regulation of miR-21 is cell-type specific. Once established that oncogenic Ras is able to promote miR21 expression in an epithelial system we asked if this regulation was cell-type specific. To this purpose we used NIH 3T3 fibroblasts cells stably transfected with the inducible oncogene ER-Ras and tested the induction of miR21 after treatment with 4OHT. We thus, performed a time course of miR-21 induction in FRTL-5 ER-Ras cells compared with NIH ER-Ras cells. Cells where treated with 4OHT for 24h, 48h and 72h (Figure 9), results are expressed both as fold change of the control untreated cells (NT) (Figure 9a) and as relative values normalized for the expression of let-7a (Figure 9b). The results highlight that even though the two cell lines have a different basal level of miR21, in NIH ER-Ras cells 4OHT treatment does not lead to a significant increase of miR21, suggesting that Ras-induced miR21 up-regulation is cell-type specific. Figure 9
Time course of miR21 expression: NIH ER-Ras and FRTL-5 ER-Ras cells have been untreated and treated with 4OHT for 24h, 48h and 72h. Then total RNA was extracted and miR-21 expression was measured by Real-Time PCR as described in materials and methods. a) Results are expressed as fold change of the control treated with EtOH. b) Results are expressed as absolute values.
a)
b)
48
4.5 miR21 induction by Ras in FRTL-5 is mediated by transcriptional regulation. Once established the effects of oncogenic Ras on miR21 expression the next step was to study the mechanism through which this regulation takes place. We investigated if the induction of miR21 after Ras activation is a transcriptional phenomenon. For this purpose we measured, by Real-Time PCR, the levels of primiR21, using both the FRTL-5 ER-Ras and NIH ER-Ras cells. We performed a time course of primiR-21 induction in FRTL-5 ER-Ras cells compared with NIH ER-Ras cells. Both inducible systems where treated with 4OHT for 24h, 48h and 72h (Figure 10). Results are expressed as fold change of the untreated control cells (Figure 10a) relative values normalized for the expression of tubulin (Figure 10b). The kinetics of induction of primiR-21 expression by Ras is different in the two cell systems: in FRTL-5 ER-Ras cells induction of primiR-21 is significantly higher compared to NIH ER-Ras cells. primiR21 expression levels in NIH ER-Ras cells are similar to untreated NIH ER-Ras cells. primiR21 expression in FRTL-5 ER-Ras is strongly induced already after 24h of treatment with 4OHT (Figure 10). This data suggests that primiR21 induction by Ras in FRTL-5 cells is a transcriptional phenomenon. To confirm this data we performed a Chromatin Immuno-precipitation (ChIP) on FRTL-5 ER-Ras cells. We measured RNA polymerase II occupancy of the miR21 promoter sequence in FRTL-5 ER-Ras cells after activation of Ras oncoprotein with 4OHT treatment for 24h (Figure 11). To measure the levels of RNA Pol II associated with miR21 promoter we used a specific antibody against RNA Pol II (RNPII) as negative control Chromatin-IP was performed in absence of antibody (No Ab). Immuno-precipitated DNA was measured by Real-Time PCR and was reported as percentage of Input DNA. This assay shows that the amount of RNA Polymerase II bound to miR21 promoter increases after oncogenic Ras expression. These results are consistent with primR21 increase previously observed and indicate that oncogenic Ras rapidly activates miR21 transcription.

49
Figure 10
Time course of pri-miR21 expression: NIH ER-Ras and FRTL-5 ER-Ras cells have been untreated and treated with 4OHT for 24h, 48h, 72h. Then total RNA was extracted and pri-miR-21 expression was measured by Real-Time PCR as described in materials and methods. a) Results are expressed as fold change of the control treated with EtOH. b) Results are expressed as absolute values. Figure 11
miR21 transcription measurement: FRTL-5 ER-Ras were treated with 4OHT for 24h. miR21 transcription was measured by performing a Chromatin-IP with RNA Polimerasi II antibody (RNPII) as described in materials and methods. As negative control a Chromatin-IP was performer in the absence of any antibody (No Ab). Immuno-precipitaded DNA was measured by Real-Time PCR and is reported as percentage of Input DNA.
b)
a)
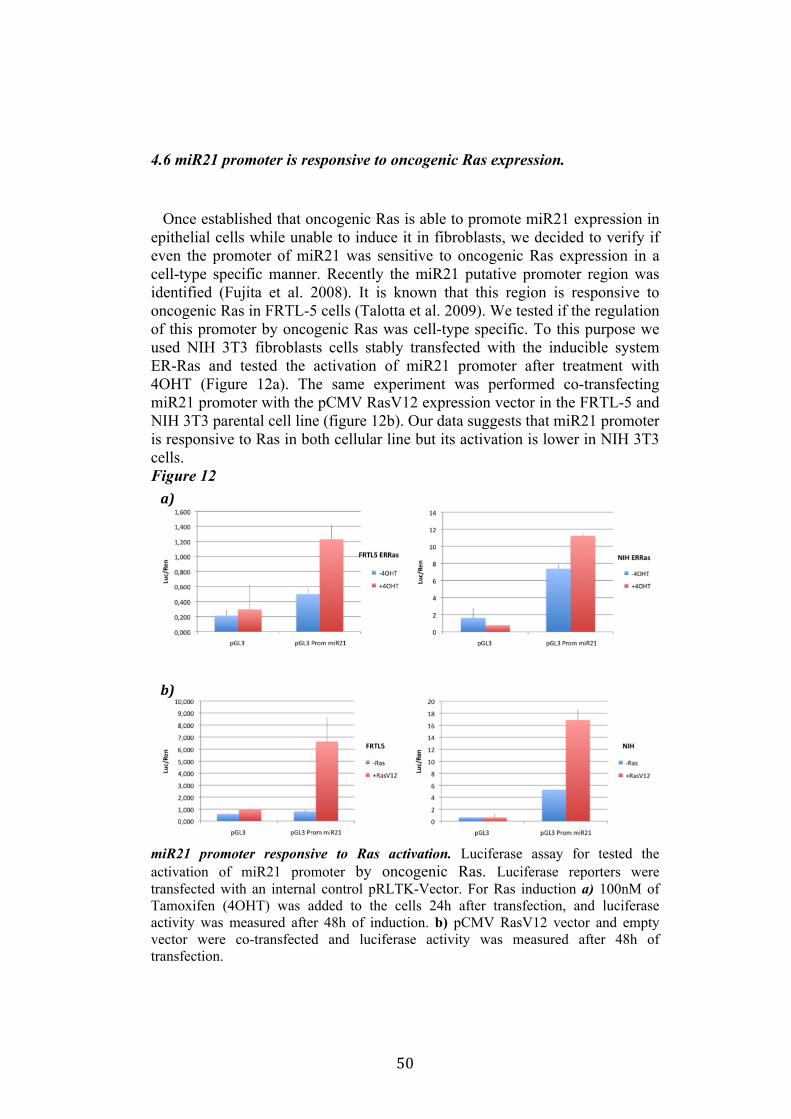
50
4.6 miR21 promoter is responsive to oncogenic Ras expression. Once established that oncogenic Ras is able to promote miR21 expression in epithelial cells while unable to induce it in fibroblasts, we decided to verify if even the promoter of miR21 was sensitive to oncogenic Ras expression in a cell-type specific manner. Recently the miR21 putative promoter region was identified (Fujita et al. 2008). It is known that this region is responsive to oncogenic Ras in FRTL-5 cells (Talotta et al. 2009). We tested if the regulation of this promoter by oncogenic Ras was cell-type specific. To this purpose we used NIH 3T3 fibroblasts cells stably transfected with the inducible system ER-Ras and tested the activation of miR21 promoter after treatment with 4OHT (Figure 12a). The same experiment was performed co-transfecting miR21 promoter with the pCMV RasV12 expression vector in the FRTL-5 and NIH 3T3 parental cell line (figure 12b). Our data suggests that miR21 promoter is responsive to Ras in both cellular line but its activation is lower in NIH 3T3 cells. Figure 12
miR21 promoter responsive to Ras activation. Luciferase assay for tested the activation of miR21 promoter by oncogenic Ras. Luciferase reporters were transfected with an internal control pRLTK-Vector. For Ras induction a) 100nM of Tamoxifen (4OHT) was added to the cells 24h after transfection, and luciferase activity was measured after 48h of induction. b) pCMV RasV12 vector and empty vector were co-transfected and luciferase activity was measured after 48h of transfection.
a)
b)
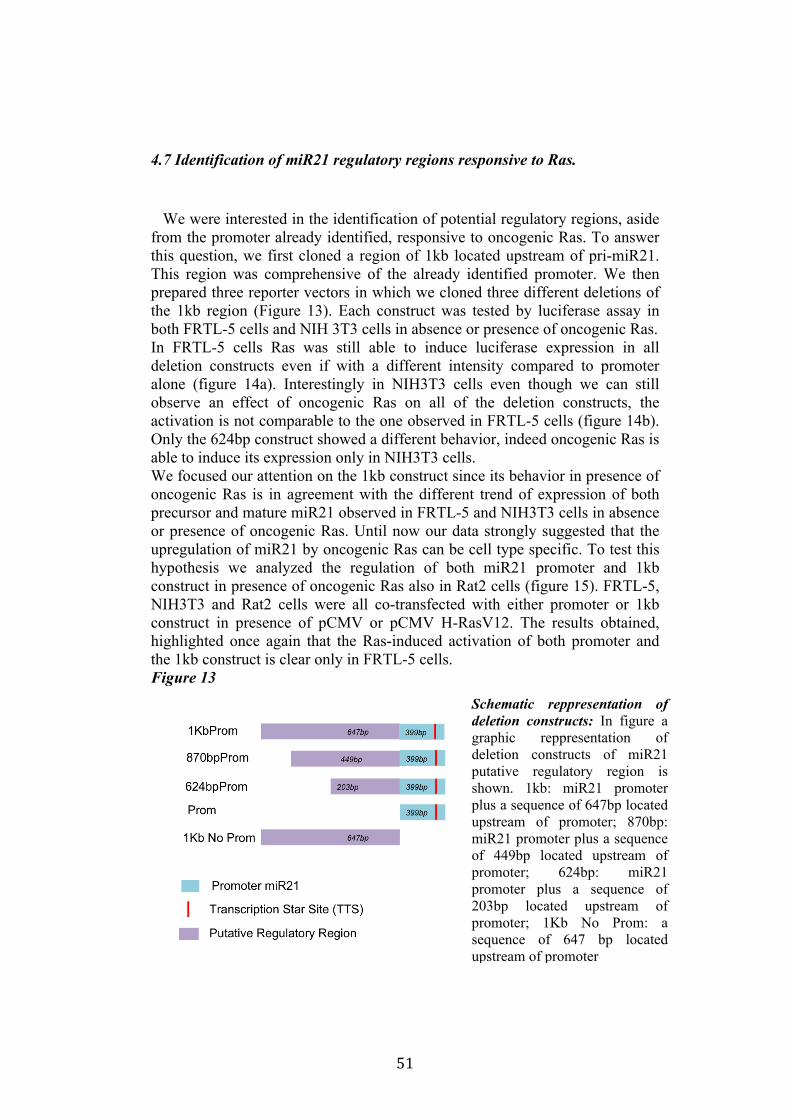
51
4.7 Identification of miR21 regulatory regions responsive to Ras. We were interested in the identification of potential regulatory regions, aside from the promoter already identified, responsive to oncogenic Ras. To answer this question, we first cloned a region of 1kb located upstream of pri-miR21. This region was comprehensive of the already identified promoter. We then prepared three reporter vectors in which we cloned three different deletions of the 1kb region (Figure 13). Each construct was tested by luciferase assay in both FRTL-5 cells and NIH 3T3 cells in absence or presence of oncogenic Ras. In FRTL-5 cells Ras was still able to induce luciferase expression in all deletion constructs even if with a different intensity compared to promoter alone (figure 14a). Interestingly in NIH3T3 cells even though we can still observe an effect of oncogenic Ras on all of the deletion constructs, the activation is not comparable to the one observed in FRTL-5 cells (figure 14b). Only the 624bp construct showed a different behavior, indeed oncogenic Ras is able to induce its expression only in NIH3T3 cells. We focused our attention on the 1kb construct since its behavior in presence of oncogenic Ras is in agreement with the different trend of expression of both precursor and mature miR21 observed in FRTL-5 and NIH3T3 cells in absence or presence of oncogenic Ras. Until now our data strongly suggested that the upregulation of miR21 by oncogenic Ras can be cell type specific. To test this hypothesis we analyzed the regulation of both miR21 promoter and 1kb construct in presence of oncogenic Ras also in Rat2 cells (figure 15). FRTL-5, NIH3T3 and Rat2 cells were all co-transfected with either promoter or 1kb construct in presence of pCMV or pCMV H-RasV12. The results obtained, highlighted once again that the Ras-induced activation of both promoter and the 1kb construct is clear only in FRTL-5 cells. Figure 13
Schematic reppresentation of deletion constructs: In figure a graphic reppresentation of deletion constructs of miR21 putative regulatory region is shown. 1kb: miR21 promoter plus a sequence of 647bp located upstream of promoter; 870bp: miR21 promoter plus a sequence of 449bp located upstream of promoter; 624bp: miR21 promoter plus a sequence of 203bp located upstream of promoter; 1Kb No Prom: a sequence of 647 bp located upstream of promoter
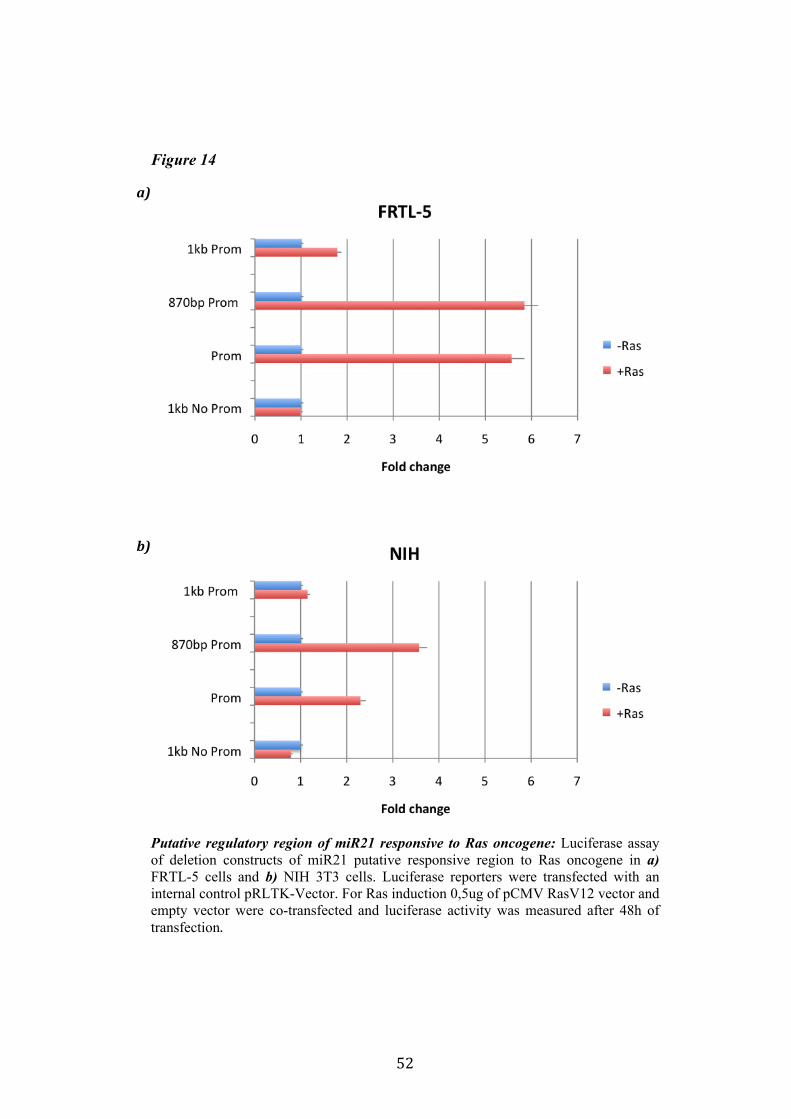
52
Figure 14
Putative regulatory region of miR21 responsive to Ras oncogene: Luciferase assay of deletion constructs of miR21 putative responsive region to Ras oncogene in a) FRTL-5 cells and b) NIH 3T3 cells. Luciferase reporters were transfected with an internal control pRLTK-Vector. For Ras induction 0,5ug of pCMV RasV12 vector and empty vector were co-transfected and luciferase activity was measured after 48h of transfection.
a)
b)
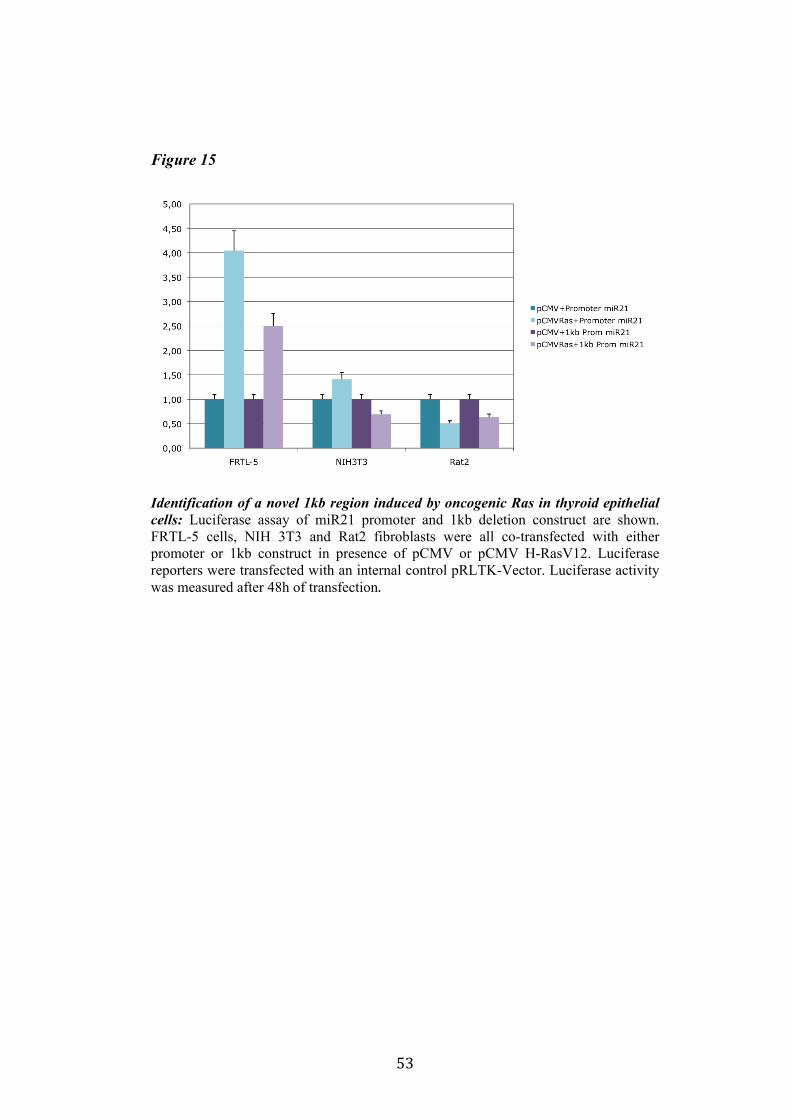
53
Figure 15
Identification of a novel 1kb region induced by oncogenic Ras in thyroid epithelial cells: Luciferase assay of miR21 promoter and 1kb deletion construct are shown. FRTL-5 cells, NIH 3T3 and Rat2 fibroblasts were all co-transfected with either promoter or 1kb construct in presence of pCMV or pCMV H-RasV12. Luciferase reporters were transfected with an internal control pRLTK-Vector. Luciferase activity was measured after 48h of transfection.

54
5. Conclusion
Previous results highlighted that Ras is able to induce aberrant expression of microRNAs during the transformation of thyroid epithelial cells. We decided to study the miRNAs involved in Ras-induced transformation. The aim of my project was to identify Ras-regulated miRNAs and study their role in transformation of thyroid epithelial cells. From our studies miR135a and miR21resulted strongly regulated by Ras: miR135a is down-regulated while miR21 is upregulated. The functional studies performed on FRTL-5 H-RasV12 miR135a overexpressing clones highlighted that even though the rescue of miR135a is not sufficient to re-establish the TSH dependency, we can still observe a significant reduction of the proliferation rate when compared to the parental FRTL-5 H-RasV12 cells. Also for what concerns cell migration miR135a overexpressing clones display a light reduction of the motility when compared to FRTL-5 H-RasV12 cells. These promising but mild effect could be due to the low level of over expression of miR135a obtained in FRTL-5 H-RasV12 cells when compared with wild type FRTL-5 cells. Our hypothesis is that high levels of miR135a and oncogenic Ras are not compatible. For this reason we are currently stably transfecting miR135a in FRTL-5 ER-Ras cells where oncogenic Ras expression is strictly dependent on 4OHT treatment. For what concerns miR21 regulation both real time analysis of the miR21 precursor (primiR21) and PolII chromatin immunoprecipitation suggests that the upregulation of miR21 induced by oncogenic Ras occurs at a transcriptional level. Moreover we were not able to detect any significant Ras-dependent upregulation of miR21 in NIH3T3 cells suggesting a possible cell-type specific regulation. Furthermore the analysis of the upstream region of the miR21 promoter led us to the identification of a novel 1kb region induced by oncogenic Ras. Interestingly this region seems to be positively regulated by Ras only in FRTL-5 indeed both in Rat2 and NIH3T3 cells Ras is not able to induce the 1kb region. In conclusion our results strongly suggest that Ras is promoting miR21 at a transcriptional level and that this regulation could be cell-type specific.
55
6. Bibliography
Ambesi-Impiombato FS, Parks LA, Coon HG (1980). Culture of hormone-dependent functional epithelial cells from rat thyroids. Proceedings of the National Academy of Sciences of the United States of America 77:3455-3459. Ambros,V., Bartel,B., Bartel,D.P., Burge,C.B., Carrington,J.C., Chen,X., Dreyfuss,G., Eddy,S.R., Griffiths-Jones,S., Marshall,M., Matzke,M., Ruvkun,G., and Tuschl,T. (2003). A uniform system for microRNA annotation. RNA. 9, 277-279. Ambros,V., Lee,R.C., Lavanway,A., Williams,P.T., and Jewell,D. (2003). MicroRNAs and other tiny endogenous RNAs in C. elegans. Curr. Biol. 13, 807-818. Aravin,A.A., Hannon,G.J., and Brennecke,J. (2007). The Piwi-piRNA pathway provides an adaptive defense in the transposon arms race. Science. 318, 761-764. Bartel,D.P. (2004). MicroRNAs: genomics, biogenesis, mechanism, and function. Cell 116, 281-297. Bartel D. P. and Chen C.-Z., (2004). Micromanagers of gene expression: the potentially widespread influence of metazoan microRNAs, Nat. Rev. Genet. 5 pp. 396–400. Baskerville,S. and Bartel,D.P. (2005). Microarray profiling of microRNAs reveals frequent coexpression with neighboring miRNAs and host genes. RNA. 11, 241-247. Basyuk,E., Suavet,F., Doglio,A., Bordonne,R., and Bertrand,E. (2003). Human let-7 stem-loop precursors harbor features of RNase III cleavage products. Nucleic Acids Res. 31, 6593-6597. Berezikov,E., Chung,W.J., Willis,J., Cuppen,E., and Lai,E.C. (2007). Mammalian mirtron genes. Mol. Cell. 28, 328-336. Bernstein,E., Caudy,A.A., Hammond,S.M., and Hannon,G.J. (2001). Role for a bidentate ribonuclease in the initiation step of RNA interference. Nature. 409, 363-366. Bodemann BO, White MA. (2008). Ral GTPases and cancer: linchpin support
56
of the tumorigenic platform. Nat Rev Cancer. 8(2):133-40.
Calin GA, Dumitru CD, Shimizu M, Bichi R, Zupo S, Noch E, Aldler H, Rattan S, Keating M, Rai K, Rassenti L, Kipps T, Negrini M, Bullrich F, Croce CM. (2002). Frequent deletions and down-regulationof micro-RNA genes miR15 and miR16 at 13q14 in chronic lymphocytic leukemia. Proc Natl Acad Sci U S A. 99(24):15524-9.
Carmell,M.A., Xuan,Z., Zhang,M.Q., and Hannon,G.J. (2002). The Argonaute family: tentacles that reach into RNAi, developmental control, stem cell maintenance, and tumorigenesis. Genes Dev. 16, 2733-2742. Carthew,R.W. (2006). Gene regulation by microRNAs. Curr. Opin. Genet. Dev. 16, 203-208. Chen YT, Kitabayashi N, Zhou XK, Fahey TJ III, Scognamiglio T. (2008). MicroRNA analysis as a potential diagnostic tool for papillary thyroid carcinoma. Mod Pathol 21(9):1139–46. Cobellis G, Missero C, Di Lauro R (1998). Concomitant activation of MEK-1 and Rac-1 increases the proliferative potential of thyroid epithelial cells, without affecting their differentiation. Oncogene 17:2047-2057 Cullen,B.R. (2004). Transcription and processing of human microRNA precursors. Mol. Cell 16, 861-865. De Vita G, Bauer L, da Costa VM, De Felice M, Baratta MG, De Menna M, Di Lauro R. (2005) Dose-dependent inhibition of thyroid differentiation by RAS oncogenes. Molecular endocrinology (Baltimore, Md 19:76-89) Downward J (2003). Targeting RAS signalling pathways in cancer therapy. Nature reviews 3:11-22 Esquela-Kerscher,A. and Slack,F.J. (2006). Oncomirs - microRNAs with a role in cancer. Nat. Rev. Cancer. 6, 259-269. Filipowicz,W., Jaskiewicz,L., Kolb,F.A., and Pillai,R.S. (2005). Post- transcriptional gene silencing by siRNAs and miRNAs. Curr. Opin. Struct. Biol. 15, 331-341. Fire,A., Xu,S., Montgomery,M.K., Kostas,S.A., Driver,S.E., and Mello,C.C. (1998). Potent and specific genetic interference by double- stranded RNA in Caenorhabditis elegans. Nature. 19;391, 806-811.

57
Francis-Lang H, Zannini M, De Felice M, Berlingieri MT, Fusco A, Di Lauro R (1992). Multiple mechanisms of interference between transformation and differentiation in thyroid cells. Molecular and cellular biology 12:5793-5800 Frezzetti D, De Menna M, Zoppoli P, Guerra C, Ferraro A, Bello AM, De Luca P, Calabrese C, Ceccarelli M, Zollo M, Barbacid M, Di Lauro R and De Vita G. (2010) Up regulation of miR-21 by Ras in vivo and its role in tumor growth. Oncogene 1-11. Fujita S, Ito T, Mizutani T, Minoguchi S, Yamamichi N, Sakurai K, Iba H. (2008) miR-21 Gene expression triggered by AP-1 is sustained through a double-negative feedback mechanismJ Mol Biol. 378(3):492-504. Fusco A, Berlingieri MT, Di Fiore PP, Portella G, Grieco M, Vecchio G (1987). One- and two-step transformations of rat thyroid epithelial cells by retroviral oncogenes. Molecular and cellular biology 7:3365-3370 Garcia-Rostan G, Zhao H, Camp RL, Pollan M, Herrero A, Pardo J, Wu R, Carcangiu ML, Costa J, Tallini G (2003) ras mutations are associated with aggressive tumor phenotypes and poor prognosis in thyroid cancer. J Clin Oncol 21:3226-3235 Gimm O 2001 Thyroid cancer. Cancer letters 163:143-156 Han,J., Lee,Y., Yeom,K.H., Kim,Y.K., Jin,H., and Kim,V.N. (2004). The Drosha-DGCR8 complex in primary microRNA processing. Genes Dev. 18, 3016-3027. Han,J., Lee,Y., Yeom,K.H., Nam,J.W., Heo,I., Rhee,J.K., Sohn,S.Y., Cho,Y., Zhang,B.T., and Kim,V.N. (2006). Molecular basis for the recognition of primary microRNAs by the Drosha-DGCR8 complex. Cell 125, 887-901. He H, Jazdzewski K, Li W, Liyanarachchi S, Nagy R, Volinia S, Calin GA, Liu CG, Franssila K, Suster S, Kloos RT, Croce CM, de la Chapelle A. (2005).The role of microRNA genes in papillary thyroid carcinoma. Proc Natl Acad Sci U S A 102(52):19075–80. Hirokawa M, Carney JA, Goellner JR, DeLellis RA, Heffess CS, Katoh R, Tsujimoto M, Kakudo K. (2002). Observer variation of encapsulated follicular lesions of the thyroid gland. The American journal of surgical pathology 26:1508-1514. Horie H, Yokogoshi Y, Tsuyuguchi M, Saito S. (1995). Point mutations of ras and Gs alpha subunit genes in thyroid tumors. Jpn J Cancer Res 86:737-742.
58
John,B., Enright,A.J., Aravin,A., Tuschl,T., Sander,C., and Marks,D.S. (2004). Human MicroRNA targets. PLoS. Biol. 2, e363. Karnoub AE, Weinberg RA (2008) Ras oncogenes: split personalities. Nature reviews 9:517-531. Kim,V.N. (2006). Small RNAs just got bigger: Piwi-interacting RNAs (piRNAs) in mammalian testes. Genes Dev. 20, 1993-1997. Kondo T, Ezzat S, Asa SL (2006). Pathogenetic mechanisms in thyroid follicular-cell neoplasia. Nature reviews 6:292-306. Krauss G ed. (2001) Biochemistry of signal transduction and regulation. Lagos-Quintana,M., Rauhut,R., Meyer,J., Borkhardt,A., and Tuschl,T. (2003). New microRNAs from mouse and human. RNA. 9, 175-179. Lai,E.C. (2002). Micro RNAs are complementary to 3' UTR sequence motifs that mediate negative post-transcriptional regulation. Nat. Genet. 30, 363-364. Landgraf P, Rusu M, Sheridan R, Sewer A, Iovino N, Aravin A, Pfeffer S, Rice A, Kamphorst A O., Landthaler M, Lin C, Socci N D., Hermida L, Fulci V, Chiaretti S, Foa R̀, Schliwka J, Fuchs U, Novosel A, Muller R-U, Schermer B, Bissels U, Inman J, Phan Q, Chien M, Weir D B., Choksi R, De Vita G, Frezzetti D, Trompeter H-I, Hornung V, Teng G, Hartmann G, Palkovits M, Di Lauro R, Wernet P, Macino G, Rogler C E., Nagle J W., Ju J, Papavasiliou F.N, Benzing T, Lichter P, Tam W, Brownstein M J., Bosio A, Borkhardt A, Russo J J., Sander C, Zavolan M and Tuschl T. (2007). A mammalian microRNA expression altas based on small RNA library sequencing. Cell 129: 1401-1414. Lee,R.C., Feinbaum,R.L., and Ambros,V. (1993). The C. elegans heterochronic gene lin-4 encodes small RNAs with antisense complementarity to lin-14. Cell 75, 843-854. Lee,Y., Kim,M., Han,J., Yeom,K.H., Lee,S., Baek,S.H., and Kim,V.N. (2004). MicroRNA genes are transcribed by RNA polymerase II. EMBO J. 23, 4051-4060. Lemoine NR, Mayall ES, Wyllie FS, Farr CJ, Hughes D, Padua RA, Thurston V, Williams ED, Wynford-Thomas D (1988). Activated ras oncogenes in human thyroid cancers. Cancer research 48:4459-4463. Lindbo,J.A., Silva-Rosales,L., Proebsting,W.M., and Dougherty,W.G. (1993). Induction of a Highly Specific Antiviral State in Transgenic Plants:

59
Implications for Regulation of Gene Expression and Virus Resistance. Plant Cell. 5, 1749-1759. Lingel,A., Simon,B., Izaurralde,E., and Sattler,M. (2004). Nucleic acid 3'- end recognition by the Argonaute2 PAZ domain. Nat. Struct. Mol. Biol. 11, 576-577. Liu,J., Carmell,M.A., Rivas,F.V., Marsden,C.G., Thomson,J.M., Song,J.J., Hammond,S.M., Joshua-Tor,L., and Hannon,G.J. (2004). Argonaute2 is the catalytic engine of mammalian RNAi. Science. 305, 1437-1441. Lloyd RV, Erickson LA, Casey MB, Lam KY, Lohse CM, Asa SL, Chan JK, DeLellis RA, Harach HR, Kakudo K, LiVolsi VA, Rosai J, Sebo TJ, Sobrinho-Simoes M, Wenig BM, Lae ME (2004). Observer variation in the diagnosis of follicular variant of papillary thyroid carcinoma. The American journal of surgical pathology 28:1336- 1340. Malumbres M, Barbacid M (2003). RAS oncogenes: the first 30 years. Nature reviews 3:459-465. Martinez,J. and Tuschl,T. (2004). RISC is a 5' phosphomonoester- producing RNA endonuclease. Genes Dev. 18, 975-980. Mercer KE, Pritchard CA (2003) Raf proteins and cancer: B-Raf is identified as a mutational target. Biochimica et biophysica acta 1653:25-40. Missero C, Pirro MT, Di Lauro R (2000). Multiple ras downstream pathways mediate functional repression of the homeobox gene product TTF-1. Molecular and cellular biology 20:2783-2793. Mourelatos,Z., Dostie,J., Paushkin,S., Sharma,A., Charroux,B., Abel,L., Rappsilber,J., Mann,M., and Dreyfuss,G. (2002). miRNPs: a novel class of ribonucleoproteins containing numerous microRNAs. Genes Dev. 16, 720-728. Nikiforova MN, Nikiforov YE. (2008). Molecular genetics of thyroid cancer: implications for diagnosis, treatment and prognosis. Expert Rev Mol Diagn 8(1):83–95. Nikiforova MN, Tseng GC, Steward D, Diorio D, Nikiforov YE. (2008). MicroRNA Expression Profiling of Thyroid Tumors: Biological Significance and Diagnostic Utility. J Clin Endocrinol Metab 93(5):1600–8. Nottrott,S., Simard,M.J., and Richter,J.D. (2006). Human let-7a miRNA blocks protein production on actively translating polyribosomes. Nat. Struct. Mol. Biol. 13, 1108-1114.
60
Novina,C.D. and Sharp,P.A. (2004). The RNAi revolution. Nature 430, 161-164. O'Donnell KA, Wentzel EA, Zeller KI, Dang CV, Mendell JT (2005). c-Myc-regulated microRNAs modulate E2F1 expression, Nature 435, pp. 839–843. Okamura,K., Hagen,J.W., Duan,H., Tyler,D.M., and Lai,E.C. (2007). The mirtron pathway generates microRNA-class regulatory RNAs in Drosophila. Cell. 130, 89-100. Pallante P, Visone R, Ferracin M, Ferraro A, Berlingieri MT, Troncone G, Chiappetta G, Liu CG, Santoro M, Negrini M, Croce CM, Fusco A. (2006). MicroRNA deregulation in human thyroid papillary carcinomas. Endocr Relat Cancer 13(2):497–508, 2006. Petersen,C.P., Bordeleau,M.E., Pelletier,J., and Sharp,P.A. (2006). Short RNAs repress translation after initiation in mammalian cells. Mol. Cell. 21, 533-542. Pilotti S, Collini P, Mariani L, Placucci M, Bongarzone I, Vigneri P, Cipriani S, Falcetta F, Miceli R, Pierotti MA, Rilke F (1997). Insular carcinoma: a distinct de novo entity among follicular carcinomas of the thyroid gland. The American journal of surgical pathology 21:1466-1473. Prior IA, Hancock JF (2001). Compartmentalization of Ras proteins. Journal of cell science 114:1603-1608. Provost,P., Dishart,D., Doucet,J., Frendewey,D., Samuelsson,B., and Radmark,O. (2002). Ribonuclease activity and RNA binding of recombinant human Dicer. EMBO J. 21, 5864-5874. Rajewsky,N. (2006). microRNA target predictions in animals. Nat. Genet. 38 Suppl:S8-13., S8-13. Repasky GA, Chenette EJ, Der CJ (2004). Renewing the conspiracy theory debate: does Raf function alone to mediate Ras oncogenesis? Trends in cell biology 14:639-647. Rodriguez,A., Griffiths-Jones,S., Ashurst,J.L., and Bradley,A. (2004). Identification of mammalian microRNA host genes and transcription units. Genome Res. 14, 1902-1910. Ruby,J.G., Jan,C.H., and Bartel,D.P. (2007). Intronic microRNA precursors that bypass Drosha processing. Nature. 448, 83-86.
61
Saito Y, Liang G, Egger G, Friedman JM, Chuang JC, Coetzee GA, Jones PA. (2006). Specific activation of microRNA-127 with downregulation of the proto-oncogene BCL6 by chromatin-modifying drugs in human cancer cells, Cancer Cell 9, pp. 435–443. Salajegheh A, Petcu EB, Smith RA, Lam AK (2008) Follicular variant of papillary thyroid carcinoma: a diagnostic challenge for clinicians and pathologists. Postgraduate medical journal 84:78-82. Schreck R, Rapp UR (2006) Raf kinases: oncogenesis and drug discovery. International journal of cancer 119:2261-2271. Schubbert S, Shannon K, Bollag G (2007) Hyperactive Ras in developmental disorders and cancer. Nature reviews 7:295-308. Schulze A, Lehmann K, Jefferies HB, McMahon M, Downward J (2001) Analysis of the transcriptional program induced by Raf in epithelial cells. Genes & development 15:981-994. Seggerson,K., Tang,L., and Moss,E.G. (2002). Two genetic circuits repress the Caenorhabditis elegans heterochronic gene lin-28 after translation initiation. Dev. Biol. 243, 215-225. Seike M, Goto A, Okano T, Bowman ED, Schetter AJ, Horikawa I, Mathe EA, Jen J, Yang P, Sugimura H, Gemma A, Kudoh S, Croce CM, Harris CC. (2009). MiR-21 is an EGFR-regulated anti-apoptotic factor in lung cancer in never-smokers. Proc Natl Acad Sci U S A. 106(29):12085-90. Shaw RJ, Cantley LC (2006). Ras, PI(3)K and mTOR signalling controls tumour cell growth. Nature 441:424-430. Smalheiser,N.R. (2003). EST analyses predict the existence of a population of chimeric microRNA precursor-mRNA transcripts expressed in normal human and mouse tissues. Genome Biol. 4, 403. Smalheiser,N.R. and Torvik,V.I. (2005). Mammalian microRNAs derived from genomic repeats. Trends Genet. 21, 322-326. Talotta F, Cimmino A, Matarazzo MR, Casalino L, De Vita G, D'Esposito M, Di Lauro R, Verde P. (2009). Anautoregulatory loop mediated by miR-21and PDCD4 controls the AP1 activity in RAS transformation. Oncogene 28: 73–84. Tetzlaff MT, Liu A, Xu X, Master SR, Baldwin DA, Tobias JW, (2007) Differential Expression of miRNAs in Papillary Thyroid Carcinoma Compared
62
to Multinodular Goiter Using Formalin Fixed Paraffin Embedded Tissues. Endocr Pathol 18(3):163–73. Tomari,Y. and Zamore,P.D. (2005). Perspective: machines for RNAi. Genes Dev. 19, 517-529. Visone R, Pallante P, Vecchione A, Cirombella R, Ferracin M, Ferraro A, Volinia S, Coluzzi S, Leone V, Borbone E, Liu CG, Petrocca F, Troncone G, Calin GA, Scarpa A, Colato C, Tallini G, Santoro M, Croce CM, Fusco A. (2007). Specific microRNAs are downregulated in human thyroid anaplastic carcinomas. Oncogene 26(54):7590–5. Visone R, Russo L, Pallante P, De Martino I, Ferraro A, Leone V, Borbone E, Petrocca F, Alder H, Croce CM, Fusco A. (2007). MicroRNAs (miR)-221 and miR-222, both overexpressed in human thyroid papillary carcinomas, regulate p27Kip1 protein levels and cell cycle. Endocr Relat Cancer 14(3):791–8. Vitagliano D, Portella G, Troncone G, Francione A, Rossi C, Bruno A, Giorgini A, Coluzzi S, Nappi TC, Rothstein JL, Pasquinelli R, Chiappetta G, Terracciano D, Macchia V, Melillo RM, Fusco A, Santoro M. (2006). Thyroid targeting of the N-ras(Gln61Lys) oncogene in transgenic mice results in follicular tumors that progress to poorly differentiated carcinomas. Oncogene 25:5467-5474. Weber F, Teresi RE, Broelsch CE, Frilling A, Eng C. (2006). A limited set of human MicroRNA is deregulated in follicular thyroid carcinoma. J Clin Endocrinol Metab 91(9):3584–91. Wellbrock C, Karasarides M, Marais R. (2004) The RAF proteins take centre stage. Nature reviews 5:875-885. Yi,R., Qin,Y., Macara,I.G., and Cullen,B.R. (2003). Exportin-5 mediates the nuclear export of pre-microRNAs and short hairpin RNAs. Genes Dev. 17, 3011-3016. Yoon S, Seger R (2006). The extracellular signal-regulated kinase: multiple substrates regulate diverse cellular functions. Growth factors (Chur, Switzerland) 24:21-44. Zamore,P.D., Tuschl,T., Sharp,P.A., and Bartel,D.P. (2000). RNAi: double-stranded RNA directs the ATP-dependent cleavage of mRNA at 21 to 23 nucleotide intervals. Cell 101, 25-33. Zeng,Y. (2006). Principles of micro-RNA production and maturation. Oncogene 25, 6156-6162.
63
Zeng,Y. and Cullen,B.R. (2004). Structural requirements for pre- microRNA binding and nuclear export by Exportin 5. Nucleic Acids Res. 32, 4776-4785. Zeng,Y. and Cullen,B.R. (2005). Efficient processing of primary microRNA hairpins by Drosha requires flanking nonstructured RNA sequences. J. Biol. Chem. 280, 27595-27603. Zeng,Y., Wagner,E.J., and Cullen,B.R. (2002). Both natural and designed micro RNAs can inhibit the expression of cognate mRNAs when expressed in human cells. Mol. Cell 9, 1327-1333. Zhang,H., Kolb,F.A., Brondani,V., Billy,E., and Filipowicz,W. (2002). Human Dicer preferentially cleaves dsRNAs at their termini without a requirement for ATP. EMBO J. 21, 5875-5885. Zhang,H., Kolb,F.A., Jaskiewicz,L., Westhof,E., and Filipowicz,W. (2004). Single processing center models for human Dicer and bacterial RNase III. Cell. 118, 57-68. Zuber J, Tchernitsa OI, Hinzmann B, Schmitz AC, Grips M, Hellriegel M, Sers C, Rosenthal A, Schafer R (2000). A genome-wide survey of RAS transformation targets. Nature genetics 24:144-152.

64
7. Acknowledgement
First of all I would like to express my gratitude to my supervisor Prof. Roberto Di Lauro for his helpfulness and his valuable and relevant comments and suggestions. I would like to express my sincere gratitude to my co-supervisor Dr. Gabriella De Vita that since the beginning of my PhD supported me with important advice and constant encouragement. Special thanks to Dr Marta De Menna for sharing with me her precious time and support during these last three years. Sincere thanks are extended to Dr Domenica Perna and Dr Marco Preziuso, for their help and constant encouragement. I will be forever under obligation to my family and my friends Ivan and Chiara for their understanding, endless patience and encouragement when it was most required. Finally I would like to express my special thank to my best friend Silvia, with whom I would have liked to share this important day, to her I dedicate my thesis.