the foschini group limited - tfg interim condensed... · salient features these unaudited interim...
TRANSCRIPT

UNAUDITED INTERIM CONDENSED CONSOLIDATED RESULTSFOR THE HALF-YEAR ENDED 30 SEPTEMBER 2016
THE FOSCHINI GROUP LIMITED

SALIENT FEATURES
These unaudited interim consolidated condensed results were prepared by the TFG Finance and Advisory
department of The Foschini Group Limited, acting under supervision of Anthony Thunström CA(SA),
CFO of The Foschini Group Limited.
* TFG Africa includes all operations on the African continent.
+16,9% +8,1% +5,7%TFG GROUP TURNOVER up 16,9% to R11,4 billion
(TFG Africa*: +9,5%)
HEADLINE EARNINGS
up 8,1%
HEADLINE EARNINGS PER SHARE up 5,7% to 496,8 cents
+4,6% 61,4% 29,5%INTERIM DIVIDEND
of 320,0 cents per share –
a 4,6% increase
TOTAL CASH COMPONENT
of turnover 61,4% (TFG Africa: 50,2%)
STRONG CASH TURNOVER GROWTH of 29,5%
(TFG Africa: 19,0%)
INTERIM HEADLINE EARNINGS exceed
R1 billion for the first time

TFG SEPTEMBER 2016 UNAUDITED INTERIM CONDENSED CONSOLIDATED RESULTS 1
CONDENSED CONSOLIDATED STATEMENT OF FINANCIAL POSITION
Sept 2016Restated
Sept 2015 March 2016Unaudited Unaudited Audited
Rm Rm Rm
ASSETSNon-current assetsProperty, plant and equipment (note 15) 2 380,1 2 055,6 2 335,7Goodwill and intangible assets (note 15) 4 861,4 5 436,2 5 577,8Participation in export partnerships 10,6 8,1 8,2Deferred taxation asset 519,7 368,9 527,2
7 771,8 7 868,8 8 448,9
Current assetsInventory (note 4) 5 126,5 4 363,2 5 116,1Trade receivables – retail 6 669,5 6 339,2 6 695,0Other receivables and prepayments 726,3 733,9 592,9Concession receivables 272,8 171,4 347,2Participation in export partnerships 2,5 9,0 6,2Cash 973,5 1 003,7 888,8Taxation receivable – 39,3 –
13 771,1 12 659,7 13 646,2Total assets 21 542,9 20 528,5 22 095,1
EQUITY AND LIABILITIESEquity attributable to equity holders of The Foschini Group Limited 9 951,1 9 125,6 9 896,7Non-controlling interest 4,5 3,2 4,0Total equity 9 955,6 9 128,8 9 900,7
LIABILITIESNon-current liabilitiesInterest-bearing debt 4 119,4 3 897,2 5 026,3Put option liability 40,7 36,8 48,1Cash-settled share incentive scheme 7,2 4,8 8,5Operating lease liability 247,8 236,1 238,2Deferred taxation liability 381,5 396,4 435,4Post-retirement defined benefit plan 225,2 198,8 217,3
5 021,8 4 770,1 5 973,8
Current liabilitiesInterest-bearing debt 3 589,0 3 949,9 3 139,4Trade and other payables 2 933,5 2 671,2 3 046,7Operating lease liability 11,4 8,5 10,8Taxation payable 31,6 – 23,7
6 565,5 6 629,6 6 220,6Total liabilities 11 587,3 11 399,7 12 194,4Total equity and liabilities 21 542,9 20 528,5 22 095,1
TFG SEPTEMBER 2016 UNAUDITED INTERIM CONDENSED CONSOLIDATED RESULTS2
CONDENSED CONSOLIDATED INCOME STATEMENT
6 months ended
30 Sept 2016
UnauditedRm
6 months ended
30 Sept 2015
UnauditedRm
Year ended
31 March 2016
AuditedRm
%change
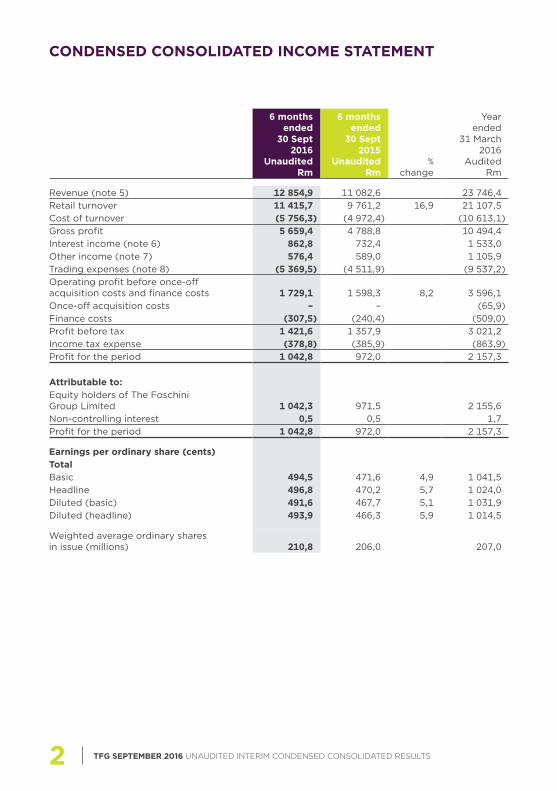
Revenue (note 5) 12 854,9 11 082,6 23 746,4Retail turnover 11 415,7 9 761,2 16,9 21 107,5Cost of turnover (5 756,3) (4 972,4) (10 613,1)Gross profit 5 659,4 4 788,8 10 494,4Interest income (note 6) 862,8 732,4 1 533,0Other income (note 7) 576,4 589,0 1 105,9Trading expenses (note 8) (5 369,5) (4 511,9) (9 537,2)Operating profit before once-off acquisition costs and finance costs 1 729,1 1 598,3 8,2 3 596,1Once-off acquisition costs – – (65,9)Finance costs (307,5) (240,4) (509,0)Profit before tax 1 421,6 1 357,9 3 021,2Income tax expense (378,8) (385,9) (863,9)Profit for the period 1 042,8 972,0 2 157,3
Attributable to:Equity holders of The Foschini Group Limited 1 042,3 971,5 2 155,6Non-controlling interest 0,5 0,5 1,7Profit for the period 1 042,8 972,0 2 157,3
Earnings per ordinary share (cents)TotalBasic 494,5 471,6 4,9 1 041,5Headline 496,8 470,2 5,7 1 024,0Diluted (basic) 491,6 467,7 5,1 1 031,9Diluted (headline) 493,9 466,3 5,9 1 014,5
Weighted average ordinary shares in issue (millions) 210,8 206,0 207,0
TFG SEPTEMBER 2016 UNAUDITED INTERIM CONDENSED CONSOLIDATED RESULTS 3
CONDENSED CONSOLIDATED STATEMENT OF COMPREHENSIVE INCOME
6 months ended
30 Sept 2016
UnauditedRm
6 months ended
30 Sept 2015
UnauditedRm
Year ended
31 March 2016
AuditedRm
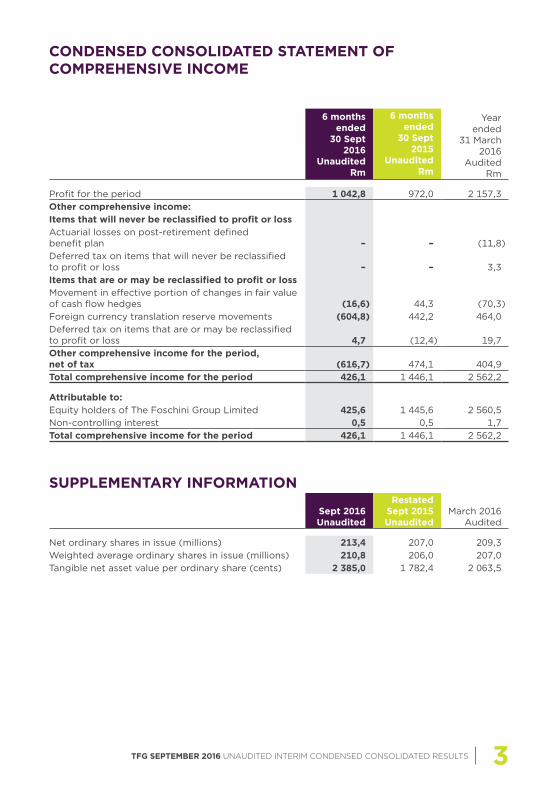
Profit for the period 1 042,8 972,0 2 157,3Other comprehensive income:Items that will never be reclassified to profit or lossActuarial losses on post-retirement defined benefit plan – – (11,8)Deferred tax on items that will never be reclassified to profit or loss – – 3,3Items that are or may be reclassified to profit or lossMovement in effective portion of changes in fair value of cash flow hedges (16,6) 44,3 (70,3)Foreign currency translation reserve movements (604,8) 442,2 464,0Deferred tax on items that are or may be reclassified to profit or loss 4,7 (12,4) 19,7Other comprehensive income for the period, net of tax (616,7) 474,1 404,9Total comprehensive income for the period 426,1 1 446,1 2 562,2
Attributable to:Equity holders of The Foschini Group Limited 425,6 1 445,6 2 560,5Non-controlling interest 0,5 0,5 1,7Total comprehensive income for the period 426,1 1 446,1 2 562,2
SUPPLEMENTARY INFORMATION
Sept 2016Unaudited
Restated Sept 2015Unaudited
March 2016Audited
Net ordinary shares in issue (millions) 213,4 207,0 209,3Weighted average ordinary shares in issue (millions) 210,8 206,0 207,0Tangible net asset value per ordinary share (cents) 2 385,0 1 782,4 2 063,5
TFG SEPTEMBER 2016 UNAUDITED INTERIM CONDENSED CONSOLIDATED RESULTS4
CONDENSED CONSOLIDATED STATEMENT OF CHANGES IN EQUITY
Equity holders of
The Foschini Group
LimitedRm
Non-controlling
interestRm
Totalequity
Rm
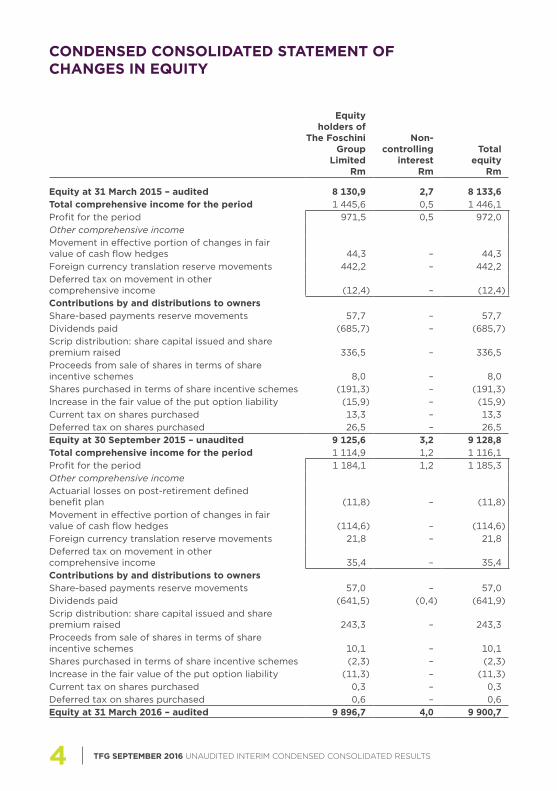
Equity at 31 March 2015 – audited 8 130,9 2,7 8 133,6Total comprehensive income for the period 1 445,6 0,5 1 446,1Profit for the period 971,5 0,5 972,0Other comprehensive incomeMovement in effective portion of changes in fair value of cash flow hedges 44,3 – 44,3Foreign currency translation reserve movements 442,2 – 442,2Deferred tax on movement in other comprehensive income (12,4) – (12,4)Contributions by and distributions to ownersShare-based payments reserve movements 57,7 – 57,7Dividends paid (685,7) – (685,7)Scrip distribution: share capital issued and share premium raised 336,5 – 336,5Proceeds from sale of shares in terms of share incentive schemes 8,0 – 8,0Shares purchased in terms of share incentive schemes (191,3) – (191,3)Increase in the fair value of the put option liability (15,9) – (15,9)Current tax on shares purchased 13,3 – 13,3Deferred tax on shares purchased 26,5 – 26,5Equity at 30 September 2015 – unaudited 9 125,6 3,2 9 128,8Total comprehensive income for the period 1 114,9 1,2 1 116,1Profit for the period 1 184,1 1,2 1 185,3Other comprehensive incomeActuarial losses on post-retirement defined benefit plan (11,8) – (11,8)Movement in effective portion of changes in fair value of cash flow hedges (114,6) – (114,6)Foreign currency translation reserve movements 21,8 – 21,8Deferred tax on movement in other comprehensive income 35,4 – 35,4Contributions by and distributions to ownersShare-based payments reserve movements 57,0 – 57,0Dividends paid (641,5) (0,4) (641,9)Scrip distribution: share capital issued and share premium raised 243,3 – 243,3Proceeds from sale of shares in terms of share incentive schemes 10,1 – 10,1Shares purchased in terms of share incentive schemes (2,3) – (2,3)Increase in the fair value of the put option liability (11,3) – (11,3)Current tax on shares purchased 0,3 – 0,3Deferred tax on shares purchased 0,6 – 0,6Equity at 31 March 2016 – audited 9 896,7 4,0 9 900,7
TFG SEPTEMBER 2016 UNAUDITED INTERIM CONDENSED CONSOLIDATED RESULTS 5
CONDENSED CONSOLIDATED STATEMENT OF CHANGES IN EQUITY (CONTINUED)
Equity holders of
The Foschini Group
LimitedRm
Non-controlling
interestRm
Totalequity
Rm
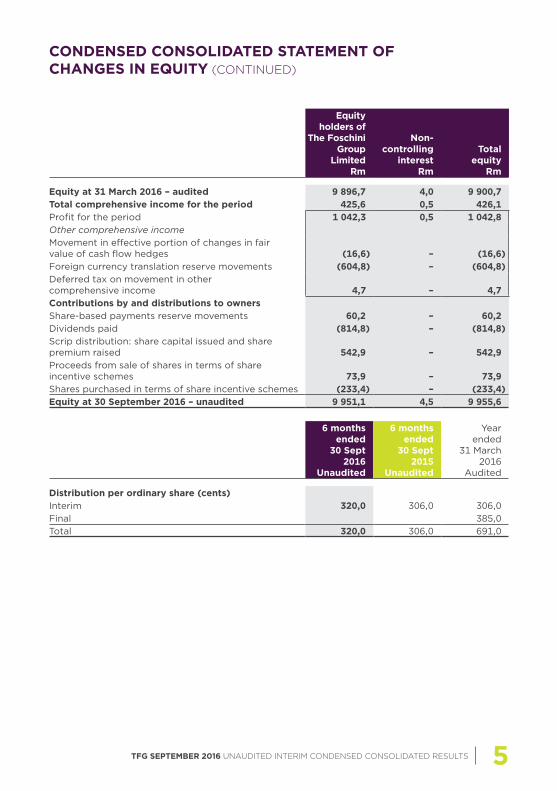
Equity at 31 March 2016 – audited 9 896,7 4,0 9 900,7Total comprehensive income for the period 425,6 0,5 426,1Profit for the period 1 042,3 0,5 1 042,8Other comprehensive incomeMovement in effective portion of changes in fair value of cash flow hedges (16,6) – (16,6)Foreign currency translation reserve movements (604,8) – (604,8)Deferred tax on movement in other comprehensive income 4,7 – 4,7Contributions by and distributions to ownersShare-based payments reserve movements 60,2 – 60,2Dividends paid (814,8) – (814,8)Scrip distribution: share capital issued and share premium raised 542,9 – 542,9Proceeds from sale of shares in terms of share incentive schemes 73,9 – 73,9Shares purchased in terms of share incentive schemes (233,4) – (233,4)Equity at 30 September 2016 – unaudited 9 951,1 4,5 9 955,6
6 months ended
30 Sept 2016
Unaudited
6 months ended
30 Sept 2015
Unaudited
Year ended
31 March 2016
Audited
Distribution per ordinary share (cents)Interim 320,0 306,0 306,0Final 385,0Total 320,0 306,0 691,0
TFG SEPTEMBER 2016 UNAUDITED INTERIM CONDENSED CONSOLIDATED RESULTS6
CONDENSED CONSOLIDATED CASH FLOW STATEMENT
6 months ended
30 Sept 2016
UnauditedRm
6 months ended
30 Sept 2015
UnauditedRm
Year ended
31 March 2016
AuditedRm
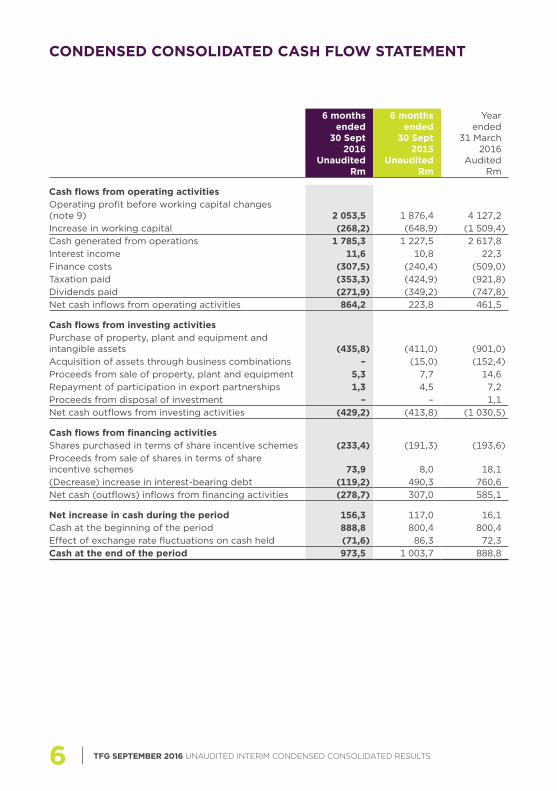
Cash flows from operating activitiesOperating profit before working capital changes (note 9) 2 053,5 1 876,4 4 127,2Increase in working capital (268,2) (648,9) (1 509,4)Cash generated from operations 1 785,3 1 227,5 2 617,8Interest income 11,6 10,8 22,3Finance costs (307,5) (240,4) (509,0)Taxation paid (353,3) (424,9) (921,8)Dividends paid (271,9) (349,2) (747,8)Net cash inflows from operating activities 864,2 223,8 461,5
Cash flows from investing activitiesPurchase of property, plant and equipment and intangible assets (435,8) (411,0) (901,0)Acquisition of assets through business combinations – (15,0) (152,4)Proceeds from sale of property, plant and equipment 5,3 7,7 14,6Repayment of participation in export partnerships 1,3 4,5 7,2Proceeds from disposal of investment – – 1,1Net cash outflows from investing activities (429,2) (413,8) (1 030,5)
Cash flows from financing activitiesShares purchased in terms of share incentive schemes (233,4) (191,3) (193,6)Proceeds from sale of shares in terms of share incentive schemes 73,9 8,0 18,1(Decrease) increase in interest-bearing debt (119,2) 490,3 760,6Net cash (outflows) inflows from financing activities (278,7) 307,0 585,1
Net increase in cash during the period 156,3 117,0 16,1Cash at the beginning of the period 888,8 800,4 800,4Effect of exchange rate fluctuations on cash held (71,6) 86,3 72,3Cash at the end of the period 973,5 1 003,7 888,8
TFG SEPTEMBER 2016 UNAUDITED INTERIM CONDENSED CONSOLIDATED RESULTS 7
CONSOLIDATED SEGMENTAL ANALYSIS
6 months ended 30 September 2016
Retail trading
divisionsUnaudited
Rm
Customer value- added
productsUnaudited
Rm
CreditUnaudited
Rm
Central and
shared services
UnauditedRm
Inter-national
divisionsUnaudited
Rm
Total retail
UnauditedRm
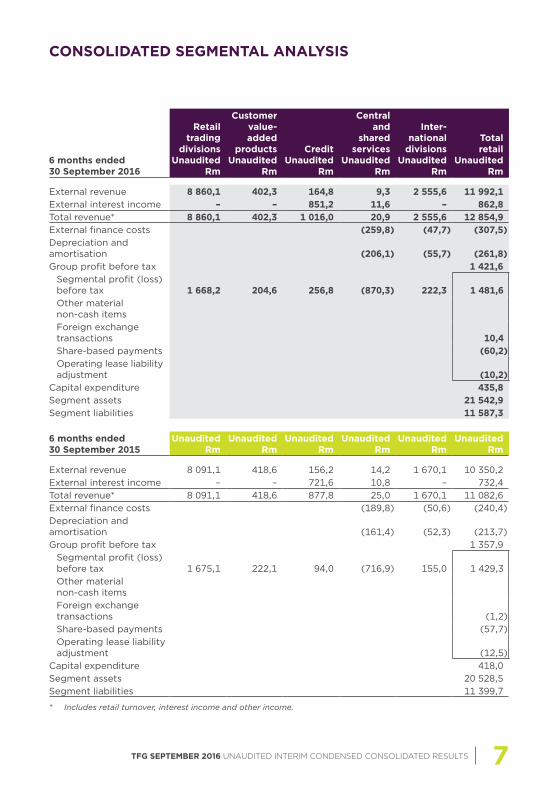
External revenue 8 860,1 402,3 164,8 9,3 2 555,6 11 992,1External interest income – – 851,2 11,6 – 862,8Total revenue* 8 860,1 402,3 1 016,0 20,9 2 555,6 12 854,9External finance costs (259,8) (47,7) (307,5)Depreciation and amortisation (206,1) (55,7) (261,8)Group profit before tax 1 421,6
Segmental profit (loss) before tax 1 668,2 204,6 256,8 (870,3) 222,3 1 481,6Other material non-cash itemsForeign exchange transactions 10,4Share-based payments (60,2)Operating lease liability adjustment (10,2)
Capital expenditure 435,8Segment assets 21 542,9Segment liabilities 11 587,3
6 months ended 30 September 2015
UnauditedRm
UnauditedRm
UnauditedRm
UnauditedRm
UnauditedRm
UnauditedRm
External revenue 8 091,1 418,6 156,2 14,2 1 670,1 10 350,2External interest income – – 721,6 10,8 – 732,4Total revenue* 8 091,1 418,6 877,8 25,0 1 670,1 11 082,6External finance costs (189,8) (50,6) (240,4)Depreciation and amortisation (161,4) (52,3) (213,7)Group profit before tax 1 357,9
Segmental profit (loss) before tax 1 675,1 222,1 94,0 (716,9) 155,0 1 429,3Other material non-cash itemsForeign exchange transactions (1,2)Share-based payments (57,7)Operating lease liability adjustment (12,5)
Capital expenditure 418,0Segment assets 20 528,5Segment liabilities 11 399,7
* Includes retail turnover, interest income and other income.
TFG SEPTEMBER 2016 UNAUDITED INTERIM CONDENSED CONSOLIDATED RESULTS8
CONSOLIDATED SEGMENTAL ANALYSIS (CONTINUED)
Retail trading
divisions
Customer value- added
products Credit
Central and
shared services
Inter-national
divisionsTotal retail
Year ended 31 March 2016
AuditedRm
AuditedRm
AuditedRm
AuditedRm
AuditedRm
AuditedRm
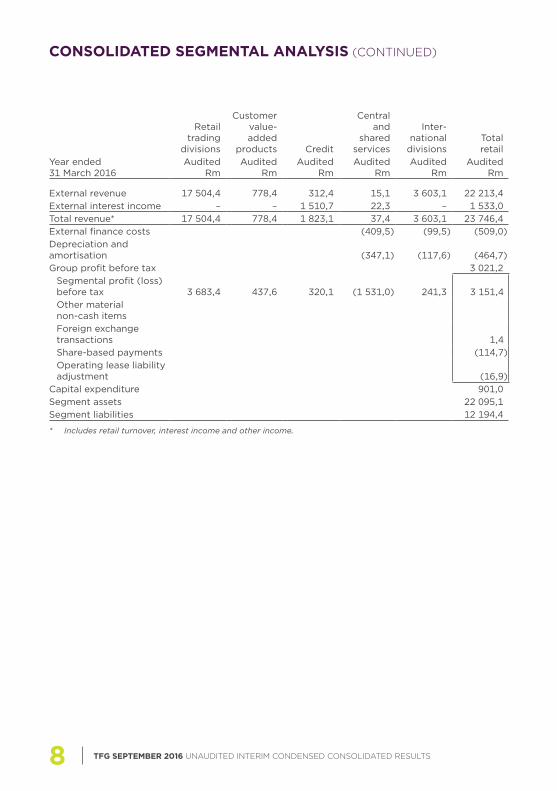
External revenue 17 504,4 778,4 312,4 15,1 3 603,1 22 213,4External interest income – – 1 510,7 22,3 – 1 533,0Total revenue* 17 504,4 778,4 1 823,1 37,4 3 603,1 23 746,4External finance costs (409,5) (99,5) (509,0)Depreciation and amortisation (347,1) (117,6) (464,7)Group profit before tax 3 021,2
Segmental profit (loss) before tax 3 683,4 437,6 320,1 (1 531,0) 241,3 3 151,4Other material non-cash itemsForeign exchange transactions 1,4Share-based payments (114,7)Operating lease liability adjustment (16,9)
Capital expenditure 901,0Segment assets 22 095,1Segment liabilities 12 194,4
* Includes retail turnover, interest income and other income.
TFG SEPTEMBER 2016 UNAUDITED INTERIM CONDENSED CONSOLIDATED RESULTS 9
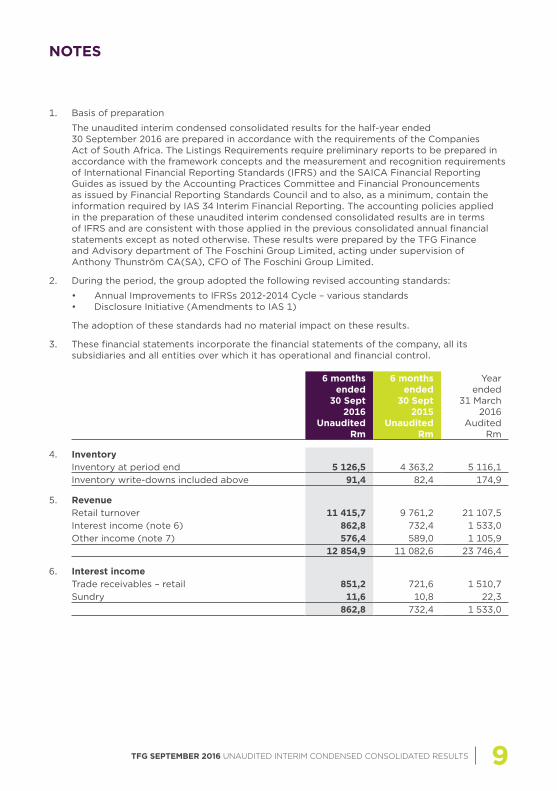
1. Basis of preparation
The unaudited interim condensed consolidated results for the half-year ended 30 September 2016 are prepared in accordance with the requirements of the Companies Act of South Africa. The Listings Requirements require preliminary reports to be prepared in accordance with the framework concepts and the measurement and recognition requirements of International Financial Reporting Standards (IFRS) and the SAICA Financial Reporting Guides as issued by the Accounting Practices Committee and Financial Pronouncements as issued by Financial Reporting Standards Council and to also, as a minimum, contain the information required by IAS 34 Interim Financial Reporting. The accounting policies applied in the preparation of these unaudited interim condensed consolidated results are in terms of IFRS and are consistent with those applied in the previous consolidated annual financial statements except as noted otherwise. These results were prepared by the TFG Finance and Advisory department of The Foschini Group Limited, acting under supervision of Anthony Thunström CA(SA), CFO of The Foschini Group Limited.
2. During the period, the group adopted the following revised accounting standards:
• Annual Improvements to IFRSs 2012-2014 Cycle – various standards• Disclosure Initiative (Amendments to IAS 1)
The adoption of these standards had no material impact on these results.
3. These financial statements incorporate the financial statements of the company, all its subsidiaries and all entities over which it has operational and financial control.
6 months ended
30 Sept 2016
UnauditedRm
6 months ended
30 Sept 2015
UnauditedRm
Year ended
31 March 2016
AuditedRm
4. InventoryInventory at period end 5 126,5 4 363,2 5 116,1Inventory write-downs included above 91,4 82,4 174,9
5. RevenueRetail turnover 11 415,7 9 761,2 21 107,5Interest income (note 6) 862,8 732,4 1 533,0Other income (note 7) 576,4 589,0 1 105,9
12 854,9 11 082,6 23 746,4
6. Interest incomeTrade receivables – retail 851,2 721,6 1 510,7Sundry 11,6 10,8 22,3
862,8 732,4 1 533,0
NOTES

TFG SEPTEMBER 2016 UNAUDITED INTERIM CONDENSED CONSOLIDATED RESULTS10
6 months ended
30 Sept 2016
UnauditedRm
6 months ended
30 Sept 2015
UnauditedRm
Year ended
31 March 2016
AuditedRm
7. Other incomePublishing income 196,1 201,4 399,4Collection cost recovery 164,8 156,2 312,4Insurance income 162,3 174,5 297,8Mobile one2one airtime income 43,9 42,7 81,2Sundry income 9,3 14,2 15,1
576,4 589,0 1 105,9
8. Trading expensesDepreciation and amortisation (261,8) (213,7) (464,7)Employee costs (1 799,9) (1 479,2) (3 210,8)Occupancy costs (1 171,5) (963,5) (2 043,2)Net bad debt (485,6) (506,7) (947,7)Other operating costs (1 650,7) (1 348,8) (2 870,8)
(5 369,5) (4 511,9) (9 537,2)
9. Operating profit before working capital changesProfit before tax 1 421,6 1 357,9 3 021,2Finance costs 307,5 240,4 509,0Operating profit before finance costs 1 729,1 1 598,3 3 530,2Interest income – sundry (11,6) (10,8) (22,3)Non-cash items 336,0 288,9 619,3
Depreciation and amortisation 261,8 213,7 464,7Operating lease liability adjustment 10,2 12,5 16,9Share-based payments 60,2 57,7 114,7Post-retirement defined benefit medical aid movement 7,9 6,2 12,9Foreign currency translation reserve movements (10,4) (1,2) 1,4Cash-settled share incentive scheme – 3,7 7,7Profit on disposal of investment – – (1,1)Loss on disposal of property, plant and equipment 6,5 0,7 7,1Profit on disposal of property, plant and equipment (0,2) (4,4) (5,0)
2 053,5 1 876,4 4 127,2
NOTES (CONTINUED)
TFG SEPTEMBER 2016 UNAUDITED INTERIM CONDENSED CONSOLIDATED RESULTS 11
6 months ended
30 Sept 2016
UnauditedRm
6 months ended
30 Sept 2015
UnauditedRm
Year ended
31 March 2016
AuditedRm
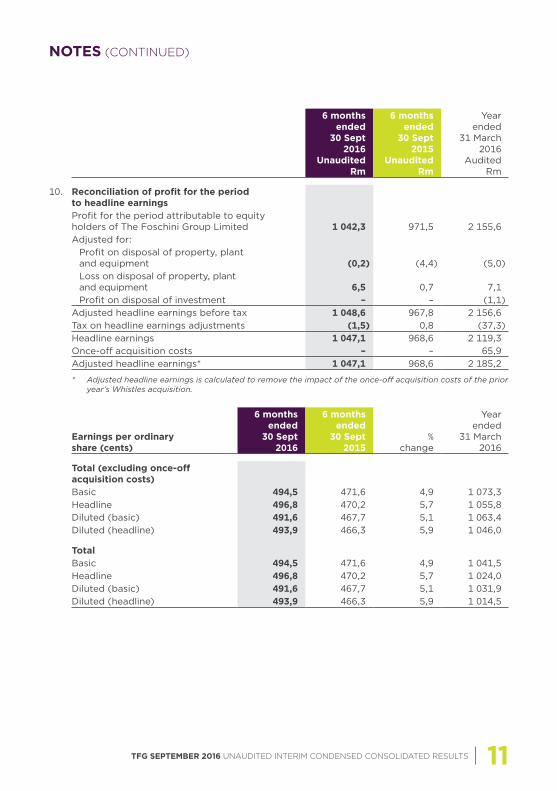
10. Reconciliation of profit for the period to headline earningsProfit for the period attributable to equity holders of The Foschini Group Limited 1 042,3 971,5 2 155,6Adjusted for:
Profit on disposal of property, plant and equipment (0,2) (4,4) (5,0)Loss on disposal of property, plant and equipment 6,5 0,7 7,1Profit on disposal of investment – – (1,1)
Adjusted headline earnings before tax 1 048,6 967,8 2 156,6Tax on headline earnings adjustments (1,5) 0,8 (37,3)Headline earnings 1 047,1 968,6 2 119,3Once-off acquisition costs – – 65,9Adjusted headline earnings* 1 047,1 968,6 2 185,2
* Adjusted headline earnings is calculated to remove the impact of the once-off acquisition costs of the prior year’s Whistles acquisition.
Earnings per ordinary share (cents)
6 months ended
30 Sept 2016
6 months ended
30 Sept 2015
% change
Year ended
31 March 2016
Total (excluding once-off acquisition costs)Basic 494,5 471,6 4,9 1 073,3Headline 496,8 470,2 5,7 1 055,8Diluted (basic) 491,6 467,7 5,1 1 063,4Diluted (headline) 493,9 466,3 5,9 1 046,0
TotalBasic 494,5 471,6 4,9 1 041,5Headline 496,8 470,2 5,7 1 024,0Diluted (basic) 491,6 467,7 5,1 1 031,9Diluted (headline) 493,9 466,3 5,9 1 014,5
NOTES (CONTINUED)
TFG SEPTEMBER 2016 UNAUDITED INTERIM CONDENSED CONSOLIDATED RESULTS12
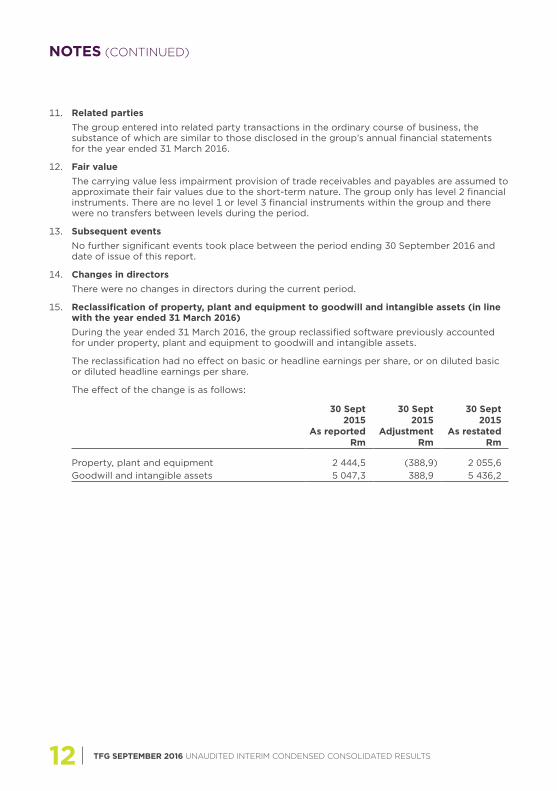
11. Related parties The group entered into related party transactions in the ordinary course of business, the
substance of which are similar to those disclosed in the group’s annual financial statements for the year ended 31 March 2016.
12. Fair value The carrying value less impairment provision of trade receivables and payables are assumed to
approximate their fair values due to the short-term nature. The group only has level 2 financial instruments. There are no level 1 or level 3 financial instruments within the group and there were no transfers between levels during the period.
13. Subsequent events No further significant events took place between the period ending 30 September 2016 and
date of issue of this report.
14. Changes in directors
There were no changes in directors during the current period.
15. Reclassification of property, plant and equipment to goodwill and intangible assets (in line with the year ended 31 March 2016)
During the year ended 31 March 2016, the group reclassified software previously accounted for under property, plant and equipment to goodwill and intangible assets.
The reclassification had no effect on basic or headline earnings per share, or on diluted basic or diluted headline earnings per share.
The effect of the change is as follows:
30 Sept 2015
As reported Rm
30 Sept 2015
Adjustment Rm
30 Sept 2015
As restated Rm
Property, plant and equipment 2 444,5 (388,9) 2 055,6Goodwill and intangible assets 5 047,3 388,9 5 436,2
NOTES (CONTINUED)

TFG SEPTEMBER 2016 UNAUDITED INTERIM CONDENSED CONSOLIDATED RESULTS 13
COMMENTARY
INTRODUCTIONGiven our expansion both in Africa and internationally we will be using the naming conventions defined below to assist our stakeholders in understanding the Group’s activities:
• “The TFG Group” or “the Group” – refers to the consolidated performance of TFG Limited and all its subsidiaries
• “TFG Africa” – refers to all operations on the African continent• “TFG International” – refers to all operations outside the African continent
In the commentary below, numbers quoted refer to the Group unless otherwise specified.
PERFORMANCE OVERVIEWThe Group produced a satisfactory result for the period with retail turnover growth of 16,9%. This growth was achieved despite the backdrop of a difficult trading environment, particularly in South Africa. Turnover from TFG Africa grew by 9,5% with comparable sales growth of 2,1%.
Cash turnover growth for the period was strong at 29,5% (TFG Africa: 19,0%). Our credit turnover however has been severely impacted by the reduction in new account openings as a result of the Affordability Regulations and grew by only 1,4%.
Gross margin for the period remained broadly consistent in all merchandise categories. The Group achieved a gross margin of 49,6% (Sept 2015: 49,1%) for the period whilst a margin of 45,5% (Sept 2015: 46,1%) was achieved in TFG Africa. As anticipated, the TFG Africa margin was impacted by The FIX which had a lower gross margin for clothing due to the impact of its transition from Fashion Express, which is progressing according to plan. In addition, the TFG Africa gross margin mix was impacted by strong cellular sales (+20,3%) which historically trades at a lower margin.
Total trading expenses increased by 19,0% (TFG Africa: 9,6%) over the previous period, largely due to the acquisition of Whistles whose turnaround is progressing in line with management’s expectations. Although cost control is a key focus area, we continue our investment in future growth. We are however concerned about the continued acceleration in crime-related losses in South Africa. To manage this risk we have invested in various, costly forensic capabilities and have also embarked on the roll-out of a revised and enhanced security strategy.
Headline earnings per share increased by 5,7% to 496,8 cents per share for the period, up from 470,2 cents per share in the previous period.
An interim cash dividend of 320,0 cents per share has been declared, an increase of 4,6%.
The Group opened 129 outlets during the period, 83 of which were in Africa and 46 internationally. As part of our capital optimization project, specific focus was placed on loss making outlets which resulted in 33 closures during the period. This brings the total number of outlets at end September to 3 221 in 34 countries. Trading space in our African operations increased by 5,3% since September 2015.
Our e-commerce roll-out continued during the period with the launch of Foschini cosmetics and our Markham and Fabiani brands, adding to our existing seven brands already online. Turnover from our online trading continues to grow above expectation for both our local and international brands.

TFG SEPTEMBER 2016 UNAUDITED INTERIM CONDENSED CONSOLIDATED RESULTS14
COMMENTARY (CONTINUED)
MERCHANDISE CATEGORIESTurnover growths in the various merchandise categories are as follows:
% turnover growth
(TFG Group)
% turnover growth
(TFG Africa)
% same store turnover growth
(TFG Africa)Clothing 19,6 9,6 1,6Jewellery 4,0 4,0 0,3Cellphones 20,3 20,3 15,2Homeware & furniture 7,3 7,3 (4,6)Cosmetics 3,0 3,0 (0,8)
Total same store turnover (TFG Africa) grew by 2,1% whilst product inflation averaged approximately 9%.
CREDITThe retail debtors’ book of R6,7 billion, had zero growth compared to March 2016 due to the impact of the Affordability Regulations on our credit turnover as well as the number of active accounts. We estimate the negative impact on credit turnover to be in the region of R310 million for this period.
Strong prior year recoveries have assisted a 4,2% reduction in net bad debt. As a consequence of the slowdown in the growth of the debtors’ book, net bad debt as a percentage of closing debtors’ book was 14,0% (September 2015: 14,0%), up from 13,4% at March 2016. The retail debtors’ book is adequately provisioned at 13,0%, down from 13,2% at the previous year-end and 13,9% at the end of September 2015.
BALANCE SHEET STRUCTUREOur recourse debt to equity ratio at September 2016 improved to 53,2% from 55,6% at March 2016 with total debt to equity improving to 67,6% from 73,5% at March 2016.
AFRICA EXPANSIONDuring the period, 9 outlets were opened in African countries other than South Africa which includes our first TFG store, Sterns, in Kenya which opened in The Junction mall in Nairobi during September. This brings the total number of outlets to 185 across seven countries in the rest of Africa.
These outlets traded well with turnover growth of 17,7% during the period and 6,0% comparable store turnover growth. All the African countries achieved positive comparable store turnover growth for the period.
Expanding our footprint in the rest of Africa remains a Group objective.
The Group opened 74 outlets in South Africa during the period.
INTERNATIONAL EXPANSIONOur international division performed to expectation for the period. Phase Eight traded well with turnover growth of 11,6% in GBP. Whistles has already generated a positive EBITDA profit due to the strategies that have been implemented since acquisition. Earnings growth of 48% in GBP was achieved for the international division for the period. Both Phase Eight and Whistles are on track to meet the budget that was set for the year.

TFG SEPTEMBER 2016 UNAUDITED INTERIM CONDENSED CONSOLIDATED RESULTS 15
COMMENTARY (CONTINUED)
OUTLOOK Uncertainty continues to cloud the outlook for both the domestic as well as the global economy.
As previously mentioned, the Affordability Regulations have had and will continue to have a negative impact on the Group’s credit turnover. The Group, together with two other major listed retailers, has initiated legal action against the National Credit Regulator (NCR) and Department of Trade and Industry (dti) in connection with the Affordability Regulations.
As a listed company that currently employs over 20 000 people, the Group is strongly supportive of the recently announced “CEO Initiative Pledge”. The Pledge stands against corruption and policy uncertainty which are having a negative impact on the South African economy.
The continuing uncertainty regarding the potential impact of Brexit on both the UK and European economies remains.
Despite the economic outlook, we believe that continued commitment to our strategic objectives around growth, profit, customer and leadership development will support our efforts to achieve a reasonable result for the full year. We plan to open in excess of 100 new outlets in the second half of the year, 90 of which will be in Africa with the balance being international. Further strategic initiatives planned for the second half of the year include working capital management and capital optimisation projects.
As always, the Group is heavily dependent on Christmas trading which will largely determine our performance for the full year.
Total retail turnover growth for the first 5 weeks of the second half is 13,3% with turnover growth of 12,2% in Africa.
PREFERENCE DIVIDEND ANNOUNCEMENTDividend no. 160 of 3,25% (6,5 cents per share) (gross) in respect of the six months ending 31 March 2017 has been declared from income reserves, payable on Monday, 20 March 2017 to holders of 6,5% preference shares recorded in the books of the company at the close of business on Friday, 17 March 2017. The last day to trade (“cum” the dividend) in order to participate in the dividend will be Tuesday, 14 March 2017. The Foschini Group Limited preference shares will commence trading “ex” the dividend from the commencement of business on Wednesday, 15 March 2017 and the record date, as indicated, will be Friday, 17 March 2017.
Preference shareholders should take note that share certificates may not be dematerialised or rematerialised during the period Wednesday, 15 March 2017 to Friday, 17 March 2017, both dates inclusive.
In terms of section 11.17 of the JSE Listings Requirements, the following additional information is disclosed:
1) Local dividend tax rate is 15%; 2) The withholding tax, if applicable at the rate of 15%, will result in a net cash dividend per share
of 5,52500 cents; 3) The issued preference share capital of The Foschini Group Limited is 200 000 shares at
10 November 2016; and4) The Foschini Group Limited’s tax reference number is 9925/133/71/3P.
TFG SEPTEMBER 2016 UNAUDITED INTERIM CONDENSED CONSOLIDATED RESULTS16
COMMENTARY (CONTINUED)
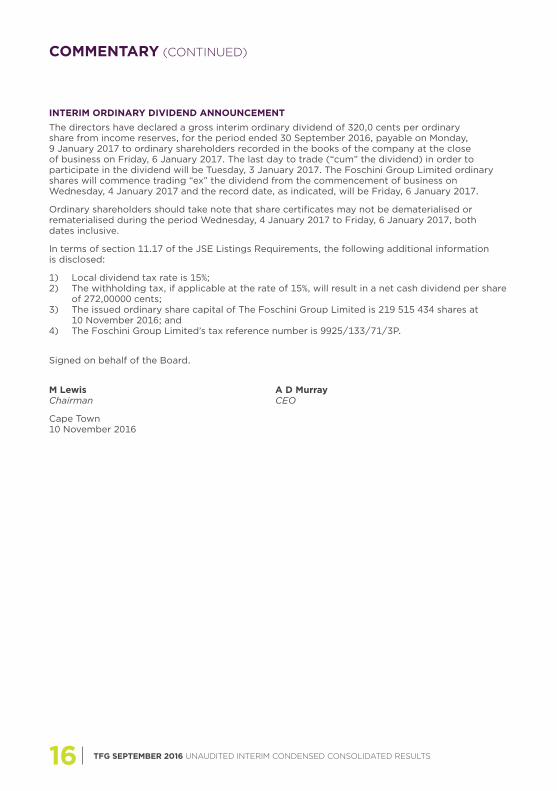
INTERIM ORDINARY DIVIDEND ANNOUNCEMENTThe directors have declared a gross interim ordinary dividend of 320,0 cents per ordinary share from income reserves, for the period ended 30 September 2016, payable on Monday, 9 January 2017 to ordinary shareholders recorded in the books of the company at the close of business on Friday, 6 January 2017. The last day to trade (“cum” the dividend) in order to participate in the dividend will be Tuesday, 3 January 2017. The Foschini Group Limited ordinary shares will commence trading “ex” the dividend from the commencement of business on Wednesday, 4 January 2017 and the record date, as indicated, will be Friday, 6 January 2017.
Ordinary shareholders should take note that share certificates may not be dematerialised or rematerialised during the period Wednesday, 4 January 2017 to Friday, 6 January 2017, both dates inclusive.
In terms of section 11.17 of the JSE Listings Requirements, the following additional information is disclosed:
1) Local dividend tax rate is 15%;2) The withholding tax, if applicable at the rate of 15%, will result in a net cash dividend per share
of 272,00000 cents; 3) The issued ordinary share capital of The Foschini Group Limited is 219 515 434 shares at
10 November 2016; and4) The Foschini Group Limited’s tax reference number is 9925/133/71/3P.
Signed on behalf of the Board.
M Lewis A D MurrayChairman CEO
Cape Town10 November 2016
GREYMATTER & FINCH # 10127
Executive directors: A D Murray, A Thunström
Non-executive directors: M Lewis (Chairman), Prof F Abrahams, S E Abrahams, G Davin, D Friedland, B L M Makgabo-Fiskerstrand, E Oblowitz, N V Simamane, R Stein
Company Secretary: D van Rooyen
Registered office: Stanley Lewis Centre, 340 Voortrekker Road, Parow East 7500
Registration number: 1937/009504/06
Share codes: TFG – TFGP
ISIN: ZAE000148466 – ZAE000148516
Transfer secretaries: Computershare Investor Services Proprietary Limited 70 Marshall Street, Johannesburg 2001
Sponsor: UBS South Africa Proprietary Limited
CORPORATE INFORMATION

WWW.TFGLIMITED.CO.ZA