techno-economic comparison of process technologies … comparison of process technologies ... rate...
TRANSCRIPT
Fuel 89 (2010) S20–S28
Contents lists available at ScienceDirect
Fuel
journal homepage: www.elsevier .com/locate / fuel
Techno-economic comparison of process technologies for biochemical ethanolproduction from corn stover q
Feroz Kabir Kazi a, Joshua A. Fortman a, Robert P. Anex a,*, David D. Hsu b, Andy Aden b,Abhijit Dutta b, Geetha Kothandaraman c
a Iowa State University, 3202 NSRIC, Ames, IA 50011-3310, United Statesb National Renewable Energy Laboratory, 1617 Cole Blvd., Golden, CO 80401, United Statesc ConocoPhillips Company, Bartlesville Technology Center, Highway 608123, Bartlesville, OK 74004, United States
a r t i c l e i n f o a b s t r a c t
Article history:Received 14 August 2009Received in revised form 24 December 2009Accepted 1 January 2010Available online 9 January 2010
Keywords:Techno-economicsEthanolBiomassPretreatmentPioneer plant
0016-2361/$ - see front matter � 2010 Elsevier Ltd. Adoi:10.1016/j.fuel.2010.01.001
Abbreviations: GGE, gal of gasoline equivalent; LGEPV, product value with NPV = 0 in 20 years andaccelerated cost recovery system; AFEX, ammonia fibeof applied fundamentals and innovation; FPU, filter pinvestment; CSL, corn steep liquor; CBP, consolidatedhydrolysis and fermentation; SSCF, simultaneous sactation; EVD, experimentally verified data; NPV, net prof return.
q This article is sponsored by the National RenewConocoPhillips Company as part of the Supplement Tof Biomass-to-Biofuels Pathways.
* Corresponding author. Tel.: +1 303 384 6887; faxE-mail address: [email protected] (R.P. Anex).
This techno-economic study compares several process technologies for the production of ethanol fromlignocellulosic material, based on a 5- to 8-year time frame for implementation. While several previoustechno-economic studies have focused on future technology benchmarks, this study examines the short-term commercial viability of biochemical ethanol production. With that goal, yields (where possible)were based on publicly available experimental data rather than projected data. Four pretreatment tech-nologies (dilute-acid, 2-stage dilute-acid, hot water, and ammonia fiber explosion or AFEX); and threedownstream process variations (pervaporation, separate 5-carbon and 6-carbon sugars fermentation,and on-site enzyme production) were included in the analysis. Each of these scenarios was modeledand economic analysis was performed for an ‘‘nth plant” (a plant with the same technologies that havebeen employed in previous commercial plants) to estimate the total capital investment (TCI) and productvalue (PV). PV is the ethanol production cost, including a 10% return on investment. Sensitivity analysishas been performed to assess the impact of process variations and economic parameters on the PV.
The dilute-acid pretreatment process has the lowest PV among all process scenarios, which is esti-mated to be $1.36/l of gasoline equivalent [LGE] ($5.13/gal of gasoline equivalent [GGE]). Sensitivity anal-ysis shows that the PV is most sensitive to feedstock cost, enzyme cost, and installed equipment costs. Asignificant fraction of capital costs is related to producing heat and power from lignin in the biomass.
Cellulosic ethanol production has yet to be commercialized. Hence, a pioneer plant is expected to bemore costly to build and operate than an nth plant. To assess the impact of technological maturity on pio-neer plant cost, a cost growth analysis was performed. The estimated value of PV for the pioneer plant issubstantially larger than for the nth plant. The PV for the pioneer plant model with dilute-acid pretreat-ment is $2.30/LGE ($8.72/GGE) for the most probable scenario, and the estimated TCI was more than dou-ble the nth plant cost.
� 2010 Elsevier Ltd. All rights reserved.
ll rights reserved.
, liter of gasoline equivalent;10% IRR; MACRS, modifiedr explosion; CAFI, consortiumaper units; TCI, total capitalbioprocessing; SHF, separatecharification and co-fermen-esent value; IRR, internal rate
able Energy Laboratory andechno-economic Comparison
: +1 303 384 6363.
1. Introduction
There is a growing interest in liquid biofuels produced fromrenewable biomass resources to reduce dependence on crude oil.The US demand for gasoline is about 103 billion gal (390 mil-lion m3) annually [1]; and approximately 9 billion gal (34 mil-lion m3) per year of ethanol is being produced from corn in 2008[2]. The production of fuels from food crops may place upwardpressure on the price and availability of food, and the likelihoodof such a ‘‘food versus fuel” conflict may increase as the world’spopulation grows. As an alternative to corn grain, lignocellulosicbiomass shows promise as a feedstock for bioethanol production.It is projected that by 2030, over 38 billion gal (144 million m3)per year of renewable biofuels will be consumed in the United
F.K. Kazi et al. / Fuel 89 (2010) S20–S28 S21
States, with less than half coming from conventional corn-basedethanol [1]. One study estimated that it is possible to grow enoughlignocellulosic biomass – in an economically feasible and environ-mentally sustainable manner – to produce more than 50 billion gal(189 million m3) of biofuels annually [3].
Ethanol – along with other types of biofuels such as butanol,bio-gasoline, and dimethylfuran – can be derived from lignocellu-lose via different reaction pathways [4,5]. However, bioethanol re-search is more advanced than many competing biofueltechnologies, most of which are at the early stages of development.Ethanol can be produced from lignocellulosics following two dif-ferent process pathways: (i) biochemical, where chemical or enzy-matic hydrolysis and subsequent microbial fermentation isapplied; and (ii) thermochemical, where gasification followedeither by microbial fermentation or by catalytic upgrading are ap-plied [6]. Unlike ethanol production from starch feedstocks, ligno-cellulosic biomass requires more aggressive pretreatments prior tosaccharification and fermentation to increase the exposure of cel-lulose to enzymes during enzymatic hydrolysis. Dissolved catalystsare often used during biomass pretreatment. The effectiveness ofthe catalyst and pretreatment conditions contributes significantlyto the yield and economics of the overall process. Both acids andbases are used as catalysts, with acids resulting in significantly dif-ferent product yields than bases. Sulfuric acid, sulfur dioxide,ammonia, and lime are some of the catalysts that have been stud-ied [7]. Hot water pretreatment [8], which relies on the reduced pHof water at elevated temperatures to hydrolyze hemicelluloses anddisrupt the biomass structure, can also be used.
Following pretreatment, the biomass cellulose and hemicellu-lose components are hydrolyzed to monosaccharides (primarilyglucose and xylose) either by acids or enzymes. The sugars are thenfermented by yeast or by bacteria to produce ethanol. With sepa-rate fermentation of C5 and C6 (5-carbon and 6-carbon) sugarsusing selective microbes, higher ethanol yields can be achievedthan with co-fermentation [9,10]. The produced ethanol is purifiedin distillation columns; and advanced purification technologiessuch as pervaporation [11,12], and reverse osmosis [13–15] arebeing developed, which may reduce operating costs.
This study, which is a techno-economic analysis of biochemicalethanol production from corn stover, focuses on technologies pro-jected to be viable within a 5- to 8-year time frame. Based on thistime frame – and after considering time for design, construction,and start-up – the process would likely have to be based on exper-imental data available today. Initially, 35 published technologies ofvarious liquid fuels were reviewed, and a matrix was prepared con-sidering economics, technological maturity, environmental as-pects, process performance, and technical and economic risks.Both butanol and ethanol production processes were initially in-cluded in the technology matrix. However, butanol technologiesare at the lab-scale or very early pilot stage of development, andpublished data on butanol-producing organisms indicate lowyields relative to ethanol production, so they are not included infurther analysis. Seven lignocellulosic ethanol process scenarioswere selected, with four involving pretreatment variations (di-
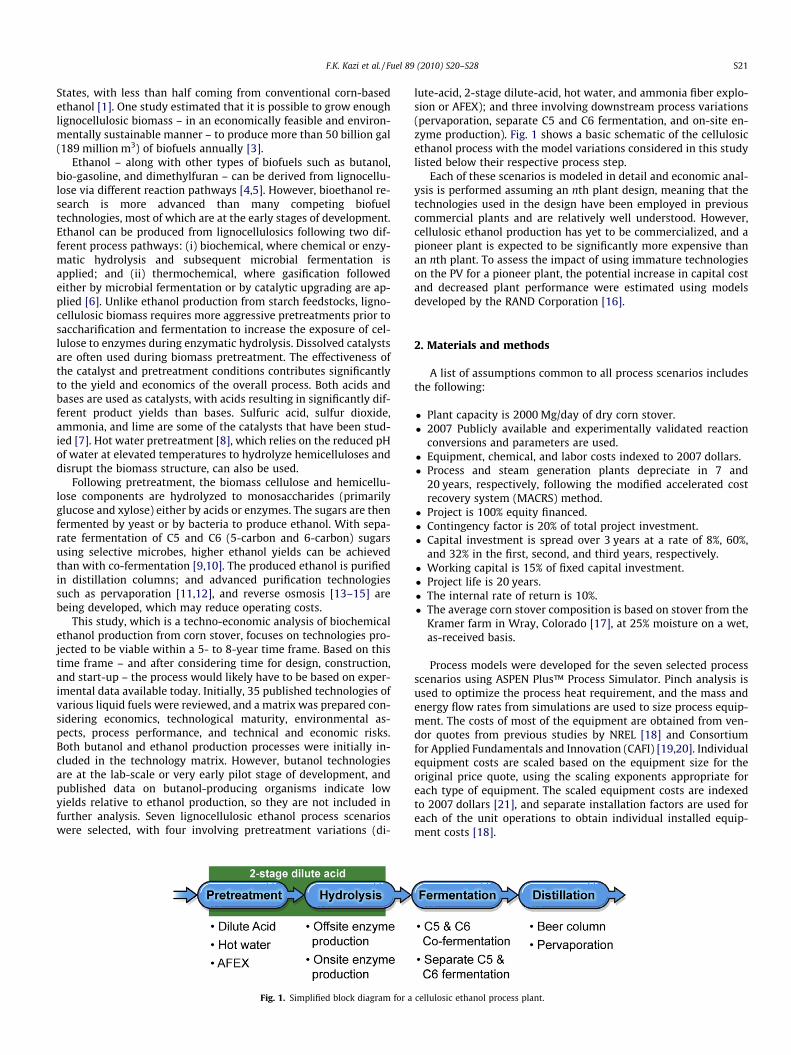
Fig. 1. Simplified block diagram for a
lute-acid, 2-stage dilute-acid, hot water, and ammonia fiber explo-sion or AFEX); and three involving downstream process variations(pervaporation, separate C5 and C6 fermentation, and on-site en-zyme production). Fig. 1 shows a basic schematic of the cellulosicethanol process with the model variations considered in this studylisted below their respective process step.
Each of these scenarios is modeled in detail and economic anal-ysis is performed assuming an nth plant design, meaning that thetechnologies used in the design have been employed in previouscommercial plants and are relatively well understood. However,cellulosic ethanol production has yet to be commercialized, and apioneer plant is expected to be significantly more expensive thanan nth plant. To assess the impact of using immature technologieson the PV for a pioneer plant, the potential increase in capital costand decreased plant performance were estimated using modelsdeveloped by the RAND Corporation [16].
2. Materials and methods
A list of assumptions common to all process scenarios includesthe following:
� Plant capacity is 2000 Mg/day of dry corn stover.� 2007 Publicly available and experimentally validated reaction
conversions and parameters are used.� Equipment, chemical, and labor costs indexed to 2007 dollars.� Process and steam generation plants depreciate in 7 and
20 years, respectively, following the modified accelerated costrecovery system (MACRS) method.
� Project is 100% equity financed.� Contingency factor is 20% of total project investment.� Capital investment is spread over 3 years at a rate of 8%, 60%,
and 32% in the first, second, and third years, respectively.� Working capital is 15% of fixed capital investment.� Project life is 20 years.� The internal rate of return is 10%.� The average corn stover composition is based on stover from the
Kramer farm in Wray, Colorado [17], at 25% moisture on a wet,as-received basis.
Process models were developed for the seven selected processscenarios using ASPEN Plus™ Process Simulator. Pinch analysis isused to optimize the process heat requirement, and the mass andenergy flow rates from simulations are used to size process equip-ment. The costs of most of the equipment are obtained from ven-dor quotes from previous studies by NREL [18] and Consortiumfor Applied Fundamentals and Innovation (CAFI) [19,20]. Individualequipment costs are scaled based on the equipment size for theoriginal price quote, using the scaling exponents appropriate foreach type of equipment. The scaled equipment costs are indexedto 2007 dollars [21], and separate installation factors are used foreach of the unit operations to obtain individual installed equip-ment costs [18].
cellulosic ethanol process plant.
S22 F.K. Kazi et al. / Fuel 89 (2010) S20–S28
The production costs include feedstock, variable operating costs(such as process chemicals, enzyme, nutrients, etc.), and fixedoperating costs (employee salaries, overhead, maintenance, andinsurance). The chemical and nutrient prices were obtained fromprevious NREL studies [18] and indexed to 2007 dollars [22]. Cellu-lase enzyme is not available commercially at scales needed for aproduction plant, which makes enzyme price information difficultto obtain. The enzyme price was estimated by using the on-site en-zyme production model and increasing the biomass feed rate, sothat the flow of pretreated biomass slurry to the saccharificationvessels and the total ethanol production are the same as for themodel without on-site enzyme production. This is done so thatthe amount of enzymes produced is equal to what is needed fora 2000 Mg/day plant without on-site enzyme production. The priceof enzymes was then adjusted in the model for the 2000 Mg/dayplant without on-site enzymes so that the PV is the same as theon-site enzyme model with adjusted biomass feed rate – that en-zyme price is then used in all models. The raw material pricesare shown in Table 1.
The PV (which includes production costs and a 10% rate of re-turn) was calculated by iterating the ethanol selling price toachieve a net present value of zero. Because the lignocellulosic eth-anol process has yet to be commercialized, a number of engineer-ing design and performance uncertainties may arise. Theseuncertainties are accounted for in the cost growth analysis for apioneer plant following a methodology developed by the RANDCorporation [16]. This methodology considers two sources of costgrowth in chemical and mineral processing plants: a plant perfor-mance that is less than expected and a capital cost estimation thatis low. Cost growth sources are estimated by using two multi-fac-tor linear correlations to estimate the unexpected reduced plantperformance and capital cost growth associated with pioneerplants.
2.1. Process description
The base case cellulosic ethanol process, modified from thatused for the NREL 2002 design report [18], is comprised of ninesections: feed handling, pretreatment and detoxification, enzy-matic hydrolysis and fermentation, on-site enzyme production,product recovery, wastewater treatment, product and raw materialstorage, burner/boiler turbogenerator, and utilities.
All seven process scenarios were simulated using current pub-lished data, which will be referred to as 2007 experimentally ver-ified data (EVD). The reaction conversions for pretreatment andenzymatic hydrolysis for all scenarios (except for 2-stage dilute-acid treatment) are obtained from CAFI research [7,23]. For otherdownstream processes in the base case scenario, the data were ob-tained from NREL research [24]. In addition, the techno-economic
Table 1Feedstock and chemical costs.
Price
Corn stover (US$/Mg) 83Enzyme broth (US$/Mg) at 100 g protein/L broth 507Sulfuric acid (US$/Mg) 35Hydrated lime (US$/Mg) 99Corn steep liquor (CSL) (US$/Mg) 226Diammonium phosphate (US$/Mg) 201Electricity price (c/kWh) 5.4Propane (US$/Mg) 374Boiler chemicals (US$/Mg) 4996Cooling tower chemicals (US$/Mg) 2994Wastewater chemicals (US$/Mg) 463Wastewater polymer (US$/Mg) 7485Clarifier polymer (US$/Mg) 3575
models used in a previous CAFI study [19,20] have been updatedto reflect the latest NREL design report [18] and updated financialassumptions mentioned earlier.
For each of the process scenarios (except the on-site enzymeproduction scenario), the analysis assumed that enzymes are pur-chased from an external supplier and so, this section is absent. Pre-treatment, enzymatic hydrolysis, on-site enzyme production andproduct recovery are subjected to process variations as mentionedin the methodology. The remaining sections are common for eachof the seven process variations and are the same as the 2002 NRELdesign report [18]. For the pretreatment scenarios, it is possiblethat the optimal configuration is not represented by the simplesubstitution of a different process into the pretreatment sectionof the 2002 NREL design report. However, the modeling methodol-ogy taken in this study mirrors the experimental procedure anddata from CAFI research.
The pretreatment area in the dilute-acid pretreatment scenariois modeled identically to the 2002 NREL design report [18], withthe exception of different reaction conversions. In the 2-stage di-lute-acid pretreatment scenario, the first stage solubilizes mostof the hemicellulose just as in the base case pretreatment scenario.In the second stage, dilute-acid hydrolyzes a fraction of the cellu-lose and remaining hemicellulose. This contrasts with the otherprocess scenarios in which enzymes are used to hydrolyze the pre-treated cellulose. The 2-stage dilute-acid process was derived froma previous NREL report with softwood as the feedstock [25]. Be-cause of the lack of publicly available experimental data with cornstover, conversions were based on experiments on softwood [26]and assumed that the conversions would also apply for corn stover.Uncertainty analysis was used to help capture differences in con-versions as a result of the feedstock.
In the hot water pretreatment scenario, the chopped andwashed biomass from the pretreatment section is mixed with recy-cled hot water from the distillation column bottoms [8]. The slurryis fed to a plug flow pretreatment reactor, where the pressure ismaintained at 12.5 bars and the temperature is held constant at190 �C; the residence time in the pretreatment reactor is 5 min.
In the AFEX pretreatment scenario, the biomass is treated withliquid ammonia under high pressure (17.2 bars) at 60 �C for 5 min[27]. The pressure is rapidly released causing the fibers to explode,which increases the accessibility of the cellulase enzymes to cellu-lose. Most of the ammonia is recovered from the blow down tank.Residual ammonia is recovered from the solids in a flash drum fol-lowed by fractionation of other volatiles. Recovered ammonia va-por is compressed, condensed, and recycled back into AFEXreactor [27].
The hydrolyzate from dilute-acid, hot water, and AFEX pretreat-ments is pumped into one of several parallel saccharification ves-sels where enzymes are added in the saccharification andfermentation section of the plant [18]. The enzyme loading is31.3 mg protein/g cellulose in the untreated biomass; the resi-dence time for saccharification is 5 days. Although enzymes couldbe tailored and optimized for each pretreatment option, this wasnot done experimentally in the CAFI work [19,20,23] and theresulting effect on enzyme cost would be difficult to characterize.In the absence of additional data, assuming the same enzymeand loading permits the best comparison of pretreatment options.
Recombinant Zymomonas mobilis is capable of fermenting glu-cose and xylose to ethanol. The hydrolyzate from the saccharifica-tion vessels is pumped into one of several parallel-sequenced batchfermentation reactors, where Z. mobilis ferments xylose and glu-cose to ethanol with conversions of 0.756 and 0.95, respectively[18].
A scenario with a fermentation process variation was explored,with xylose and glucose being fermented separately using theselective fermentative microbes Z. mobilis for xylose and yeast

F.K. Kazi et al. / Fuel 89 (2010) S20–S28 S23
(Saccharmoyces cervisiae or pastorianus) for glucose [28]. This sce-nario is intended to avoid the issue of lower ethanol yields of re-combinant Z. mobilis when fermenting both C5 and C6 sugars.However, the disadvantage of this scenario is that more water isneeded to dilute the solids stream (C6 sugar) because the bestyields are achieved at low solids loading. The additional water re-sults in a lower ethanol concentration in the beer, which increasesdistillation costs. To increase the ethanol concentration in the beer,a fraction of the product stream from xylose fermentation is recy-cled to saccharification; however, this is done at the expense oflower cellulose-to-ethanol yields.
As an alternative to purchasing enzymes, the production of en-zymes on-site was studied as a process variation. It is thought thatproduction of enzymes on-site might reduce enzyme cost by elim-inating transportation and the need to add stabilizers to reduce en-zyme degradation during storage. In this scenario, Trichodermareesei is used for on-site enzyme production, which is modeledthe same as the 1999 NREL design report [29]. For inoculumgrowth and enzyme production, a fraction of conditioned pre-treated biomass is used as a carbon source. The specific activityof the enzymes, enzyme yield, and productivity are 600 filter paperunits (FPU)/g protein, 0.33 g protein/(g cellulose and xylose),0.125 g protein/(L h), respectively [29].
Ethanol is recovered from beer and dissolved solids by two-stepdistillation: a beer splitter column followed by a rectification col-umn. Distillation is an energy-intensive operation. To minimize en-ergy consumption in this section, a pervaporation separationscenario to replace the beer column is evaluated. Pervaporation re-fers to separation using a membrane with liquid feed on one side,and a low-pressure, gaseous permeate output on the other. Com-ponents in the liquid feed preferentially permeate through themembrane, and then evaporate into the gaseous phase. Pervapora-tion does not involve large heat input, which reduces costs associ-ated with the heat and steam needed for reboilers in the base casedistillation columns. In the pervaporation scenario, a membrane isinserted in place of the beer column. The pervaporation systemoutput is calculated from separation and total material flux factorsto achieve the same separation as the existing beer column of40 wt.% ethanol [30]. The resulting separation factor and totalmaterial flux were reasonable, given values used in a previous eco-nomic study [31]. In the base case scenario, the beer column alsoseparated out carbon dioxide for scrubbing. However, in the per-vaporation scenario, a flash tank is added to separate out CO2 at110 �C and a heat exchanger cools the stream to 41 �C. The mem-brane system costs $200/m2 in 1999 dollars, with a replacementneeded every 5 years at a cost of $100/m2 [31].
Wastewater is treated and recycled as process water, whilesteam and electricity are produced using the remaining biomasscomponents as boiler fuel.
2.2. Pioneer plant analysis
RAND Corporation developed two multi-factor linear regres-sions to estimate production shortfalls and capital growth of pio-neer process plants [16]. The regressions were developed usingdata collected from 44 process plants. The production shortfallsare accounted for in the regression equation for ‘‘plant perfor-mance”, which is the production in the second six months after ini-tial operation as a percentage of design capacity. Parameters usedto estimate plant performance are based on the number of processsteps that have not been demonstrated commercially, the massand energy balance equations that are validated with commercialscale data, the potential for waste-handling issues, and whetherthe plant handles solids.
The second regression equation (‘‘cost growth”) estimates theincrease in actual capital cost over the original estimate. Parame-
ters for cost growth are based on the cost estimate for equipmentnot demonstrated at the commercial scale, the potential for build-up of impurities, the number of continuously linked steps, and theinclusiveness of pre-start-up and land costs, and the level of site-specific information that is included in the cost estimate.
Three scenarios are considered in the pioneer plant analysis –most probable, optimistic, and pessimistic – representing the rangeof estimates for variables used in the regression equations for costgrowth and plant performance. However, only a comparison of thenth plant numbers and the most probable case is discussed in thepaper.
There are two variables that have the most significant impacton plant performance. The first variable accounts for the numberof steps not demonstrated on a commercial scale. The new stepsfor the process and units considered here are feedstock handling,pretreatment, saccharification, co-fermentation, beer column, andthe fluidized bed combustor. The second variable accounts forthe mass and energy balances that can be verified with commercialproduction data. This variable was assigned a low value for themost probable scenario because, with the exception of distillation,none of the mass and energy flows can be commercially verified.
For the equation for cost growth, there are two variables thatare the most significant. One of the variables accounts for the per-centage of total cost of new technologies employed in the plant.Feedstock handling, pretreatment, the saccharification vessels,co-fermentation, beer column and the fluidized bed combustorare included as new technologies. The variable accounting for po-tential buildup of impurities that can affect the process was givena mid-range value. There is a possibility of degradation productssuch as furfurals building up in the process, which are inhibitoryto fermentative organisms. The other parameters for cost growthwere less impactful for the range of variables chosen.
In the discounted cash flow spreadsheet, the total capitalinvestment (TCI) of the base case nth plant is divided by the per-centage of cost growth to estimate the TCI of the pioneer plant.The first-year ethanol sales, variable operating costs, and electricityexport of the nth plant is multiplied by the percentage of plant per-formance to account for the reduced production of a pioneer plant.For the discounted cash flow analysis, the plant performance is in-creased by 20% per year until design capacity is reached. The con-tingency is increased to 30% from 20% used in the nth plantanalysis to account for greater uncertainty in equipment and othercosts related solely to the nth plant design, even before consideringcost growth or plant performance.
3. Results and discussion
Results of the techno-economic process model and product val-ues (PV) are presented in Table 2 and Fig. 2, respectively.
There is significant variation of ethanol yields per mass of dryfeedstock among the pretreatment processes, with 2-stage di-lute-acid pretreatment being the lowest (47 gal/Mg or 0.18 m3/Mg) and dilute-acid pretreatment (base case scenario) being thehighest (76 gal/Mg or 0.29 m3/Mg). The installed equipment costof the dilute-acid pretreatment scenario is $164 million, and thecosts for other pretreatment scenarios vary between $156 and$173 million with the hot water pretreatment scenario being thelowest. The most significant contributor to the lower equipmentcost of the hot water pretreatment scenario is relative simplicity,and therefore lower cost, of the horizontal tubular reactor. The in-stalled cost of the tubular reactor is $0.31 million compared withthe dilute-acid (base case) and AFEX pretreatment reactor costsof $22.99 and $9.15 million, respectively. Although the AFEX reac-tor cost is lower than the dilute-acid pretreatment reactor, theadditional expense of the ammonia recycle equipment results in

Table 2Techno-economic analysis results for all processes variations.
Process variations Total capital investment($ million)
Total installed equipmentcost ($ million)
Ethanol yield(l/Mg)
Ethanol production(million l/year)
Electricity export($ million/year)
Dilute-acid pretreatment (base case) 376 164 289 202 11.7Dilute-acid pretreatment (high solids)a 389 169 274 192 12.62-Stage dilute-acid pretreatment 391 173 177 124 16.8Hot water pretreatment 327 156 211 148 11.3AFEX pretreatment 386 167 250 175 16.9Pervaporation–distillation 501 209 291 204 13.6Separate C5 and C6 fermentation 386 168 300 210 6.5On-site enzyme production 434 188 256 179 �0.8
a Pretreatment conversions used in the model are from NREL’s pretreatment reactor.
Fig. 2. Estimated ethanol product values (PV) from various process scenarios.
Fig. 3. Capital cost breakdown for the dilute-acid pretreatment scenario.
Fig. 4. Operating cost component as percentage of total operating cost for dilute-acid pretreatment scenario.
S24 F.K. Kazi et al. / Fuel 89 (2010) S20–S28
a total installed equipment cost that is greater than that of the di-lute-acid pretreatment scenario.
The PV for the dilute-acid pretreatment scenario is $1.36/LGE,which is the lowest among all scenarios (Fig. 2). It was thought thatthe 2-stage dilute-acid pretreatment scenario may offer economicadvantages because the process does not use enzymes for glucosehydrolysis, which is estimated to represent one of the most signif-icant expenses. Additionally, capital costs in the pretreatment andhydrolysis stages are reduced when $13.2 million of installed enzy-matic hydrolysis equipment are replaced with $8.4 million of 2-stage acid hydrolysis equipment. However, the lower celluloseyields in 2-stage acid hydrolysis reduce the ethanol productioncapacity, thereby offsetting the cost reductions due to not usingenzymes. The ethanol yield with the 2-stage dilute-acid scenariois only 177 l/Mg compared to 289 l/Mg for the dilute-acid base casescenario, while the installed equipment cost is higher than that ofthe dilute-acid base case scenario.
The capital and operating cost breakdown by process areas andcost components for the dilute-acid pretreatment scenario isshown in Figs. 3 and 4, respectively. The most expensive sectionsare the boiler/turbogenerator and pretreatment. Additional capitalexpense is incurred for the dilute-acid pretreatment scenario be-cause of the need to condition the pretreated slurry prior to fer-mentation. Overliming to remove sulfuric acid from the slurryadds an additional $10.8 million to the cost of dilute-acid pretreat-ment. The electricity credit from the boiler/turbogenerator for di-lute-acid pretreatment scenario is only 7%, whereas feedstockand variable operating cost is 73% of the total operating cost(Fig. 4).
It should be noted that the installed cost of the boiler/turbogen-erator is 34.2% of the total. An often-cited advantage of cellulosic
ethanol over corn grain ethanol is that the internally used energyis supplied by the plant by-products. However, this advantage inrenewable energy to fossil fuel input ratio may prove to be a majorfinancial impediment to commercialization because of the signifi-cant capital costs. An alternative to burning plant by-products forheat and power is burning natural gas. A natural gas boiler was
F.K. Kazi et al. / Fuel 89 (2010) S20–S28 S25
costed at $3 million installed [32], compared to over $30 millionfor a fluidized bed combustor needed for solid fuel. At a naturalgas cost of $7.05/BTU (based on 2007 prices [33]), the PV would in-crease to $1.43/LGE from $1.36/LGE, even before accounting fordisposal costs of the lignin and other plant by-products. A naturalgas boiler, as an understood commercial process, may have a costadvantage in the pioneer plant. Those cost advantages would bediminished by the need to deal with fluctuations in natural gasprice and a more greenhouse gas intensive process that may notqualify as a renewable fuel. Ultimately, the heat and powerrequirements for the cellulosic ethanol process may best be ad-dressed by lignin and other plant by-products, albeit with substan-tial capital equipment costs that affect PV.
Alternative saccharification/fermentation and distillation sce-narios were explored to determine their impact on PV. A trade-off exists with separate C5 and C6 sugar fermentation betweenhigher ethanol yields, and increased capital cost of additional fer-mentation vessels, as well as the additional operating expensesresulting from lower ethanol concentration in the beer (4–7%). Eth-anol yield in the base case scenario was 289 l/Mg. And while sep-arate C5 and C6 fermentation using selective microbes increasedethanol yield to 300 l/Mg, the PV is $0.11/LGE higher than the basecase scenario.
Distillation is a cost-intensive operation, and the cost increasesas ethanol concentration in the beer decreases. As a less energy-intensive process, pervaporation could decrease the operatingcosts compared to distillation. In this scenario, the pervaporationmembrane is used in place of the beer column. Because of the re-duced energy consumption of pervaporation, more steam is avail-able for electricity generation, and the exported electricity valueincreases nearly $2 million/year from the base case. However, thepervaporation option increased the PV by $0.14/LGE over the basecase. This is a result of the high capital cost of the membrane. Theinstalled membrane cost is $46.5 million compared to the beer col-umn cost of only $1.5 million.
It is assumed that for the base case scenario, enzyme broth ispurchased from external sources. However, production of enzymeson-site may offer economic advantages because it eliminates the
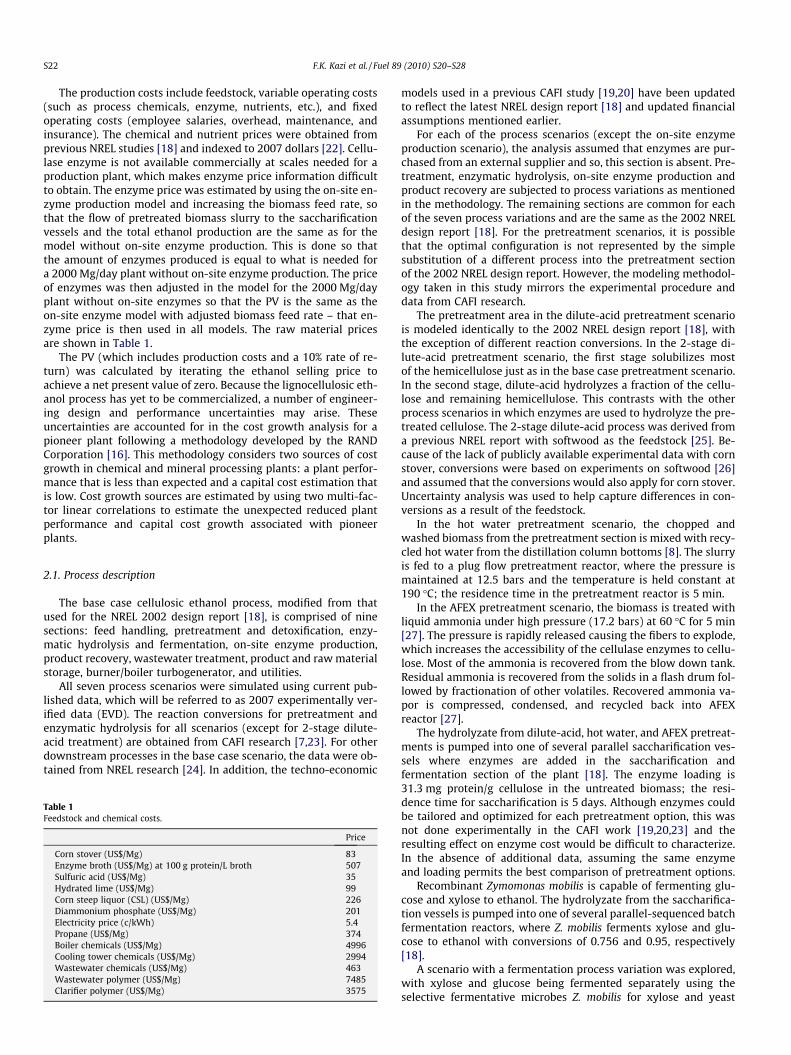
Fig. 5. Impact of pretreatment parameters on ethanol pro
cost of broth concentration, enzyme stabilizers, and transportation– costs that are not included this analysis. The annual enzyme costfor the base case scenario is $0.28/LGE. The PV from the on-site en-zyme production process scenario is $1.42/LGE, which is $0.06/LGEhigher than the base case scenario. This difference is a result of asignificant fraction of the feedstock (9.2% of the hydrolyzate) beingdiverted to the enzyme production area, which reduces the plantcapacity by 22.7 million l/year of ethanol. The reduction in ethanolcapacity reduces economy-of-scale advantages that occur withincreasing plant size. This could be overcome by increasing the bio-mass feed so that the ethanol capacity is equivalent to the basecase scenario. This was done to calculate the enzyme cost for thebase case scenario, and thus led to a lower PV. However, a greaterbiomass feed rate requires greater biomass availability. The cost ofthe enzyme is also affected by a lower electricity credit than thebase case, which is due to high electricity consumption by thecompressor supplying air to the enzyme production bioreactorsthat leads to lower net excess electricity and lower ethanol yield.Although this comparison does not include additional costs associ-ated with purchased enzymes, the comparison to an on-site casehelps demonstrate what yield and electricity tradeoffs occur whenenzyme is produced on-site.
3.1. Uncertainty analysis
Process-specific uncertainty analysis – involving pretreatmentand saccharification process conditions and reaction conversions– has been performed on all pretreatment process scenarios tostudy the impact of operating temperature, retention time, acidconcentrations, and yields on PV. These uncertainties are basedon a range of results found in the literature [7,8,25,26], which areshown in Figs. 5 and 6.
The PV is most sensitive to pretreatment retention time, xylanconversions, solids loading, and cellulose conversions. When theresidence time of the dilute-acid pretreatment reactor is increasedfrom 2 to 10 min, an increase in PV of 15% is observed because lar-ger reactors are needed. When the conversion of xylan to xylose inthe pretreatment reactor is reduced from 82.5 (2007 EVD) to 33%,
duct value (PV) for different pretreatment scenarios.
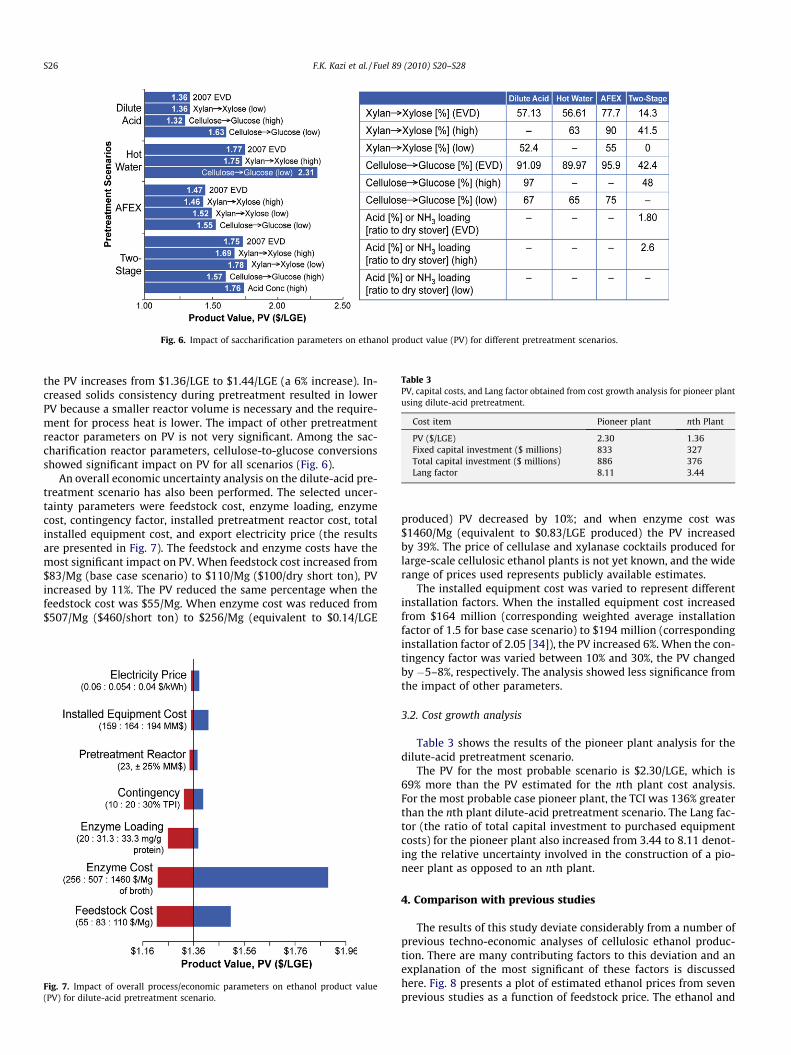
Fig. 6. Impact of saccharification parameters on ethanol product value (PV) for different pretreatment scenarios.
Table 3PV, capital costs, and Lang factor obtained from cost growth analysis for pioneer plantusing dilute-acid pretreatment.
Cost item Pioneer plant nth Plant
PV ($/LGE) 2.30 1.36Fixed capital investment ($ millions) 833 327Total capital investment ($ millions) 886 376Lang factor 8.11 3.44
S26 F.K. Kazi et al. / Fuel 89 (2010) S20–S28
the PV increases from $1.36/LGE to $1.44/LGE (a 6% increase). In-creased solids consistency during pretreatment resulted in lowerPV because a smaller reactor volume is necessary and the require-ment for process heat is lower. The impact of other pretreatmentreactor parameters on PV is not very significant. Among the sac-charification reactor parameters, cellulose-to-glucose conversionsshowed significant impact on PV for all scenarios (Fig. 6).
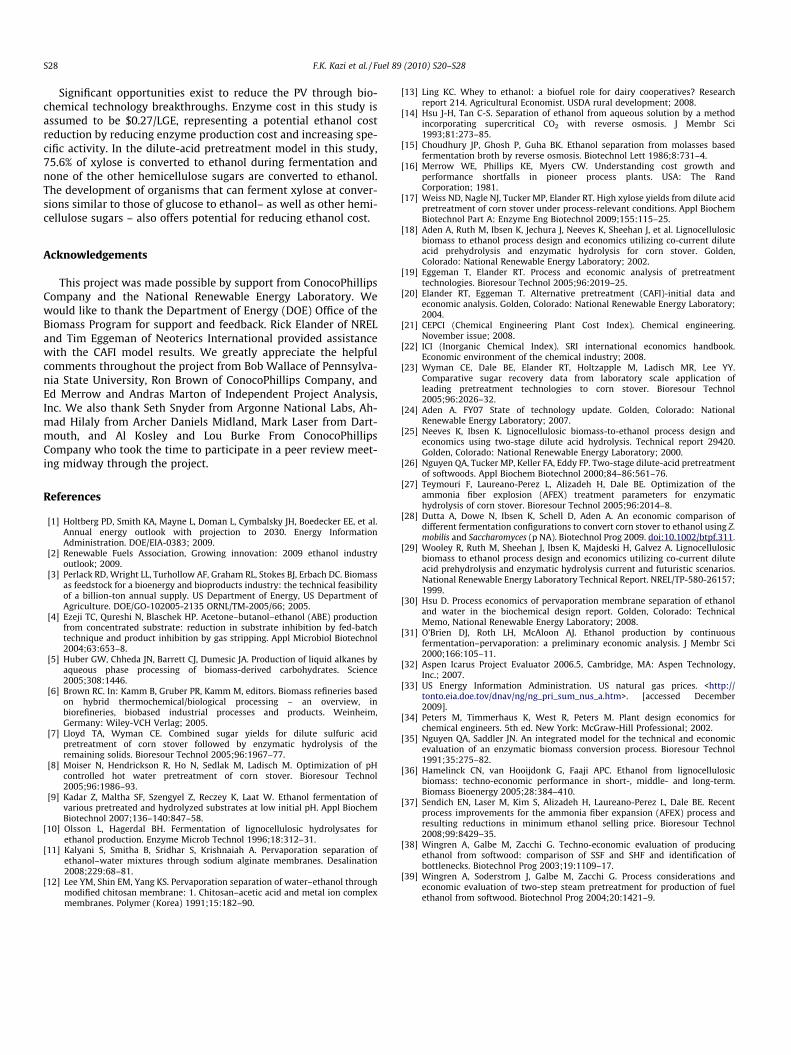
An overall economic uncertainty analysis on the dilute-acid pre-treatment scenario has also been performed. The selected uncer-tainty parameters were feedstock cost, enzyme loading, enzymecost, contingency factor, installed pretreatment reactor cost, totalinstalled equipment cost, and export electricity price (the resultsare presented in Fig. 7). The feedstock and enzyme costs have themost significant impact on PV. When feedstock cost increased from$83/Mg (base case scenario) to $110/Mg ($100/dry short ton), PVincreased by 11%. The PV reduced the same percentage when thefeedstock cost was $55/Mg. When enzyme cost was reduced from$507/Mg ($460/short ton) to $256/Mg (equivalent to $0.14/LGE
Fig. 7. Impact of overall process/economic parameters on ethanol product value(PV) for dilute-acid pretreatment scenario.
produced) PV decreased by 10%; and when enzyme cost was$1460/Mg (equivalent to $0.83/LGE produced) the PV increasedby 39%. The price of cellulase and xylanase cocktails produced forlarge-scale cellulosic ethanol plants is not yet known, and the widerange of prices used represents publicly available estimates.
The installed equipment cost was varied to represent differentinstallation factors. When the installed equipment cost increasedfrom $164 million (corresponding weighted average installationfactor of 1.5 for base case scenario) to $194 million (correspondinginstallation factor of 2.05 [34]), the PV increased 6%. When the con-tingency factor was varied between 10% and 30%, the PV changedby �5–8%, respectively. The analysis showed less significance fromthe impact of other parameters.
3.2. Cost growth analysis
Table 3 shows the results of the pioneer plant analysis for thedilute-acid pretreatment scenario.
The PV for the most probable scenario is $2.30/LGE, which is69% more than the PV estimated for the nth plant cost analysis.For the most probable case pioneer plant, the TCI was 136% greaterthan the nth plant dilute-acid pretreatment scenario. The Lang fac-tor (the ratio of total capital investment to purchased equipmentcosts) for the pioneer plant also increased from 3.44 to 8.11 denot-ing the relative uncertainty involved in the construction of a pio-neer plant as opposed to an nth plant.
4. Comparison with previous studies
The results of this study deviate considerably from a number ofprevious techno-economic analyses of cellulosic ethanol produc-tion. There are many contributing factors to this deviation and anexplanation of the most significant of these factors is discussedhere. Fig. 8 presents a plot of estimated ethanol prices from sevenprevious studies as a function of feedstock price. The ethanol and

Fig. 8. Ethanol product values (PVs) from previously published techno-economic studies and comparison. Note: (1) short-term technology – simultaneous saccharificationand fermentation (SSF) (2) middle-term technology – simultaneous saccharification and co-fermentation (SSCF) (3) long-term technology – consolidated bioprocessing (CBP)(4) separate hydrolysis and fermentation (SHF) (5) SSF (6) CBP and (7) SSCF.
F.K. Kazi et al. / Fuel 89 (2010) S20–S28 S27
feedstock prices were updated to 2007 dollars using the ConsumerPrice Index. The solid line on the plot represents the PV for the di-lute-acid pretreatment scenario using the model developed in thisstudy as a function of feedstock price.
After updating the feedstock and ethanol prices to 2007 dollars,much of the difference from previous studies can be explained bythe clear correlation that exists between feedstock price and etha-nol price. However, all of the studies except that of Nguyen andSaddler [35] remain lower than the line derived from this study.The study by Hamelinck et al. [36] represents a significant outlierfrom the apparent correlation between feedstock price and ethanolprice. The three ethanol price estimates are for short- (5 years fromtime of study), middle- (10–15 years), and long-term (20 + years)technology implementation. The short-term estimate is closer tothe time frame considered in this study. However, it also deviatesfrom the trend of other studies. The assumptions for the short-term estimate – including feedstock input, rate of return, and reac-tion conversions – are quite similar to those in this study; and theTCI (updated to 2007 dollars) is nearly equal as well. The most sig-nificant difference from this study is the non-feedstock operatingcost, which is approximately $0.13/LGE compared to $0.67/LGE.This is partly due to lower costs for corn steep liquor, cellulase,and other raw materials. This factor accounts for most of the dis-crepancy between ethanol price estimates.
The ethanol price from the study published by Sendich et al.[37] is also slightly lower than the apparent correlation of feed-stock and ethanol price. The lowest estimate in that study assumesthe use of consolidated bioprocessing, which is an advanced tech-nology also modeled in the long-term estimate from Hamelincket al. [36]. The higher ethanol price estimate of $0.41/LGE is froma model using simultaneous saccharification and co-fermentation(SSCF). SSCF is also a more advanced technology than was consid-ered in this study; this factor results in lower capital and operatingcosts by combining enzymatic saccharification and fermentation. Anew AFEX pretreatment scheme was also employed, which mayhave contributed to lower capital and operating costs ofpretreatment.
The enzyme cost used in this study is much higher than thatused in other studies; and because enzyme cost is such a signifi-cant fraction of the PV, it contributes significantly to the discrep-ancy between the current study and previous studies. For
example, the enzyme prices used in prior studies [38,39,18] areapproximately 30%, 30%, and 17% of the price used in this study,respectively.
5. Conclusions
The PV for the dilute-acid pretreatment scenario is $1.36/LGE,which is the lowest among all pretreatments and process varia-tions. This is due primarily to the higher sugar yields – and, there-fore, ethanol yields – from dilute-acid pretreatment and enzymatichydrolysis than for the other process scenarios. The exception tothis is the scenario with separate C5 and C6 sugar fermentation,which has higher ethanol yields. However, the PV is higher becauseof the high capital cost of extra fermentation vessels needed to fer-ment the sugars separately.
A high level of uncertainty exists for the cost of cellulase en-zymes, which leads to a wide range of PV observed in the sensitiv-ity analysis. The range of enzyme price used in the sensitivityanalysis corresponds to enzyme costs of $0.14–$0.80/LGE. Therange of PV following from these enzyme prices is $1.22–$1.89/LGE. Similarly, there is continued debate regarding the price ofcorn stover. The range of PV from the sensitivity of the feedstockprice is $1.22–$1.51-/LGE. While these raw materials contributeto a high degree of financial uncertainty of cellulosic ethanol pro-duction, it may prove difficult to fully understand their costs untilmarkets exist.
Installed equipment costs for an nth plant total $164 million.The largest contributor to this cost at $56.1 million is the boiler/tur-bogenerator system needed to convert lignin to heat and power forthe process. Although producing electricity from plant by-productsprovides sustainability advantages and may be the most cost effec-tive process, its large capital cost may hinder commercialization.
To estimate the potential risk associated with process scale-up,a pioneer plant risk analysis was conducted. Under the most prob-able assumptions for pioneer plant operation for the dilute-acidpretreatment scenario, the PV is $2.30/LGE. Additionally, the TCIfor the most probable case is estimated to double from the costof an nth plant. Because of the large capital cost and the PV beingwell above ethanol market prices for a pioneer plant, it may provedifficult for the cellulosic ethanol industry to finance growth until anumber of biotechnology barriers are broken.
S28 F.K. Kazi et al. / Fuel 89 (2010) S20–S28
Significant opportunities exist to reduce the PV through bio-chemical technology breakthroughs. Enzyme cost in this study isassumed to be $0.27/LGE, representing a potential ethanol costreduction by reducing enzyme production cost and increasing spe-cific activity. In the dilute-acid pretreatment model in this study,75.6% of xylose is converted to ethanol during fermentation andnone of the other hemicellulose sugars are converted to ethanol.The development of organisms that can ferment xylose at conver-sions similar to those of glucose to ethanol– as well as other hemi-cellulose sugars – also offers potential for reducing ethanol cost.
Acknowledgements
This project was made possible by support from ConocoPhillipsCompany and the National Renewable Energy Laboratory. Wewould like to thank the Department of Energy (DOE) Office of theBiomass Program for support and feedback. Rick Elander of NRELand Tim Eggeman of Neoterics International provided assistancewith the CAFI model results. We greatly appreciate the helpfulcomments throughout the project from Bob Wallace of Pennsylva-nia State University, Ron Brown of ConocoPhillips Company, andEd Merrow and Andras Marton of Independent Project Analysis,Inc. We also thank Seth Snyder from Argonne National Labs, Ah-mad Hilaly from Archer Daniels Midland, Mark Laser from Dart-mouth, and Al Kosley and Lou Burke From ConocoPhillipsCompany who took the time to participate in a peer review meet-ing midway through the project.
References
[1] Holtberg PD, Smith KA, Mayne L, Doman L, Cymbalsky JH, Boedecker EE, et al.Annual energy outlook with projection to 2030. Energy InformationAdministration. DOE/EIA-0383; 2009.
[2] Renewable Fuels Association, Growing innovation: 2009 ethanol industryoutlook; 2009.
[3] Perlack RD, Wright LL, Turhollow AF, Graham RL, Stokes BJ, Erbach DC. Biomassas feedstock for a bioenergy and bioproducts industry: the technical feasibilityof a billion-ton annual supply. US Department of Energy, US Department ofAgriculture. DOE/GO-102005-2135 ORNL/TM-2005/66; 2005.
[4] Ezeji TC, Qureshi N, Blaschek HP. Acetone–butanol–ethanol (ABE) productionfrom concentrated substrate: reduction in substrate inhibition by fed-batchtechnique and product inhibition by gas stripping. Appl Microbiol Biotechnol2004;63:653–8.
[5] Huber GW, Chheda JN, Barrett CJ, Dumesic JA. Production of liquid alkanes byaqueous phase processing of biomass-derived carbohydrates. Science2005;308:1446.
[6] Brown RC. In: Kamm B, Gruber PR, Kamm M, editors. Biomass refineries basedon hybrid thermochemical/biological processing – an overview, inbiorefineries, biobased industrial processes and products. Weinheim,Germany: Wiley-VCH Verlag; 2005.
[7] Lloyd TA, Wyman CE. Combined sugar yields for dilute sulfuric acidpretreatment of corn stover followed by enzymatic hydrolysis of theremaining solids. Bioresour Technol 2005;96:1967–77.
[8] Moiser N, Hendrickson R, Ho N, Sedlak M, Ladisch M. Optimization of pHcontrolled hot water pretreatment of corn stover. Bioresour Technol2005;96:1986–93.
[9] Kadar Z, Maltha SF, Szengyel Z, Reczey K, Laat W. Ethanol fermentation ofvarious pretreated and hydrolyzed substrates at low initial pH. Appl BiochemBiotechnol 2007;136–140:847–58.
[10] Olsson L, Hagerdal BH. Fermentation of lignocellulosic hydrolysates forethanol production. Enzyme Microb Technol 1996;18:312–31.
[11] Kalyani S, Smitha B, Sridhar S, Krishnaiah A. Pervaporation separation ofethanol–water mixtures through sodium alginate membranes. Desalination2008;229:68–81.
[12] Lee YM, Shin EM, Yang KS. Pervaporation separation of water–ethanol throughmodified chitosan membrane: 1. Chitosan–acetic acid and metal ion complexmembranes. Polymer (Korea) 1991;15:182–90.
[13] Ling KC. Whey to ethanol: a biofuel role for dairy cooperatives? Researchreport 214. Agricultural Economist. USDA rural development; 2008.
[14] Hsu J-H, Tan C-S. Separation of ethanol from aqueous solution by a methodincorporating supercritical CO2 with reverse osmosis. J Membr Sci1993;81:273–85.
[15] Choudhury JP, Ghosh P, Guha BK. Ethanol separation from molasses basedfermentation broth by reverse osmosis. Biotechnol Lett 1986;8:731–4.
[16] Merrow WE, Phillips KE, Myers CW. Understanding cost growth andperformance shortfalls in pioneer process plants. USA: The RandCorporation; 1981.
[17] Weiss ND, Nagle NJ, Tucker MP, Elander RT. High xylose yields from dilute acidpretreatment of corn stover under process-relevant conditions. Appl BiochemBiotechnol Part A: Enzyme Eng Biotechnol 2009;155:115–25.
[18] Aden A, Ruth M, Ibsen K, Jechura J, Neeves K, Sheehan J, et al. Lignocellulosicbiomass to ethanol process design and economics utilizing co-current diluteacid prehydrolysis and enzymatic hydrolysis for corn stover. Golden,Colorado: National Renewable Energy Laboratory; 2002.
[19] Eggeman T, Elander RT. Process and economic analysis of pretreatmenttechnologies. Bioresour Technol 2005;96:2019–25.
[20] Elander RT, Eggeman T. Alternative pretreatment (CAFI)-initial data andeconomic analysis. Golden, Colorado: National Renewable Energy Laboratory;2004.
[21] CEPCI (Chemical Engineering Plant Cost Index). Chemical engineering.November issue; 2008.
[22] ICI (Inorganic Chemical Index). SRI international economics handbook.Economic environment of the chemical industry; 2008.
[23] Wyman CE, Dale BE, Elander RT, Holtzapple M, Ladisch MR, Lee YY.Comparative sugar recovery data from laboratory scale application ofleading pretreatment technologies to corn stover. Bioresour Technol2005;96:2026–32.
[24] Aden A. FY07 State of technology update. Golden, Colorado: NationalRenewable Energy Laboratory; 2007.
[25] Neeves K, Ibsen K. Lignocellulosic biomass-to-ethanol process design andeconomics using two-stage dilute acid hydrolysis. Technical report 29420.Golden, Colorado: National Renewable Energy Laboratory; 2000.
[26] Nguyen QA, Tucker MP, Keller FA, Eddy FP. Two-stage dilute-acid pretreatmentof softwoods. Appl Biochem Biotechnol 2000;84–86:561–76.
[27] Teymouri F, Laureano-Perez L, Alizadeh H, Dale BE. Optimization of theammonia fiber explosion (AFEX) treatment parameters for enzymatichydrolysis of corn stover. Bioresour Technol 2005;96:2014–8.
[28] Dutta A, Dowe N, Ibsen K, Schell D, Aden A. An economic comparison ofdifferent fermentation configurations to convert corn stover to ethanol using Z.mobilis and Saccharomyces (p NA). Biotechnol Prog 2009. doi:10.1002/btpf.311.
[29] Wooley R, Ruth M, Sheehan J, Ibsen K, Majdeski H, Galvez A. Lignocellulosicbiomass to ethanol process design and economics utilizing co-current diluteacid prehydrolysis and enzymatic hydrolysis current and futuristic scenarios.National Renewable Energy Laboratory Technical Report. NREL/TP-580-26157;1999.
[30] Hsu D. Process economics of pervaporation membrane separation of ethanoland water in the biochemical design report. Golden, Colorado: TechnicalMemo, National Renewable Energy Laboratory; 2008.
[31] O’Brien DJ, Roth LH, McAloon AJ. Ethanol production by continuousfermentation–pervaporation: a preliminary economic analysis. J Membr Sci2000;166:105–11.
[32] Aspen Icarus Project Evaluator 2006.5, Cambridge, MA: Aspen Technology,Inc.; 2007.
[33] US Energy Information Administration. US natural gas prices. <http://tonto.eia.doe.tov/dnav/ng/ng_pri_sum_nus_a.htm>. [accessed December2009].
[34] Peters M, Timmerhaus K, West R, Peters M. Plant design economics forchemical engineers. 5th ed. New York: McGraw-Hill Professional; 2002.
[35] Nguyen QA, Saddler JN. An integrated model for the technical and economicevaluation of an enzymatic biomass conversion process. Bioresour Technol1991;35:275–82.
[36] Hamelinck CN, van Hooijdonk G, Faaji APC. Ethanol from lignocellulosicbiomass: techno-economic performance in short-, middle- and long-term.Biomass Bioenergy 2005;28:384–410.
[37] Sendich EN, Laser M, Kim S, Alizadeh H, Laureano-Perez L, Dale BE. Recentprocess improvements for the ammonia fiber expansion (AFEX) process andresulting reductions in minimum ethanol selling price. Bioresour Technol2008;99:8429–35.
[38] Wingren A, Galbe M, Zacchi G. Techno-economic evaluation of producingethanol from softwood: comparison of SSF and SHF and identification ofbottlenecks. Biotechnol Prog 2003;19:1109–17.
[39] Wingren A, Soderstrom J, Galbe M, Zacchi G. Process considerations andeconomic evaluation of two-step steam pretreatment for production of fuelethanol from softwood. Biotechnol Prog 2004;20:1421–9.