strengthening and reinforcing quantitative reasoning ... filestrengthening and reinforcing...
TRANSCRIPT
LAURA BROUGHTON, REBECA ARAYA, KYENG LEE , & CARLOS LIACHOVITZKY
Strengthening and Reinforcing Quantitative Reasoning Skills in Biology Courses at a Large Urban Community College
KYENG LEE , & CARLOS LIACHOVITZKY
DEPARTMENT OF BIOLOGY & MEDICAL
LABORATORY TECHNOLOGY
BRONX COMMUNITY COLLEGE
NNN – OCTOBER 13 , 2012
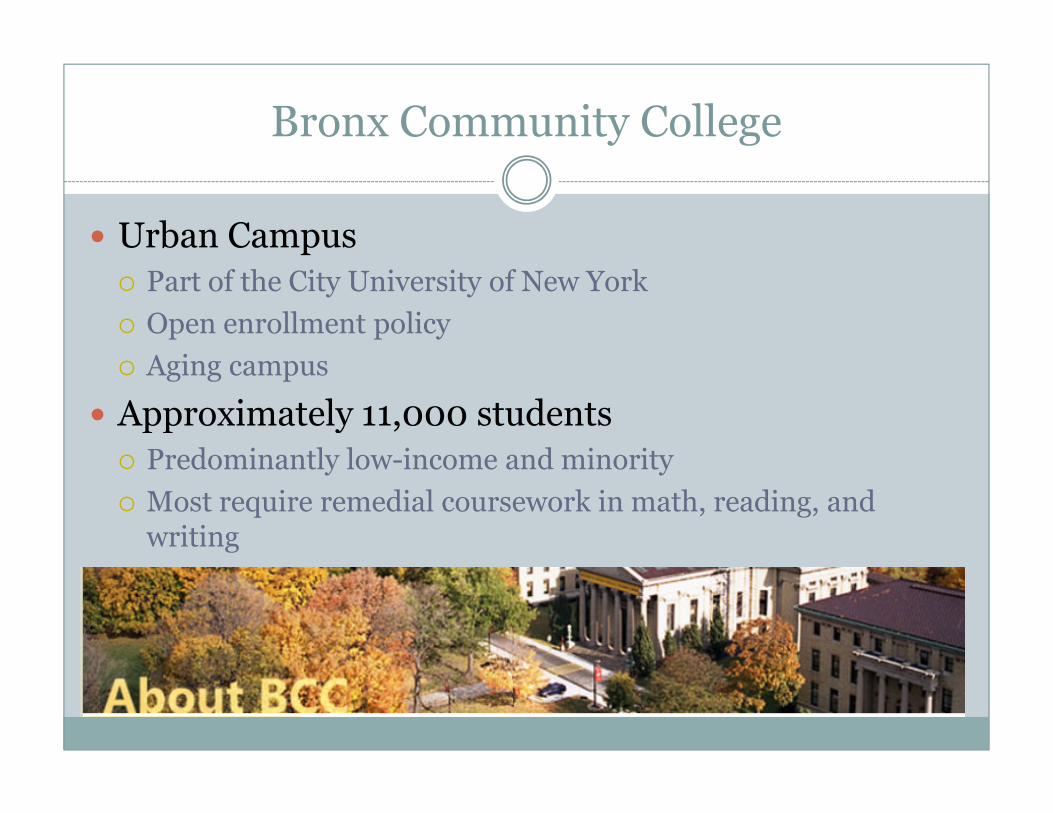
Bronx Community College
� Urban Campus
� Part of the City University of New York
� Open enrollment policy
� Aging campus
� Approximately 11,000 students� Approximately 11,000 students
� Predominantly low-income and minority
� Most require remedial coursework in math, reading, and writing
Project Rationale
� QL skills are essential for understanding biology
� The transfer of skills from one discipline to another by students is a separate skill and is actually less common than educators expect
� Faculty members had made the assumption that � Faculty members had made the assumption that students had learned the necessary QL skills prior to taking biology classes and would be able to apply them in a biology setting, but observations proved otherwise
� Therefore: Biology faculty members needed to take a more active role in teaching & reinforcing QL skills
Project Overview
� Goal: Integrating and reinforcing quantitative reasoning skills
� Courses: Introductory courses taught by multiple professors in multiple sections
� Method:� Method:� Identify the 1 or 2 of the most important QL skills in each course
� Integrate several modules into the course that reinforce the same QL skill over the semester
� Assessment: Student learning assessed through cognitive and analytical pre- & post-tests
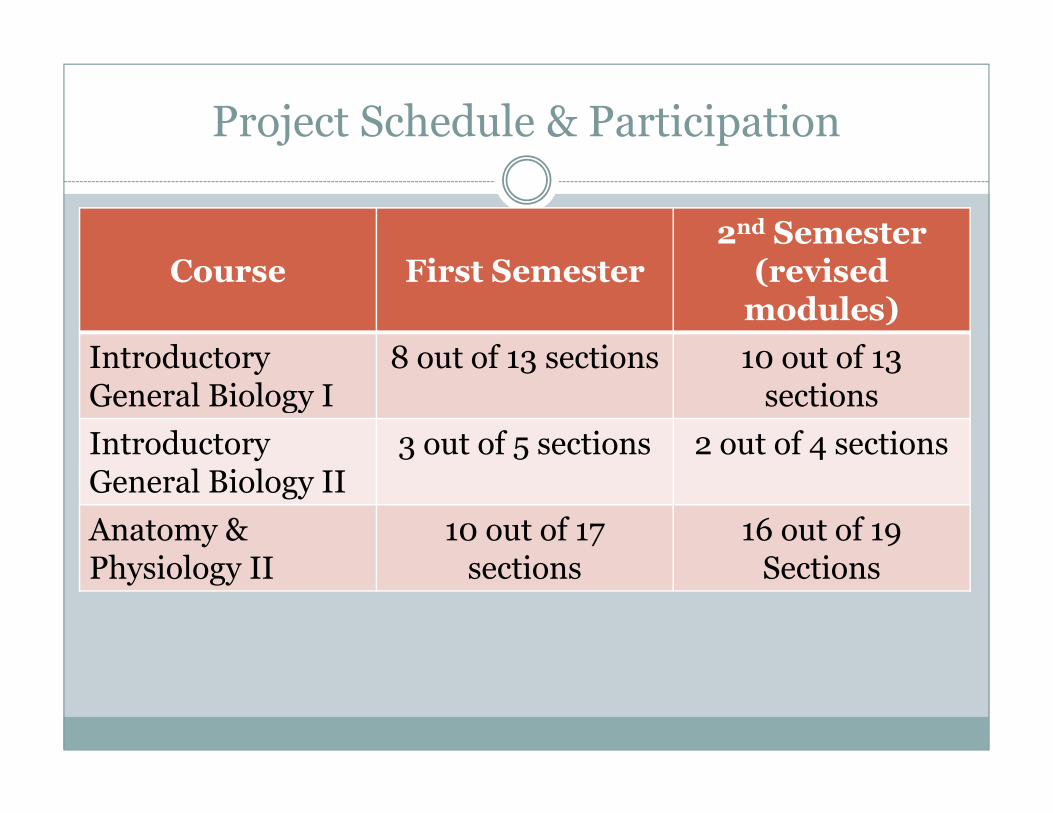
Project Schedule & Participation
Course First Semester2nd Semester (revised modules)
Introductory General Biology I
8 out of 13 sections 10 out of 13 sectionsGeneral Biology I sections
Introductory General Biology II
3 out of 5 sections 2 out of 4 sections
Anatomy & Physiology II
10 out of 17 sections
16 out of 19 Sections
GRAPH CREATION
Introductory General BiologyI & II
GRAPH CREATION
GRAPH INTERPRETATION
PROBABILITY
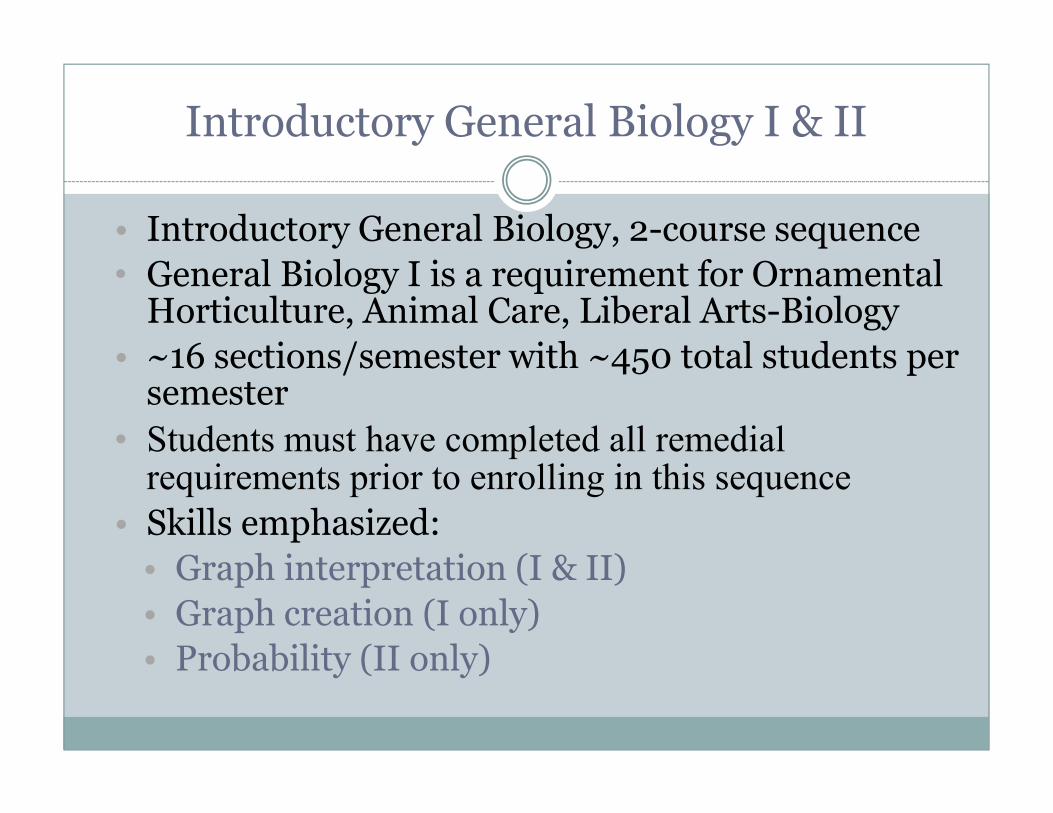
Introductory General Biology I & II
• Introductory General Biology, 2-course sequence
• General Biology I is a requirement for Ornamental Horticulture, Animal Care, Liberal Arts-Biology
• ~16 sections/semester with ~450 total students per semestersemester
• Students must have completed all remedial requirements prior to enrolling in this sequence
• Skills emphasized:
• Graph interpretation (I & II)
• Graph creation (I only)
• Probability (II only)
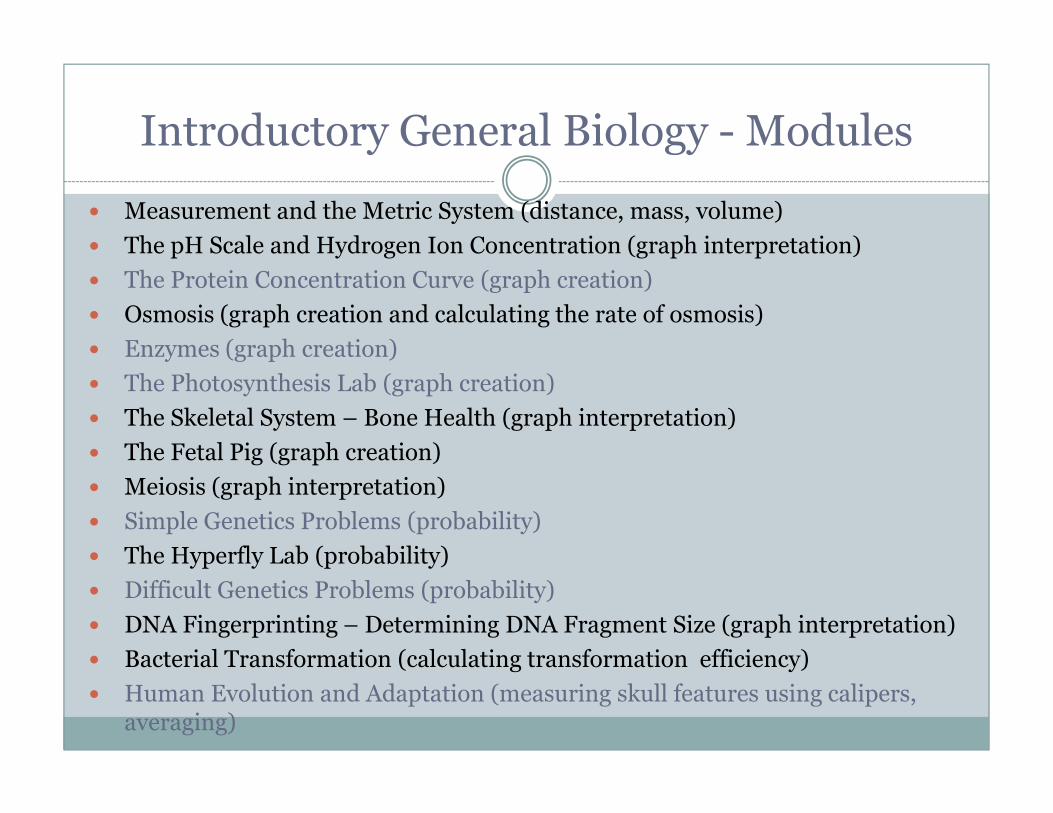
Introductory General Biology - Modules
� Measurement and the Metric System (distance, mass, volume)
� The pH Scale and Hydrogen Ion Concentration (graph interpretation)
� The Protein Concentration Curve (graph creation)
� Osmosis (graph creation and calculating the rate of osmosis)
� Enzymes (graph creation)
� The Photosynthesis Lab (graph creation)
The Skeletal System – Bone Health (graph interpretation)� The Skeletal System – Bone Health (graph interpretation)
� The Fetal Pig (graph creation)
� Meiosis (graph interpretation)
� Simple Genetics Problems (probability)
� The Hyperfly Lab (probability)
� Difficult Genetics Problems (probability)
� DNA Fingerprinting – Determining DNA Fragment Size (graph interpretation)
� Bacterial Transformation (calculating transformation efficiency)
� Human Evolution and Adaptation (measuring skull features using calipers, averaging)
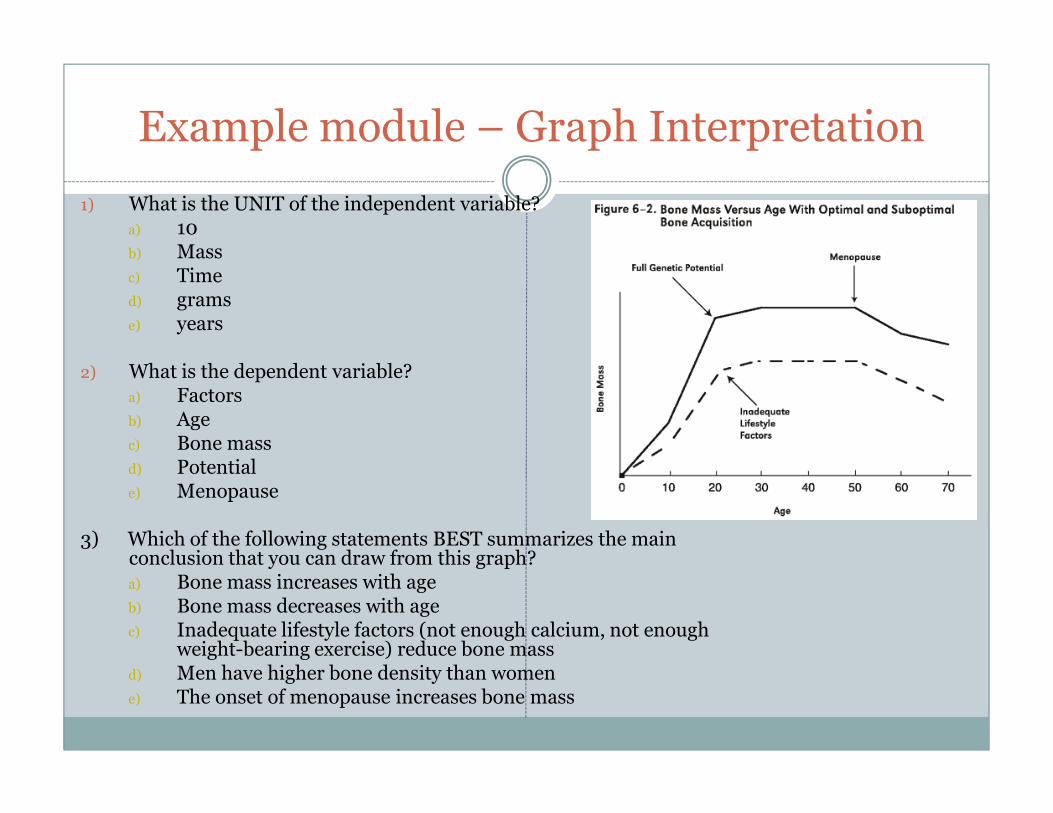
Example module – Graph Interpretation
1) What is the UNIT of the independent variable?a) 10b) Massc) Timed) gramse) years
2) What is the dependent variable?a) Factorsb) Agec) Bone massd) Potentiale) Menopause
3) Which of the following statements BEST summarizes the main conclusion that you can draw from this graph?a) Bone mass increases with ageb) Bone mass decreases with agec) Inadequate lifestyle factors (not enough calcium, not enough
weight-bearing exercise) reduce bone massd) Men have higher bone density than womene) The onset of menopause increases bone mass
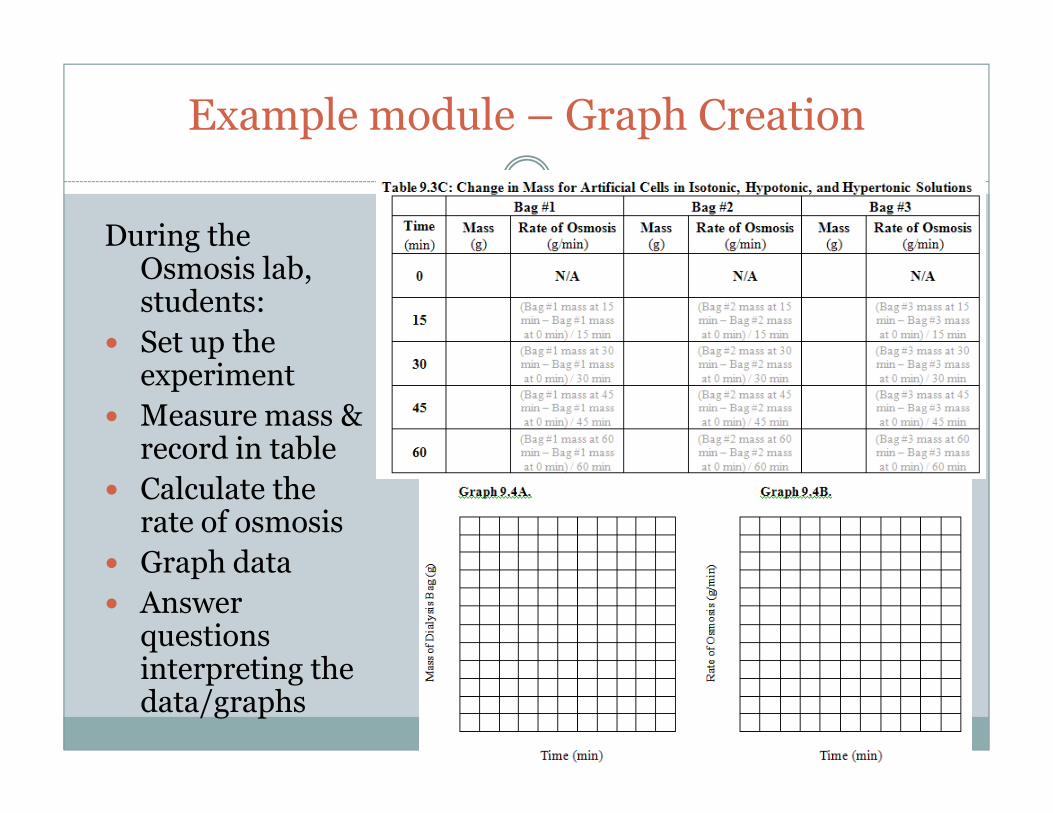
Example module – Graph Creation
During the Osmosis lab, students:
� Set up the experiment
� Measure mass & � Measure mass & record in table
� Calculate the rate of osmosis
� Graph data
� Answer questions interpreting the data/graphs
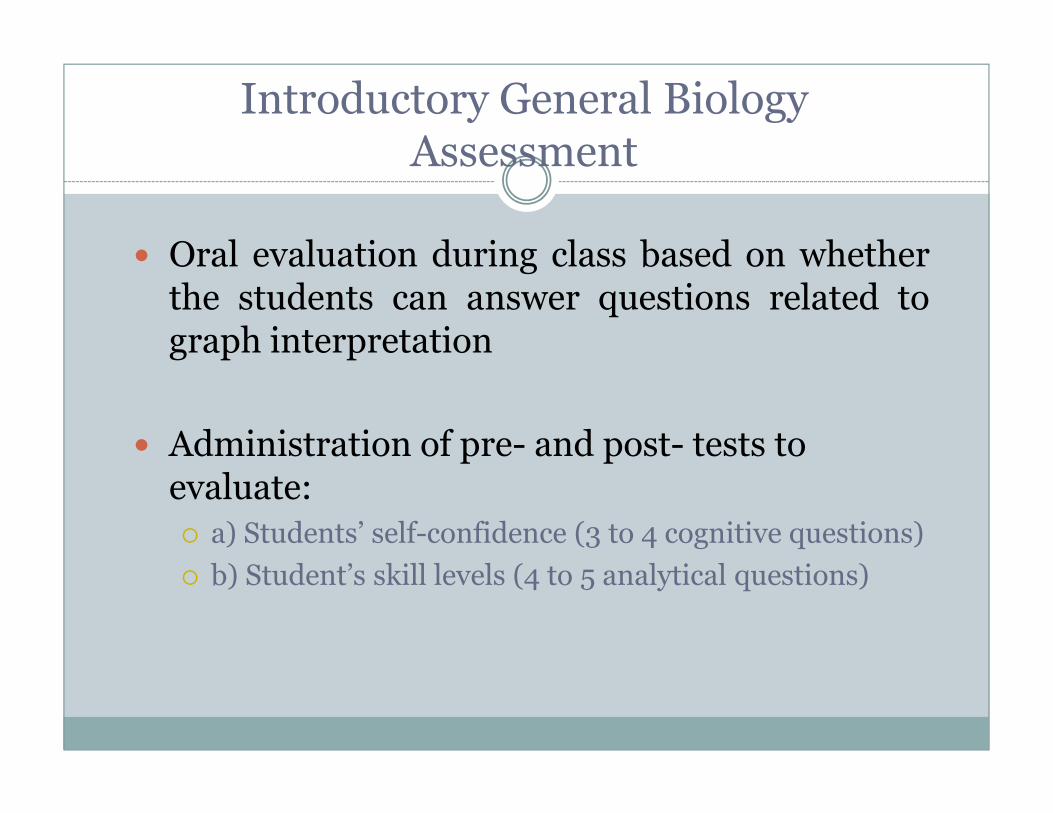
Introductory General Biology Assessment
� Oral evaluation during class based on whetherthe students can answer questions related tograph interpretation
� Administration of pre- and post- tests to evaluate:
� a) Students’ self-confidence (3 to 4 cognitive questions)
� b) Student’s skill levels (4 to 5 analytical questions)
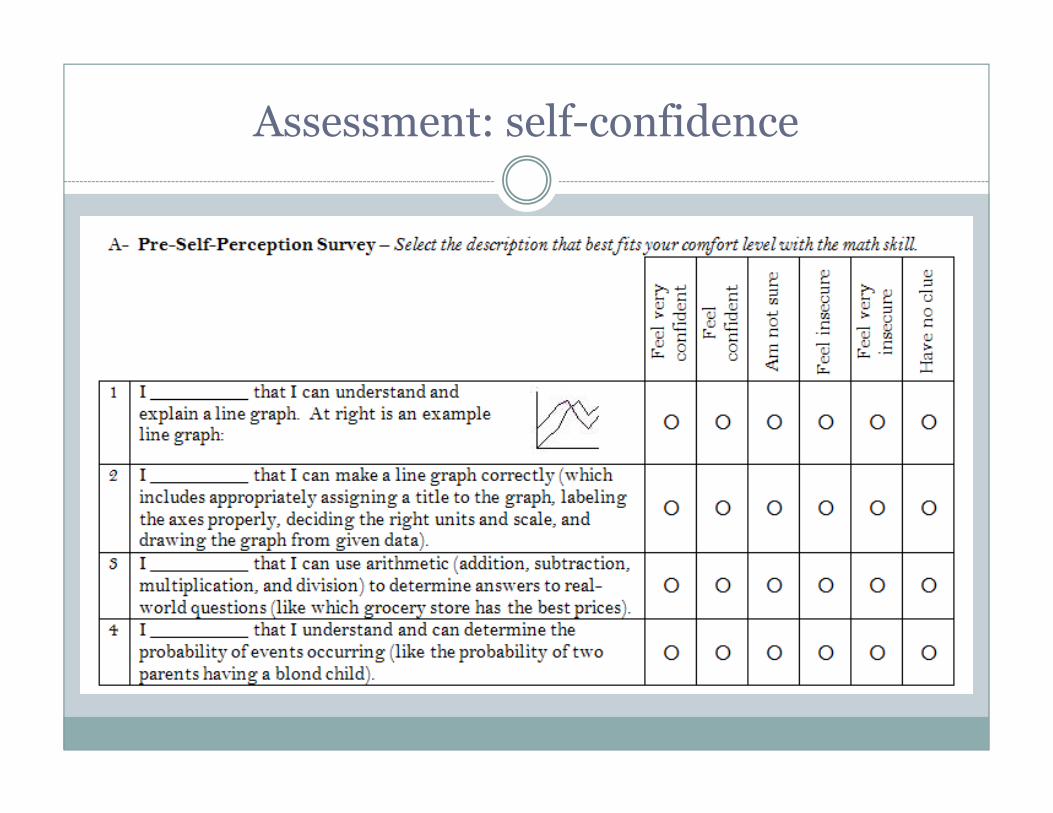
Assessment: self-confidence
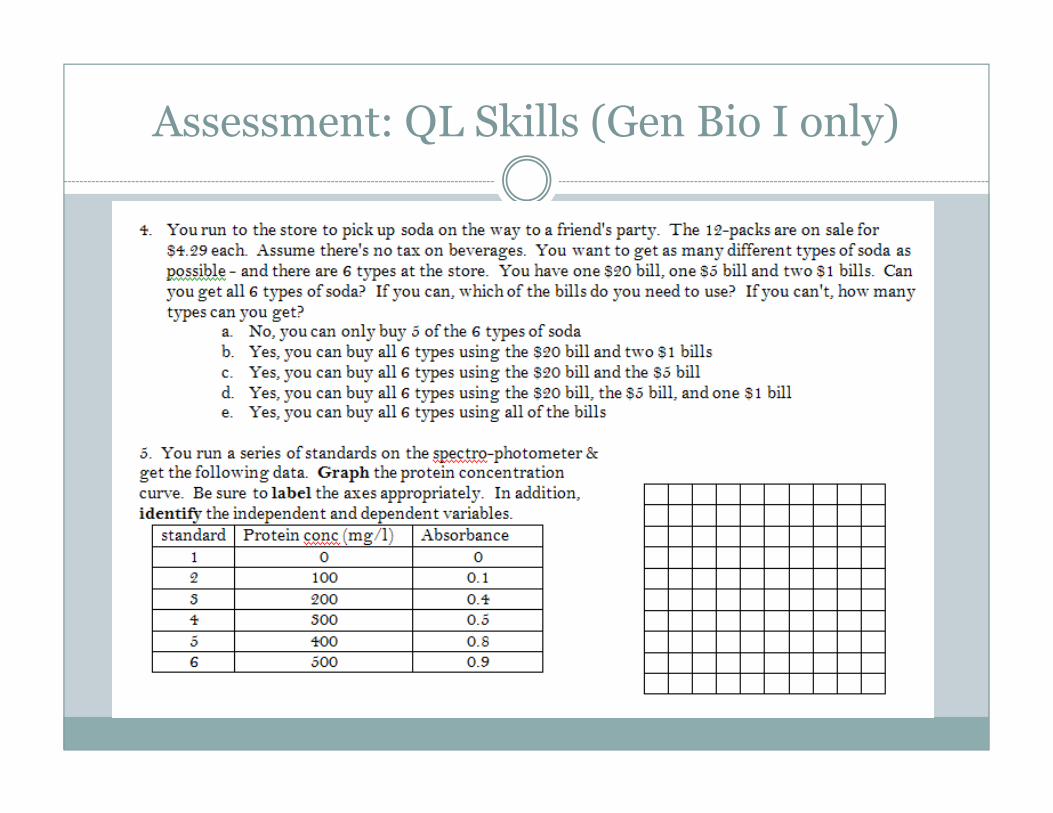
Assessment: QL Skills (Gen Bio I only)
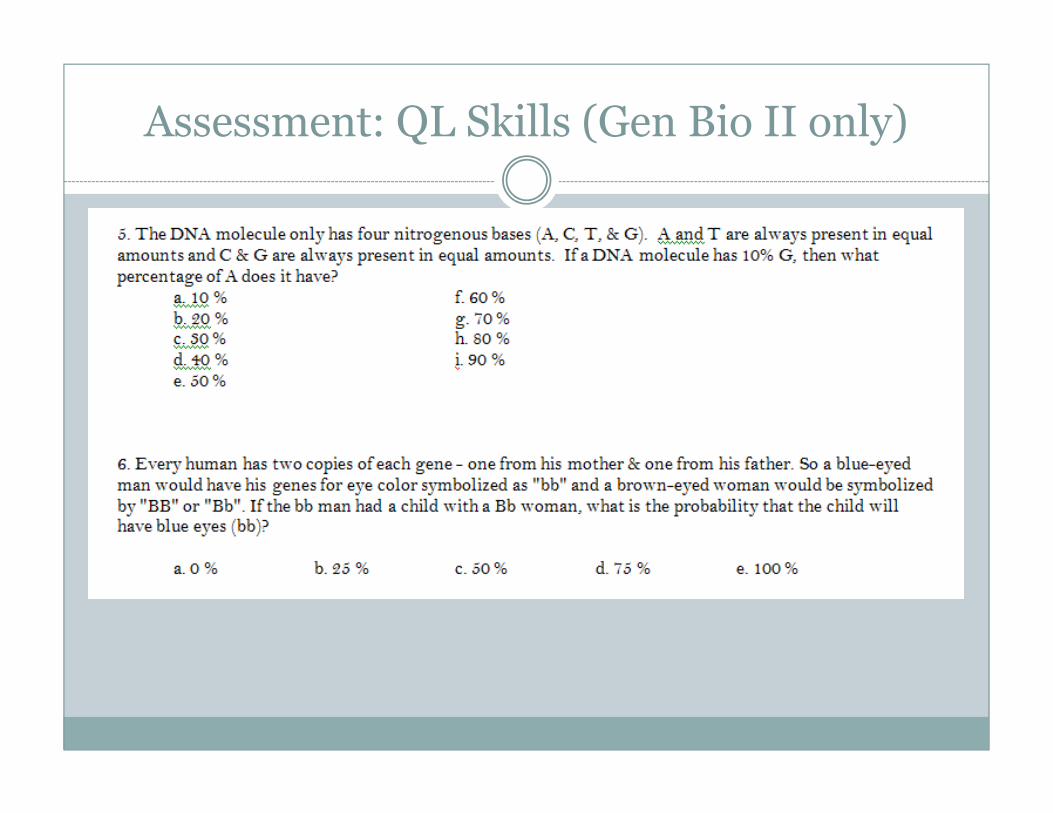
Assessment: QL Skills (Gen Bio II only)
Assessment: QL Skills (Gen Bio I & II)
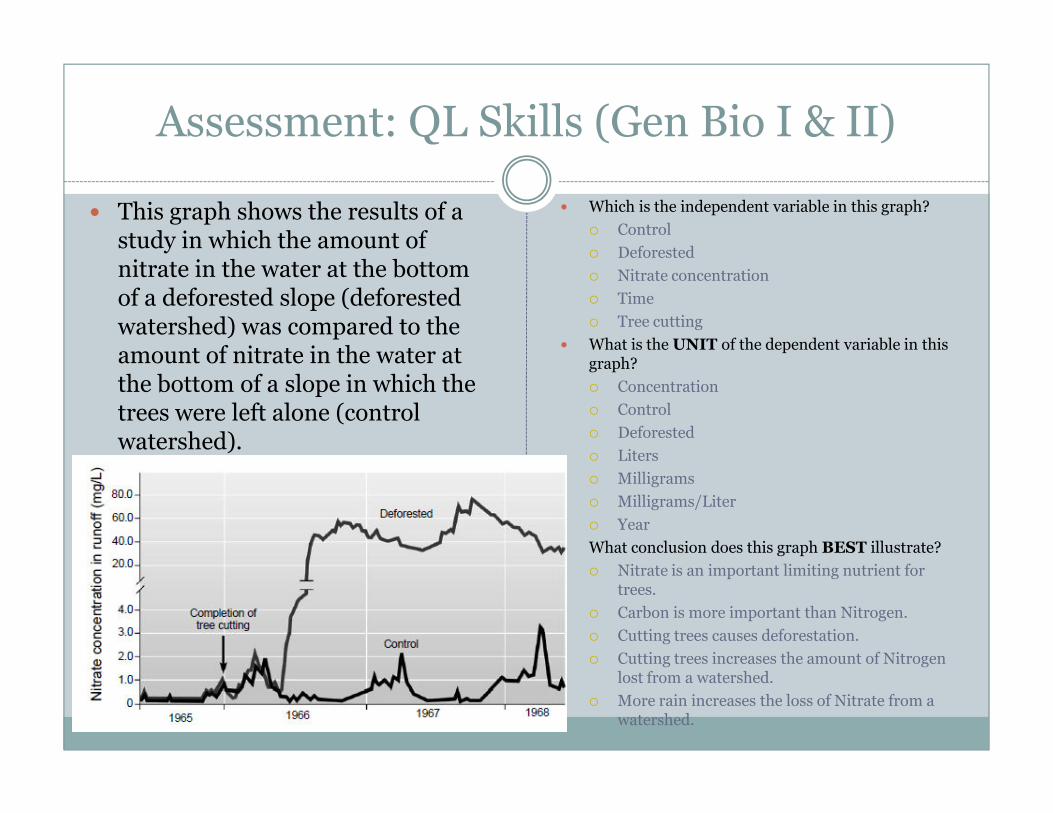
� This graph shows the results of a study in which the amount of nitrate in the water at the bottom of a deforested slope (deforested watershed) was compared to the amount of nitrate in the water at the bottom of a slope in which the trees were left alone (control
� Which is the independent variable in this graph?
� Control
� Deforested
� Nitrate concentration
� Time
� Tree cutting
� What is the UNIT of the dependent variable in this graph?
� Concentration
� Controltrees were left alone (control watershed).
� Control
� Deforested
� Liters
� Milligrams
� Milligrams/Liter
� Year
� What conclusion does this graph BEST illustrate?
� Nitrate is an important limiting nutrient for trees.
� Carbon is more important than Nitrogen.
� Cutting trees causes deforestation.
� Cutting trees increases the amount of Nitrogen lost from a watershed.
� More rain increases the loss of Nitrate from a watershed.
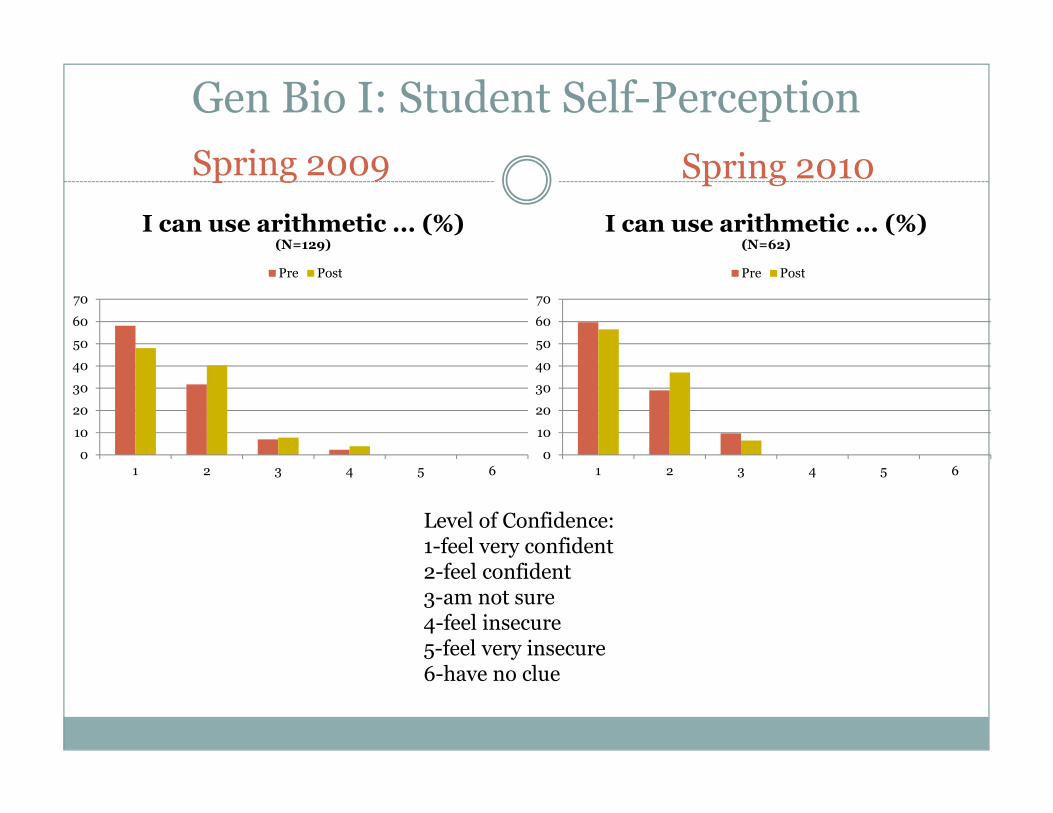
Gen Bio I: Student Self-Perception
Spring 2009 Spring 2010
20
30
40
50
60
70
I can use arithmetic ... (%)(N=129)
Pre Post
20
30
40
50
60
70
I can use arithmetic ... (%)(N=62)
Pre Post
0
10
20
1 2 3 4 5 6
0
10
20
1 2 3 4 5 6
Level of Confidence: 1-feel very confident2-feel confident3-am not sure4-feel insecure5-feel very insecure6-have no clue
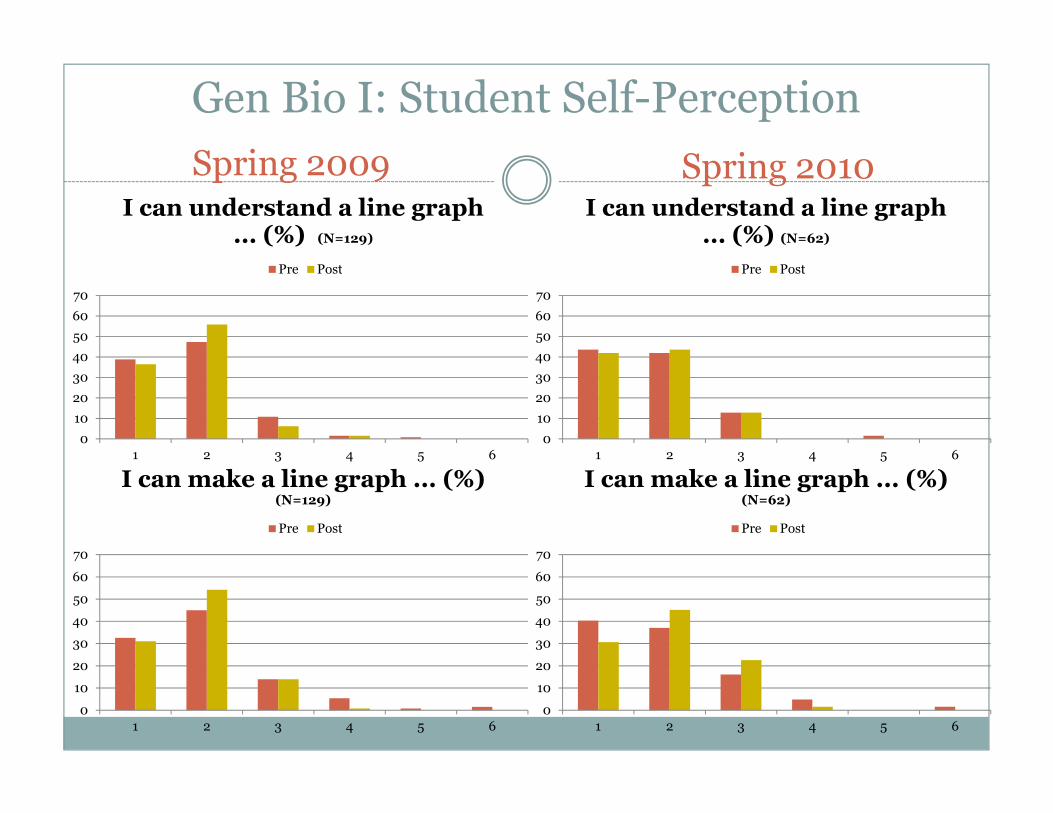
Gen Bio I: Student Self-Perception
Spring 2009 Spring 2010
20
30
40
50
60
70
I can understand a line graph ... (%) (N=129)
Pre Post
20
30
40
50
60
70
I can understand a line graph ... (%) (N=62)
Pre Post
0
10
1 2 3 4 5 6
0
10
20
30
40
50
60
70
1 2 3 4 5 6
I can make a line graph ... (%)(N=129)
Pre Post
0
10
1 2 3 4 5 6
0
10
20
30
40
50
60
70
1 2 3 4 5 6
I can make a line graph ... (%)(N=62)
Pre Post
Spring 2009Spring 2009 Spring 2010Spring 2010
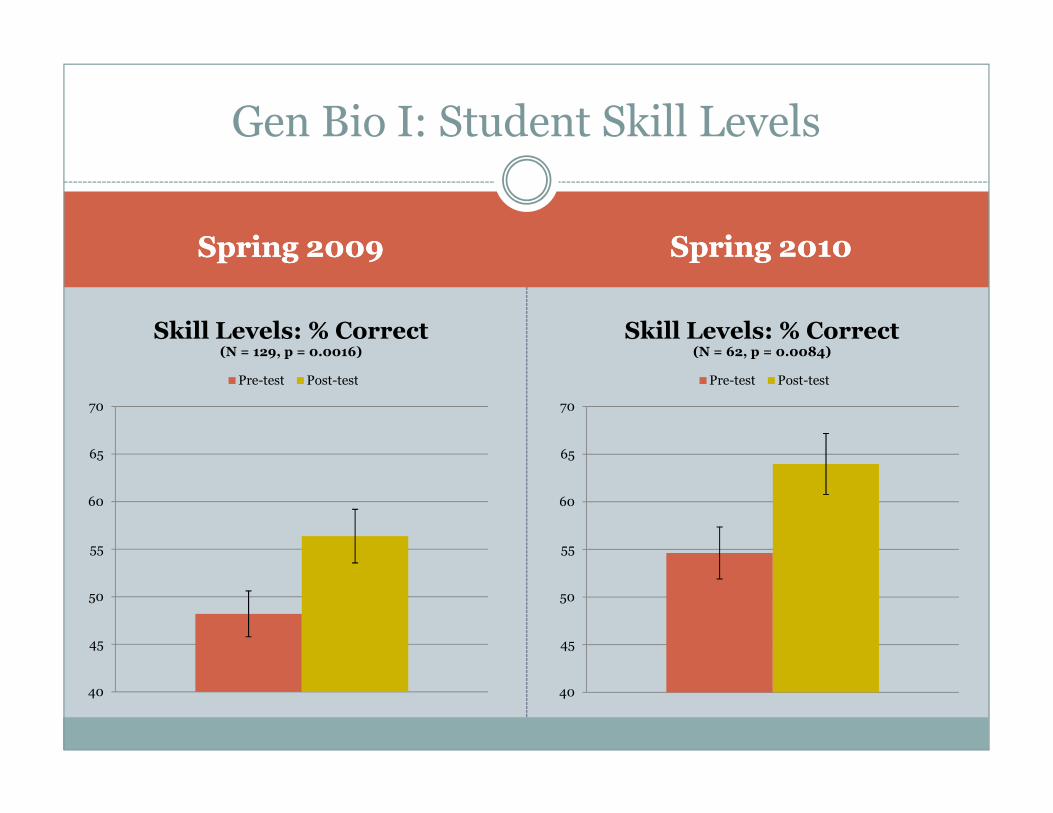
Gen Bio I: Student Skill Levels
70
Skill Levels: % Correct(N = 129, p = 0.0016)
Pre-test Post-test
70
Skill Levels: % Correct(N = 62, p = 0.0084)
Pre-test Post-test
40
45
50
55
60
65
70
40
45
50
55
60
65
70
Spring 2009Spring 2009 Spring 2010Spring 2010
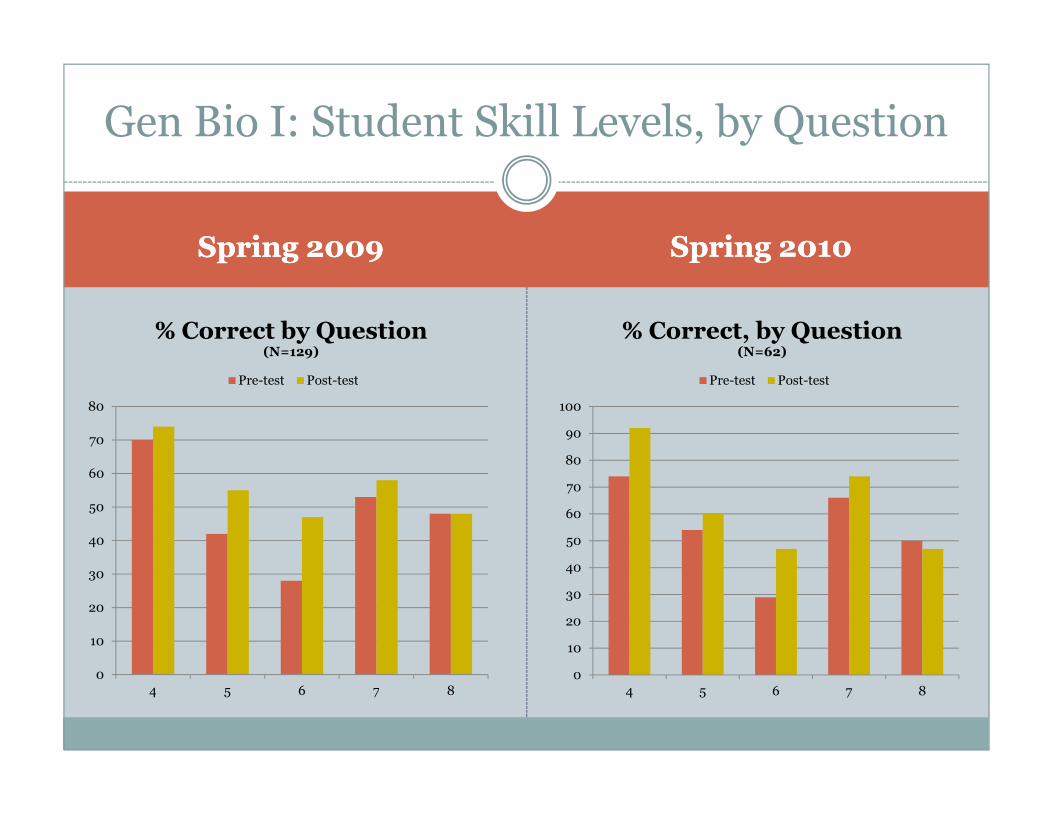
Gen Bio I: Student Skill Levels, by Question
100
% Correct, by Question(N=62)
Pre-test Post-test
80
% Correct by Question(N=129)
Pre-test Post-test
0
10
20
30
40
50
60
70
80
90
100
4 5 6 7 8
0
10
20
30
40
50
60
70
80
4 5 6 7 8
Gen Bio I: Results
� All students overestimated skill level, no changes in confidence levels over semester
� Student scores on the post-test were significantly higher than the pre-test scores both semesters
� Improved ability to determine which variable was the dependent variable
� Increased graph creation skills
� Increased arithmetic skills
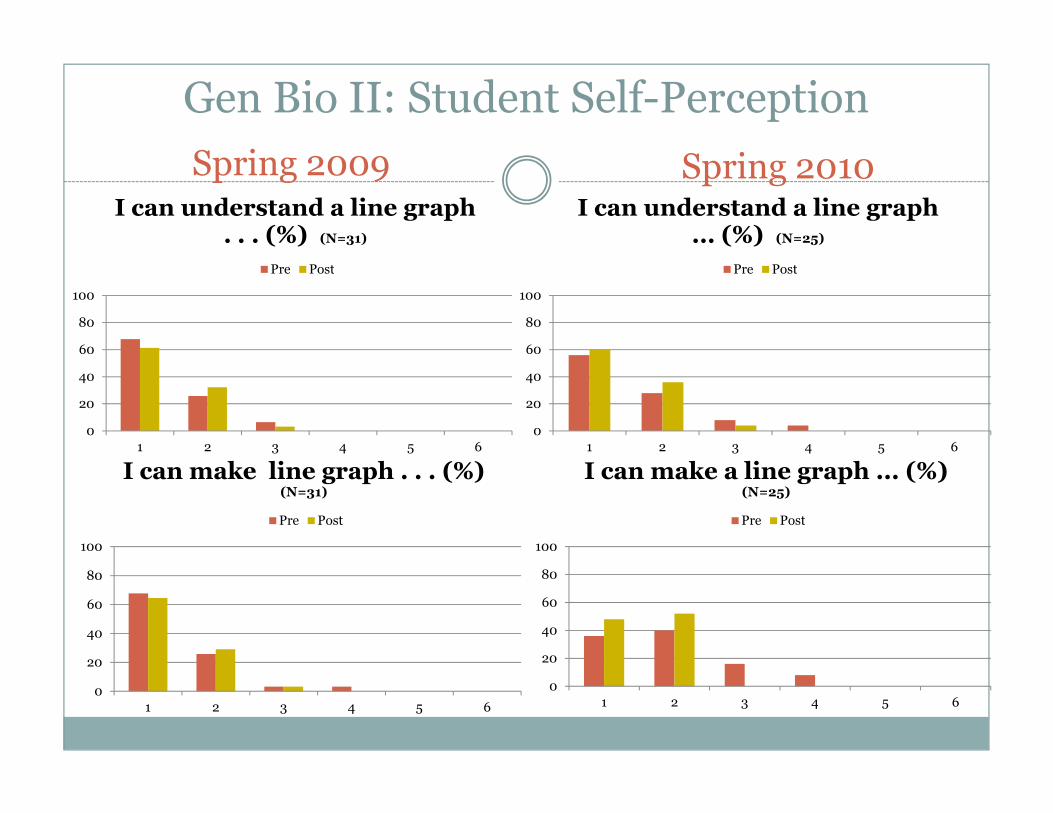
Gen Bio II: Student Self-Perception
Spring 2009 Spring 2010
20
40
60
80
100
I can understand a line graph ... (%) (N=25)
Pre Post
20
40
60
80
100
I can understand a line graph . . . (%) (N=31)
Pre Post
0
20
1 2 3 4 5 6
0
20
40
60
80
100
1 2 3 4 5 6
I can make a line graph ... (%)(N=25)
Pre Post
0
20
1 2 3 4 5 6
0
20
40
60
80
100
1 2 3 4 5 6
I can make line graph . . . (%)(N=31)
Pre Post
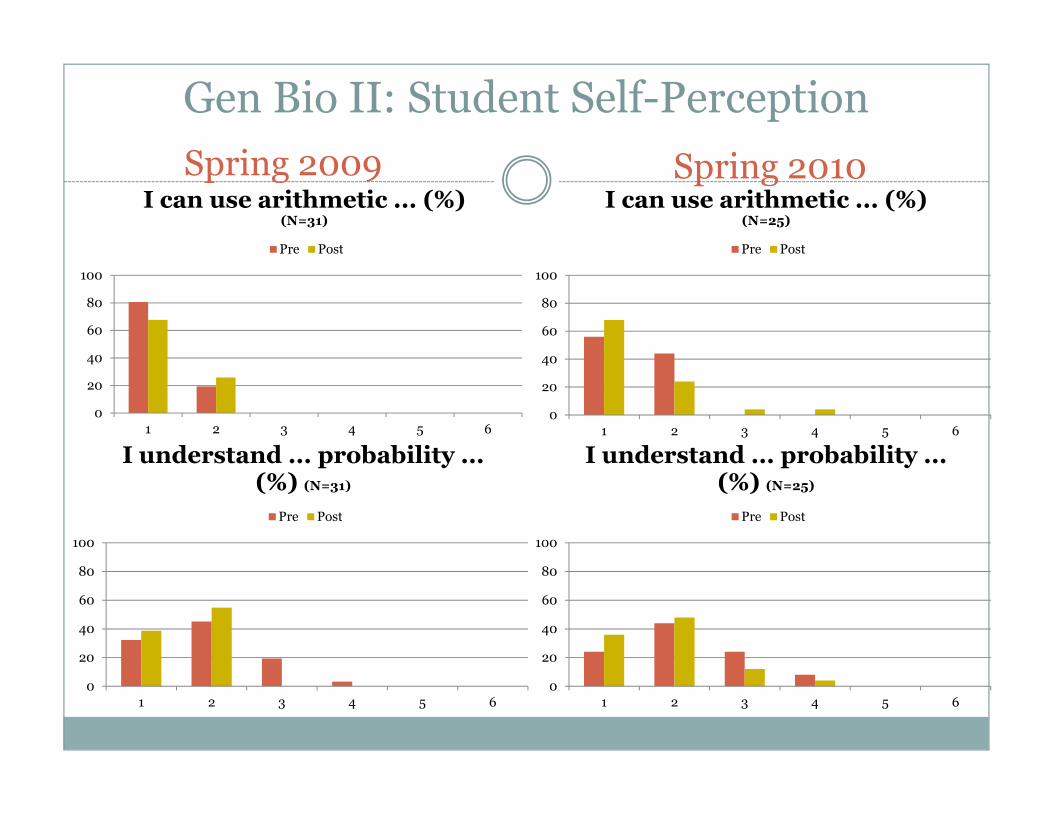
Gen Bio II: Student Self-Perception
Spring 2009 Spring 2010
0
20
40
60
80
100
I can use arithmetic ... (%)(N=31)
Pre Post
0
20
40
60
80
100
I can use arithmetic ... (%)(N=25)
Pre Post
0
1 2 3 4 5 6
0
20
40
60
80
100
1 2 3 4 5 6
I understand ... probability ... (%) (N=31)
Pre Post
0
1 2 3 4 5 6
0
20
40
60
80
100
1 2 3 4 5 6
I understand ... probability ... (%) (N=25)
Pre Post
Spring 2009Spring 2009 Spring 2010Spring 2010
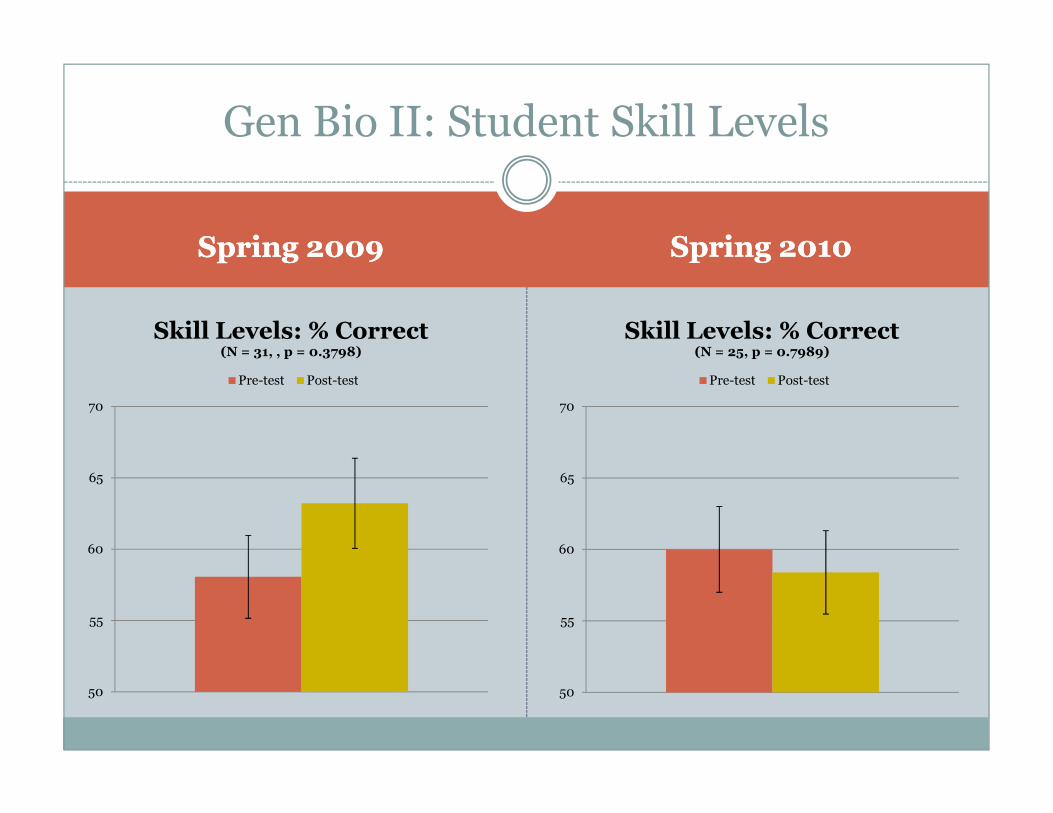
Gen Bio II: Student Skill Levels
70
Skill Levels: % Correct(N = 31, , p = 0.3798)
Pre-test Post-test
70
Skill Levels: % Correct(N = 25, p = 0.7989)
Pre-test Post-test
50
55
60
65
70
50
55
60
65
70
Spring 2009Spring 2009 Spring 2010Spring 2010
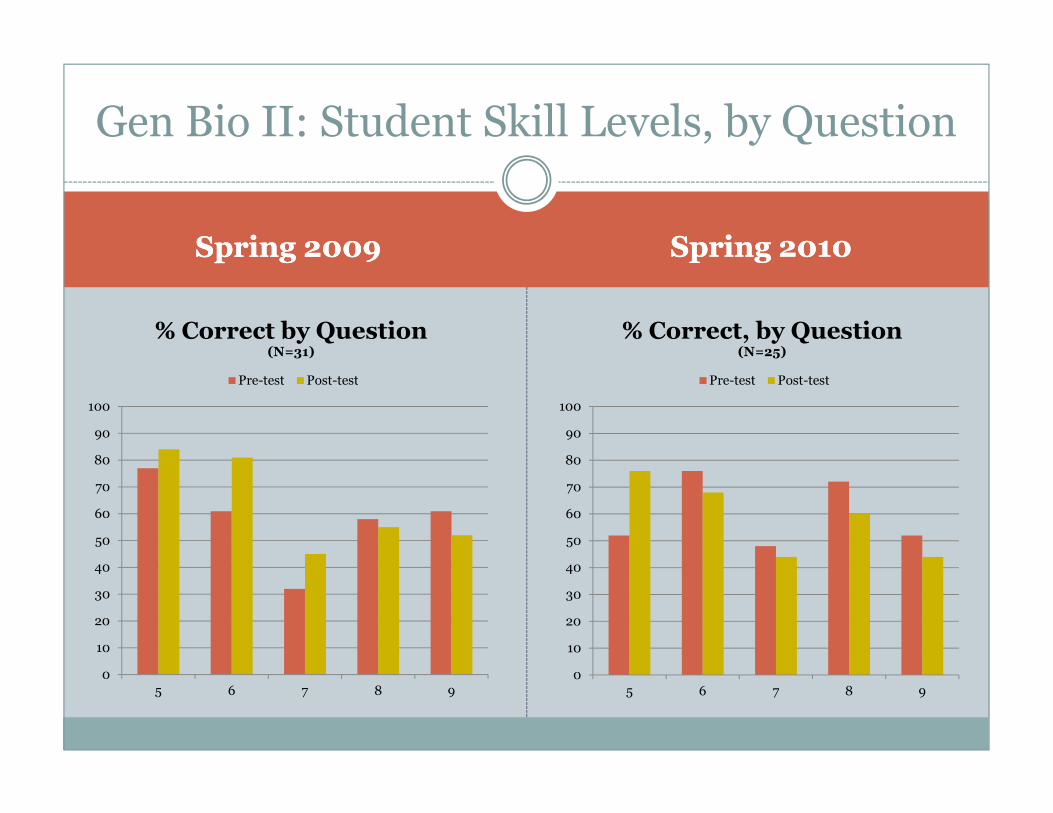
Gen Bio II: Student Skill Levels, by Question
100
% Correct by Question (N=31)
Pre-test Post-test
100
% Correct, by Question(N=25)
Pre-test Post-test
0
10
20
30
40
50
60
70
80
90
100
5 6 7 8 90
10
20
30
40
50
60
70
80
90
100
5 6 7 8 9
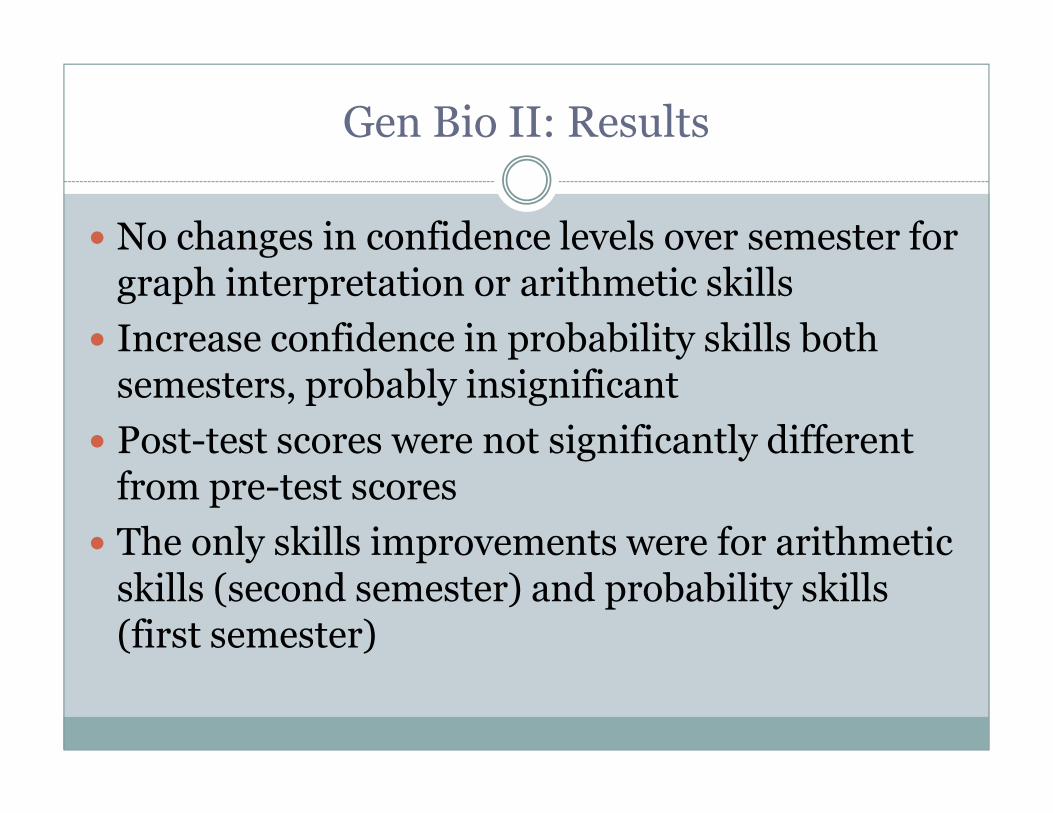
Gen Bio II: Results
� No changes in confidence levels over semester for graph interpretation or arithmetic skills
� Increase confidence in probability skills both semesters, probably insignificant
� Post-test scores were not significantly different from pre-test scores
� The only skills improvements were for arithmetic skills (second semester) and probability skills (first semester)
GRAPH INTERPRETATION
Anatomy & Physiology I
Human Anatomy and Physiology I
� A & P I is a requirement for Licensed Practical Nursing, Nursing, Nuclear Medicine Technology, and Radiologic Technology. Other programs: Therapeutic Recreation, Nutrition, Medical Lab Technology, and Nutrition, Medical Lab Technology, and Liberal Arts-Biology.
� ~25 sections/semester with ~600 total students per semester
� Students must have completed all remedial requirements prior to enrolling in this course
A&P I: Quantitative Literacy Modules
� Skills Emphasized:
� Graph interpretation
� Modules Implemented:
� QL Lab Module 1. Osmosis� QL Lab Module 1. Osmosis
� QL Lecture Module 1. pH and buffers
� QL Lecture Module 2. Membrane Potential
� QL Lecture Module 3. Muscle Contraction
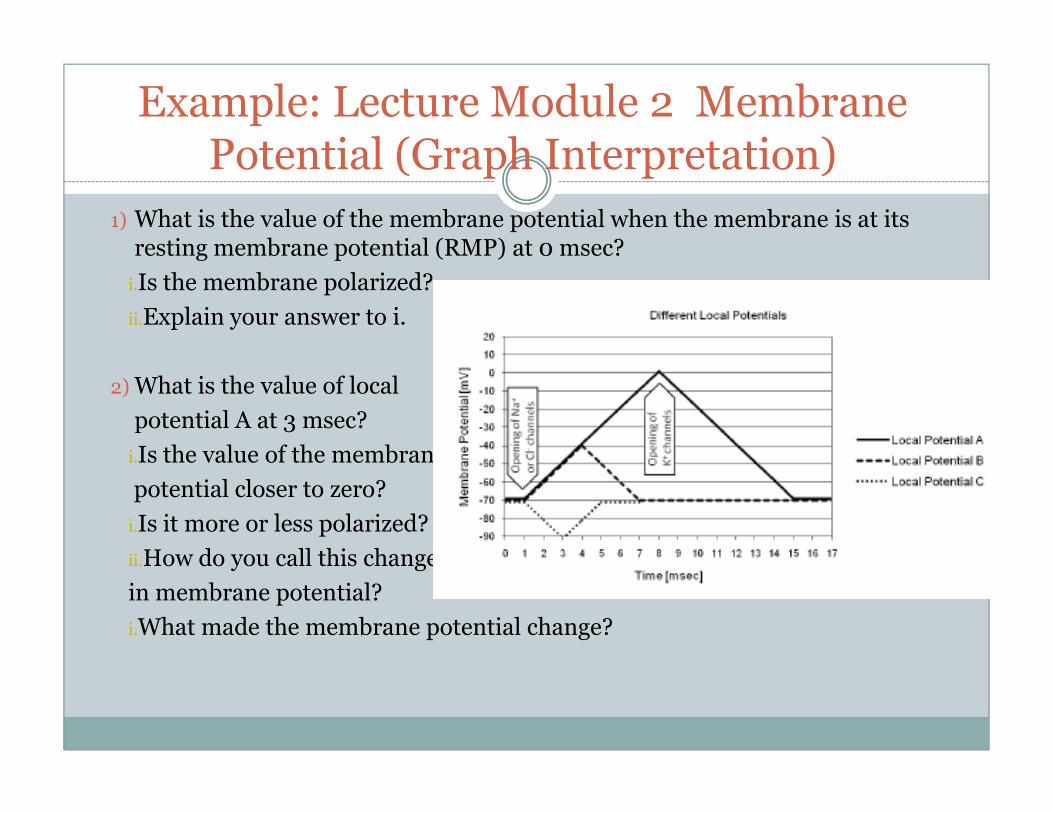
Example: Lecture Module 2 Membrane Potential (Graph Interpretation)
1) What is the value of the membrane potential when the membrane is at its resting membrane potential (RMP) at 0 msec?
i.Is the membrane polarized?
ii.Explain your answer to i.
2)What is the value of local
potential A at 3 msec?potential A at 3 msec?
i.Is the value of the membrane
potential closer to zero?
i.Is it more or less polarized?
ii.How do you call this change
in membrane potential?
i.What made the membrane potential change?
Anatomy & Physiology I: Assessment
� Oral evaluation during class based on whether thestudents can answer questions related with graphinterpretation
Administration of pre- and post- tests to evaluate:� Administration of pre- and post- tests to evaluate:
� a) Students’ self-confidence in graph interpretation
� b) Accuracy in the actual interpretation of a graph.
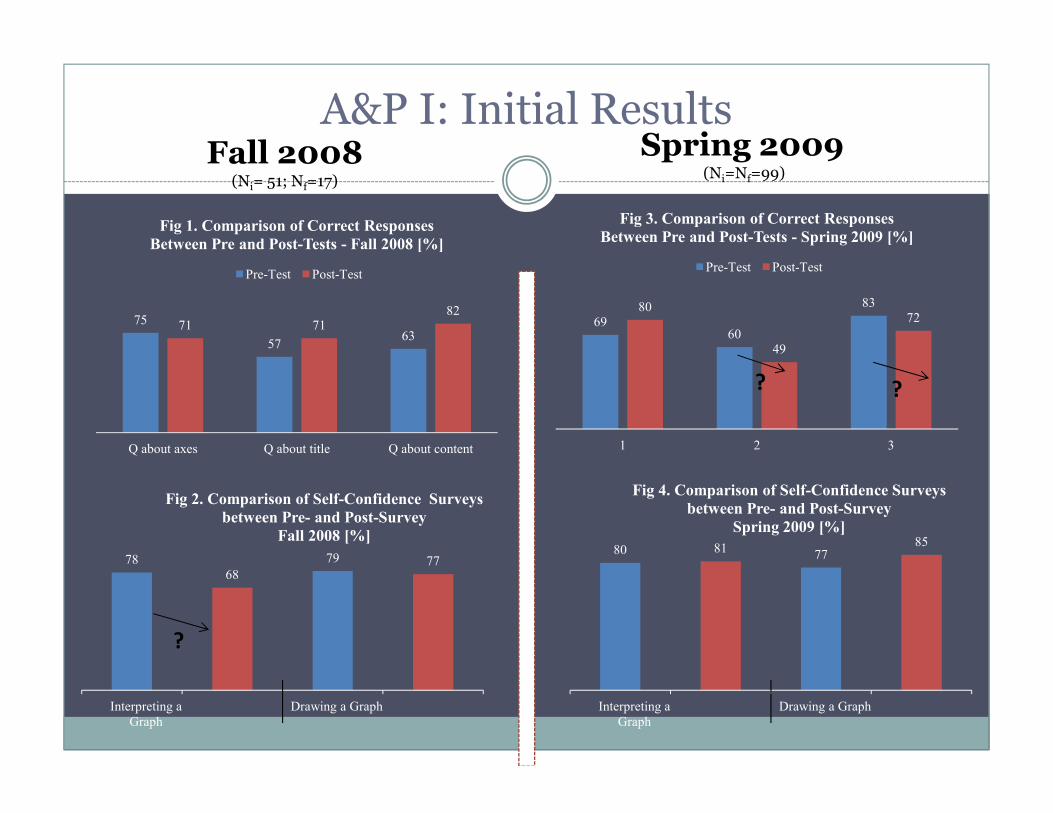
6960
8380
49
72
Fig 3. Comparison of Correct Responses
Between Pre and Post-Tests - Spring 2009 [%]
Pre-Test Post-Test
A&P I: Initial ResultsFall 2008
(Ni= 51; Nf=17)
Spring 2009(Ni=Nf=99)
? ?
75
5763
71 7182
Fig 1. Comparison of Correct Responses
Between Pre and Post-Tests - Fall 2008 [%]
Pre-Test Post-Test
1 2 3
78
68
79 77
Interpreting a
Graph
Drawing a Graph
Fig 2. Comparison of Self-Confidence Surveys
between Pre- and Post-Survey
Fall 2008 [%]80 81
7785
Interpreting a
Graph
Drawing a Graph
Fig 4. Comparison of Self-Confidence Surveys
between Pre- and Post-Survey
Spring 2009 [%]
?
Q about axes Q about title Q about content
0
10
20
30
40
50
60
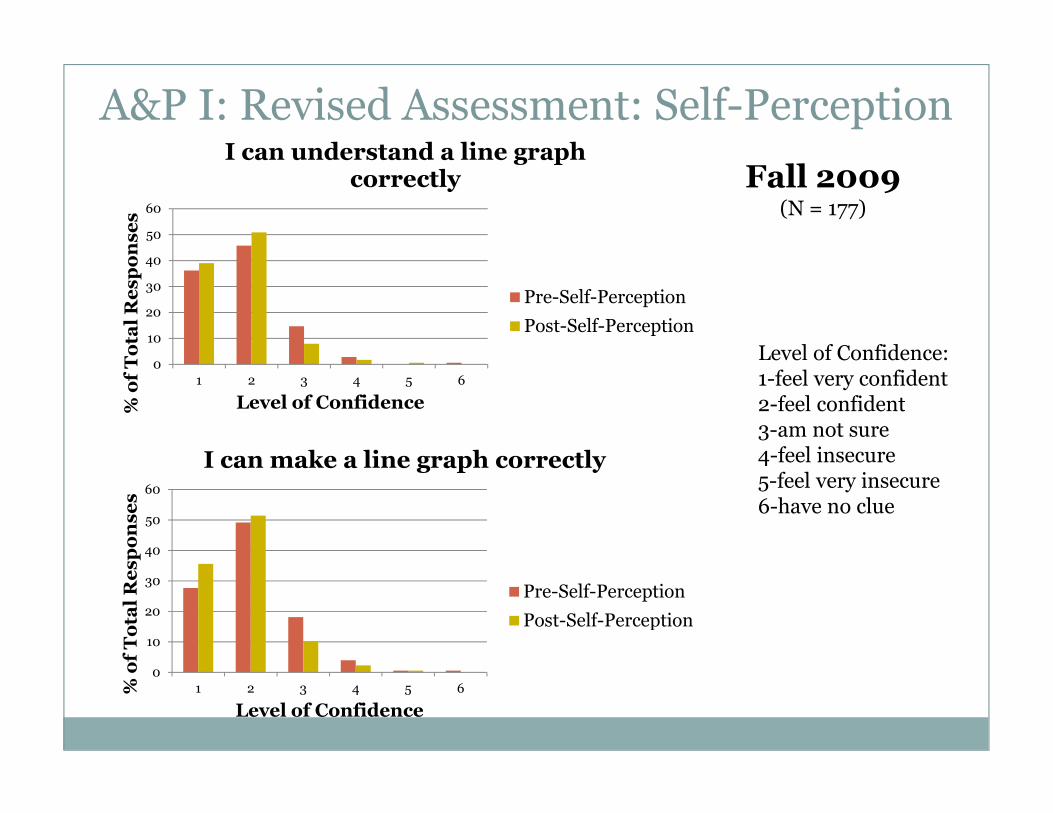
1 2 3 4 5 6
% of Total Responses
Level of Confidence
I can understand a line graph correctly
Pre-Self-Perception
Post-Self-Perception
Level of Confidence: 1-feel very confident2-feel confident
A&P I: Revised Assessment: Self-Perception
Fall 2009(N = 177)
0
10
20
30
40
50
60
1 2 3 4 5 6% of Total Responses
Level of Confidence
I can make a line graph correctly
Pre-Self-Perception
Post-Self-Perception
% of Total Responses
Level of Confidence 2-feel confident3-am not sure4-feel insecure5-feel very insecure6-have no clue
64
66
68
70
72
74
76
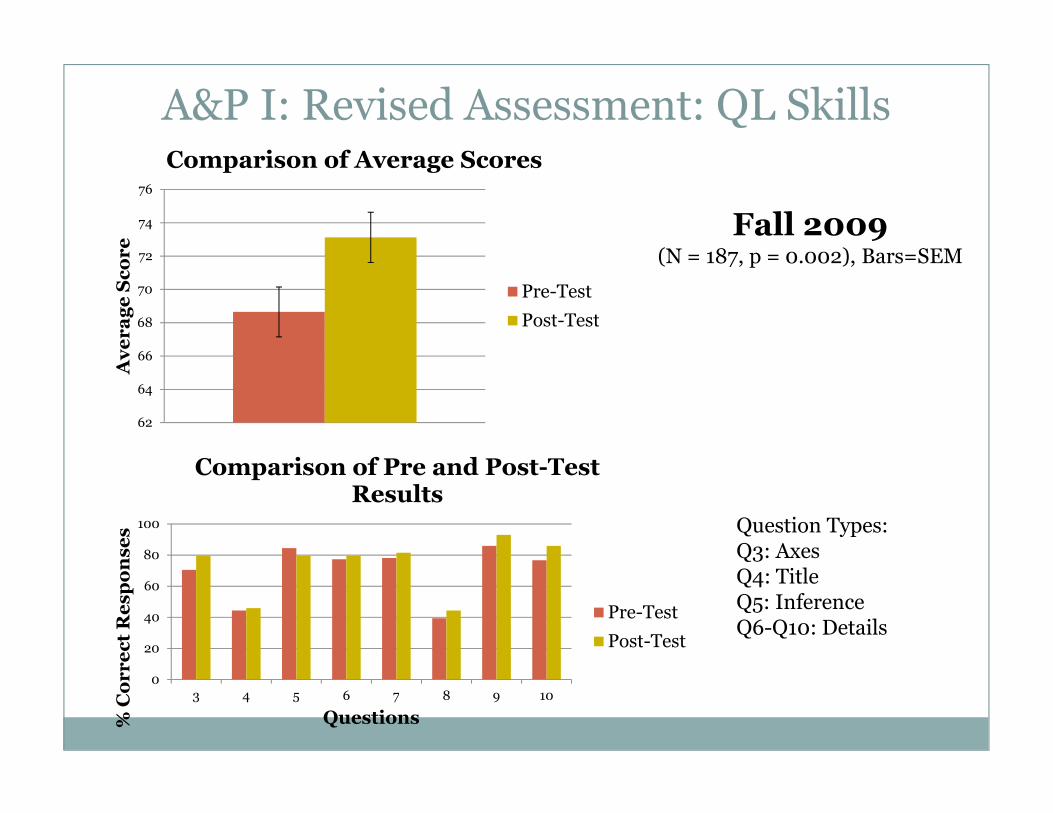
Average Score
Comparison of Average Scores
Pre-Test
Post-Test
Fall 2009(N = 187, p = 0.002), Bars=SEM
A&P I: Revised Assessment: QL Skills
62
0
20
40
60
80
100
3 4 5 6 7 8 9 10
% Correct Responses
Questions
Comparison of Pre and Post-Test Results
Pre-Test
Post-Test
Question Types:Q3: AxesQ4: TitleQ5: InferenceQ6-Q10: Details
A & P I: Results
� After small initial trials, the pre-test/post-test was redesigned
� There were small improvements in confidence levels during both semesters for graph interpretation and graph creation skills
� Student scores on the post-test were significantly higher than the pre-test scores in the final semester with a large sample size
Results Summary & Conclusions
� We’ve seen minor improvements in probability skills (Gen Bio II) and graph interpretation skills (Gen Bio I, A&P I) with the implementation of QL modules.
� We did not achieve 100% participation by faculty, although participation improved in A&P I.
� The key to getting faculty to participate is integration of � The key to getting faculty to participate is integration of QL activities and assessments into the overall course structure, and maximizing the ease of implementation of both activities and assessment tools.
� The key to getting students to participate is integration of QL activities and assessments into the overall course structure & attaching a grade of some sort to the activities.
Steps Taken Since the Conclusion of this Project
� Full integration of these activities into the course activities, assessments, and revision procedures
� Some activities have been modified or replaced as a result of student & faculty feedback
� Assessment is now conducted as part of the overall department � Assessment is now conducted as part of the overall department assessment effort, using common final questions
� Implementation of new PowerLab activities in Introductory General Biology I and Anatomy & Physiology II. These new activities are hands-on, data-driven, experimental activities in which students collect data and interpret graphs.
Acknowledgments
� Funding: Perkins Grant (The federal Carl D. Perkins Career and Technical Education Improvement Act of 2006)
� Dr. Harriet Shenkman and the BCC Center for Teaching Excellence administered the grantTeaching Excellence administered the grant
� Biology Department faculty members for using the QL activities and collecting assessment data
� Student participants in 2008-2009 biology courses
� Dr. Susan Forman for providing mathematical and pedagogical help in designing the quantitative literacy modules