rural development statistics 2016-17 · rural development statistics 2016-17 edited by ... imr...
TRANSCRIPT

RURAL DEVELOPMENT STATISTICS
2016-17
Edited by Dr. S.V. Rangacharyulu
Dr. G. Rajani Kanth
Compiled by Dr. K. Jayasree
Centre for Wage Employment
National Institute of Rural Development and Panchayati Raj(Ministry of Rural Development, Government of India)
Rajendranagar, Hyderabad – 500 030

© National Institute of Rural Development and Panchayati Raj
August, 2017
ISBN : 978-93-84503-82-6
Price: `
Cover Designed by : Shri V.G. Bhat
Published by :NATIONAL INSTITUTE OF RURAL DEVELOPMENT AND PANCHAYATI RAJRajendranagar, Hyderabad - 500 030. India. Tel : Telefax: 040-24008473
E-mail : [email protected]; Website : http://www.nird.org
Printed at: Balaji Scan Pvt. Ltd., Lakadikapul, Hyderabad - 500 004. Tel : 040-23303424 / 25www.balajiscan.com e-mail: [email protected]

FOREWORD
This issue of Rural Development Statistics: 2016-17, the 28th in the series, is an annual publication of the Institute depicting the State-wise data on host of parameters concerning various facets of rural development. The unique feature of the current publication is that it has been brought out within few months after the conclusion of 2016-17 financial year and thus carrying the contemporary value of data interpretation.
In addition, the allocations of the Ministry of Rural Development on its various programmes and schemes are given along with physical and financial progress etc. In regard to poverty, estimates based on different Committees for different time points are presented facilitating both temporal and spatial comparisons. The highlights of each section are given briefly before each section.
The sources for the data contained in this publication are mostly annual reports of various Ministries concerned, Government websites and data we received from different agencies on our request. We are grateful to such agencies.
This issue consists of wide range of data presented through 250 tables spread over 13 sections. The reference year for compilation of data is mostly 2015-16 and 2016-17.
We expect that this publication would continue to be useful to various academicians, programme implementing agencies and Non-Governmental Organisations concerned with rural development.
We welcome any suggestions towards further improving the quality of this publication.
W.R. ReddyDirector General
NIRD & PRHyderabad


Acronyms
AAY Antyodaya Anna Yojana
ADFCs Agriculture Development Finance Corporations
APL Above Poverty Line
ARWSP Accelerated Rural Water Supply Programme
ASFR Age Specific Fertility Rate
ASMFR Age Specific Marital Fertility Rate
BCG Bacillus Calmette-Guerin
BE Budget Estimate
BPL Below Poverty Line
CAD Command Area Development
CAPART Council for Advancement of People’s Action and Rural Technology
CBR Crude Birth Rate
CDR Crude Death Rate
CDS Current Daily Status
CHCs Community Health Centres
CIRDAP Centre for Integrated Rural Development for Asia and the Pacific
CLR Computerisation of Land Records
CPIAL Consumer Price Index for Agricultural Labourers
CSD Council for Social Development
CSR Child Sex Ratio
CWS Current Weekly Status
DDP Desert Development Programme
DPAP Drought Prone Areas Programme
DPT Diptheria, Pertussis and Tetanus vaccine
DRDA District Rural Development Agency

DWS Drinking Water Supply
GDP Gross Domestic Product
GER Gross Enrolment Ratio
GFR General Fertility Rate
GMFR General Marital Fertility Rate
GNP Gross National Product
GRR Gross Reproduction Rate
GSDP Gross State Domestic Product
HDI Human Development Index
HPI Human Poverty Index
IAY Indira Awaas Yojana
IEBR Internal and Extra Budgetary Resources
IMR Infant Mortality Rate
IWDP Integrated Wasteland Development Project
KVIC Khadi and Village Industries Commission
LFPR Labour Force Participation Rates
LT Long Term
MDGs Millennium Development Goals
MGNREGA Mahatma Gandhi National Rural Employment Guarantee Act
MMR Maternal Mortality Rate
MoRD Ministry of Rural Development
MPCE Monthly Per Capita Consumer Expenditure
MRP Mixed Recall Period
MT Medium Term
NABARD National Bank for Agriculture and Rural Development
NAIS National Agricultural Insurance Scheme

NDP Net Domestic Product
NE States North-Eastern States
NFHS National Family Health Survey
NGR Natural Growth Rate
NIRD & PR National Institute of Rural Development and Panchayati Raj
NLRMP National Land Records Modernisation Programme
NNP Net National Product
NRDWP National Rural Drinking Water Programme
NSAP National Social Assistance Programme
NSIC National Small Industries Corporation
NSSO National Sample Survey Organisation
PACs Primary Agricultural Cooperative Societies
PCARDBs Primary Cooperative Agriculture and Rural Development Banks
PCPM Per Capita Per Month
PGI Poverty Gap Index
PHCs Primary Health Centres
PL Poverty Line
PMGSY Pradhan Mantri Gram Sadak Yojana
PMRY Prime Minister’s Rozgar Yojana
PRI Panchayati Raj Institutions
PS & SS Principal Status and Subsidiary Status
PUCBs Primary Urban Cooperative Banks
PURA Provision of Urban Amenities in Rural Areas
RE Revised Budget
RI Rural Industries
RIDF Rural Infrastructure Development Fund

RRB Regional Rural Banks
SAARC South Asia’s Association for Regional Cooperation
SAGY Sansaad Adarsh Gram Yojana
SCARDBs State Cooperative Agriculture and Rural Development Banks
SCBs State Cooperative Banks
SCP Special Component Plan
SDI Social Development Index
SDP State Domestic Product
SGSY Swarnjayanti Gram Swarozgar Yojana
SHGs Self-Help Groups
SIDO Small Industries Development Organisation
SPG Squared Poverty Gap
SR Sex Ratio
SRA Strengthening of Revenue Administration
SRS Sample Registration System
SSA Sarva Shiksha Abhiyan
SSI Small Scale Industries
TFR Total Fertility Rate
TMFR Total Marital Fertility Rate
TPDS Target Public Distribution System
TSC Total Sanitation Campaign
URP Uniform Recall Period
UT Union Territories
VPTs Village Public Telephones
VSE Village Small Enterprises
VSI Village Small Industries

CONTENTS
FOREWORD
ACRONYMS
STATEMENT 1 : INDIA’S POSITION IN THE WORLD i - i
STATEMENT 2 : INDIA’S POSITION IN WORLD AGRICULTURE IN 2014 i - ii
STATEMENT 3 : OUTLAY ON MAJOR SCHEMES iii - iv
STATEMENT 4a : INDIA’S TOP 10 AGRICULTURAL EXPORT COMMODITIES v - v
STATEMENT 4b : INDIA’S TOP 10 AGRICULTURAL IMPORT COMMODITIES v - v
STATEMENT 5 : SELECTED DEMOGRAPHIC AND SOCIO-ECONOMIC INDICATORS
vi - xiii
STATEMENT 6 : TWELTH PLAN (2012-17) AND ELEVENTH PLAN (2007–12) – BY HEADS OF DEVELOPMENT
xiv - xiv
STATEMENT 7 SOME IMPORTANT INDICATORS OF ECONOMIC SURVEY 2016-17
xv - xix
SECTION – 1 : POPULATION 1 - 34
SECTION – 2 : SOCIO-ECONOMIC CHARACTERISTICS 35 - 120
SECTION – 3 : AGRICULTURE AND ALLIED ACTIVITIES 121 - 194
SECTION – 4 : RURAL CREDIT AND COOPERATION 195 - 210
SECTION – 5 : RURAL INDUSTRIES 211 - 228
SECTION – 6 : RURAL DEVELOPMENT PROGRAMMES 229 - 300
SECTION – 7 : SOCIAL SERVICES 301 - 380
SECTION – 8 : SOCIAL CONSUMPTION 381 - 416
SECTION – 9 : PANCHAYATI RAJ 417 - 438
SECTION – 10 : SCHEDULED CASTES AND SCHEDULED TRIBES 439 - 464
SECTION – 11 : RURAL WOMEN 465 - 478
SECTION – 12 : NIRD & PR TRAINING 479 - 484
SECTION – 13 : CIRDAP AND SAARC COUNTRIES – SELECTED DEVELOPMENT INDICATORS
485 - 498

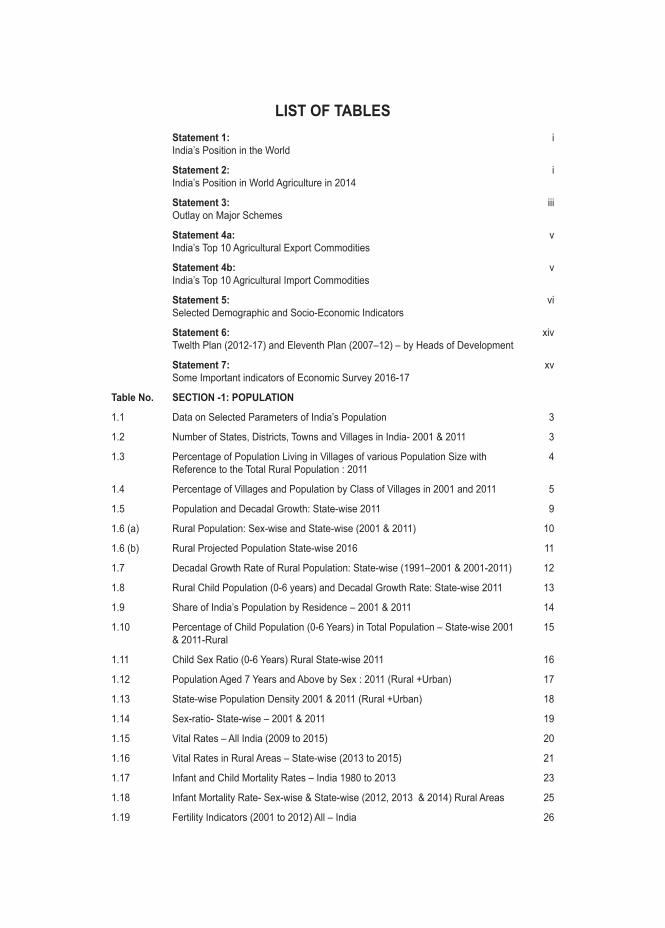
LIST OF TABLESStatement 1:India’s Position in the World
i
Statement 2:India’s Position in World Agriculture in 2014
i
Statement 3:Outlay on Major Schemes
iii
Statement 4a:India’s Top 10 Agricultural Export Commodities
v
Statement 4b:India’s Top 10 Agricultural Import Commodities
v
Statement 5:Selected Demographic and Socio-Economic Indicators
vi
Statement 6:Twelth Plan (2012-17) and Eleventh Plan (2007–12) – by Heads of Development
xiv
Statement 7:Some Important indicators of Economic Survey 2016-17
xv
Table No. SECTION -1: POPULATION
1.1 Data on Selected Parameters of India’s Population 3
1.2 Number of States, Districts, Towns and Villages in India- 2001 & 2011 3
1.3 Percentage of Population Living in Villages of various Population Size with Reference to the Total Rural Population : 2011
4
1.4 Percentage of Villages and Population by Class of Villages in 2001 and 2011 5
1.5 Population and Decadal Growth: State-wise 2011 9
1.6 (a) Rural Population: Sex-wise and State-wise (2001 & 2011) 10
1.6 (b) Rural Projected Population State-wise 2016 11
1.7 Decadal Growth Rate of Rural Population: State-wise (1991–2001 & 2001-2011) 12
1.8 Rural Child Population (0-6 years) and Decadal Growth Rate: State-wise 2011 13
1.9 Share of India’s Population by Residence – 2001 & 2011 14
1.10 Percentage of Child Population (0-6 Years) in Total Population – State-wise 2001 & 2011-Rural
15
1.11 Child Sex Ratio (0-6 Years) Rural State-wise 2011 16
1.12 Population Aged 7 Years and Above by Sex : 2011 (Rural +Urban) 17
1.13 State-wise Population Density 2001 & 2011 (Rural +Urban) 18
1.14 Sex-ratio- State-wise – 2001 & 2011 19
1.15 Vital Rates – All India (2009 to 2015) 20
1.16 Vital Rates in Rural Areas – State-wise (2013 to 2015) 21
1.17 Infant and Child Mortality Rates – India 1980 to 2013 23
1.18 Infant Mortality Rate- Sex-wise & State-wise (2012, 2013 & 2014) Rural Areas 25
1.19 Fertility Indicators (2001 to 2012) All – India 26
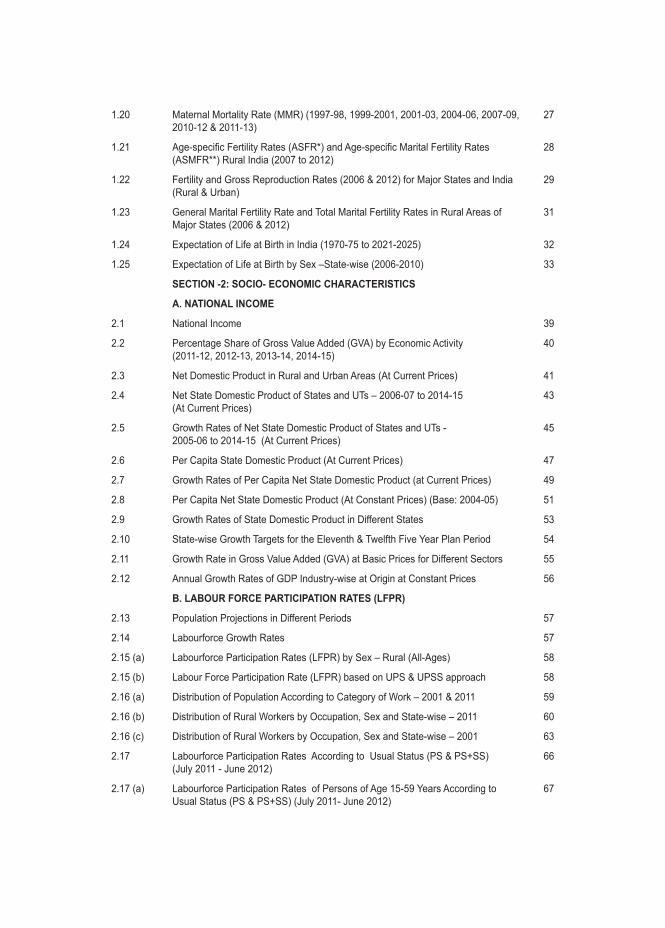
1.20 Maternal Mortality Rate (MMR) (1997-98, 1999-2001, 2001-03, 2004-06, 2007-09, 2010-12 & 2011-13)
27
1.21 Age-specific Fertility Rates (ASFR*) and Age-specific Marital Fertility Rates (ASMFR**) Rural India (2007 to 2012)
28
1.22 Fertility and Gross Reproduction Rates (2006 & 2012) for Major States and India (Rural & Urban)
29
1.23 General Marital Fertility Rate and Total Marital Fertility Rates in Rural Areas of Major States (2006 & 2012)
31
1.24 Expectation of Life at Birth in India (1970-75 to 2021-2025) 32
1.25 Expectation of Life at Birth by Sex –State-wise (2006-2010) 33
SECTION -2: SOCIO- ECONOMIC CHARACTERISTICS
A. NATIONAL INCOME
2.1 National Income 39
2.2 Percentage Share of Gross Value Added (GVA) by Economic Activity (2011-12, 2012-13, 2013-14, 2014-15)
40
2.3 Net Domestic Product in Rural and Urban Areas (At Current Prices) 41
2.4 Net State Domestic Product of States and UTs – 2006-07 to 2014-15 (At Current Prices)
43
2.5 Growth Rates of Net State Domestic Product of States and UTs - 2005-06 to 2014-15 (At Current Prices)
45
2.6 Per Capita State Domestic Product (At Current Prices) 47
2.7 Growth Rates of Per Capita Net State Domestic Product (at Current Prices) 49
2.8 Per Capita Net State Domestic Product (At Constant Prices) (Base: 2004-05) 51
2.9 Growth Rates of State Domestic Product in Different States 53
2.10 State-wise Growth Targets for the Eleventh & Twelfth Five Year Plan Period 54
2.11 Growth Rate in Gross Value Added (GVA) at Basic Prices for Different Sectors 55
2.12 Annual Growth Rates of GDP Industry-wise at Origin at Constant Prices 56
B. LABOUR FORCE PARTICIPATION RATES (LFPR)
2.13 Population Projections in Different Periods 57
2.14 Labourforce Growth Rates 57
2.15 (a) Labourforce Participation Rates (LFPR) by Sex – Rural (All-Ages) 58
2.15 (b) Labour Force Participation Rate (LFPR) based on UPS & UPSS approach 58
2.16 (a) Distribution of Population According to Category of Work – 2001 & 2011 59
2.16 (b) Distribution of Rural Workers by Occupation, Sex and State-wise – 2011 60
2.16 (c) Distribution of Rural Workers by Occupation, Sex and State-wise – 2001 63
2.17 Labourforce Participation Rates According to Usual Status (PS & PS+SS) (July 2011 - June 2012)
66
2.17 (a) Labourforce Participation Rates of Persons of Age 15-59 Years According to Usual Status (PS & PS+SS) (July 2011- June 2012)
67
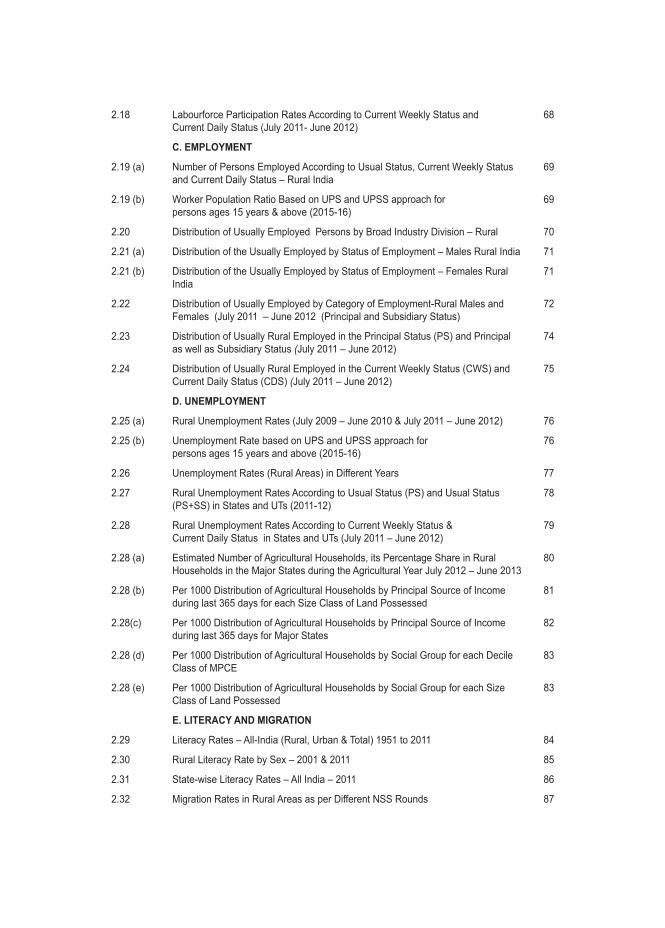
2.18 Labourforce Participation Rates According to Current Weekly Status and Current Daily Status (July 2011- June 2012)
68
C. EMPLOYMENT
2.19 (a) Number of Persons Employed According to Usual Status, Current Weekly Status and Current Daily Status – Rural India
69
2.19 (b) Worker Population Ratio Based on UPS and UPSS approach for persons ages 15 years & above (2015-16)
69
2.20 Distribution of Usually Employed Persons by Broad Industry Division – Rural 70
2.21 (a) Distribution of the Usually Employed by Status of Employment – Males Rural India 71
2.21 (b) Distribution of the Usually Employed by Status of Employment – Females Rural India
71
2.22 Distribution of Usually Employed by Category of Employment-Rural Males and Females (July 2011 – June 2012 (Principal and Subsidiary Status)
72
2.23 Distribution of Usually Rural Employed in the Principal Status (PS) and Principal as well as Subsidiary Status (July 2011 – June 2012)
74
2.24 Distribution of Usually Rural Employed in the Current Weekly Status (CWS) and Current Daily Status (CDS) (July 2011 – June 2012)
75
D. UNEMPLOYMENT
2.25 (a) Rural Unemployment Rates (July 2009 – June 2010 & July 2011 – June 2012) 76
2.25 (b) Unemployment Rate based on UPS and UPSS approach for persons ages 15 years and above (2015-16)
76
2.26 Unemployment Rates (Rural Areas) in Different Years 77
2.27 Rural Unemployment Rates According to Usual Status (PS) and Usual Status (PS+SS) in States and UTs (2011-12)
78
2.28 Rural Unemployment Rates According to Current Weekly Status & Current Daily Status in States and UTs (July 2011 – June 2012)
79
2.28 (a) Estimated Number of Agricultural Households, its Percentage Share in Rural Households in the Major States during the Agricultural Year July 2012 – June 2013
80
2.28 (b) Per 1000 Distribution of Agricultural Households by Principal Source of Income during last 365 days for each Size Class of Land Possessed
81
2.28(c) Per 1000 Distribution of Agricultural Households by Principal Source of Income during last 365 days for Major States
82
2.28 (d) Per 1000 Distribution of Agricultural Households by Social Group for each Decile Class of MPCE
83
2.28 (e) Per 1000 Distribution of Agricultural Households by Social Group for each Size Class of Land Possessed
83
E. LITERACY AND MIGRATION
2.29 Literacy Rates – All-India (Rural, Urban & Total) 1951 to 2011 84
2.30 Rural Literacy Rate by Sex – 2001 & 2011 85
2.31 State-wise Literacy Rates – All India – 2011 86
2.32 Migration Rates in Rural Areas as per Different NSS Rounds 87
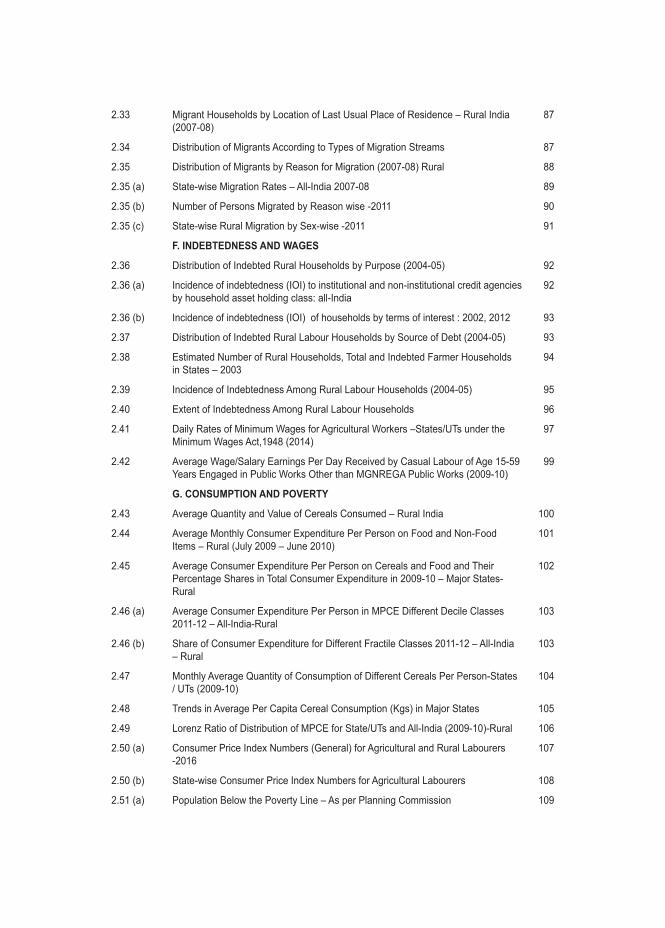
2.33
Migrant Households by Location of Last Usual Place of Residence – Rural India (2007-08)
87
2.34 Distribution of Migrants According to Types of Migration Streams 87
2.35 Distribution of Migrants by Reason for Migration (2007-08) Rural 88
2.35 (a) State-wise Migration Rates – All-India 2007-08 89
2.35 (b) Number of Persons Migrated by Reason wise -2011 90
2.35 (c) State-wise Rural Migration by Sex-wise -2011 91
F. INDEBTEDNESS AND WAGES
2.36 Distribution of Indebted Rural Households by Purpose (2004-05) 92
2.36 (a) Incidence of indebtedness (IOI) to institutional and non-institutional credit agencies by household asset holding class: all-India
92
2.36 (b) Incidence of indebtedness (IOI) of households by terms of interest : 2002, 2012 93
2.37 Distribution of Indebted Rural Labour Households by Source of Debt (2004-05) 93
2.38 Estimated Number of Rural Households, Total and Indebted Farmer Households in States – 2003
94
2.39 Incidence of Indebtedness Among Rural Labour Households (2004-05) 95
2.40 Extent of Indebtedness Among Rural Labour Households 96
2.41 Daily Rates of Minimum Wages for Agricultural Workers –States/UTs under the Minimum Wages Act,1948 (2014)
97
2.42 Average Wage/Salary Earnings Per Day Received by Casual Labour of Age 15-59 Years Engaged in Public Works Other than MGNREGA Public Works (2009-10)
99
G. CONSUMPTION AND POVERTY
2.43 Average Quantity and Value of Cereals Consumed – Rural India 100
2.44 Average Monthly Consumer Expenditure Per Person on Food and Non-Food Items – Rural (July 2009 – June 2010)
101
2.45 Average Consumer Expenditure Per Person on Cereals and Food and Their Percentage Shares in Total Consumer Expenditure in 2009-10 – Major States-Rural
102
2.46 (a) Average Consumer Expenditure Per Person in MPCE Different Decile Classes 2011-12 – All-India-Rural
103
2.46 (b) Share of Consumer Expenditure for Different Fractile Classes 2011-12 – All-India – Rural
103
2.47 Monthly Average Quantity of Consumption of Different Cereals Per Person-States / UTs (2009-10)
104
2.48 Trends in Average Per Capita Cereal Consumption (Kgs) in Major States 105
2.49 Lorenz Ratio of Distribution of MPCE for State/UTs and All-India (2009-10)-Rural 106
2.50 (a) Consumer Price Index Numbers (General) for Agricultural and Rural Labourers -2016
107
2.50 (b) State-wise Consumer Price Index Numbers for Agricultural Labourers 108
2.51 (a) Population Below the Poverty Line – As per Planning Commission 109

2.51 (b) As per the Expert Group Methodology (As per Tendulkar) 109
2.51 (c) As per Expert Group Methodology (As per Rangarajan) 109
2.52 State-specific Poverty Lines – Rural 110
2.53 State-wise Number and Percentage of Population Below Poverty Line (Rangarajan Methodology) in India (2011-12)
112
2.54 State-wise Number and Percentage of Population Below Poverty Line (Tendulkar Methodology) in India (2011-12)
114
2.55 State-wise Number and Percentage of Population Below Poverty Line in India (2009-10) (Tendulkar Methodology)
116
2.56 State-wise Number and Percentage of Population Below Poverty Line (Tendulkar Methodology) in India (2004-05)
117
2.57 State Human Development Index (HDI)-1999-2000 & 2007-08 118
2.58 Distribution of Households by Availability of Two Square Meals a Day 118
2.59 Incidence of Hunger in Rural Areas – 2009-10 – State-wise 119
SECTION-3: AGRICULTURE AND ALLIED ACTIVITIES
A. GENERAL
3.1 India’s Position in World Agriculture in 2014 125
3.2 (a) Agriculture Sector – Plan Outlays 126
3.2 (b) Plan-wise Share of Public Sector Outlays and Expenditure under Agriculture and Allied Activities
127
3.2 (c) Budget Estimate, Revised Estimate and Actual Expenditure during 2016-17 127
B. LAND
3.3 Land Use in India for Selected Years 128
3.4 Selected Categories of Land Use-1950-51 to 2013-14 130
3.5 Distribution of Operational Holdings – All India 132
3.6 (a) Number of Operational Holdings by Farm Size Group, 2010-11 133
3.6 (b) Number of Operational Holdings by Farm Size Group, 2005-06 134
3.7 (a) Area Operated by Size Group, 2010-11 135
3.7 (b) Area Operated by Size Group, 2005-2006 136
3.8 (a) State-wise Average Size of Operational Holdings by Major Farm Size Groups – 2010-11
137
3.8 (b) State-wise Average Size of Operational Holdings by Major Farm Size Groups – 2005-06
138
3.9 Extent of Rainfed Area - State-wise – 2011-12 139
3.10 Ceiling on Land Holdings (2016) 140
C. IRRIGATION
3.11 Potential Created Under Accelerated Irrigation Benefit Programme (AIBP) – 2008-09 to 2015-16
141
3.12 Net Irrigated Area Source-wise and State-wise (2012-13) 143

3.13 State-wise Coverage of Irrigated Area under Principal Crops during 2013-14 (Provisional)
145
3.14 Irrigated Area Under Different Crops (For selected years) 149
3.15 Distribution of Gross Cropped Area Across - Different Crops during 2010-11 and 2012-13
150
D. AGRICULTURAL INPUTS
3.16 Production and Distribution of Agricultural Inputs – Seeds – 1991-92 to 2015-16 151
3.16 (a) Average Gross Cropped area (Ha.) Gross Area under Crop Harvested Value and Quantity Production for Agricultural Households Reporting Cultivation as Major for Selected Crops
152
3.16 (b) Per 1000 Distribution of Agricultural Households Reporting Use of Seed by their Agency of Procurement for Selected Crops
153
3.16 (c) Percentage Share of Total Values of Production and Cultivating Agricultural Households in Major States for the Two Halves of the Agricultural Year
153
3.16 (d) Number per 1000 of Agricultural Households Reporting Crop Production Average Gross Cropped Area per Reporting Household and Percentage Share of Irrigated Gross Cropped Area for Major States for the Two Halves of the Agricultural Year
154
3.17 Production, Imports and Consumption of Chemical Fertilisers 155
3.18 Consumption of Electricity for Agricultural Purposes 1982-83 to 2014-15 156
E. CROP PRODUCTION, CROP INSURANCE AND LIVESTOCK
3.19 Production of Principal Crops – 1990-91, 2000-01, 2007-08 to 2014-15 157
3.20 Principal Crops: Area, Production and Yield Per Hectare - 2012-13, 2013-14 and 2014-15
158
3.21 Per Capita Net Availability of Foodgrains (Per day) in India – 1951 to 2014 159
3.22 Net Availability of Foodgrains (Per annum) in India -1951 to 2015 161
3.23 Per Capita Availability of Certain Important Articles of Consumption 162
3.24 Progress of National Agriculture Insurance Scheme (NAIS) – 2000-01 to 2015-16 164
3.25 Livestock Population – Size and Distribution 165
3.26 Production of Major Livestock Products 166
3.27 State-wise Production of Milk, Eggs and Wool – (2012-13 to 2015-16) 167
3.28 Fish Production Over the Plan Periods 169
3.29 Fish Production in Various States 170
F. STORAGE, MARKETING AND EXPORTS
3.30 Growth Storage Capacity by Central Warehousing System 172
3.31 Foodgrain Storage Capacity Available with FCI – 2009-2016 172
3.32 Cover and Plinth (CAP) Storage Capacity Available with FCI – 2009-2016 173
3.33 State / Union Territory-wise Storage Capacity Available with FCI in Different States (As on 31.12.2015)
174
3.34 State-wise Procurement of Rice and Wheat – 2008-09 to 2016-17 (According to Marketing Year)
176

3.35 Minimum Support Price for Foodgrains – 2005-06 to 2015-16 (According to Crop Year)
178
3.36 Exports of Principal Crops / Commodities – 2013-14 to 2015-16 179
G. WASTELAND DEVELOPMENT
3.37 (a) Forests Cover in India 180
3.37 (b) State-wise Forest Cover of India (2013) 181
3.38 State-wise Recorded Forest Area of India – 2013 182
3.39 Distribution of Wastelands in India-2005-06 184
3.40 Category-wise Wastelands in India – 2005-06 185
3.41 Funds Released Under Integrated Wastelands Development Programme 186
3.42 Details of Funds Released during 2009-10 to 2015-16 188
3.43 Details of Number of Projects, Area Sanctioned and Central Funds Released from 2013-14 to 2015-16
190
3.44 Status of Projects in the Preparatory Phase Works Phase and Consolidation Phase under Watershed Development of Pradhan Mantri Krishi Sinchayee Yojana
192
3.45 Institutional Support under Watershed Development Component of Pradhan Mantri Krishi Sinchayee Yojana Funds Released during 2009-10 to 2016-17
193
SECTION – 4: RURAL CREDIT AND COOPERATION
A.RURAL CREDIT
4.1 Scheduled Commercial Banks: Branch Expansion - 1995 to 2016 197
4.2 Sectoral Deployment of Gross Bank Credit by Major Sectors 198
4.3 Purpose – wise Outstanding Advances by RRBs 199
4.4 (a) Agency – wise Ground Level Credit Flow 200
4.4 (b) Agency – wise Ground Level Credit Flow of Small Farmers / Medium Farmers 200
4.5 Ground Level Disbursement to Agriculture Sector 201
4.6 Number of Kisan Credit Cards Issued – Agency-wise and Year-wise (As on March 2012)
201
4.7 Status of Kisan Credit Cards – State-wise (As at end March 2013) 202
B. COOPERATION
4.8 Profile of Rural Cooperative Banks (As at 31st March, 2015) 204
4.9 Performance of PACS (including Farmers Services Societies or FSSs and Large –sized Adivasi Multipurpose Societies or LAMPS)
205
4.10 Selected Indicators of Primary Agricultural Credit Societies (PACS) – State-wise (At the end of 31, March, 2012)
206
4.11 (a) Progress of SHG – Bank Linkage Programme (As on 31 March, 2016) 207
4.11 (b) Grant Assistance Extended to SHPIs ( As on 31 March, 2016) 207
4.12 (a) Growth of Short-term Co-operative Credit Structure (As on 31st March 2016) 207
4.12 (b) Growth of Long-Term Co-operative Credit Structure (As on 31st March 2015) 208

4.13 Disbursements by NABARD- Agency-wise (2013-14 to 2015-16) 209
4.14 Purpose-wise Disbursements of Refinance by NABARD during 2012-13 to 2015-16
210
SECTION – 5: RURAL INDUSTRIES
5.1 Performance of SSI/ MSME Units, Employment , Investments and Gross Output 213
5.2 Summary Results : Fourth All India Census of MSME – 2014 213
5.3 Plan Allocation and Expenditure During 2014-15, 2015-16 and 2016-17 214
5.4 Budgetary Support to KVIC 214
5.5 Comparative Performance of Khadi and Village Industries 214
5.6 Production of Spun Yarn 215
5.7 Production of Cloth in Different Sectors 215
5.8 Sericulture: Physical Targets and Achievements 216
5.9 Silk Exports 2010-11 to 2016-17 216
5.10 Production of Raw Silk (including Non-Mulberry) 217
5.11 Mulberry Silk Production in India 218
5.12 Production of Jute Goods – 2010-11 t to 2015-16 218
5.13 Value of Export of Jute Goods from 2011-12 to 2015-16 219
5.14 Import of Jute Goods and Raw Jute 219
5.15 Consumption of Jute Goods 220
5.16 Number of Establishments and Employed in Rural Areas (Excluding Crop Production, Plantation, Public Administration, Defence & Compulsory Social Security Services Activities)
221
5.17 State / UT- wise Number of Establishments and Persons Employed (Excluding Crop Production, Plantation, Public Administration, Defence and Compulsory Social Security Services Activities) by Sex-wise
222
5.18 State / UT- wise Number of Establishments and Persons Employed (Excluding Crop Production, Plantation, Public Administration, Defence and Compulsory Social Security Services Activities)-Rural
224
5.19 Number of Handicraft & Handloom Establishments and Their Percentage Distribution (Exclusive Crop Production, Plantation, Public Administration, Defense & Compulsory Social Security Services Activities) - Rural
225
5.20 State / UT-wise Percentage of Establishments by Type of Structure (Excluding Crop Production, Plantation, Public Administration, Defense & Compulsory Social Security Services Activities))
226
5.21 Number of Handicraft & Handloom Establishments and Their Percentage Distribution (Excluding Crop Production, Plantation, Public Administration, Defense & Compulsory Social Security Services Activities) - Combined
227
5.22 Percentage Growth in Total Number of Establishments (Excluding Crop Production, Plantation, Public Administration, Defense & Compulsory Social Security Services Activities) and Employment in 2013 (Sixth EC) as Compared to 2005 (Fifth EC)
228

SECTION - 6: RURAL DEVELOPMENT PROGRAMMES
6.1 Financial Outlays of the Ministry of Rural Development 233
6.2 Financial Outlays of Schemes of the Department of Rural Development 233
6.3 Financial Outlays in Respect of Plan Schemes of Department of Land Resources 234
A. MAHATMA GANDHI NATIONAL RURAL EMPLOYMENT GUARANTEE SCHEME (MGNREGS)
6.4 Achievement of Mahatma Gandhi National Rural Employment Guarantee Scheme (MGNREGS) - Overview (2006-07 to 2016-17)
235
6.5 Mahatma Gandhi National Rural employment at a Glance 239
6.6 Financial and Physical Achievement of MGNREGS - 2006-07 241
6.7 State-wise Physical Achievement of MGNREGS - 2006-07 244
6.8 & 6.9 Financial and Physical Achievement of MGNREGS 2011-12 246
6.10 Physical Achievement of MGNREGS 2012-13 254
6.11 Physical Achievement of MGNREGS 2013-14 256
6.12 Financial Progress Under MGNREGS 2013-14 258
6.13 Physical Achievement of MGNREGS 2014-15 260
6.14 Physical Achievement of MGNREGS 2015-16 262
6.15 Physical Achievement of MGNREGS 2016-17 264
6.16 State – wise MGNREGS Wage Rates (Unskilled workers) 266
6.17 Progress Report on NRM/Water Related/All Plantation/PMKSY Works for 2017-2018 (As on May 24, 2017) Under MGNREGS
268
6.18 Individual Asset Creation for 2017-2018 (As on May 24, 2017) under MGNREGS 269
6.19 Status of Completed Water Related Works in 2017-2018 (As on May 24, 2017) under MGNREGS
270
B. SAANSAD ADARSH GRAM YOJANA
6.20 Summary Report of Gram Panchayats for Saansad Adarsh Gram Yojana till now 2017 – Phase I
271
6.21 Summary Report of Gram Panchayats for Saansad Adarsh Gram Yojana till now 2017 – Phase II
272
C. NATIONAL RURAL LIVELIHOODS MISSION (NRLM)
6.22 NRLM Progress at a Glance (As on May 2017) 273
6.23 National Rural Livelihoods Mission Allocation 2015-16 & 2016-17 274
6.24 National Rural Livelihoods Promotion Society (NRLP) Release and Financial Progress 2016-17 (up to Nov ‘15)
275
6.25 Financial Progress under NRLM for 2016-17 (up to Nov’16) 276
6.26 SHG-Bank Linkage Progress 2016-17 277
6.27 National Rural Livelihood Mission Cumulative Progress up to February 2014 278
6.28 Interest Subvention in Category – I Year- wise Report Under NRLM 280

6.29 Disbursal of Interest Subvention to SHGs – Category - II Under NRLM 281
6.30 Project Grant for Skilling and Placement and Placement under Deen Dayal Upadhyaya Grameen Kaushalya Yojana (DDU-GKY)
282
D. INDIRA AWAAS YOJANA (IAY)
6.31 Financial and Physical Progress 283
6.32 Houses Completed under Indira Awaas Yojana (IAY) – 2012-13 to 2016-17 284
6.33 Annual Target and Allocation of Pradhana Mantri Awaas Yojana (IAY) – 2016-17 286
6.34 Annual Target and Allocation of Indira Awaas Yojana (IAY) – 2015-16 287
6.35 Category-wise Houses Sanctioned and Completed 2015-16 289
6.36 Indira Awaas Yojana (IAY) – Financial Progress – 2015-16 291
E. DISTRICT RURAL DEVELOPMENT AGENCY (DRDA) ADMINISTRATION
6.37 State-wise Allocation & Releases under DRDA Administration Scheme 2012-13, 2013-14 and 2014-15
295
F. NATIONAL SOCIAL ASSISTANCE PROGRAMME (NSAP)
6.38 National Social Assistance Programme (NSAP) Physical and Financial Progress 296
6.39 National Social Assistance Programme (NSAP) – Allocation, Releases and Beneficiaries Coverage –State-wise- 2014-15
297
6.40 National Social Assistance Programme (NSAP) – Allocation, Releases and Beneficiaries Coverage –State-wise-2016-17
298
6.41 State-wise Progress of RSETIs as on 31.03.2014 (Cumulative) 300
SECTION - 7: SOCIAL SERVICES
A. EDUCATION
7.1 Trends Over Time Reading in Std III by School Type 2010, 2014 and 2016 - Rural 305
7.2 Trends Over Time Reading in Std V and Std VIII by School Type 2010, 2014 and 2016– Rural
305
7.3 Trends Over Time Small Schools and Multigrade Classes 2010, 2012, 2014 and 2016
305
7.4 Percentage of Children Enrolled in Different Types of Schools 2016 - Rural 306
7.5 Growth of Recognised Educational Institutions in Rural Areas 306
7.6 Trends Over Time % Schools with Selected School Facilities 2010, 2012, 2014 & 2016 - Rural
307
7.7 Class-wise Enrolment Classes in Rural Areas 2009 308
7.8 Gross Enrolment Ratios (GER) in Schools in Rural Areas (2007-08) 310
7.9 Releases and Expenditure Under Sarva Shiksha Abhiyan (SSA) in India (2010-11) 314
B. RURAL HEALTH
7.10 Rural Health Infrastructure – Norms and Level of Achievements (All-India) - 2016 315
7.11 Number of PHCs, Sub-Centres and Community Health Centres 316
7.12 No. of PHCs, Sub-Centres, Community Health Centres –State-wise (As on March, 2016)
317

7.13 Number of PHCs With Doctors And Without Doctor/Lab Technician/Pharmacist in Rural Areas (in position) in India, 2016
318
7.14 Number of Physicians at CHCs as on March, 2016 320
7.15 Shortfall in Health Infrastructure as per 2011 Population in India (As on 31st March 2016)
321
7.16 Shortfall in Health Infrastructure in PHCs and CHCs as per 2011 Population in India
322
7.17 State-wise Number of Government Hospitals (including CHCs) and Beds, in Rural Areas (2012)
324
C. NUTRITION
7.18 Delivery care (for births in the 5 years before the Survey) – Rural -2015-16 326
7.19 Nutritional Status of Adult (Age 15-49 Years) and Children Anaemic – Rural -2015-16
326
7.20 State-wise Prevalence Rate of Malnutrition in India (2005-06) 327
7.21 Trends in Childhood (0-3 Years of age) Malnutrition in India 328
7.22 State-wise Prevalence of Anemia in Children (Age 6-59 months) (NFHS-III, 2005-06)
329
7.23 Hunger Index of Selected Indian States, 2008 330
7.24 Trends in Average Per Capita Intake of Calorie, Protein and Fat Per Diem Over NSS Rounds
331
7.25 Percentage of Expenditure by Indian Household and Per Capita Intake of Calorie, Protein and Fat Per Day by Average Indian – 2009-10
331
D. DRINKING WATER SUPPLY & SANITATION
7.26 Targets and Achievements of Coverage of Drinking Water Supply in Rural Habitations-2016-17
332
7.27 Physical Progress Report under NDWM during 2016-17 334
7.28 Financial Progress of Drinking Water Supply in Rural Habitation – 2016-17 337
7.29 All India Physical Achievement 338
7.30 State-wise Status of IHHL Convergence with MGNREGA or IAY for the Financial Year 2016-17
339
7.31 Yearly Financial Status of Expenditure for the Financial Year 2016-17 345
SWACHH BHARAT MISSION
7.32 (a) Swachh Bharat Abhiyaan (Clean India Mission) 347
7.32 (b) Estimated Cost of Components of the Swachh Bharat Mission 347
7.33 Swachh Bharat Mission Total and SCs /STs Achievement during 2015-16 349
7.34 Category-wise Funds Released to States (Center & State Share) 2016-17 350
E. RURAL ROADS
7.35 Pradhan Mantri Gram Sadak Yojana (PMGSY) Outcome Targets & Achievement During Year 2015-16 Up to 31st Jan, 2016
352

7.36 Pradhan Mantri Gram Sadak Yojana (PMGSY) Revised Enhanced Annual Allocation
353
7.37 Pradhan Mantri Gram Sadak Yojana (PMGSY) Proposed Addl. Targets and Achievement for New Technology 2015-16
354
7.38 Pradhan Mantri Gram Sadak Yojana (PMGSY) – Financial Progress 355
F. RURAL ELECTRIFICATION
7.39 Bharat Nirman - BPL Households Rural Electrification 2014-15 356
7.40 Bharat Nirman - Rural Electrification for BPL Households 2015-16 357
7.41 Bharat Nirman - BPL Households Rural Electrification Villages 2015-16 358
G. FAMILY PLANNING
7.42 Effective Couple Protection Rate by All Methods 2005 to 2011 359
7.43 Distribution of Currently Married Rural Women by Contraceptive Method Currently Used (2005-06)
361
H. RURAL ENERGY
7.44 Distribution of Rural Households Using Different Types of Fuels for Cooking – 2011
362
7.45 Distribution of Rural Households Using Different Sources of Energy for Lighting- 2001 & 2011
364
I. RURAL HOUSING & HYGIENE
7.46 Number of households with Condition of Rural Houses – 2011 366
7.47 Percentage of Households living in a House with ‘Pucca Structure’, ‘Semi Pucca Structure’ and Good Ventilation – 2012
367
7.48 Distribution of Rural Households Living in Pucca, Semi-Pucca and Kutcha House (1981, 1991, 1993-94, 2000-01 & 2008-09)
368
7.49 Percentage of Distribution of Rural Households by Material of Floor 371
7.50 Percentage of Distribution of Rural Households by Material of Roof 372
7.51 Some Key Indicators of Rural Households on Micro Environment During 2012 –Rural
374
J. COMMUNICATION
7.52 Rural Teledensity under Bharat Nirman (2010-11) 375
7.53 Broadband Coverage of Village Panchayats Under Bharat Nirman-II 376
7.54 Distribution of Rural Households by Mode of Communication- 2001 & 2011 378
SECTION - 8: SOCIAL CONSUMPTION
A: EDUCATION
8.1 (a) Distribution of Persons by General Education Level – Rural – 1993-94, 1999-2000, 2004-05, 2009-10 and 2011-12
385
8.1 (b) Percentage Distribution of Students Studying in Private Institution by Reason for Preferring Private Institutions for Different Levels of Attendance - 2014
386
8.1 (c) Percentage Distribution of Students by Type of Institution Attended for Various Levels of School Education in 2014 and 2007-08
387

8.1 (d) Average Expenditure (Rs.) per Student Pursuing General Education at Different Levels of Current Attendance 2014 and 2007-08
388
8.1 (e) Percentage of Drop-outs / Discontinued Persons (aged 5-29 years) by Reasons for Dropping out / Discontinuance
389
8.2 Distribution of Rural Males by General Education Status in States and UTs (2011-12)
390
8.3 Distribution of Rural Females by General Education Status in States and UTs (2011-12)
391
8.4 Distribution of Rural Persons by General Education Status - (2011-12) 392
B. HEALTH
8.5 Preventive Vaccinations Among Children by States and India - 2015-16 393
8.6 Coverage of Universal Immunisation Programme for Children by State, 2015-16 394
8.7 Distribution of Live Births in the Five Years Preceding the Survey by Place of Delivery – (2015-16)
395
8.8 (a) Number per 1000 of Person Hospitalized (excluding child birth) in Broad Age Group during last 365 days by Gender – 2014
395
8.8 (b) Percentage Distribution of Hospitalised Cases by Type of Hospital (Public or Private) during 1995-96, 2004 and 2014- Rural
396
8.8 (c) Percentage Distribution of Cases of Hospitalised Treatment Received from Public Sector and Private Sector Hospitals for Rural and Urban Areas – 2014
396
8.8 (d) Percentage Distribution of Total Expenditure by Different Items of Expenditure – 2014
397
8.8 (e) Average Medical Expenditure (Rs.) per Hospitalisation at Public and Private Hospital for each Gender – 2014
397
C. PUBLIC DISTRIBUTION SYSTEM
8.9 Status of End-to-End Computerisation of TPDS Operations 398
8.10 Off-take of Foodgrains from Different Schemes 2016-17 400
8.11 Allocation / Off-take of Foodgrains Under Mid-Day Meal (MDM) Scheme 401
8.12 Allocation / Off-take of Foodgrains Under Annapurna Scheme 401
8.13 Financial and Physical Progress under Wheat Based Nutrition Programme (WBNP)
402
D. OTHER BASIC AMENITIES
8.14 Distribution of Households by Main Source of Drinking Water – All-India-2011 403
8.15 Distribution of Households by Major Sources of Drinking Water 2001 & 2011 –Rural
404
8.16 Availability of Drinking Water : 2001 & 2011 406
8.17 Distribution of Households by Types of Latrine Used – Rural -2011 407
8.18 Distribution of Households by Types of Latrine Used – Rural -2011 & 2001-State-wise
408
8.19 Rural Housing Characteristics – 2011 409
E. SOCIAL DEVELOPMENT INDEX

8.20 Comparison of State Ranking in SDI, MDI and HDI 410
8.21 Six Component Indices and the Aggregate Index for Rural Areas of Large States (1991)
411
8.22 Six Component Indices for Rural Areas of Large States (Normalised) - (2010) 412
8.23 Five Component Indices for SDI for SCs (Normalised)-2010 413
8.24 Five Component Indices for SDI for STs (Normalised)-2010 414
8.25 Social Development Index Scores for Rural Areas – 2014 and 2016 415
8.26 State Ranking in Individual Indicators for Rural Areas – 2014 and 2016 416
8.27 (a) Correlation among Dimensions of Rural SDI 418
8.27 (b) Correlation among Dimensions of Rural SDI-Scheduled Castes 418
8.27 (c) Correlation among Dimensions of Rural SDI- Scheduled Tribes 418
SECTION-9: PANCHAYATI RAJ
9.1 Number of Panchayats and Elected Representatives in India (Up to 2014-15) 419
9.2 Number of Panchayati Raj Institutions State – wise (As on 23, September 2014) 420
9.3 Number of Elected Representatives in all the Three Tiers of Panchayats (As on March 31, 2008)
421
9.4 Number of Elected Representatives in the Village Panchayats (As on March 31, 2008)
423
9.5 Number of Elected Representatives in the Intermediate Panchayats (As on March 31, 2008)
425
9.6 Number of Elected Representatives in the District Panchayats (As on March 31, 2008)
427
9.7 (a) Allocation and Releases Under 13th Finance Commission Grants for PRI for 2011-12, 2012-13 & 2013-14
429
9.7 (b) Allocation and Release of Local Bodies Grants for PRIs under 13th Finance Commission for the award period 2010-2015
430
9.8 Number of Elected Representatives and Functionaries Trained During 2009-10, 2010-11 and 2011-12 in Various States / UTs
432
9.9 Status of Fund Released Under Development Grant Component of Backward Regions Grant Fund (BRGF) During 2013-14
433
9.10 Allocation and Release of Backward Regions Grant Fund (BRGF) Grants in 2014-15
433
9.11 BRGF: Funds Released During 12th Five Year Plan Period 434
9.12 Details of Notified Fifth Schedule Areas 434
9.13 Financial Progress under Rajiv Gandhi Panchayat Sashaktikaran Abhiyan (RGPSA) 2013-14 to 2015-16
435
9.14 Details of financial Support under RGPSA for panchayat in PESA area during the year from 2013-14 to 2016-17
436
9.15 Component wise Amount Sanctioned under RGPSA to PESA States during 2016-17
436
9.16 Component wise Amount Sanctioned for PESA to State during 2015-16 436

9.17 Release of Basic Grant to the State Government (s) for Rural Local Bodies during 2015-16 as recommended by FFC
437
SECTION - 10: SCHEDULED CASTES & SCHEDULED TRIBES
10.1 State-wise Scheduled Caste (SC) & Scheduled Tribe (ST) Population (2011) -Rural
441
10.2 Percentage of Scheduled Caste (SC) & Schedule Tribe (ST) Population in Total Rural Population (2001 & 2011)
442
10.3 State-wise Scheduled Caste (SC) & Schedule Tribe (ST) Population–Rural (2001) 443
10.4 Population and Decadal Growth Rates of SC, ST and Total Rural Population (1981, 1991 & 2001 & 2011) – All-India
444
10.5 Literacy Rates of Scheduled Caste and Scheduled Tribe Persons – Sex-wise – All India - Rural
444
10.6 Literacy Rates of Scheduled Caste and Scheduled Tribe Persons –State-wise and Sex-wise - Rural (2009-10)
445
10.7 Level of General Education - Rural Males – Caste Group-wise (Persons of age 15 years and above) (2009-10 & 2011-12)
446
10.8 Level of General Education - Rural Females - Caste Group-wise (Persons of age 15 years and above) (2009-10 & 2011-12)
446
10.9 School Gross Enrolment Ratios of SC & ST Children 447
10.10 School Drop-out Rates Among SCs and STs (Rural + Urban) 448
10.11 Number of Holdings, Operated Area and Average Size of Holdings – Scheduled Caste 1990-91 to 2010-11
449
10.12 Number of Holdings, Operated Area and Average Size of Holdings – Scheduled Tribe 1990-91 to 2010-11
450
10.13 Number of Operational Holdings by Farm Size Group- Scheduled Caste - State-wise - 2010-11
451
10.14 Number of Operational Holdings by Farm Size Group- Scheduled Tribe - State-wise- 2010-11
452
10.15 Area Operated by Size Group, 2010-11- Scheduled Caste-State-wise 453
10.16 Area Operated by Size Group, 2010-11- Scheduled Tribe-State-wise 454
10.17 Poverty Among SCs and STs – Rural & Urban India (1983-84, 1993-94, 1999-2000, 2004-05 & 2009-10 & 2011-12)
455
10.18 Poverty Ratios Among SCs and STs – State-wise 1993-94 , 2004-05 & 2011-12 – Rural
456
10.19 Amount Released and Utilised Under Special Central Assistance (SCA) for Special Component Plan (SCP) for Scheduled Castes (2009-10 to 2011-12)
457
10.20 Physical and Financial Achievements under the Schemes of Special Central Assistance (SCA) to Scheduled Castes Sub Plan (SCSP)
458
10.21 State-wise Amount Released Under Special Central Assistance (SCA) to Tribal Sub-Plan (TSP) in India – 2006-07 to 2014-15
459
10.22 Coverage of SC/ST Under MGNREGS – All India 461
10.23 Number of Sub--Centres, PHCs and CHCs in Tribal Areas (As on March, 2016) 462
SECTION - 11: RURAL WOMEN
11.1 Female Literacy in India – 1961 to 2011 467
11.2 Education Levels of Rural Females 467
11.3 Literacy Levels of Rural Females – Social Class-wise – 2004-05, 2009-10 & 2011-12
467
11.4 Gross Enrolment Ratios for Girls (Rural + Urban) 468
11.5 Girl Children in Different Types of Schools in Rural Areas (2010 & 2016) 468
11.6 (a) Gross Drop-out Rates for Girls (Rural + Urban) 469
11.6 (b) Level-wise Average Annual Drop-out Rates in School Education (2013-14) 469
11.7 Women Teachers in India 470
11.8 Work Participation Rates of Women 470
11.9 Work Participation Rates of Rural Females According to Usual Status, Current Weekly Status and Current Daily Status
471
11.10 Status of Employment of Rural Female Workers 472
11.11 Status of Unemployment Rate of Rural Female by Age Group-wise 472
11.12 Average Wage Earnings of Female Casual Rural Labourers 473
11.13 Live Births the Mother Received Medical Attention at Delivery- Rural 473
11.14 Rural Women (15-49 Years) with Chronic Energy Deficiency (CED) - (1998-99 and 2005-06)
474
11.15 Participation of Women (in Employment) Under MGNREGS 475
11.16 PRI: Number of Elected Women Members in Various States (As on 31.03.2008) 477
SECTION - 12: NIRD & PR TRAINING
12.1 Number and Type of Programmes Organised by NIRD & PR during 2015-16 481
12.2 NIRD & PR: Number of Training Programmes and Number of Participants – 1992-93 to 2015-16
481
12.3 NIRD & PR Training Programmes : Participants’ Profile - 2015-16 482
12.4 Twelfth Plan Targets and Performance 483
12.5 Target of Training and Placement Achieved in the year 2015-16 483
SECTION - 13: DEVELOPMENT INDICATORS FOR CIRDAP AND SAARC COUNTRIES
13.1 Demographic Indicators for CIRDAP and SAARC Countries 487
13.2 Health and Nutrition Indicators of CIRDAP and SAARC Countries 489
13.3 Education and Economic Indicators of CIRDAP and SAARC Countries 491
13.4 Work and Employment Indicators of CIRDAP and SAARC Countries 495
13.5 Global and Regional Trends in Poverty Indicators 497