overview of u.s. livestock, poultry, and aquaculture ... · overview of u.s. livestock, poultry,...
TRANSCRIPT
1
Overview of U.S. Livestock, Poultry, and Aquaculture Production in 2010 and Statistics on
Major Commodities
Available Statistics
Official statistics for U.S. livestock, poultry, and aquaculture populations are published by the
National Agricultural Statistics Service (NASS) of the U.S. Department of Agriculture (USDA).
These statistics are based on the Census of Agriculture conducted every 5 years (e.g., 2002 and
2007) and sample surveys conducted monthly, quarterly, or annually as determined by the
particular commodity.
The Census of Agriculture, which is a complete enumeration of the entire agricultural segment of
the economy, is the only source of detailed, county-level data of all farms and ranches in all 50
States selling or intending to sell agricultural products worth $1,000 or more in a year. Census
2007 reports are available at: (http://www.agcensus.usda.gov/).
The massive data-collecting, editing, and summarizing effort required to prepare the Census
naturally results in a publication lag. Sample survey estimates and final Census reports rarely
show exactly the same numbers. However, the ongoing sample surveys provide the most up-to-
date statistics between the Census years and are themselves subject to revision when current-year
estimates are made. For these reasons, statistics in the 2009 Animal Health Report for one year
compared to similar statistics published for 2009 in the 2010 Animal Health Report, may not
always match.
Number of Farms
Estimates for the number of U.S. farms were based on the definition of a farm as “any
establishment from which $1,000 or more of agricultural products were sold or would be
normally sold during the year.” In general, there were fewer farms in the western half of the
United States; however, western farms and ranches were generally larger than those in the
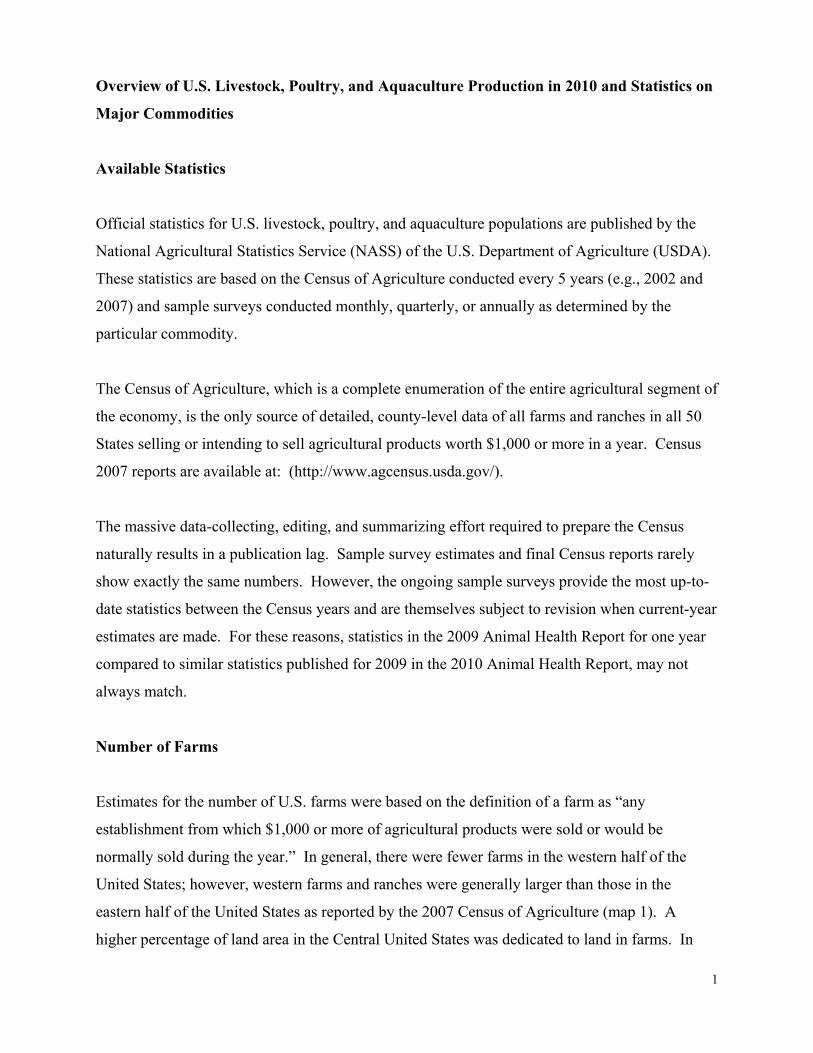
eastern half of the United States as reported by the 2007 Census of Agriculture (map 1). A
higher percentage of land area in the Central United States was dedicated to land in farms. In
2
2010, there were 2.2 million farms, virtually unchanged from 2009. Total land in farms was
920.0 million acres in 2010, which represents an increase of 100,000 acres from 2009. The
average farm size was 418 acres in 2010, unchanged from the previous year.
Map 1
Relative Magnitude of Industries, by Value of Production
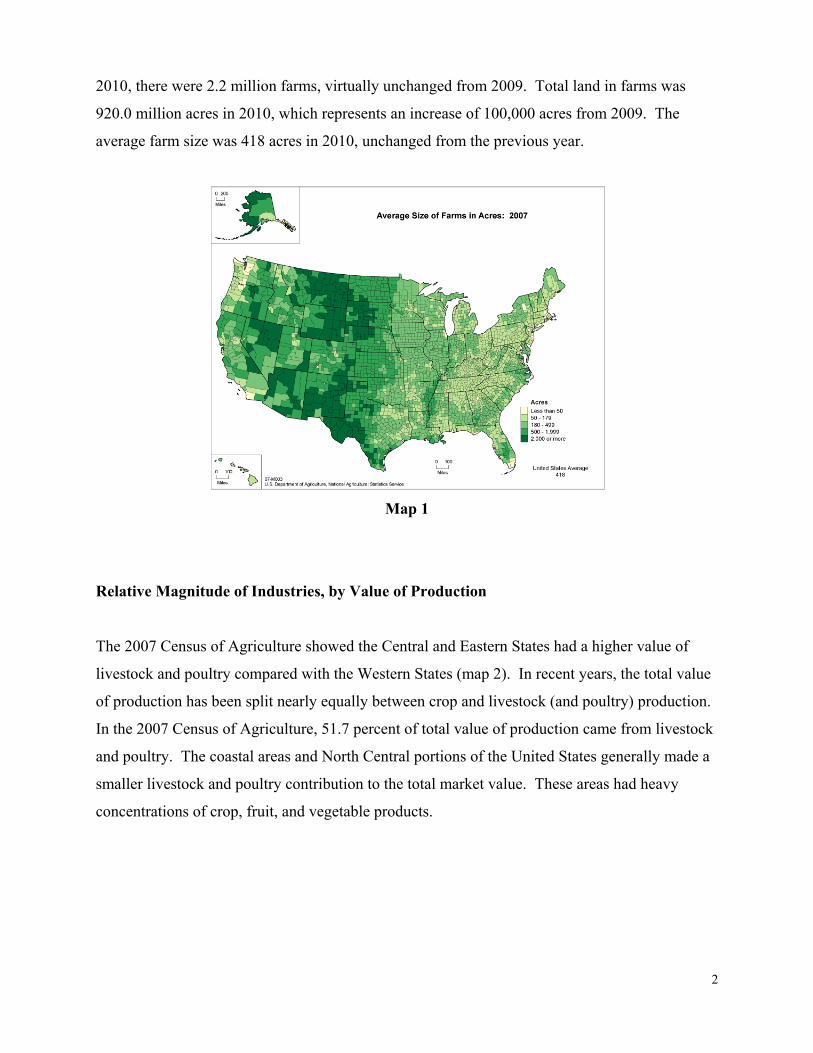
The 2007 Census of Agriculture showed the Central and Eastern States had a higher value of
livestock and poultry compared with the Western States (map 2). In recent years, the total value
of production has been split nearly equally between crop and livestock (and poultry) production.
In the 2007 Census of Agriculture, 51.7 percent of total value of production came from livestock
and poultry. The coastal areas and North Central portions of the United States generally made a
smaller livestock and poultry contribution to the total market value. These areas had heavy
concentrations of crop, fruit, and vegetable products.
3
Map 2
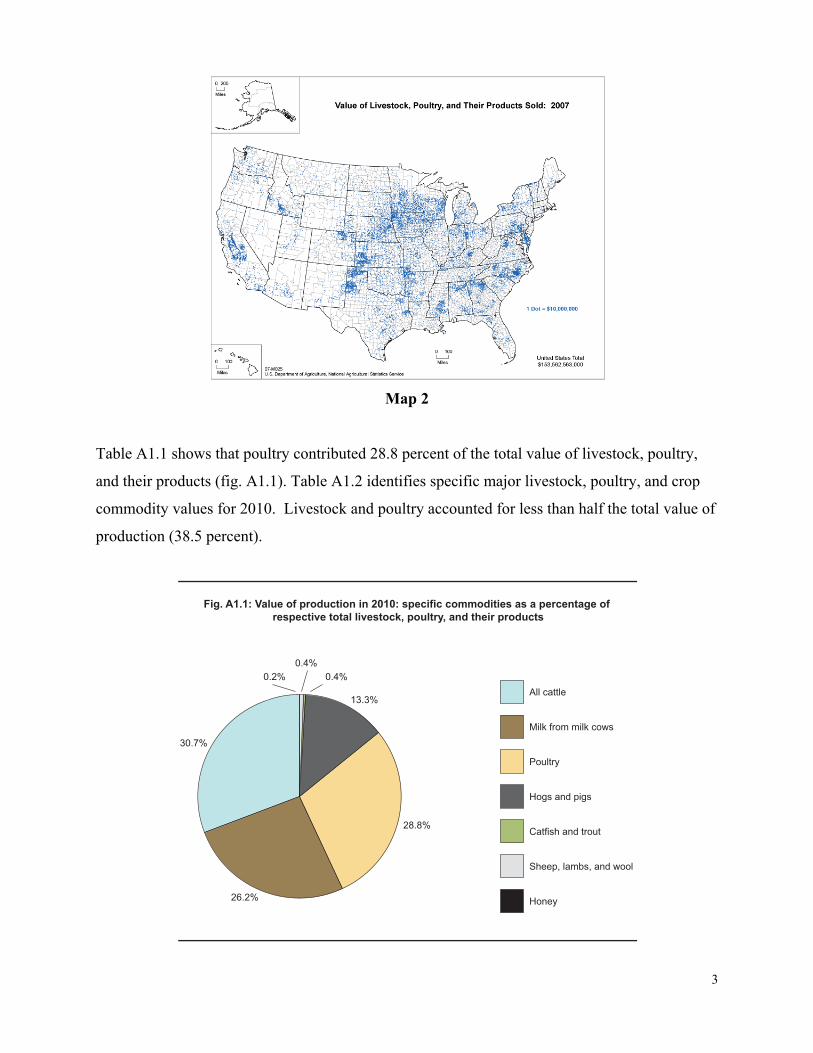
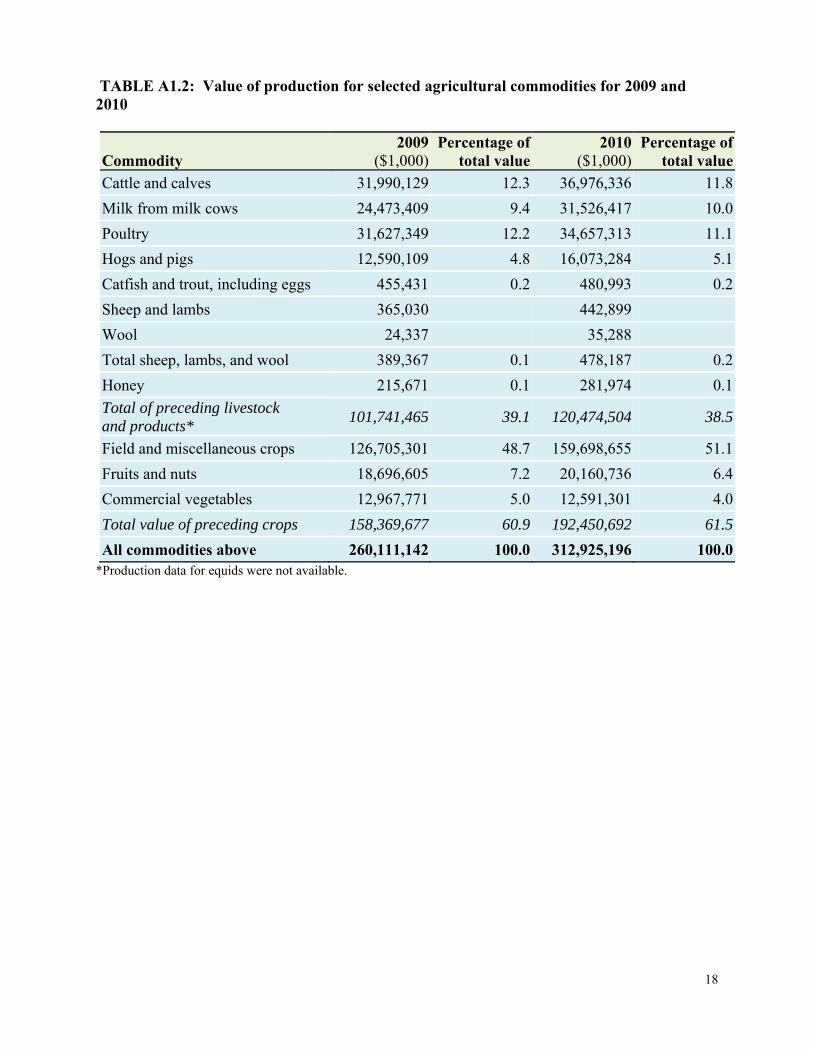
Table A1.1 shows that poultry contributed 28.8 percent of the total value of livestock, poultry,
and their products (fig. A1.1). Table A1.2 identifies specific major livestock, poultry, and crop
commodity values for 2010. Livestock and poultry accounted for less than half the total value of
production (38.5 percent).
All cattle
Milk from milk cows
Poultry
Hogs and pigs
Catfish and trout
Sheep, lambs, and wool
Honey
30.7%
26.2%
28.8%
13.3%
0.4%0.2% 0.4%
Fig. A1.1: Value of production in 2010: specific commodities as a percentage of respective total livestock, poultry, and their products
4
Introduction to the Livestock, Poultry, and Aquaculture Industries
In 2010, almost half the farms in the United States had cattle and calves (935,000). (USDA
defines a cattle operation as any place having one or more head of cattle on hand at any time
during the year.) Only a small number of cattle operations (62,500) were dairies (milk
production). The value of production for cattle and calves was roughly $37.0 billion. In
addition, the value of milk production was about $31.5 billion, 28.8 percent higher than in 2009.
The poultry industries were the next largest commodity in the United States, with production
valued at around $34.7 billion. Numbers were roughly similar for operations with hogs and
operations with sheep (69,100 and 81,000, respectively), although the comparative values of
production were dissimilar (table A1.1).
Cattle and Calves (Beef and Dairy)
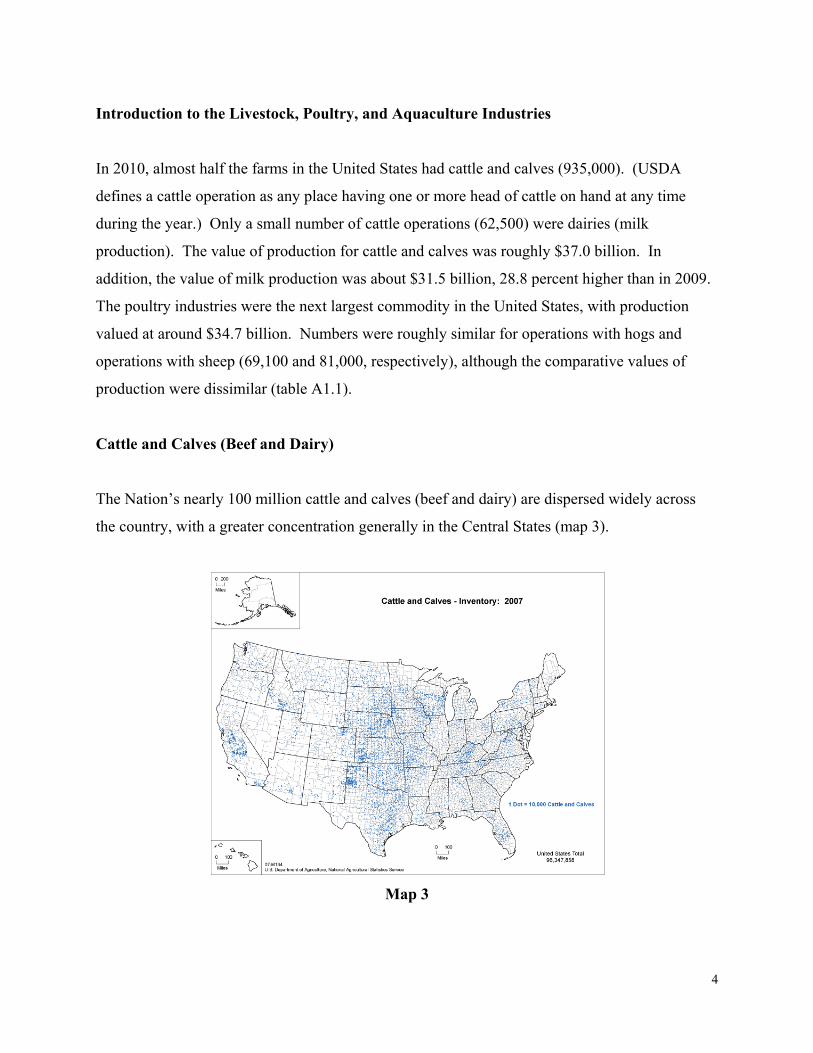
The Nation’s nearly 100 million cattle and calves (beef and dairy) are dispersed widely across
the country, with a greater concentration generally in the Central States (map 3).
Map 3
5
Overall, the number of cattle and calves in the United States increased from 30.1 million in 1869
reaching a peak at 132.0 million in 1975. In the last 3 years, the Nation’s inventory of cattle and
calves has seen a steady decline to 92.6 million on January 1, 2011.
The number of operations with cattle (or calves) has declined steadily during the past 15 years,
from 1.2 million in 1995 to 935,000 in 2010. A similar decline has also occurred in the number
of beef cow operations, from 897,660 in 1995 to 742,000 in 2010. The decrease in the number
of cattle operations is due primarily to the decline in the number of operations with fewer than 50
head of cattle.
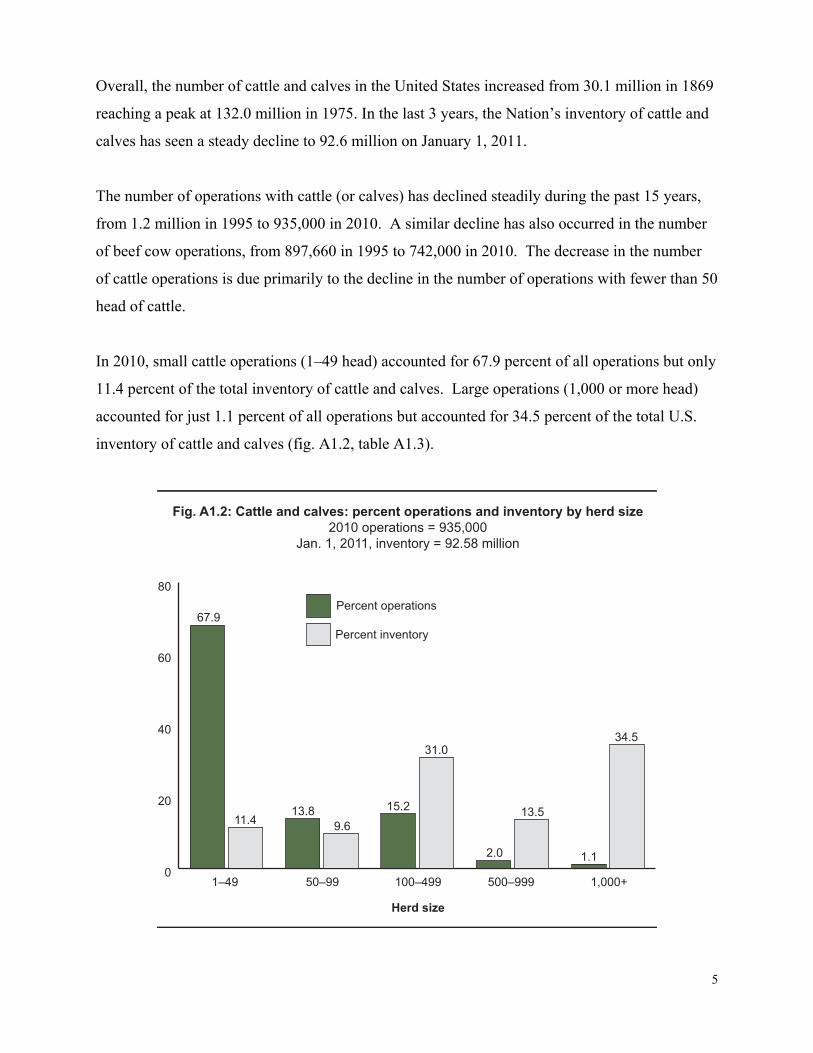
In 2010, small cattle operations (1–49 head) accounted for 67.9 percent of all operations but only
11.4 percent of the total inventory of cattle and calves. Large operations (1,000 or more head)
accounted for just 1.1 percent of all operations but accounted for 34.5 percent of the total U.S.
inventory of cattle and calves (fig. A1.2, table A1.3).
0
20
40
60
80
Percent inventory
Percent operations67.9
13.8 15.2
2.0 1.1
11.4 9.6
31.0
13.5
34.5
Fig. A1.2: Cattle and calves: percent operations and inventory by herd size2010 operations = 935,000
Jan. 1, 2011, inventory = 92.58 million
1–49 50–99 100–499 500–999 1,000+
Herd size
6
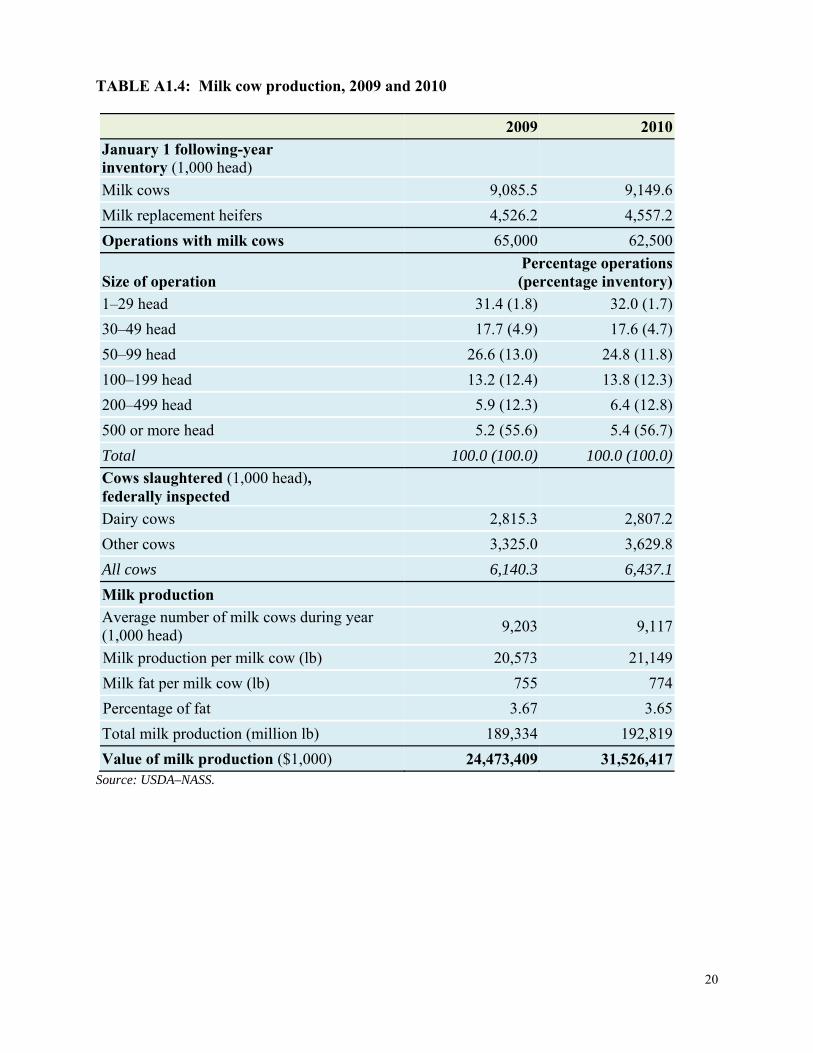
Milk Cows—Dairy
In the United States, milk cows are concentrated in California, Wisconsin, Minnesota, and States
in the Northeast.
The U.S. population of milk cows has remained relatively stable over the last 10 years; however,
the January 1, 2011, inventory of 9.1 million head was up 1 percent from the previous year.
Over the previous decade the number of milk cows has remained rather stable, ranging from 9.0
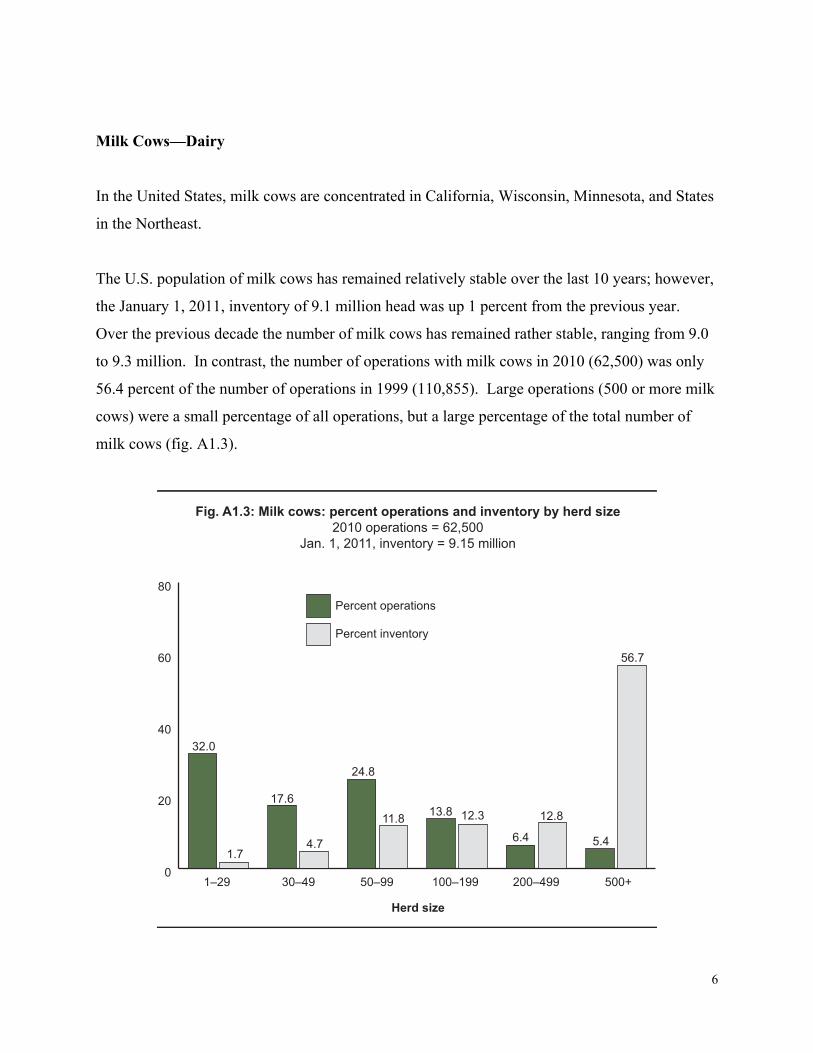
to 9.3 million. In contrast, the number of operations with milk cows in 2010 (62,500) was only
56.4 percent of the number of operations in 1999 (110,855). Large operations (500 or more milk
cows) were a small percentage of all operations, but a large percentage of the total number of
milk cows (fig. A1.3).
0
20
40
60
80
Percent inventory
Percent operations
Fig. A1.3: Milk cows: percent operations and inventory by herd size2010 operations = 62,500
Jan. 1, 2011, inventory = 9.15 million
1–29 30–49 50–99 100–199 500+
Herd size
200–499
32.0
1.7
24.8
11.8
17.6
4.7
13.8 12.3
6.4
12.8
5.4
56.7
7
Annual milk production per cow increased from 17,763 pounds in 1999 to 21,149 pounds in
2010, a 19-percent increase. Table A1.4 documents dairy production for 2009 and 2010.
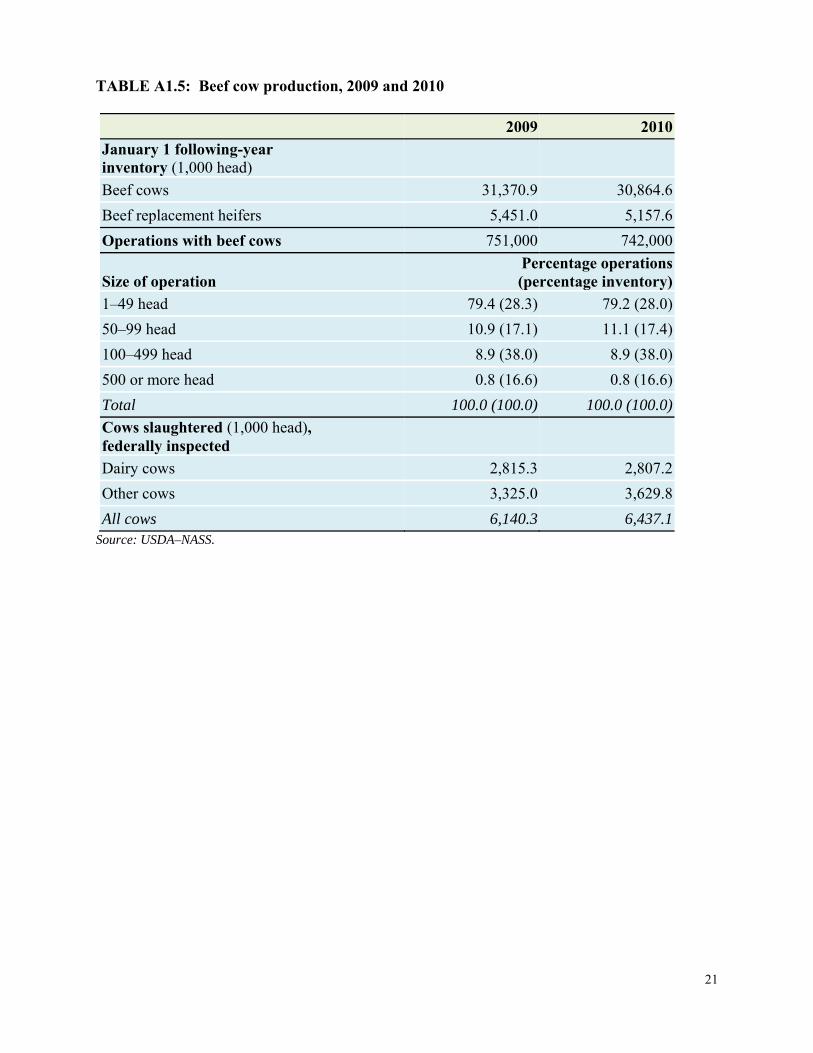
Beef Cows
Beef cows are distributed widely across the United States. In general, however, States in the
central part of the Nation have a higher number of beef cows.
The declining trend in the number of beef cows (30.9 million, down 2 percent from January 1,
2010) follows the overall trend shown for the total inventory of cattle and calves. Beef cows
accounted for 77.1 percent of the total cow inventory on January 1, 2011.
In 2010, 742,000 operations in the United States had beef cows. The number of operations with
beef cows has declined gradually since 1996 (1 to 2 percent per year). This decrease is most
notable in the number of small operations (1–49 head). Following a common trend seen in other
livestock commodities, the population of beef cows on large operations (100 or more head) has
increased and now accounts for 54.6 percent of total U.S. beef cow inventory as of January 1,
2011 (table A1.5). These large operations account for only 9.7 percent of all beef cow
operations in the United States but have more than one-half the total beef cow inventory.
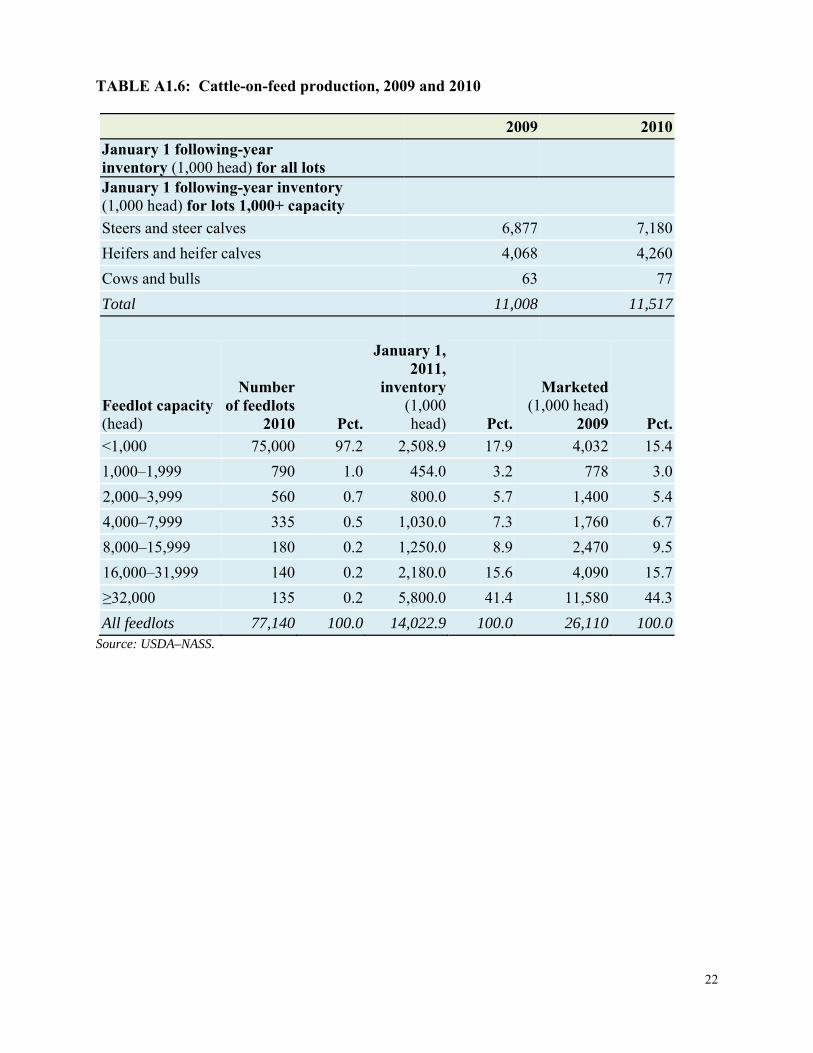
Cattle on Feed
Cattle on feed are fed a ration of grain or other concentrate in preparation for slaughter, and the
majority are in feedlots in States with large grain supplies.
On January 1, 2011, three States (Kansas, Nebraska, and Texas) accounted for over one-half
(55.6 percent) of the inventory of cattle on feed in all feedlots. Large numbers of cattle on feed
are in relatively few feedlots; 135 feedlots (0.2 percent of all feedlots) accounted for 41.4 percent
of the total U.S. cattle-on-feed inventory (table A1.6). Inventory numbers in feedlots typically
reach high points in December, January, and February and low points in August and September
because of the seasonal availability of grazing resources and the predominance of spring-born
calves. As a result, commercial cattle slaughter typically reaches a high point in May and June.
8
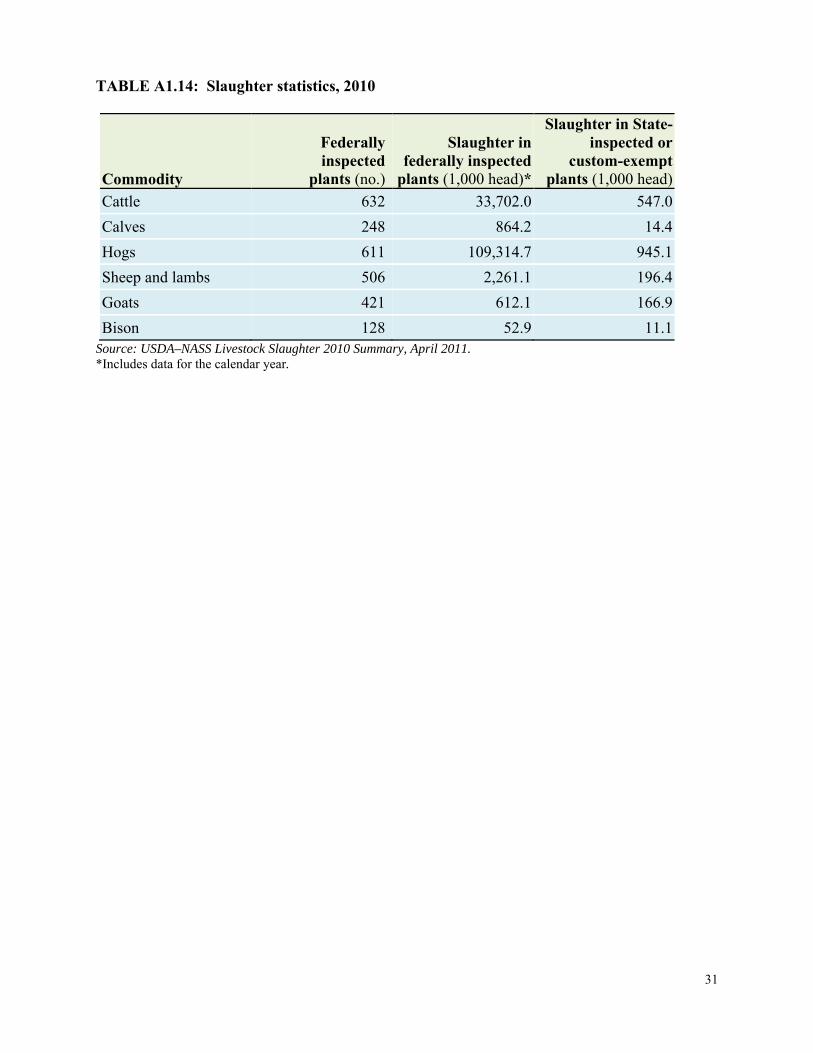
Steers and heifers accounted for 79.1 percent of 2010 federally inspected cattle slaughter. Of the
34.2 million head of commercially inspected cattle slaughter, 98.4 percent were federally
inspected (table A1.14).
Hogs
Historically, hog production has been most common in the upper Midwest. On December 1,
2010, Iowa, the largest hog-producing State, had 29.4 percent of the U.S. inventory of all hogs
and pigs. During the past two decades, North Carolina has increased its production and is now
the Nation’s second-largest hog-producing State, with 13.7 percent of the inventory. The
practice of shipping pigs from production areas (e.g., North Carolina) to grower–finisher areas in
the upper Midwest continued in 2010.
In the United States, hog and pig inventory levels are estimated and published quarterly
(December, March, June, and September). Over the past decade, the U.S. inventory of all hogs
and pigs has fluctuated from quarter to quarter. During the period from 1996 to 2001, a greater
degree of change was shown from quarter to quarter, compared with the quarter-to-quarter
variation shown in the last 5 years. Typically, inventory numbers reach a low point on March 1
and peak on September 1. The number kept for breeding decreased by 1.2 percent during the last
decade to 5.78 million head on December 1, 2010.
In 2 of the last 3 years, the number of hogs slaughtered commercially reached a low point in
June, then increased until peaking in October in preparation for the holiday season (fig. A1.4).
Commercial hog slaughter totaled 110.3 million head in 2010, 3 percent lower than 2009.
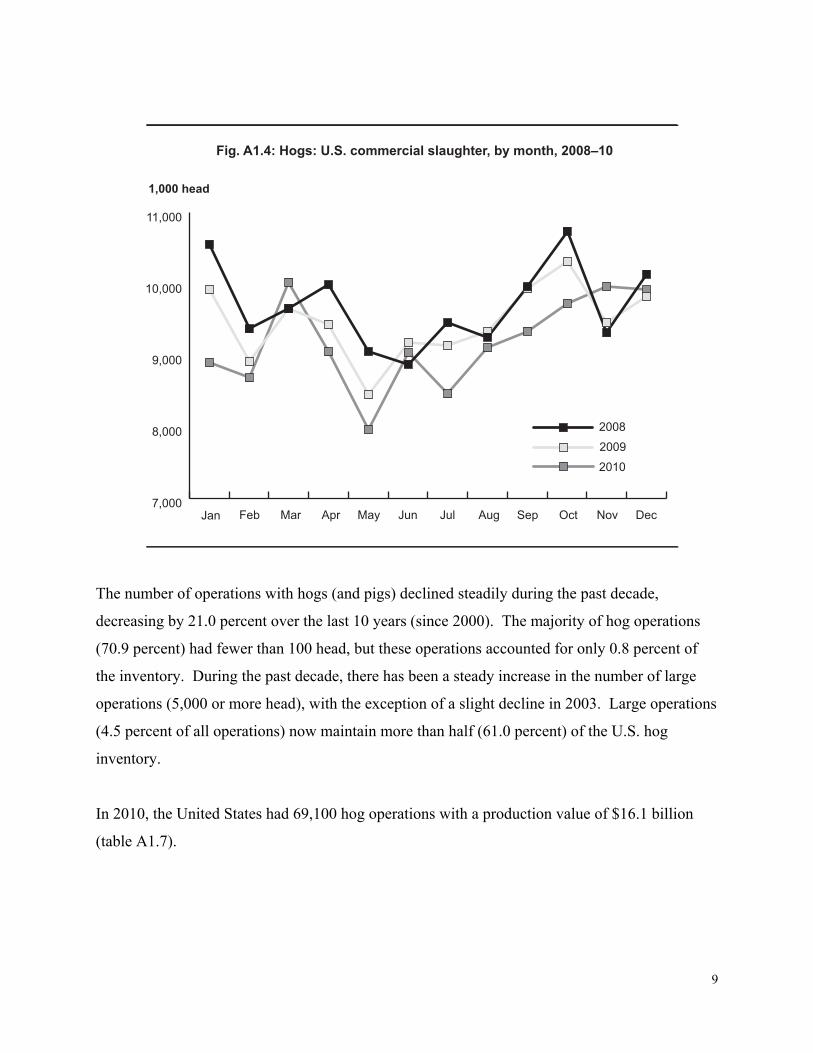
9
The number of operations with hogs (and pigs) declined steadily during the past decade,
decreasing by 21.0 percent over the last 10 years (since 2000). The majority of hog operations
(70.9 percent) had fewer than 100 head, but these operations accounted for only 0.8 percent of
the inventory. During the past decade, there has been a steady increase in the number of large
operations (5,000 or more head), with the exception of a slight decline in 2003. Large operations
(4.5 percent of all operations) now maintain more than half (61.0 percent) of the U.S. hog
inventory.
In 2010, the United States had 69,100 hog operations with a production value of $16.1 billion
(table A1.7).
7,000
8,000
9,000
10,000
11,000
2010
2009
2008
Jan Feb Mar Apr May Jun Jul Aug Sep Oct Nov Dec
1,000 head
Fig. A1.4: Hogs: U.S. commercial slaughter, by month, 2008–10
10
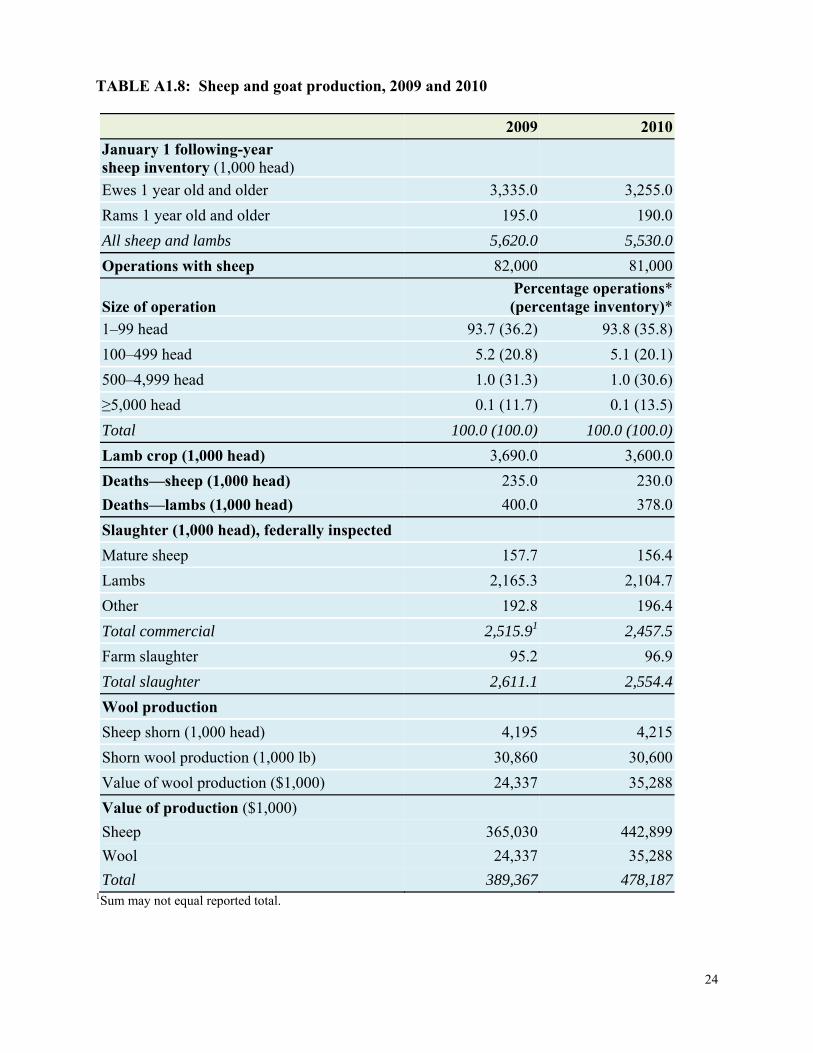
Sheep and Goats
The U.S. sheep industry is located primarily in the Western and Central States. Typically, the
Western States are characterized by large range flocks, whereas those in the Central and Eastern
States are mostly small, fenced flocks.
The number of sheep has declined steadily since the late 1980s (10.9 million head in 1988) with
the exception of a brief peak in inventory in 1990 (11.4 million head); however, there were small
increases noted on both January 1, 2005, and January 1, 2006, followed by decreases on January
1 of the next 4 years. Total sheep and lamb inventory on January 1, 2011, was 5.53 million head.
The number of operations with sheep since the late 1980s has declined gradually, from 113,640
in 1987 to 81,000 in 2010. However, only a 1-percent decrease was shown between 2009 and
2010.
Over one-third of the sheep and lamb inventory (35.8 percent) is located on small operations (1-
99 head); 93.8 percent of the 81,000 total operations had fewer than 100 head of sheep and lambs
(table A1.8). Commercial sheep and lamb slaughter totaled 2.5 million head in 2010. Slaughter
typically peaks in March or April.
There were 3.00 million goats in the United States on January 1, 2011, which represents a 1-
percent decrease from the January 1, 2010, population. Breeding goats accounted for 2.5 million
head and there were 514,000 market goats and kids. Breeding goats were comprised of 1.8
million does, 185,000 bucks, and 459,000 replacement kids under 1 year old. The number of
kids born during 2010 was estimated at 1.91 million head. The number of Angora goats
increased 6.8 percent, while the number of milk goats increased 1.1 percent (172,000 and
360,000 head, respectively). Meat and other goats totaled 2.5 million head, down 2.1 percent
from 2010.
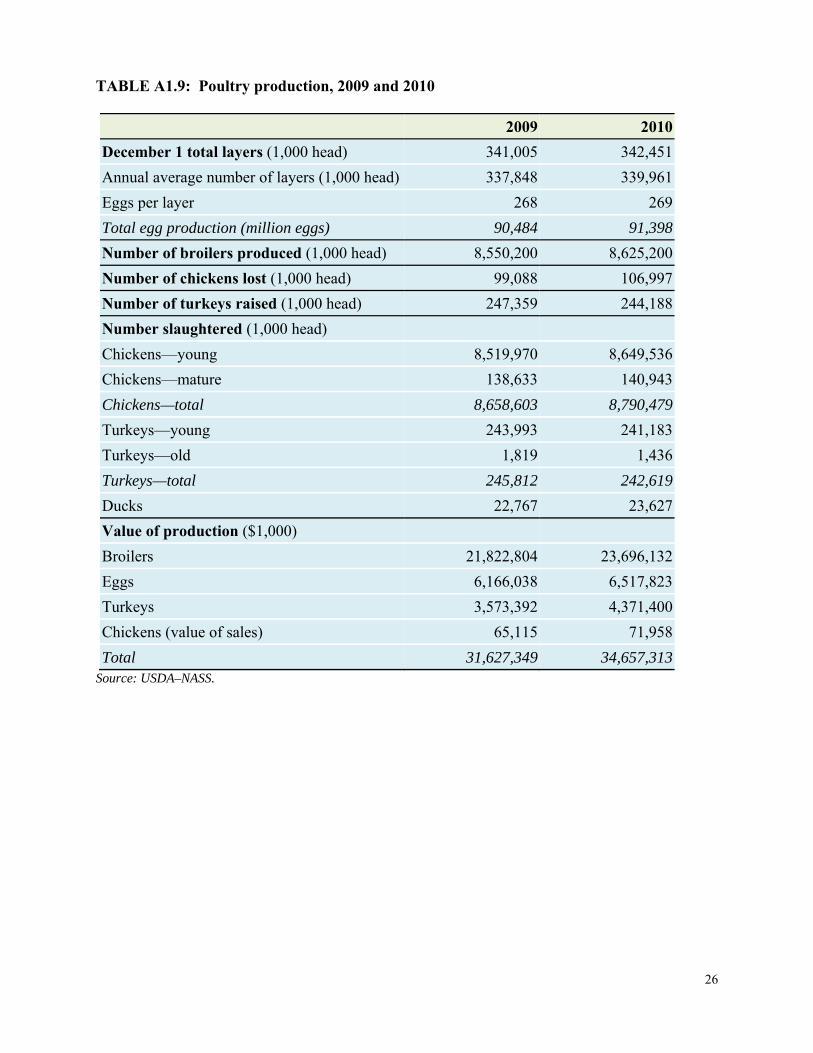
Poultry Industries
11
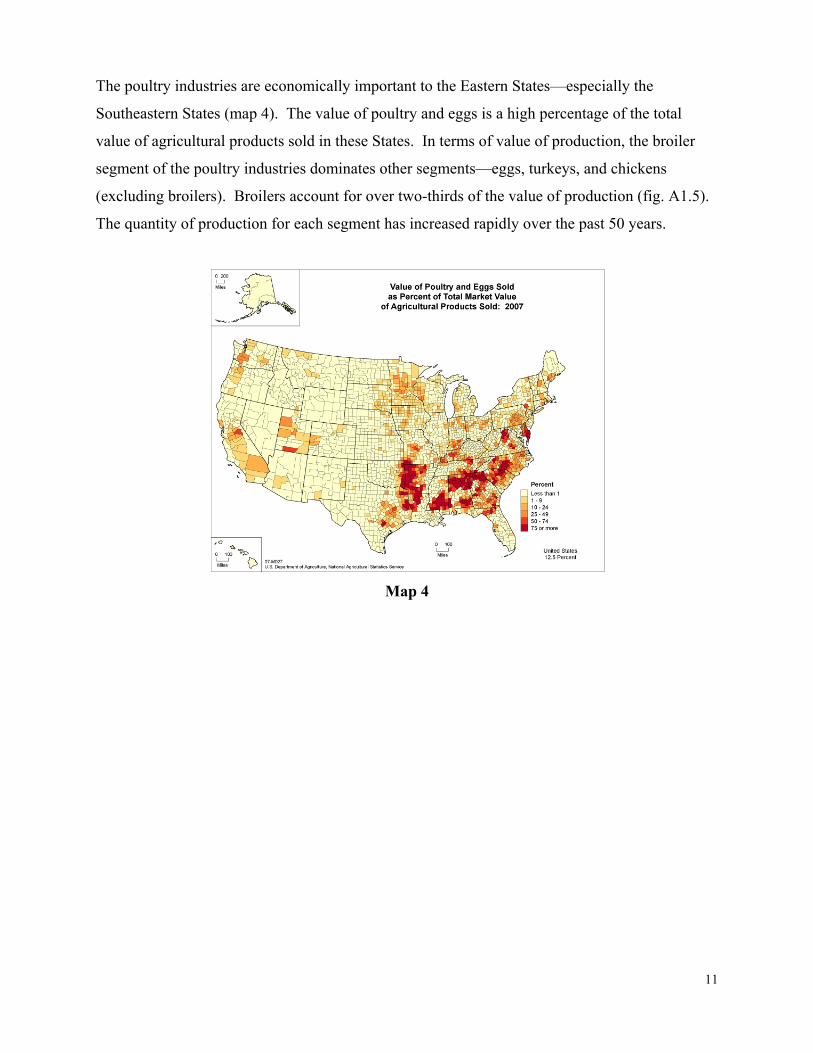
The poultry industries are economically important to the Eastern States—especially the
Southeastern States (map 4). The value of poultry and eggs is a high percentage of the total
value of agricultural products sold in these States. In terms of value of production, the broiler
segment of the poultry industries dominates other segments—eggs, turkeys, and chickens
(excluding broilers). Broilers account for over two-thirds of the value of production (fig. A1.5).
The quantity of production for each segment has increased rapidly over the past 50 years.
Map 4
12
Broiler production is concentrated heavily in the Southeast, whereas layers are dispersed more
widely over the Central and Eastern States.
Turkey production is concentrated in the eastern half of the United States. Arkansas, North
Carolina, and Minnesota accounted for 43.0 percent of the 244 million turkeys raised in 2010.
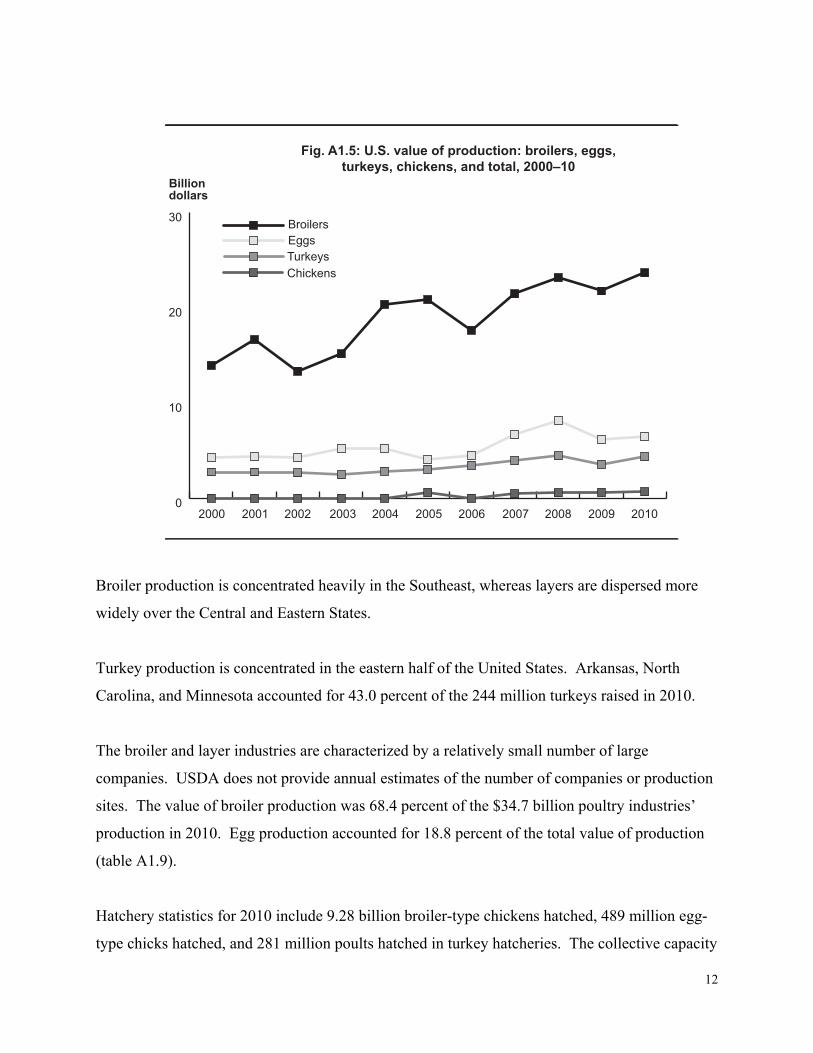
The broiler and layer industries are characterized by a relatively small number of large
companies. USDA does not provide annual estimates of the number of companies or production
sites. The value of broiler production was 68.4 percent of the $34.7 billion poultry industries’
production in 2010. Egg production accounted for 18.8 percent of the total value of production
(table A1.9).
Hatchery statistics for 2010 include 9.28 billion broiler-type chickens hatched, 489 million egg-
type chicks hatched, and 281 million poults hatched in turkey hatcheries. The collective capacity
0
10
20
30
ChickensTurkeysEggsBroilers
2000 2001 2003 2004 2005 2006 2007 2008 2009 20102002
Billiondollars
Fig. A1.5: U.S. value of production: broilers, eggs,turkeys, chickens, and total, 2000–10
13
of the 312 chicken hatcheries on January 1, 2011, was 895 million eggs, and the capacity of the
50 turkey hatcheries was 38.0 million eggs.
More than 99 percent of total U.S. poultry slaughter of the major species is done in federally
inspected slaughter plants.
In 2010, approximately 310 plants slaughtered poultry under Federal inspection. Young
chickens were slaughtered in 38 States and young turkeys were slaughtered in 26 States.
Slaughter of young chickens1 accounted for 85.5 percent of the total live weight of poultry
slaughtered in 2010. The average live weight of young chickens slaughtered has steadily
increased over the previous decade, ranging from 4.99 pounds in 2000 to 5.70 pounds in 2010.
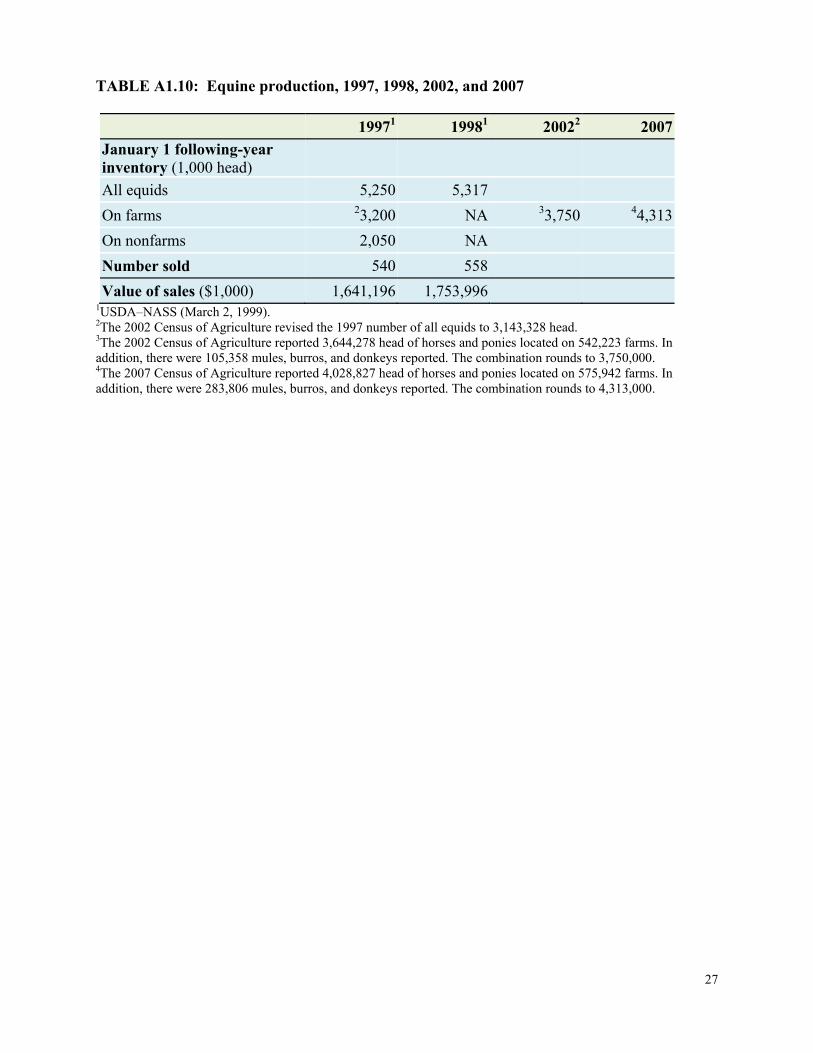
Equine Industry
Statistics on the demographics of the U.S. equine industry are sparse. USDA does not have an
equine statistics program; the only estimates available for the entire domestic equine population
date from 1998 and 1999.
The 2007 Census of Agriculture estimated 4.03 million horses and ponies reported on 575,942
farms. There is a broad and even distribution of horses and ponies across the United States. The
2007 Census also reported 283,806 mules, burros, and donkeys located on 99,746 farms. Note:
These estimates do not include equids on nonfarm places. The current definition of a farm, first
used in 1974, is a place that could or did actually sell $1,000 of agricultural products annually.
In addition, as of 1987 any operation that has five or more equids (other than commercial
enterprises such as race tracks) qualifies as a farm, even if it has no other agricultural activity.
The Census figures may be compared with the last statistics published by USDA for equine
inventories on all places. As of January 1, 1998, the inventory of equids on both farms and
nonfarms totaled 5.25 million head. A year later, that figure was 5.32 million head (table A1.9).
1 Young chickens are commercially grown broilers, fryers, and other young, immature birds (e.g., roasters and capons).
14
In addition, 39.1 percent of the January 1, 1998, total was estimated to be on nonfarm locations.
The estimated value of equine sales was $1.64 billion for 1997 and $1.75 billion for 1998.
USDA publishes no estimates for the number of all operations with equids and collects no
information by size of equid operation for the United States.
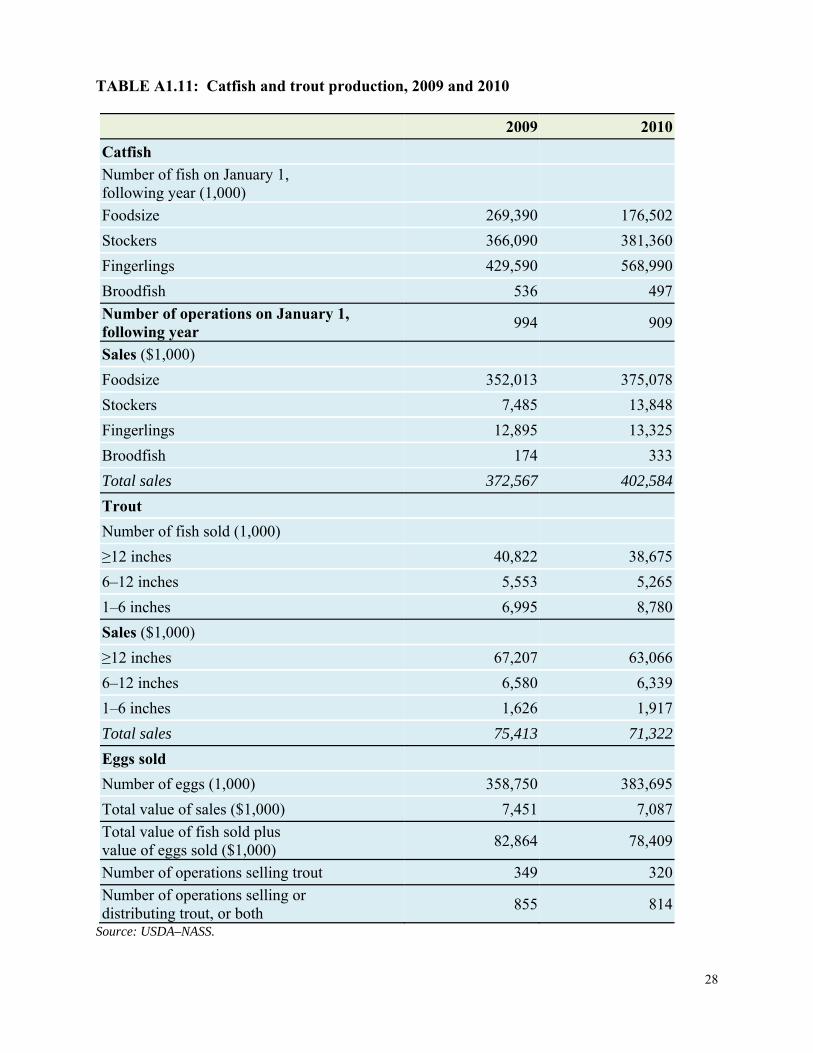
Fish and Other Aquaculture Products
The 2007 Census of Agriculture estimated the value of aquaculture products (domestic farm-
raised) sold at $1.4 billion or about 1 percent of the total $153.6 billion sales for all livestock,
poultry, and their products in the United States. Combined catfish and trout sold accounted for
47.1 percent of the $1.4 billion total. NASS collects information on the catfish and trout
industries through monthly catfish processing surveys, semiannual catfish production surveys,
and an annual trout survey (table A1.11). Domestic catfish production in 2010 was concentrated
in the Southern States, with Mississippi accounting for 54.1 percent of total sales. The total
value of catfish sales for 2010 was $402.6 million, which was up 8.1 percent from 2010 (table
A1.11). Food-size catfish accounted for 93.2 percent of total sales.
Domestic trout production was dispersed more widely across the United States. Idaho accounted
for 48.9 percent of total value of fish sold, followed by North Carolina at 8.7 percent. The total
value of all trout sales, both fish and eggs, was $78.4 million in 2010—a decrease of 5.4 percent
from 2009.
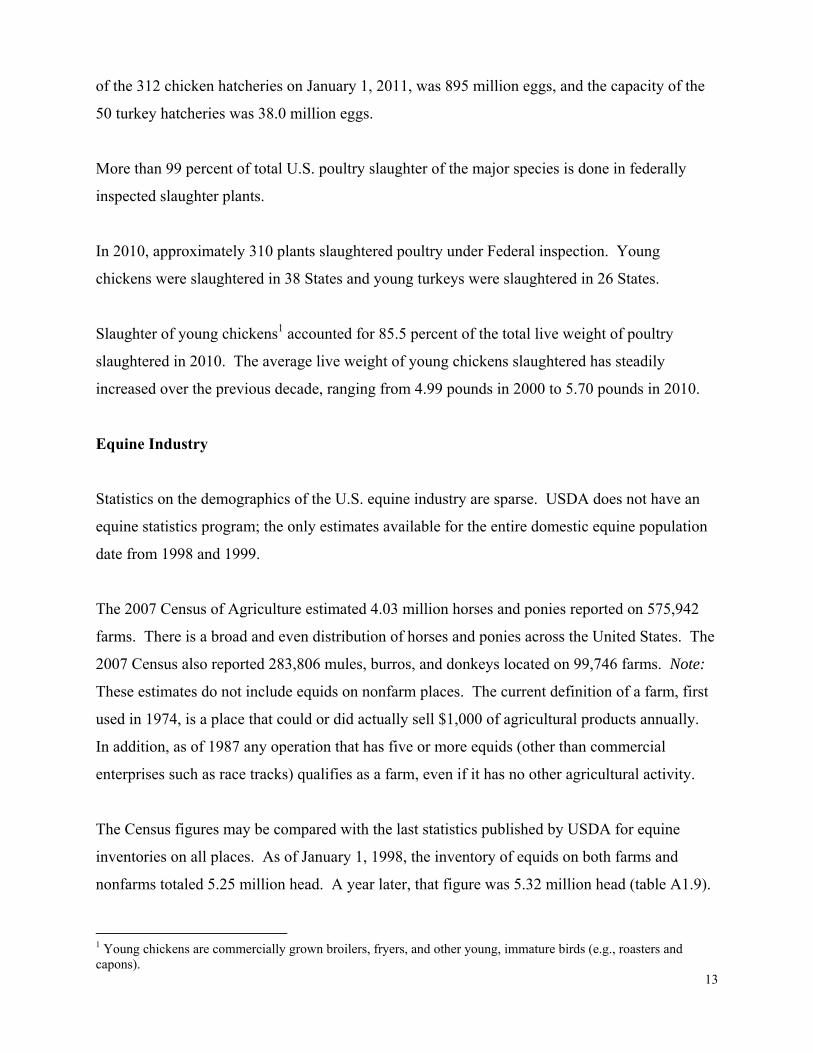
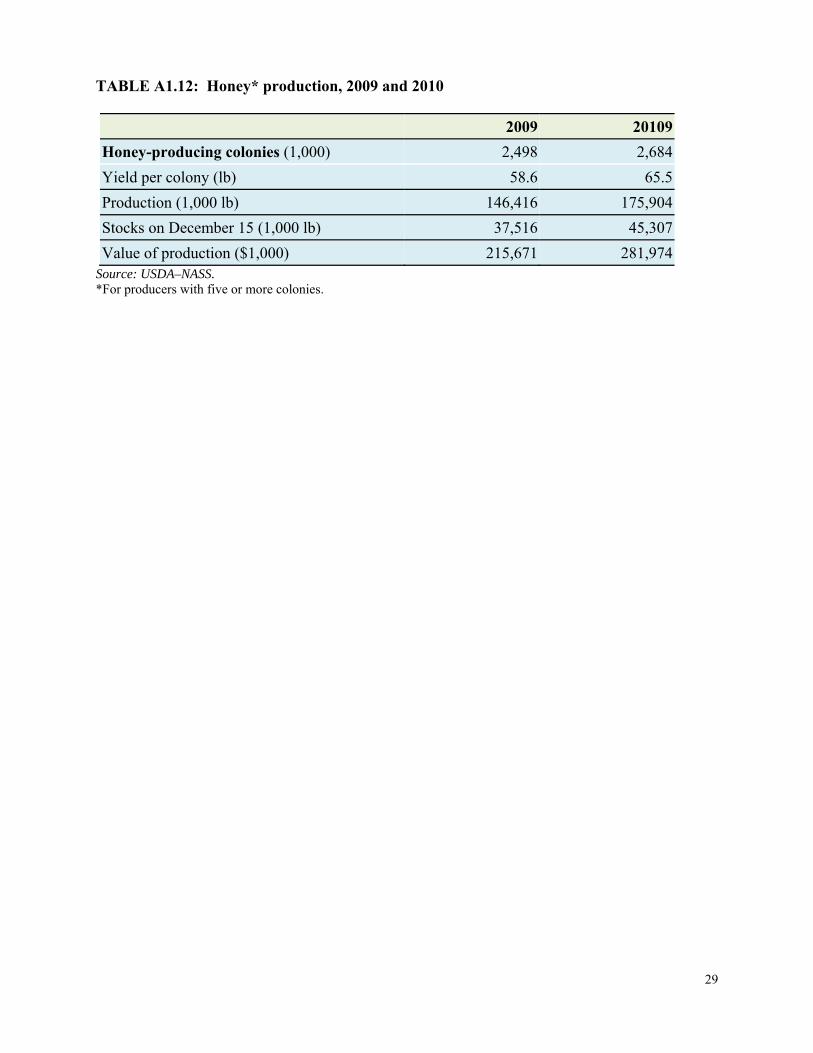
Honey Production
In 2010, honey production from producers with five or more colonies totaled 175.9 million
pounds, which represents a 20.1-percent increase from 2009 (table A1.12; fig. A1.6). A 9-
percent increase in honey prices, resulted in a 2010 value of production of $282.0 million, up
30.7 percent from the previous year. The distribution of honey production is widespread across
the United States, although North Dakota accounted for 26.4 percent of the total production.
15
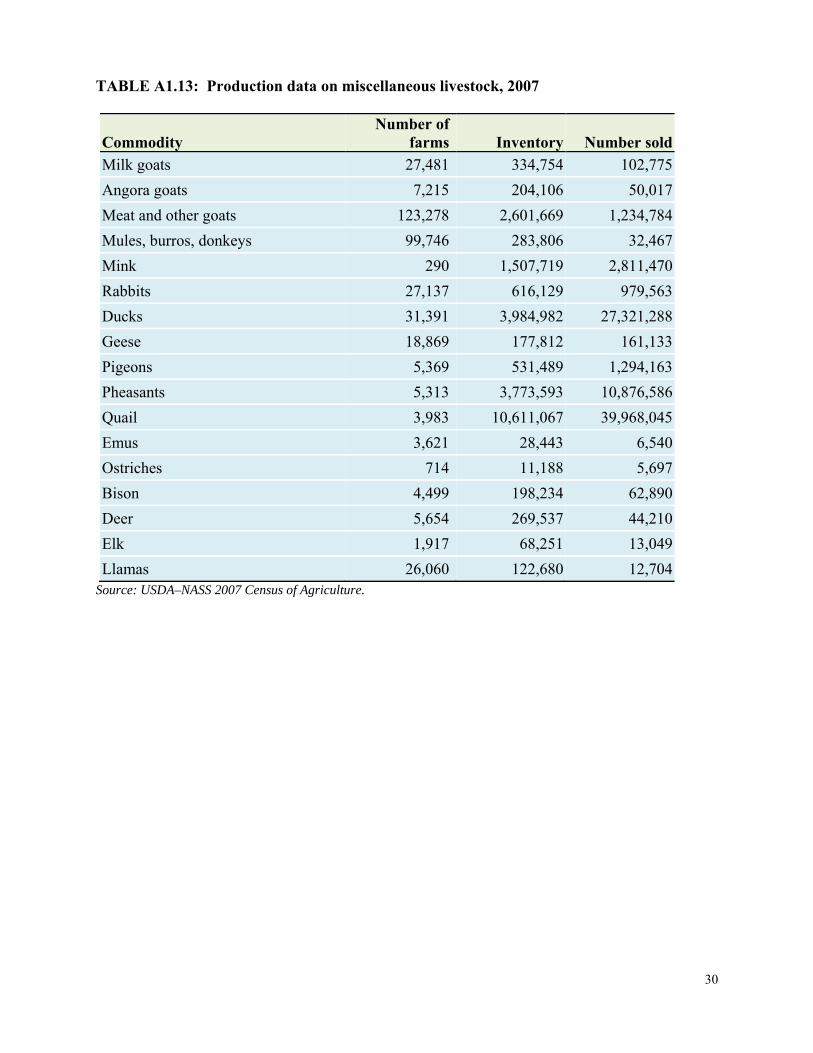
Miscellaneous
The 2007 Census of Agriculture reported several miscellaneous livestock and poultry
commodities, which are shown in table A1.13.
Number of Livestock Slaughter Plants in the United States
On January 1, 2011, there were 841 federally inspected U.S. slaughter plants. Federally
inspected plants are those that transport meat interstate and must employ Federal inspectors to
ensure compliance with USDA standards. There are additional plants considered federally
inspected, called Talmedge-Aiken plants. Although USDA is responsible for inspection in these
plants, actual Federal inspection is carried out by State employees, who ensure that Federal
regulations are being followed. During 2010, 632 plants slaughtered cattle (table A1.14), and 14
120,000
140,000
160,000
180,000
200,000
220,000
240,000
1990 1992 1996 1998 2000 2002 2004 2006 20101994
1,000 lb
Fig. A1.6: U.S. honey production, 1990–2010
2008

16
of these plants slaughtered 55 percent of the total cattle slaughtered. Five of the 248 plants that
slaughtered calves accounted for 56 percent of the total, and 4 of the 506 plants that slaughtered
sheep or lambs in 2010 produced 64 percent of the total number of head slaughtered. In 2010,
421 plants slaughtered goats. Hogs were slaughtered at 611 plants; 12 of the largest plants
accounted for 57 percent of the total.
Iowa, Kansas, Nebraska, and Texas accounted for 49.2 percent of U.S. commercial red-meat
production in 2010. Monthly commercial red-meat production typically reaches a low point in
February. Beef and pork dominated commercial red-meat production in 2010 (53.6 and 45.8
percent, respectively).
On January 1, 2011, there were 1,891 State-inspected or custom-exempt slaughter plants in the
United States, compared with 1,940 such plants on January 1, 2010. State-inspected plants sell
and transport exclusively intrastate. State inspectors ensure compliance with individual State
standards as well as with Federal meat and poultry inspection statutes. Custom-exempt plants do
not sell meat but operate on a custom slaughter basis only. The animals and meat are not
federally inspected, but the facilities must meet local health requirements.
17
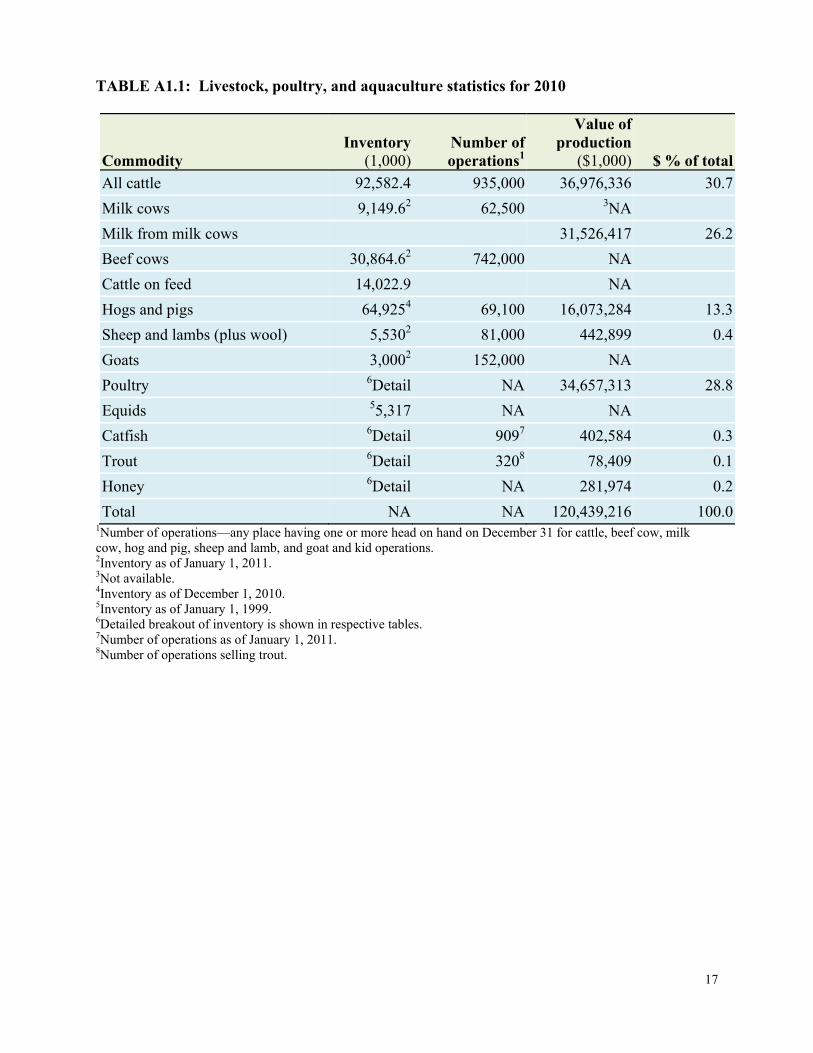
TABLE A1.1: Livestock, poultry, and aquaculture statistics for 2010
Commodity Inventory
(1,000)Number of operations1
Value of production
($1,000) $ % of totalAll cattle 92,582.4 935,000 36,976,336 30.7
Milk cows 9,149.62 62,500 3NA
Milk from milk cows 31,526,417 26.2
Beef cows 30,864.62 742,000 NA
Cattle on feed 14,022.9 NA
Hogs and pigs 64,9254 69,100 16,073,284 13.3
Sheep and lambs (plus wool) 5,5302 81,000 442,899 0.4
Goats 3,0002 152,000 NA
Poultry 6Detail NA 34,657,313 28.8
Equids 55,317 NA NA
Catfish 6Detail 9097 402,584 0.3
Trout 6Detail 3208 78,409 0.1
Honey 6Detail NA 281,974 0.2
Total NA NA 120,439,216 100.01Number of operations—any place having one or more head on hand on December 31 for cattle, beef cow, milk cow, hog and pig, sheep and lamb, and goat and kid operations. 2Inventory as of January 1, 2011. 3Not available. 4Inventory as of December 1, 2010. 5Inventory as of January 1, 1999. 6Detailed breakout of inventory is shown in respective tables. 7Number of operations as of January 1, 2011. 8Number of operations selling trout.
18
TABLE A1.2: Value of production for selected agricultural commodities for 2009 and 2010
Commodity 2009
($1,000)Percentage of
total value2010
($1,000) Percentage of
total valueCattle and calves 31,990,129 12.3 36,976,336 11.8
Milk from milk cows 24,473,409 9.4 31,526,417 10.0
Poultry 31,627,349 12.2 34,657,313 11.1
Hogs and pigs 12,590,109 4.8 16,073,284 5.1
Catfish and trout, including eggs 455,431 0.2 480,993 0.2
Sheep and lambs 365,030 442,899
Wool 24,337 35,288
Total sheep, lambs, and wool 389,367 0.1 478,187 0.2
Honey 215,671 0.1 281,974 0.1
Total of preceding livestock and products*
101,741,465 39.1 120,474,504 38.5
Field and miscellaneous crops 126,705,301 48.7 159,698,655 51.1
Fruits and nuts 18,696,605 7.2 20,160,736 6.4
Commercial vegetables 12,967,771 5.0 12,591,301 4.0
Total value of preceding crops 158,369,677 60.9 192,450,692 61.5
All commodities above 260,111,142 100.0 312,925,196 100.0*Production data for equids were not available.
19
TABLE A1.3: Cattle and calves production, 2009 and 2010
2009 2010January 1 following-year inventory (1,000 head) All cattle and calves 93,881.2 92,582.4
All cows 40,456.4 40,014.2
Cattle on feed 13,642.2 14,022.9
Operations with cattle and calves 946,000 935,000
Size of operation Percentage operations(percentage inventory)
1–49 head 67.8 (11.4) 67.9 (11.4)
50–99 head 13.8 (9.6) 13.8 (9.6)
100–499 head 15.3 (31.2) 15.2 (31.0)
500–999 head 2.0 (13.5) 2.0 (13.5)
1,000 or more head 1.1 (34.3) 1.1 (34.5)
Total 100.0 (100.0) 100.0 (100.0)
Calf crop 35,939.0 35,684.8
Deaths—cattle (1,000 head) 1,741.2 1,735.1
Death—calves (1,000 head) 2,322.7 2,260.1
Commercial calves slaughter (1,000 head) Federally inspected 930.4 864.2
Other 13.8 14.4
Total commercial 944.2 878.6
Commercial cattle slaughter (1,000 head) Federally inspected
Steers 16,311.7 16,596.4
Heifers 9,743.0 10,046.8
All cows 6,140.3 6,437.1
Bulls 570.2 621.7
Other 573.0 547.0
Total commercial 33,338.31 34,249.0
Farm cattle and calves slaughter (1,000 head)* 185.4 203.2
Total cattle and calves slaughter (1,000 head) 34,467.9 35,330.8*
Value of production ($1,000) 31,990,129 36,976,336Source: USDA–NASS. *Farm slaughter includes animals slaughtered on farms primarily for home consumption. It excludes custom slaughter for farmers at commercial establishments but includes mobile slaughtering on farms. 1Sum may not equal reported total.
20
TABLE A1.4: Milk cow production, 2009 and 2010 2009 2010January 1 following-year inventory (1,000 head) Milk cows 9,085.5 9,149.6
Milk replacement heifers 4,526.2 4,557.2
Operations with milk cows 65,000 62,500
Size of operation Percentage operations(percentage inventory)
1–29 head 31.4 (1.8) 32.0 (1.7)
30–49 head 17.7 (4.9) 17.6 (4.7)
50–99 head 26.6 (13.0) 24.8 (11.8)
100–199 head 13.2 (12.4) 13.8 (12.3)
200–499 head 5.9 (12.3) 6.4 (12.8)
500 or more head 5.2 (55.6) 5.4 (56.7)
Total 100.0 (100.0) 100.0 (100.0)
Cows slaughtered (1,000 head), federally inspected Dairy cows 2,815.3 2,807.2
Other cows 3,325.0 3,629.8
All cows 6,140.3 6,437.1
Milk production Average number of milk cows during year (1,000 head)
9,203 9,117
Milk production per milk cow (lb) 20,573 21,149
Milk fat per milk cow (lb) 755 774
Percentage of fat 3.67 3.65
Total milk production (million lb) 189,334 192,819
Value of milk production ($1,000) 24,473,409 31,526,417Source: USDA–NASS.
21
TABLE A1.5: Beef cow production, 2009 and 2010 2009 2010January 1 following-year inventory (1,000 head) Beef cows 31,370.9 30,864.6
Beef replacement heifers 5,451.0 5,157.6
Operations with beef cows 751,000 742,000
Size of operation Percentage operations(percentage inventory)
1–49 head 79.4 (28.3) 79.2 (28.0)
50–99 head 10.9 (17.1) 11.1 (17.4)
100–499 head 8.9 (38.0) 8.9 (38.0)
500 or more head 0.8 (16.6) 0.8 (16.6)
Total 100.0 (100.0) 100.0 (100.0)
Cows slaughtered (1,000 head), federally inspected Dairy cows 2,815.3 2,807.2
Other cows 3,325.0 3,629.8
All cows 6,140.3 6,437.1Source: USDA–NASS.
22
TABLE A1.6: Cattle-on-feed production, 2009 and 2010 2009 2010January 1 following-year inventory (1,000 head) for all lots January 1 following-year inventory (1,000 head) for lots 1,000+ capacity Steers and steer calves 6,877 7,180
Heifers and heifer calves 4,068 4,260
Cows and bulls 63 77
Total 11,008 11,517
Feedlot capacity (head)
Number of feedlots
2010 Pct.
January 1, 2011,
inventory (1,000 head) Pct.
Marketed (1,000 head)
2009 Pct.<1,000 75,000 97.2 2,508.9 17.9 4,032 15.4
1,000–1,999 790 1.0 454.0 3.2 778 3.0
2,000–3,999 560 0.7 800.0 5.7 1,400 5.4
4,000–7,999 335 0.5 1,030.0 7.3 1,760 6.7
8,000–15,999 180 0.2 1,250.0 8.9 2,470 9.5
16,000–31,999 140 0.2 2,180.0 15.6 4,090 15.7
≥32,000 135 0.2 5,800.0 41.4 11,580 44.3
All feedlots 77,140 100.0 14,022.9 100.0 26,110 100.0Source: USDA–NASS.

23
TABLE A1.7: Hog and pig production, 2009 and 2010 2009 2010December 1 inventory (1,000 head) Breeding 5,850 5,778
Market 59,037 59,147
All hogs and pigs 64,887 64,925
Operations with hogs and pigs 71,450 69,100
Size of operation Percentage operations(percentage inventory)
1–99 head 70.5 (0.9) 70.9 (0.8)
100–499 head 8.5 (2.3) 7.5 (2.1)
500–999 head 4.5 (3.3) 4.1 (3.1)
1,000–1,999 head 5.0 (7.5) 5.3 (8.0)
2,000–4,999 head 7.4 (24.0) 7.7 (25.0)
≥5,000 head 4.1 (62.0) 4.5 (61.0)
Total 100.0 (100.0) 100.0 (100.0)
Pig crop (1,000 head) December–November* 114,542 113,686
Pigs per litter December–November* 9.62 9.78
Deaths (1,000 head) 8,899.5 8,627.2
Slaughter (1,000 head), federally inspected Barrows and gilts 108,950.8 105,982.8
Sows 3,243.0 2,965.9
Stags and boars 419.0 366.0
Other 1,005.8 945.1
Total commercial 113,618.6 110,259.8
Farm slaughter 113.7 107.2
Total slaughter 113,732.3 110,367.0
Value of production ($1,000) 12,590,109 16,073,284Source: USDA–NASS. *December of the preceding year.
24
TABLE A1.8: Sheep and goat production, 2009 and 2010 2009 2010January 1 following-year sheep inventory (1,000 head) Ewes 1 year old and older 3,335.0 3,255.0
Rams 1 year old and older 195.0 190.0
All sheep and lambs 5,620.0 5,530.0
Operations with sheep 82,000 81,000
Size of operation Percentage operations*(percentage inventory)*
1–99 head 93.7 (36.2) 93.8 (35.8)
100–499 head 5.2 (20.8) 5.1 (20.1)
500–4,999 head 1.0 (31.3) 1.0 (30.6)
≥5,000 head 0.1 (11.7) 0.1 (13.5)
Total 100.0 (100.0) 100.0 (100.0)
Lamb crop (1,000 head) 3,690.0 3,600.0
Deaths—sheep (1,000 head) 235.0 230.0
Deaths—lambs (1,000 head) 400.0 378.0
Slaughter (1,000 head), federally inspected Mature sheep 157.7 156.4
Lambs 2,165.3 2,104.7
Other 192.8 196.4
Total commercial 2,515.91 2,457.5
Farm slaughter 95.2 96.9
Total slaughter 2,611.1 2,554.4
Wool production Sheep shorn (1,000 head) 4,195 4,215
Shorn wool production (1,000 lb) 30,860 30,600
Value of wool production ($1,000) 24,337 35,288
Value of production ($1,000) Sheep 365,030 442,899
Wool 24,337 35,288
Total 389,367 478,1871Sum may not equal reported total.

25
January 1 following-year goat inventory (1,000 head) Does, 1 year old and older
Angora 112 118
Milk 229 232
Meat and other 1,526 1,492
All 1,867 1,842
Bucks
Angora 8 9
Milk 23 23
Meat and other 154 153
All 185 185
All
Angora 161 172
Milk 356 360
Meat and other 2,521 2,468
All goats 3,038 3,000
Operations with goats Angora 5,500 6,000
Milk 30,000 31,000
Meat and other 130,000 128,000
All 152,000 152,000
Kid crop Angora 83 80
Milk 252 265
Meat and other 1,612 1,566
All 1,947 1,911Source: USDA–NASS. *End-of-year survey for breeding sheep (inventory).
26
TABLE A1.9: Poultry production, 2009 and 2010 2009 2010December 1 total layers (1,000 head) 341,005 342,451
Annual average number of layers (1,000 head) 337,848 339,961
Eggs per layer 268 269
Total egg production (million eggs) 90,484 91,398
Number of broilers produced (1,000 head) 8,550,200 8,625,200
Number of chickens lost (1,000 head) 99,088 106,997
Number of turkeys raised (1,000 head) 247,359 244,188
Number slaughtered (1,000 head) Chickens—young 8,519,970 8,649,536
Chickens—mature 138,633 140,943
Chickens—total 8,658,603 8,790,479
Turkeys—young 243,993 241,183
Turkeys—old 1,819 1,436
Turkeys—total 245,812 242,619
Ducks 22,767 23,627
Value of production ($1,000) Broilers 21,822,804 23,696,132
Eggs 6,166,038 6,517,823
Turkeys 3,573,392 4,371,400
Chickens (value of sales) 65,115 71,958
Total 31,627,349 34,657,313Source: USDA–NASS.
27
TABLE A1.10: Equine production, 1997, 1998, 2002, and 2007 19971 19981 20022 2007January 1 following-year inventory (1,000 head)
All equids 5,250 5,317
On farms 23,200 NA 33,750 44,313
On nonfarms 2,050 NA
Number sold 540 558
Value of sales ($1,000) 1,641,196 1,753,996 1USDA–NASS (March 2, 1999). 2The 2002 Census of Agriculture revised the 1997 number of all equids to 3,143,328 head. 3The 2002 Census of Agriculture reported 3,644,278 head of horses and ponies located on 542,223 farms. In addition, there were 105,358 mules, burros, and donkeys reported. The combination rounds to 3,750,000. 4The 2007 Census of Agriculture reported 4,028,827 head of horses and ponies located on 575,942 farms. In addition, there were 283,806 mules, burros, and donkeys reported. The combination rounds to 4,313,000.
28
TABLE A1.11: Catfish and trout production, 2009 and 2010 2009 2010Catfish Number of fish on January 1, following year (1,000)
Foodsize 269,390 176,502
Stockers 366,090 381,360
Fingerlings 429,590 568,990
Broodfish 536 497
Number of operations on January 1, following year
994 909
Sales ($1,000) Foodsize 352,013 375,078
Stockers 7,485 13,848
Fingerlings 12,895 13,325
Broodfish 174 333
Total sales 372,567 402,584
Trout Number of fish sold (1,000)
≥12 inches 40,822 38,675
6–12 inches 5,553 5,265
1–6 inches 6,995 8,780
Sales ($1,000) ≥12 inches 67,207 63,066
6–12 inches 6,580 6,339
1–6 inches 1,626 1,917
Total sales 75,413 71,322
Eggs sold Number of eggs (1,000) 358,750 383,695
Total value of sales ($1,000) 7,451 7,087
Total value of fish sold plus value of eggs sold ($1,000)
82,864 78,409
Number of operations selling trout 349 320
Number of operations selling or distributing trout, or both
855 814
Source: USDA–NASS.
29
TABLE A1.12: Honey* production, 2009 and 2010 2009 20109Honey-producing colonies (1,000) 2,498 2,684
Yield per colony (lb) 58.6 65.5
Production (1,000 lb) 146,416 175,904
Stocks on December 15 (1,000 lb) 37,516 45,307
Value of production ($1,000) 215,671 281,974Source: USDA–NASS. *For producers with five or more colonies.
30
TABLE A1.13: Production data on miscellaneous livestock, 2007
Commodity Number of
farms Inventory Number soldMilk goats 27,481 334,754 102,775
Angora goats 7,215 204,106 50,017
Meat and other goats 123,278 2,601,669 1,234,784
Mules, burros, donkeys 99,746 283,806 32,467
Mink 290 1,507,719 2,811,470
Rabbits 27,137 616,129 979,563
Ducks 31,391 3,984,982 27,321,288
Geese 18,869 177,812 161,133
Pigeons 5,369 531,489 1,294,163
Pheasants 5,313 3,773,593 10,876,586
Quail 3,983 10,611,067 39,968,045
Emus 3,621 28,443 6,540
Ostriches 714 11,188 5,697
Bison 4,499 198,234 62,890
Deer 5,654 269,537 44,210
Elk 1,917 68,251 13,049
Llamas 26,060 122,680 12,704Source: USDA–NASS 2007 Census of Agriculture.
31
TABLE A1.14: Slaughter statistics, 2010
Commodity
Federally inspected
plants (no.)
Slaughter in federally inspected
plants (1,000 head)*
Slaughter in State-inspected or
custom-exempt plants (1,000 head)
Cattle 632 33,702.0 547.0
Calves 248 864.2 14.4
Hogs 611 109,314.7 945.1
Sheep and lambs 506 2,261.1 196.4
Goats 421 612.1 166.9
Bison 128 52.9 11.1Source: USDA–NASS Livestock Slaughter 2010 Summary, April 2011. *Includes data for the calendar year.