observer -...
TRANSCRIPT

ObserverCopyright © 2002-2012 Ericsson AB. All Rights Reserved.
Observer 1.1April 1 2012

Copyright © 2002-2012 Ericsson AB. All Rights Reserved.The contents of this file are subject to the Erlang Public License, Version 1.1, (the "License"); you may not usethis file except in compliance with the License. You should have received a copy of the Erlang Public Licensealong with this software. If not, it can be retrieved online at http://www.erlang.org/. Software distributed under theLicense is distributed on an "AS IS" basis, WITHOUT WARRANTY OF ANY KIND, either express or implied. Seethe License for the specific language governing rights and limitations under the License. Ericsson AB. All RightsReserved..
April 1 2012

Ericsson AB. All Rights Reserved.: Observer | 1
1.1 Observer
2 | Ericsson AB. All Rights Reserved.: Observer
1 Observer User's Guide
The Observer application contains tools for tracing and investigation of distributed systems.
1.1 Observer
1.1.1 IntroductionObserver, is a graphical tool for observing the characteristics of erlang systems. Observer displays system information,application supervisor trees, process information, ets or mnesia tables and contains a frontend for erlang tracing.
1.1.2 GeneralNormally observer should be run from a standalone node to minimize the impact of the system being observed.Example:
> erl -sname observer -hidden -setcookie MyCookie -run observer
Choose which node to observe via Nodes menu. The View/Refresh Interval controls how frequent the viewshould be updated. The refresh interval is set per viewer so you can have different settings for each viewer. To minimizethe system impact only the active viewer is updated and the other views will be updated when activated.
Note:Only R15B nodes can be observed.
In general the mouse buttons behaves as expected, use left click to select objects, right click to pop up a menu withmost used choices and double click to bring up information about the selected object. In most viewers with severalcolumns you can change sort order by left clicking on column header.
1.1.3 ApplicationsThe Applications view lists application information. Select an application in the left list to display its supervisortree.
Trace process will add the selected process identifier to Trace Overview view and the node the processresides on will be added as well.
Trace named process will add the registered name of the process. This can be useful when tracing on severalnodes, then processes with that name will be traced on all traced nodes.
Trace process tree and Trace named process tree will add the selected process and all processesbelow, right of, it to the Trace Overview view.
1.1 Observer
Ericsson AB. All Rights Reserved.: Observer | 3
1.1.4 ProcessesThe Processes view lists process information. For each process the following information is presented:
PidThe process identifier.
RedsThis is the number of reductions that has been executed on the process
MemoryThis is the size of the process in bytes, obtained by a call to process_info(Pid,memory).
MsgQThis is the length of the message queue for the process.
Note:Reds can be presented as accumulated values or as values since last update.
Trace Processes will add the selected process identifiers to the Trace Overview view and the node theprocesses reside on will be added as well. Trace Named Processes will add the registered name of processes.This can be useful when tracing is done on several nodes, then processes with that name will be traced on all tracednodes.
1.1.5 Table ViewerThe Table Viewer view lists tables. By default ets tables are visible and unreadable, private ets, tables and tablescreated by the OTP applications are not visible. Use View menu to view "system" ets tables, unreadable ets tablesor mnesia tables.
Double click to view the content of the table. Select table and activate View/Table Information menu to viewtable information.
In the table viewer you can regexp search for objects, edit and delete objects.
1.1.6 Trace OverviewThe Trace Overview view handles tracing. Tracing is done by selecting which processes to be traced and how totrace them. You can trace messages, function calls and events, where events are process related events such as spawn,exit and several others.
When you want to trace function calls, you also need to setup trace patterns. Trace patterns selects the functioncalls that will be traced. The number of traced function calls can be further reduced with match specifications.Match specifications can also be used to trigger additional information in the trace messages.
Note:Trace patterns only applies to the traced processes.
Processes are added from the Applications or Processes views. A special new identifier, meaning all processesspawned after trace start, can be added with the Add 'new' Process button.
When adding processes, a window with trace options will pop up. The chosen options will be set for the selectedprocesses. Process options can be changed by right clicking on a process.
1.2 Trace Tool Builder
4 | Ericsson AB. All Rights Reserved.: Observer
Processes added by process identifiers will add the nodes these processes resides on in the node list. Additional nodescan be added by the Add Nodes button.
If function calls are traced, trace patterns must be added by Add Trace Pattern button. Select a module,function(s) and a match specification. If no functions are selected, all functions in the module will be traced. A fewbasic match specifications are provided in the tool, and you can provide your own match specifications. The syntaxof match specifications are described in the ERTS User's Guide. To simplify the writing of a match specification theycan also be written as fun/1 see ms_transform manual page for further information.
Use the Start trace button to start the trace. By default trace output is written to a new window, tracing is stoppedwhen the window is closed, or with Stop Trace button. Trace output can be changed via Options/Outputmenu. The trace settings, including match specifications, can be saved to, or loaded from, a file.
More information about tracing can be found in dbg and in the chapter "Match specifications in Erlang" in ERTS User'sGuide and the ms_transform manual page.
1.2 Trace Tool Builder
1.2.1 IntroductionThe Trace Tool Builder is a base for building trace tools for single node or distributed erlang systems. It requires theruntime_tools application to be available on the traced node.
The main features of the Trace Tool Builder are:
• Start tracing to file ports on several nodes with one function call.
• Write additional information to a trace information file, which is read during formatting.
• Restoring of previous configuration by maintaining a history buffer and handling configuration files.
• Some simple support for sequential tracing.
• Formatting of binary trace logs and merging of logs from multiple nodes.
The intention of the Trace Tool Builder is to serve as a base for tailor made trace tools, but you may use it directly fromthe erlang shell (it may mimic dbg behaviour while still providing useful additions like match specification shortcuts).The application only allows the use of file port tracer, so if you would like to use other types of trace clients you willbe better off using dbg directly instead.
1.2.2 Getting StartedThe ttb module is the interface to all functions in the Trace Tool Builder. To get started the least you need to do isto start a tracer with ttb:tracer/0/1/2, and set the required trace flags on the processes you want to trace withttb:p/2. Then, when the tracing is completed, you must stop the tracer with ttb:stop/0/1 and format the tracelog with ttb:format/1/2 (as long as there is anything to format, of course).
ttb:tracer/0/1/2 opens a trace port on each node that shall be traced. By default, trace messages are writtento binary files on remote nodes(the binary trace log).
ttb:p/2 specifies which processes shall be traced. Trace flags given in this call specify what to trace on each process.You can call this function several times if you like different trace flags to be set on different processes.
If you want to trace function calls (i.e. if you have the call trace flag set on any of your processes), you must alsoset trace patterns on the required function(s) with ttb:tp or ttb:tpl. A function is only traced if it has a tracepattern. The trace pattern specifies how to trace the function by using match specifications. Match specifications aredescribed in the User's Guide for the erlang runtime system erts.
ttb:stop/0/1 stops tracing on all nodes, deletes all trace patterns and flushes the trace port buffer.
ttb:format/1/2 translates the binary trace logs into something readable. By default ttb presents each tracemessage as a line of text, but you can also write your own handler to make more complex interpretations of the trace
1.2 Trace Tool Builder
Ericsson AB. All Rights Reserved.: Observer | 5
information. A trace log can even be presented graphically via the Event Tracer application. Note that if you give theformat option to ttb:stop/1 the formatting is automatically done when stopping ttb.
Example: Tracing the local node from the erlang shell
This small module is used in the example:
-module(m).-export([f/0]).f() -> receive From when is_pid(From) -> Now = erlang:now(), From ! {self(),Now} end.
The following example shows the basic use of ttb from the erlang shell. Default options are used both for startingthe tracer and for formatting (the custom fetch dir is however provided). This gives a trace log named Node-ttbin the newly-created directory, where Node is the name of the node. The default handler prints the formatted tracemessages in the shell.
(tiger@durin)47> %% First I spawn a process running my test function(tiger@durin)47> Pid = spawn(m,f,[]).<0.125.0>(tiger@durin)48> (tiger@durin)48> %% Then I start a tracer...(tiger@durin)48> ttb:tracer().{ok,[tiger@durin]}(tiger@durin)49> (tiger@durin)49> %% and activate the new process for tracing(tiger@durin)49> %% function calls and sent messages.(tiger@durin)49> ttb:p(Pid,[call,send]).{ok,[{<0.125.0>,[{matched,tiger@durin,1}]}]}(tiger@durin)50> (tiger@durin)50> %% Here I set a trace pattern on erlang:now/0(tiger@durin)50> %% The trace pattern is a simple match spec(tiger@durin)50> %% indicating that the return value should be(tiger@durin)50> %% traced. Refer to the reference_manual for(tiger@durin)50> %% the full list of match spec shortcuts(tiger@durin)50> %% available.(tiger@durin)51> ttb:tp(erlang,now,return).{ok,[{matched,tiger@durin,1},{saved,1}]}(tiger@durin)52> (tiger@durin)52> %% I run my test (i.e. send a message to(tiger@durin)52> %% my new process)(tiger@durin)52> Pid ! self().<0.72.0>(tiger@durin)53> (tiger@durin)53> %% And then I have to stop ttb in order to flush(tiger@durin)53> %% the trace port buffer(tiger@durin)53> ttb:stop([return, {fetch_dir, "fetch"}]).{stopped, "fetch"}(tiger@durin)54> (tiger@durin)54> %% Finally I format my trace log(tiger@durin)54> ttb:format("fetch").({<0.125.0>,{m,f,0},tiger@durin}) call erlang:now()({<0.125.0>,{m,f,0},tiger@durin}) returned from erlang:now/0 ->{1031,133451,667611}({<0.125.0>,{m,f,0},tiger@durin}) <0.72.0> ! {<0.125.0>,{1031,133451,667611}}
1.2 Trace Tool Builder
6 | Ericsson AB. All Rights Reserved.: Observer
ok
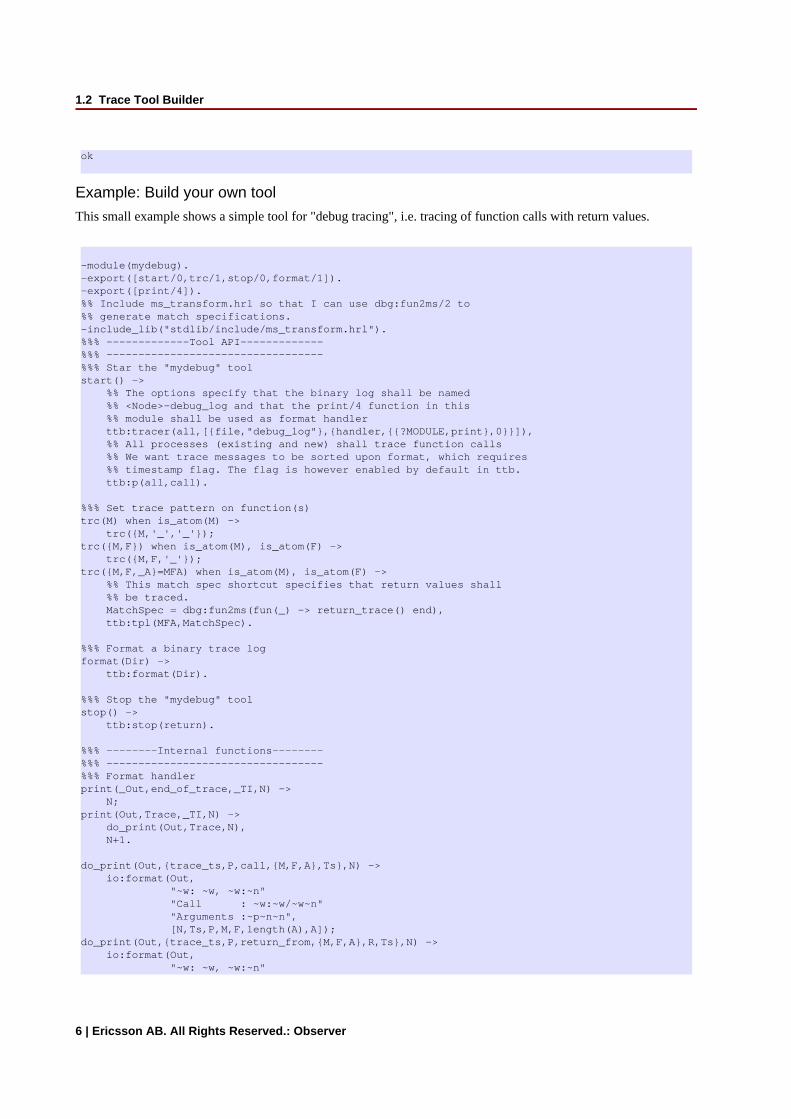
Example: Build your own tool
This small example shows a simple tool for "debug tracing", i.e. tracing of function calls with return values.
-module(mydebug).-export([start/0,trc/1,stop/0,format/1]).-export([print/4]).%% Include ms_transform.hrl so that I can use dbg:fun2ms/2 to%% generate match specifications.-include_lib("stdlib/include/ms_transform.hrl").%%% -------------Tool API-------------%%% ----------------------------------%%% Star the "mydebug" toolstart() -> %% The options specify that the binary log shall be named %% <Node>-debug_log and that the print/4 function in this %% module shall be used as format handler ttb:tracer(all,[{file,"debug_log"},{handler,{{?MODULE,print},0}}]), %% All processes (existing and new) shall trace function calls %% We want trace messages to be sorted upon format, which requires %% timestamp flag. The flag is however enabled by default in ttb. ttb:p(all,call).
%%% Set trace pattern on function(s)trc(M) when is_atom(M) -> trc({M,'_','_'});trc({M,F}) when is_atom(M), is_atom(F) -> trc({M,F,'_'});trc({M,F,_A}=MFA) when is_atom(M), is_atom(F) -> %% This match spec shortcut specifies that return values shall %% be traced. MatchSpec = dbg:fun2ms(fun(_) -> return_trace() end), ttb:tpl(MFA,MatchSpec).
%%% Format a binary trace logformat(Dir) -> ttb:format(Dir).
%%% Stop the "mydebug" toolstop() -> ttb:stop(return).
%%% --------Internal functions--------%%% ----------------------------------%%% Format handlerprint(_Out,end_of_trace,_TI,N) -> N;print(Out,Trace,_TI,N) -> do_print(Out,Trace,N), N+1.
do_print(Out,{trace_ts,P,call,{M,F,A},Ts},N) -> io:format(Out, "~w: ~w, ~w:~n" "Call : ~w:~w/~w~n" "Arguments :~p~n~n", [N,Ts,P,M,F,length(A),A]);do_print(Out,{trace_ts,P,return_from,{M,F,A},R,Ts},N) -> io:format(Out, "~w: ~w, ~w:~n"
1.2 Trace Tool Builder
Ericsson AB. All Rights Reserved.: Observer | 7
"Return from : ~w:~w/~w~n" "Return value :~p~n~n", [N,Ts,P,M,F,A,R]).
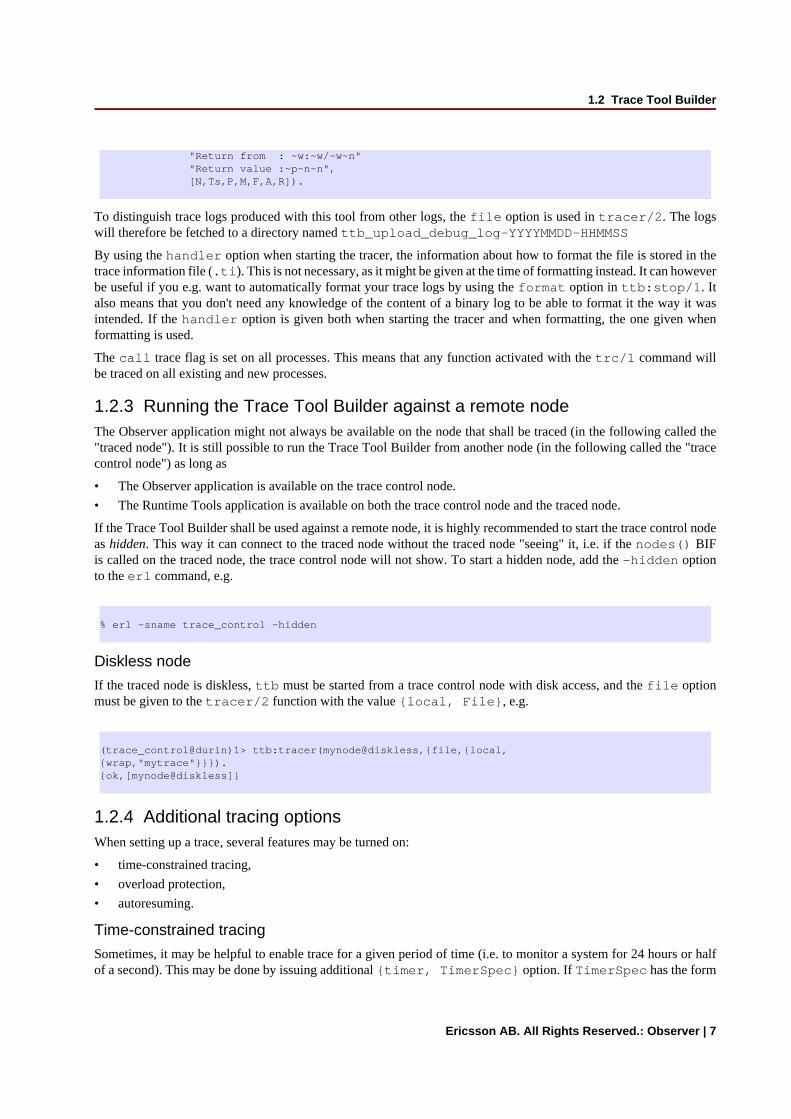
To distinguish trace logs produced with this tool from other logs, the file option is used in tracer/2. The logswill therefore be fetched to a directory named ttb_upload_debug_log-YYYYMMDD-HHMMSS
By using the handler option when starting the tracer, the information about how to format the file is stored in thetrace information file (.ti). This is not necessary, as it might be given at the time of formatting instead. It can howeverbe useful if you e.g. want to automatically format your trace logs by using the format option in ttb:stop/1. Italso means that you don't need any knowledge of the content of a binary log to be able to format it the way it wasintended. If the handler option is given both when starting the tracer and when formatting, the one given whenformatting is used.
The call trace flag is set on all processes. This means that any function activated with the trc/1 command willbe traced on all existing and new processes.
1.2.3 Running the Trace Tool Builder against a remote nodeThe Observer application might not always be available on the node that shall be traced (in the following called the"traced node"). It is still possible to run the Trace Tool Builder from another node (in the following called the "tracecontrol node") as long as
• The Observer application is available on the trace control node.
• The Runtime Tools application is available on both the trace control node and the traced node.
If the Trace Tool Builder shall be used against a remote node, it is highly recommended to start the trace control nodeas hidden. This way it can connect to the traced node without the traced node "seeing" it, i.e. if the nodes() BIFis called on the traced node, the trace control node will not show. To start a hidden node, add the -hidden optionto the erl command, e.g.
% erl -sname trace_control -hidden
Diskless node
If the traced node is diskless, ttb must be started from a trace control node with disk access, and the file optionmust be given to the tracer/2 function with the value {local, File}, e.g.
(trace_control@durin)1> ttb:tracer(mynode@diskless,{file,{local,{wrap,"mytrace"}}}).{ok,[mynode@diskless]}
1.2.4 Additional tracing optionsWhen setting up a trace, several features may be turned on:
• time-constrained tracing,
• overload protection,
• autoresuming.
Time-constrained tracing
Sometimes, it may be helpful to enable trace for a given period of time (i.e. to monitor a system for 24 hours or halfof a second). This may be done by issuing additional {timer, TimerSpec} option. If TimerSpec has the form
1.2 Trace Tool Builder
8 | Ericsson AB. All Rights Reserved.: Observer
of MSec, the trace is stopped after MSec milliseconds using ttb:stop/0. If any additional options are provided(TimerSpec = {MSec, Opts}), ttb:stop/1 is called instead with Opts as the arguments. The timer is startedwith ttb:p/2, so any trace patterns should be set up before. ttb:start_trace/4 always sets up all patternbefore invoking ttb:p/2. Note that due to network and processing delays the the period of tracing is approximate.The example below shows how to set up a trace which will be automatically stopped and formatted after 5 seconds
(tiger@durin)1>ttb:start_trace([node()], [{erlang, now,[]}], {all, call}, [{timer, {5000, format}}]).
When tracing live systems, special care needs to be always taken not to overload a node with too heavy tracing. ttbprovides the overload option to help to address the problem.
{overload, MSec, Module, Function} instructs the ttb backend (called observer_backend, partof the runtime_tools application) to perform overload check every MSec milliseconds. If the check (namelyModule:Function(check)) returns true, tracing is disabled on the selected node.
Overload protection activated on one node does not affect other nodes, where the tracing continues as normal.ttb:stop/0/1 fetches data from all clients, including everything that has been collected before overload protectionwas activated. Note that changing trace details (with ttb:p and ttb:tp/tpl...) once overload protection getsactivated in one of the traced nodes is not permitted in order not to allow trace setup to be inconsistent between nodes.
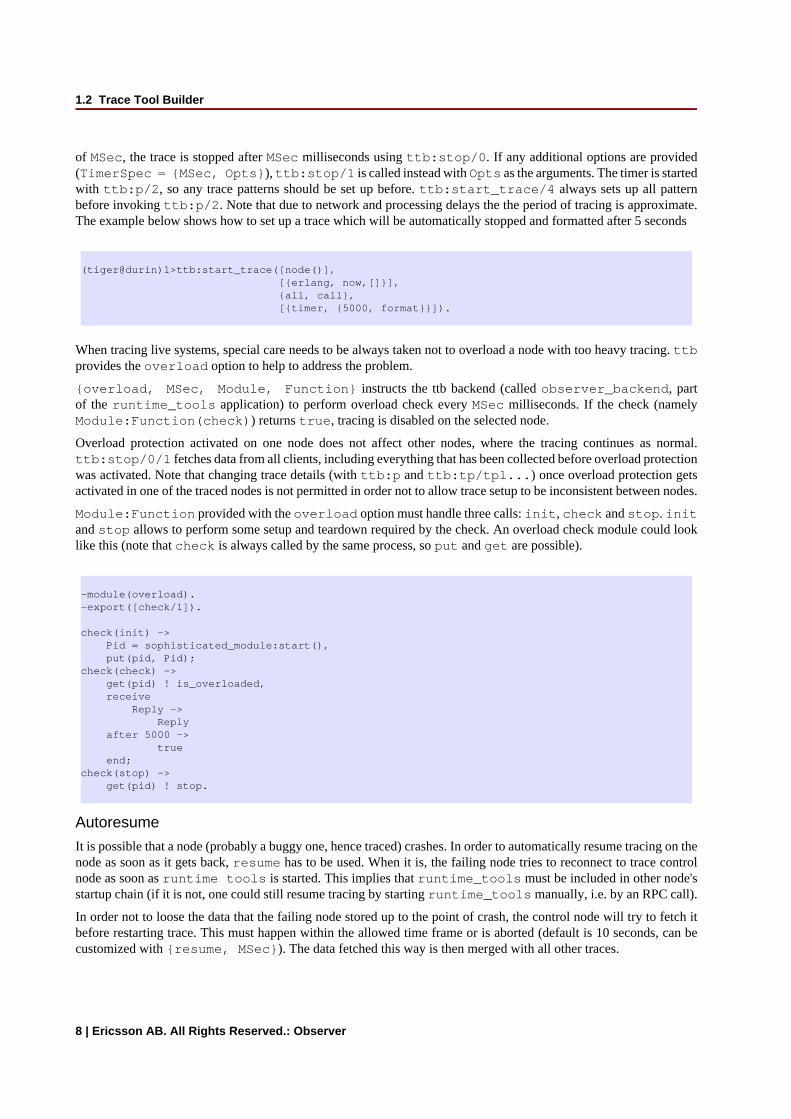
Module:Function provided with the overload option must handle three calls: init, check and stop. initand stop allows to perform some setup and teardown required by the check. An overload check module could looklike this (note that check is always called by the same process, so put and get are possible).
-module(overload).-export([check/1]).
check(init) -> Pid = sophisticated_module:start(), put(pid, Pid);check(check) -> get(pid) ! is_overloaded, receive Reply -> Reply after 5000 -> true end;check(stop) -> get(pid) ! stop.
Autoresume
It is possible that a node (probably a buggy one, hence traced) crashes. In order to automatically resume tracing on thenode as soon as it gets back, resume has to be used. When it is, the failing node tries to reconnect to trace controlnode as soon as runtime tools is started. This implies that runtime_tools must be included in other node'sstartup chain (if it is not, one could still resume tracing by starting runtime_tools manually, i.e. by an RPC call).
In order not to loose the data that the failing node stored up to the point of crash, the control node will try to fetch itbefore restarting trace. This must happen within the allowed time frame or is aborted (default is 10 seconds, can becustomized with {resume, MSec}). The data fetched this way is then merged with all other traces.
1.2 Trace Tool Builder
Ericsson AB. All Rights Reserved.: Observer | 9
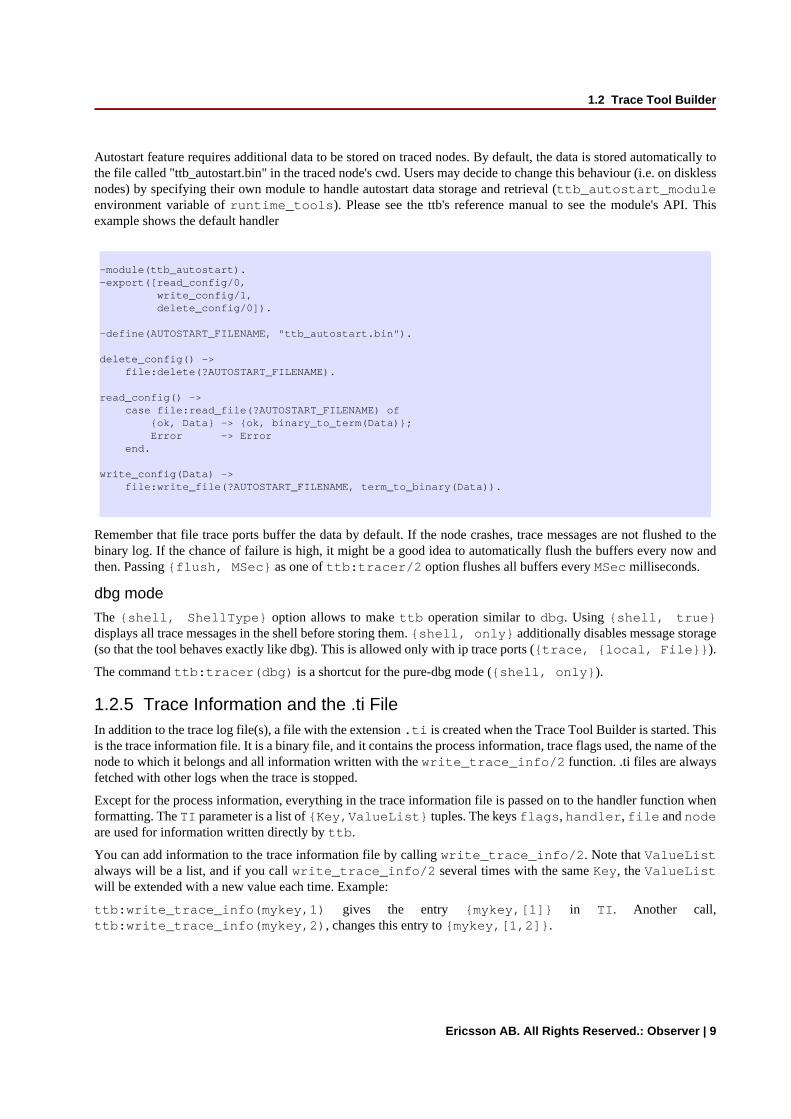
Autostart feature requires additional data to be stored on traced nodes. By default, the data is stored automatically tothe file called "ttb_autostart.bin" in the traced node's cwd. Users may decide to change this behaviour (i.e. on disklessnodes) by specifying their own module to handle autostart data storage and retrieval (ttb_autostart_moduleenvironment variable of runtime_tools). Please see the ttb's reference manual to see the module's API. Thisexample shows the default handler
-module(ttb_autostart).-export([read_config/0, write_config/1, delete_config/0]).
-define(AUTOSTART_FILENAME, "ttb_autostart.bin").
delete_config() -> file:delete(?AUTOSTART_FILENAME).
read_config() -> case file:read_file(?AUTOSTART_FILENAME) of {ok, Data} -> {ok, binary_to_term(Data)}; Error -> Error end.
write_config(Data) -> file:write_file(?AUTOSTART_FILENAME, term_to_binary(Data)).
Remember that file trace ports buffer the data by default. If the node crashes, trace messages are not flushed to thebinary log. If the chance of failure is high, it might be a good idea to automatically flush the buffers every now andthen. Passing {flush, MSec} as one of ttb:tracer/2 option flushes all buffers every MSec milliseconds.
dbg mode
The {shell, ShellType} option allows to make ttb operation similar to dbg. Using {shell, true}displays all trace messages in the shell before storing them. {shell, only} additionally disables message storage(so that the tool behaves exactly like dbg). This is allowed only with ip trace ports ({trace, {local, File}}).
The command ttb:tracer(dbg) is a shortcut for the pure-dbg mode ({shell, only}).
1.2.5 Trace Information and the .ti FileIn addition to the trace log file(s), a file with the extension .ti is created when the Trace Tool Builder is started. Thisis the trace information file. It is a binary file, and it contains the process information, trace flags used, the name of thenode to which it belongs and all information written with the write_trace_info/2 function. .ti files are alwaysfetched with other logs when the trace is stopped.
Except for the process information, everything in the trace information file is passed on to the handler function whenformatting. The TI parameter is a list of {Key,ValueList} tuples. The keys flags, handler, file and nodeare used for information written directly by ttb.
You can add information to the trace information file by calling write_trace_info/2. Note that ValueListalways will be a list, and if you call write_trace_info/2 several times with the same Key, the ValueListwill be extended with a new value each time. Example:
ttb:write_trace_info(mykey,1) gives the entry {mykey,[1]} in TI. Another call,ttb:write_trace_info(mykey,2), changes this entry to {mykey,[1,2]}.
1.2 Trace Tool Builder
10 | Ericsson AB. All Rights Reserved.: Observer
1.2.6 Wrap LogsIf you want to limit the size of the trace logs, you can use wrap logs. This works almost like a circular buffer. Youcan specify the maximum number of binary logs and the maximum size of each log. ttb will create a new binarylog each time a log reaches the maximum size. When the the maximum number of logs are reached, the oldest logis deleted before a new one is created.
Note that the overall size of data generated by ttb may be greater than the wrap specification would suggest - if a tracednode restarts and autoresume is enabled, old wrap log is always stored and a new one is created.
Wrap logs can be formatted one by one or all at once. See Formatting.
1.2.7 FormattingFormatting can be done automatically when stopping ttb (see Automatically collect and format logs from all nodes),or explicitly by calling the ttb:format/1/2 function.
Formatting means to read a binary log and present it in a readable format. You can use the default format handler inttb to present each trace message as a line of text, or write your own handler to make more complex interpretationsof the trace information. You can even use the Event Tracer et to present the trace log graphically (see Presentingtrace logs with Event Tracer).
The first argument to ttb:format/1/2 specifies which binary log(s) to format. This is usually the name of adirectory that ttb created during log fetch. Unless there is the disable_sort option provided, the logs from differentfiles are always sorted according to timestamp in traces.
The second argument to ttb:format/2 is a list of options. The out option specifies the destination where theformatted text shall be written. Default destination is standard_io, but a filename can also be given. The handleroption specifies the format handler to use. If this option is not given, the handler option given when starting thetracer is used. If the handler option was not given when starting the tracer either, a default handler is used, whichprints each trace message as a line of text. The disable_sort option indicates that there logs should not be mergedaccording to timestamp, but processed one file after another (this might be a bit faster).
A format handler is a fun taking four arguments. This fun will be called for each trace message in the binary log(s).A simple example which only prints each trace message could be like this:
fun(Fd, Trace, _TraceInfo, State) -> io:format(Fd, "Trace: ~p~n", [Trace]), Stateend.
Fd is the file descriptor for the destination file, or the atom standard_io. _TraceInfo contains information fromthe trace information file (see Trace Information and the .ti File). State is a state variable for the format handler fun.The initial value of the State variable is given with the handler option, e.g.
ttb:format("tiger@durin-ttb", [{handler, {{Mod,Fun}, initial_state}}]) ^^^^^^^^^^^^^
Another format handler could be used to calculate time spent by the garbage collector:
fun(_Fd,{trace_ts,P,gc_start,_Info,StartTs},_TraceInfo,State) -> [{P,StartTs}|State]; (Fd,{trace_ts,P,gc_end,_Info,EndTs},_TraceInfo,State) -> {value,{P,StartTs}} = lists:keysearch(P,1,State),
1.2 Trace Tool Builder
Ericsson AB. All Rights Reserved.: Observer | 11
Time = diff(StartTs,EndTs), io:format("GC in process ~w: ~w milliseconds~n", [P,Time]), State -- [{P,StartTs}]end
A more refined version of this format handler is the function handle_gc/4 in the module multitrace.erlwhich can be found in the src directory of the Observer application.
The actual trace message is passed as the second argument (Trace). The possible values of Trace are:
• all trace messages described in erlang:trace/3 documentation,
• {drop, N} if ip tracer is used (see dbg:trace_port/2),
• end_of_trace received once when all trace messages have been processed.
By giving the format handler ttb:get_et_handler(), you can have the trace log presented graphically withet_viewer in the Event Tracer application (see Presenting trace logs with Event Tracer).
You may always decide not to format the whole trace data contained in the fetch directory, but analyze single filesinstead. In order to do so, a single file (or list of files) have to be passed as the first argument to format/1/2.
Wrap logs can be formatted one by one or all in one go. To format one of the wrap logs in a set, give the exact nameof the file. To format the whole set of wrap logs, give the name with '*' instead of the wrap count. An example:
Start tracing:
(tiger@durin)1> ttb:tracer(node(),{file,{wrap,"trace"}}).{ok,[tiger@durin]}(tiger@durin)2> ttb:p(...)...
This will give a set of binary logs, like:
[email protected]@[email protected]...
Format the whole set of logs:
1> ttb:format("tiger@durin-trace.*.wrp").....ok2>
Format only the first log:
1> ttb:format("[email protected]").....ok2>
To merge all wrap logs from two nodes:
1.2 Trace Tool Builder
12 | Ericsson AB. All Rights Reserved.: Observer
1> ttb:format(["tiger@durin-trace.*.wrp","lion@durin-trace.*.wrp"]).....ok2>
Presenting trace logs with Event Tracer
For detailed information about the Event Tracer, please turn to the User's Guide and Reference Manuals for the etapplication.
By giving the format handler ttb:get_et_handler(), you can have the trace log presented graphically withet_viewer in the Event Tracer application. ttb provides a few different filters which can be selected from theFilter menu in the et_viewer window. The filters are names according to the type of actors they present (i.e. whateach vertical line in the sequence diagram represent). Interaction between actors is shown as red arrows between twovertical lines, and activities within an actor are shown as blue text to the right of the actors line.
The processes filter is the only filter which will show all trace messages from a trace log. Each vertical line inthe sequence diagram represents a process. Erlang messages, spawn and link/unlink are typical interactions betweenprocesses. Function calls, scheduling and garbage collection are typical activities within a process. processes isthe default filter.
The rest of the filters will only show function calls and function returns. All other trace message are discarded. To getthe most out of these filters, et_viewer needs to known the caller of each function and the time of return. This canbe obtained by using both the call and return_to flags when tracing. Note that the return_to flag only workswith local call trace, i.e. when trace patterns are set with ttb:tpl.
The same result can be obtained by using the call flag only and setting a match specification like this on local orglobal function calls:
1> dbg:fun2ms(fun(_) -> return_trace(),message(caller()) end).[{'_',[],[{return_trace},{message,{caller}}]}]
This should however be done with care, since the {return_trace} function in the match specification will destroytail recursiveness.
The modules filter shows each module as a vertical line in the sequence diagram. External function calls/returns areshown as interactions between modules and internal function calls/returns are shown as activities within a module.
The functions filter shows each function as a vertical line in the sequence diagram. A function calling itself isshown as an activity within a function, and all other function calls are shown as interactions between functions.
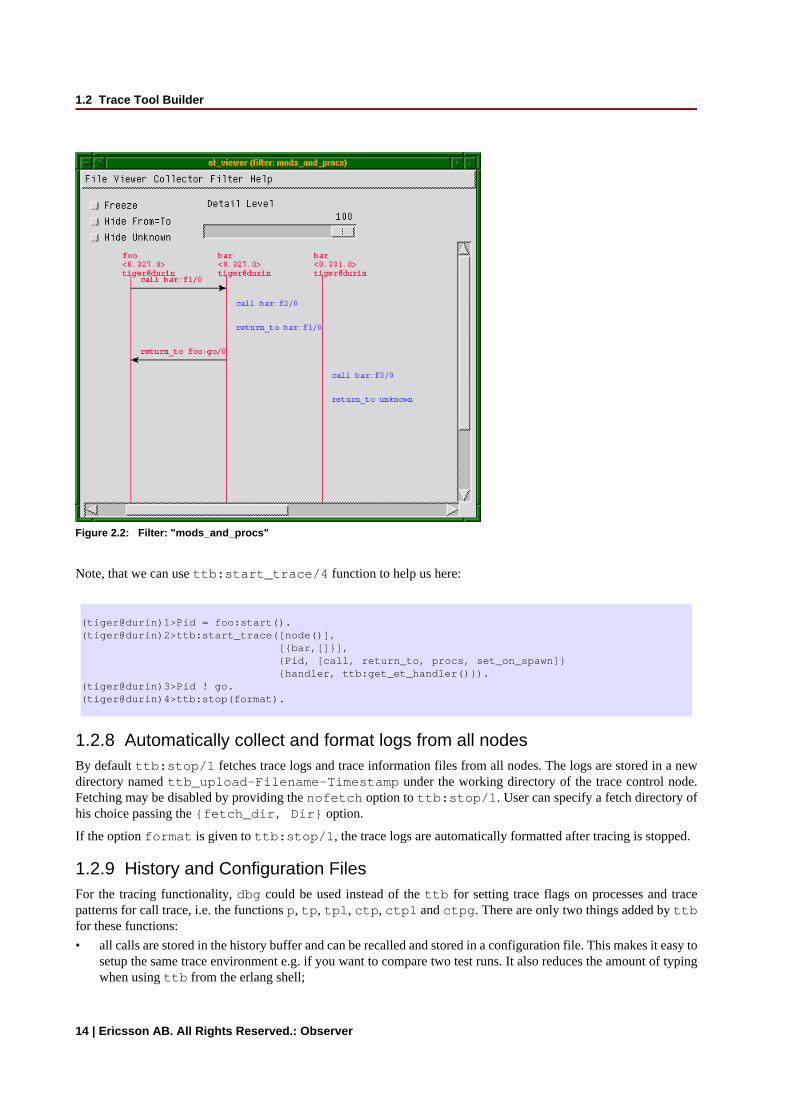
The mods_and_procs and funcs_and_procs filters are equivalent to the modules and functions filtersrespectively, except that each module or function can have several vertical lines, one for each process it resides on.
In the next example, modules foo and bar are used:
-module(foo).-export([start/0,go/0]).
start() -> spawn(?MODULE, go, []).
go() -> receive stop -> ok; go ->
1.2 Trace Tool Builder
Ericsson AB. All Rights Reserved.: Observer | 13
bar:f1(), go() end.
-module(bar).-export([f1/0,f3/0]).f1() -> f2(), ok.f2() -> spawn(?MODULE,f3,[]).f3() -> ok.
Now let's set up the trace.
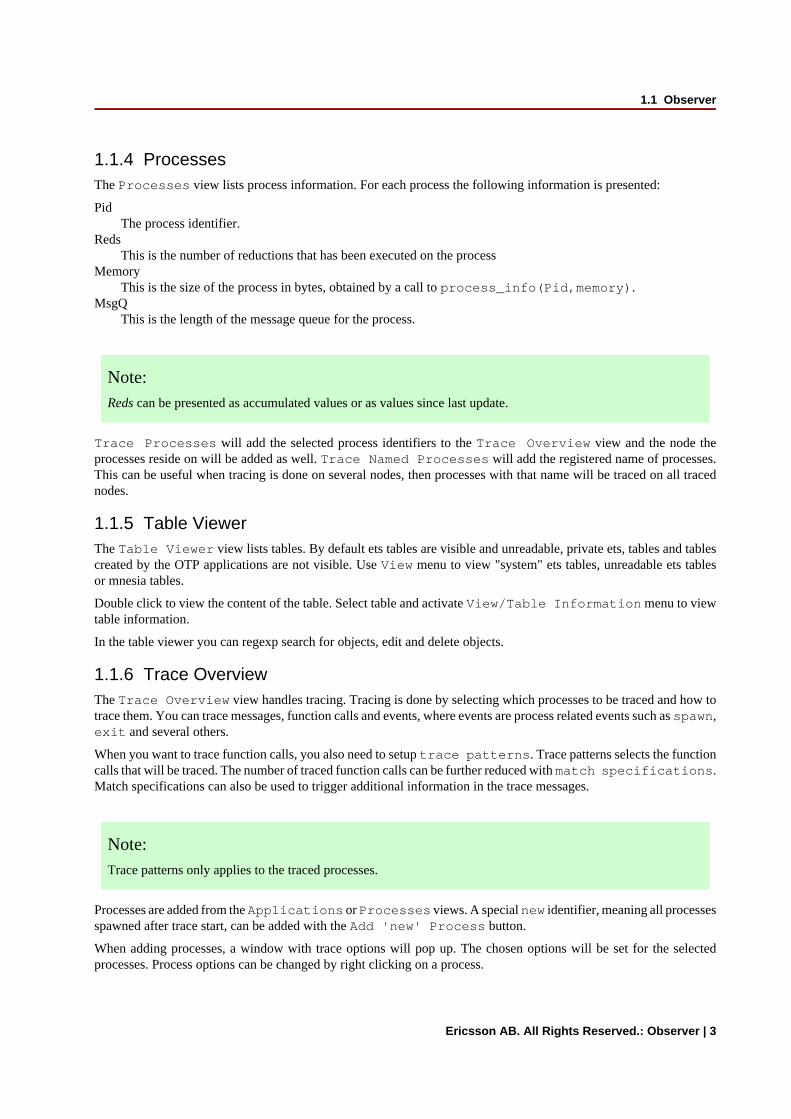
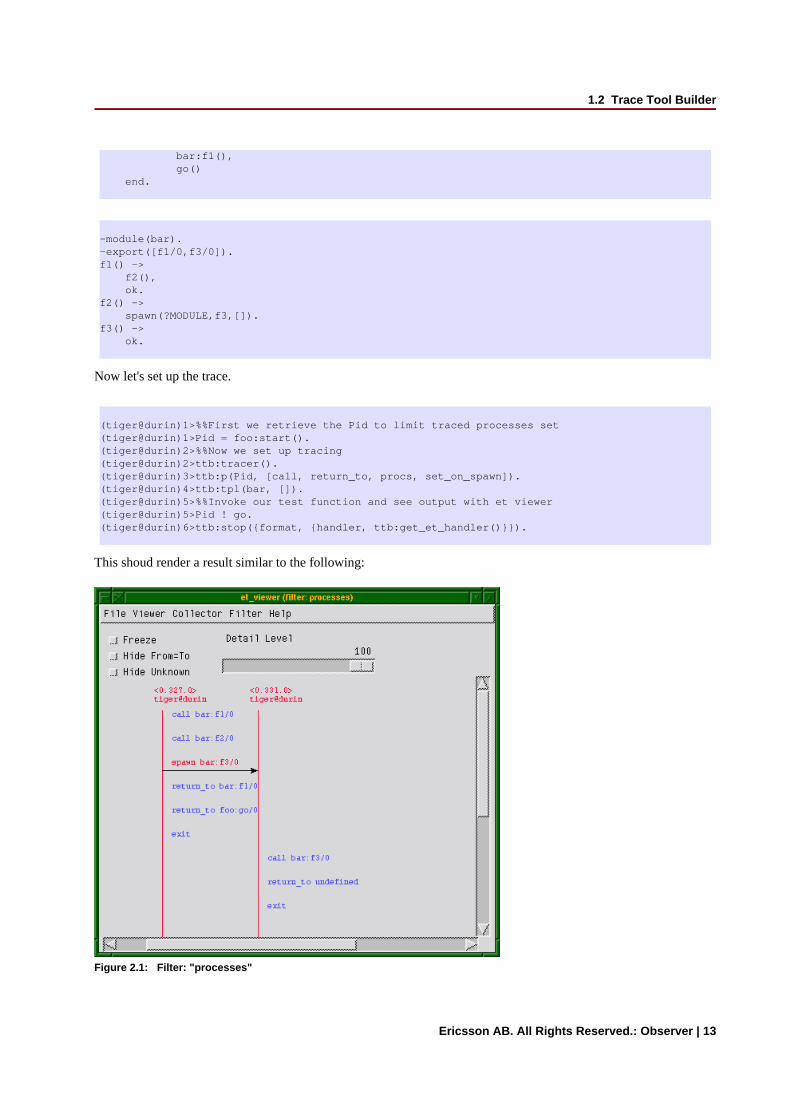
(tiger@durin)1>%%First we retrieve the Pid to limit traced processes set(tiger@durin)1>Pid = foo:start().(tiger@durin)2>%%Now we set up tracing(tiger@durin)2>ttb:tracer().(tiger@durin)3>ttb:p(Pid, [call, return_to, procs, set_on_spawn]).(tiger@durin)4>ttb:tpl(bar, []).(tiger@durin)5>%%Invoke our test function and see output with et viewer(tiger@durin)5>Pid ! go.(tiger@durin)6>ttb:stop({format, {handler, ttb:get_et_handler()}}).
This shoud render a result similar to the following:
Figure 2.1: Filter: "processes"
1.2 Trace Tool Builder
14 | Ericsson AB. All Rights Reserved.: Observer
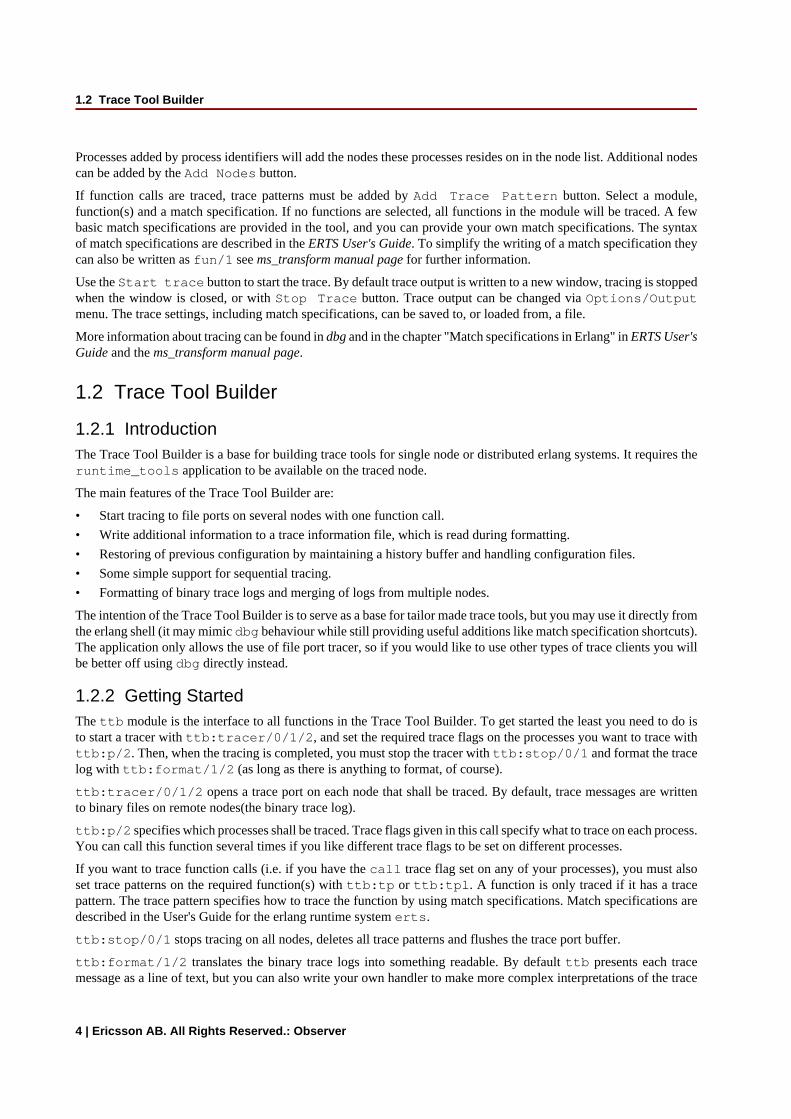
Figure 2.2: Filter: "mods_and_procs"
Note, that we can use ttb:start_trace/4 function to help us here:
(tiger@durin)1>Pid = foo:start().(tiger@durin)2>ttb:start_trace([node()], [{bar,[]}], {Pid, [call, return_to, procs, set_on_spawn]} {handler, ttb:get_et_handler()}).(tiger@durin)3>Pid ! go.(tiger@durin)4>ttb:stop(format).
1.2.8 Automatically collect and format logs from all nodesBy default ttb:stop/1 fetches trace logs and trace information files from all nodes. The logs are stored in a newdirectory named ttb_upload-Filename-Timestamp under the working directory of the trace control node.Fetching may be disabled by providing the nofetch option to ttb:stop/1. User can specify a fetch directory ofhis choice passing the {fetch_dir, Dir} option.
If the option format is given to ttb:stop/1, the trace logs are automatically formatted after tracing is stopped.
1.2.9 History and Configuration FilesFor the tracing functionality, dbg could be used instead of the ttb for setting trace flags on processes and tracepatterns for call trace, i.e. the functions p, tp, tpl, ctp, ctpl and ctpg. There are only two things added by ttbfor these functions:
• all calls are stored in the history buffer and can be recalled and stored in a configuration file. This makes it easy tosetup the same trace environment e.g. if you want to compare two test runs. It also reduces the amount of typingwhen using ttb from the erlang shell;
1.2 Trace Tool Builder
Ericsson AB. All Rights Reserved.: Observer | 15
• shortcuts are provided for the most common match specifications (in order not to force the user to usedbg:fun2ms continually
Use list_history/0 to see the content of the history buffer, and run_history/1 to re-execute one of theentries.
The main purpose of the history buffer is the possibility to create configuration files. Any function stored in the historybuffer can be written to a configuration file and used for creating a specific configuration at any time with one singlefunction call.
A configuration file is created or extended with write_config/2/3. Configuration files are binary files and cantherefore only be read and written with functions provided by ttb.
You can write the complete content of the history buffer to a config file by callingttb:write_config(ConfigFile,all). And you can write selected entries from the history by callingttb:write_config(ConfigFile,NumList), where NumList is a list of integers pointing out the historyentries to write. Moreover, the history buffer is always dumped to ttb_last_config when ttb:stop/0/1 iscalled.
User defined entries can also be written to a config file by calling thefunction ttb:write_config(ConfigFile,ConfigList) where ConfigList is a list of{Module,Function,Args}.
Any existing file ConfigFile is deleted and a new file is created when write_config/2 is called.The option append can be used if you wish to add something at the end of an existing config file, e.g.ttb:write_config(ConfigFile,What,[append]).
Example: History and configuration files
See the content of the history buffer
(tiger@durin)191> ttb:tracer(). {ok,[tiger@durin]}(tiger@durin)192> ttb:p(self(),[garbage_collection,call]). {ok,{[<0.1244.0>],[garbage_collection,call]}}(tiger@durin)193> ttb:tp(ets,new,2,[]). {ok,[{matched,1}]}(tiger@durin)194> ttb:list_history().[{1,{ttb,tracer,[tiger@durin,[]]}}, {2,{ttb,p,[<0.1244.0>,[garbage_collection,call]]}}, {3,{ttb,tp,[ets,new,2,[]]}}]
Execute an entry from the history buffer:
(tiger@durin)195> ttb:ctp(ets,new,2).{ok,[{matched,1}]}(tiger@durin)196> ttb:list_history().[{1,{ttb,tracer,[tiger@durin,[]]}}, {2,{ttb,p,[<0.1244.0>,[garbage_collection,call]]}}, {3,{ttb,tp,[ets,new,2,[]]}}, {4,{ttb,ctp,[ets,new,2]}}](tiger@durin)197> ttb:run_history(3).ttb:tp(ets,new,2,[]) ->{ok,[{matched,1}]}
Write the content of the history buffer to a configuration file:
1.2 Trace Tool Builder
16 | Ericsson AB. All Rights Reserved.: Observer
(tiger@durin)198> ttb:write_config("myconfig",all).ok(tiger@durin)199> ttb:list_config("myconfig").[{1,{ttb,tracer,[tiger@durin,[]]}}, {2,{ttb,p,[<0.1244.0>,[garbage_collection,call]]}}, {3,{ttb,tp,[ets,new,2,[]]}}, {4,{ttb,ctp,[ets,new,2]}}, {5,{ttb,tp,[ets,new,2,[]]}}]
Extend an existing configuration:
(tiger@durin)200> ttb:write_config("myconfig",[{ttb,tp,[ets,delete,1,[]]}],[append]).ok(tiger@durin)201> ttb:list_config("myconfig").[{1,{ttb,tracer,[tiger@durin,[]]}}, {2,{ttb,p,[<0.1244.0>,[garbage_collection,call]]}}, {3,{ttb,tp,[ets,new,2,[]]}}, {4,{ttb,ctp,[ets,new,2]}}, {5,{ttb,tp,[ets,new,2,[]]}}, {6,{ttb,tp,[ets,delete,1,[]]}}]
Go back to a previous configuration after stopping Trace Tool Builder:
(tiger@durin)202> ttb:stop().ok(tiger@durin)203> ttb:run_config("myconfig").ttb:tracer(tiger@durin,[]) ->{ok,[tiger@durin]}
ttb:p(<0.1244.0>,[garbage_collection,call]) ->{ok,{[<0.1244.0>],[garbage_collection,call]}}
ttb:tp(ets,new,2,[]) ->{ok,[{matched,1}]}
ttb:ctp(ets,new,2) ->{ok,[{matched,1}]}
ttb:tp(ets,new,2,[]) ->{ok,[{matched,1}]}
ttb:tp(ets,delete,1,[]) ->{ok,[{matched,1}]}
ok
Write selected entries from the history buffer to a configuration file:
(tiger@durin)204> ttb:list_history(). [{1,{ttb,tracer,[tiger@durin,[]]}}, {2,{ttb,p,[<0.1244.0>,[garbage_collection,call]]}}, {3,{ttb,tp,[ets,new,2,[]]}}, {4,{ttb,ctp,[ets,new,2]}}, {5,{ttb,tp,[ets,new,2,[]]}}, {6,{ttb,tp,[ets,delete,1,[]]}}]
1.2 Trace Tool Builder
Ericsson AB. All Rights Reserved.: Observer | 17
(tiger@durin)205> ttb:write_config("myconfig",[1,2,3,6]).ok(tiger@durin)206> ttb:list_config("myconfig").[{1,{ttb,tracer,[tiger@durin,[]]}}, {2,{ttb,p,[<0.1244.0>,[garbage_collection,call]]}}, {3,{ttb,tp,[ets,new,2,[]]}}, {4,{ttb,tp,[ets,delete,1,[]]}}](tiger@durin)207>
1.2.10 Sequential TracingTo learn what sequential tracing is and how it can be used, please turn to the reference manual for the seq_tracemodule in the kernel application.
The support for sequential tracing provided by the Trace Tool Builder includes
• Initiation of the system tracer. This is automatically done when a trace port is started withttb:tracer/0/1/2
• Creation of match specifications which activates sequential tracing
Starting sequential tracing requires that a tracer has been started with the ttb:tracer/0/1/2 function.Sequential tracing can then either be started via a trigger function with a match specification created withttb:seq_trigger_ms/0/1, or directly by using the seq_trace module in the kernel application.
Example: Sequential tracing
In the following example, the function dbg:get_tracer/0 is used as trigger for sequential tracing:
(tiger@durin)110> ttb:tracer(). {ok,[tiger@durin]}(tiger@durin)111> ttb:p(self(),call). {ok,{[<0.158.0>],[call]}}(tiger@durin)112> ttb:tp(dbg,get_tracer,0,ttb:seq_trigger_ms(send)).{ok,[{matched,1},{saved,1}]}(tiger@durin)113> dbg:get_tracer(), seq_trace:reset_trace(). true(tiger@durin)114> ttb:stop(format).({<0.158.0>,{shell,evaluator,3},tiger@durin}) call dbg:get_tracer()SeqTrace [0]: ({<0.158.0>,{shell,evaluator,3},tiger@durin}) {<0.237.0>,dbg,tiger@durin} ! {<0.158.0>,{get_tracer,tiger@durin}} [Serial: {0,1}]SeqTrace [0]: ({<0.237.0>,dbg,tiger@durin}) {<0.158.0>,{shell,evaluator,3},tiger@durin} ! {dbg,{ok,#Port<0.222>}} [Serial: {1,2}]ok(tiger@durin)116>
Starting sequential tracing with a trigger is actually more useful if the trigger function is not called directly from theshell, but rather implicitly within a larger system. When calling a function from the shell, it is simpler to start sequentialtracing directly, e.g.
(tiger@durin)116> ttb:tracer(). {ok,[tiger@durin]}(tiger@durin)117> seq_trace:set_token(send,true), dbg:get_tracer(), seq_trace:reset_trace().true(tiger@durin)118> ttb:stop(format).SeqTrace [0]: ({<0.158.0>,{shell,evaluator,3},tiger@durin})
1.3 Erlang Top
18 | Ericsson AB. All Rights Reserved.: Observer
{<0.246.0>,dbg,tiger@durin} ! {<0.158.0>,{get_tracer,tiger@durin}} [Serial: {0,1}]SeqTrace [0]: ({<0.246.0>,dbg,tiger@durin}) {<0.158.0>,{shell,evaluator,3},tiger@durin} ! {dbg,{ok,#Port<0.229>}} [Serial: {1,2}]ok(tiger@durin)120>
In both examples above, the seq_trace:reset_trace/0 resets the trace token immediately after the tracedfunction in order to avoid lots of trace messages due to the printouts in the erlang shell.
All functions in the seq_trace module, except set_system_tracer/1, can be used after the trace port hasbeen started with ttb:tracer/0/1/2.
1.2.11 Example: Multipurpose trace toolThe module multitrace.erl which can be found in the src directory of the Observer application implementsa small tool with three possible trace settings. The trace messages are written to binary files which can be formattedwith the function multitrace:format/1/2.
multitrace:debug(What)Start calltrace on all processes and trace the given function(s). The format handler used ismultitrace:handle_debug/4 which prints each call and return. What must be an item or a list of itemsto trace, given on the format {Module,Function,Arity}, {Module,Function} or just Module.
multitrace:gc(Procs)Trace garbage collection on the given process(es). The format handler used is multitrace:handle_gc/4which prints start and stop and the time spent for each GC.
multitrace:schedule(Procs)Trace in- and out-scheduling on the given process(es). The format handler used ismultitrace:handle_schedule/4 which prints each in and out scheduling with process, timestamp andcurrent function. It also prints the total time each traced process was scheduled in.
1.3 Erlang Top
1.3.1 IntroductionErlang Top, etop is a tool for presenting information about erlang processes similar to the information presentedby top in UNIX.
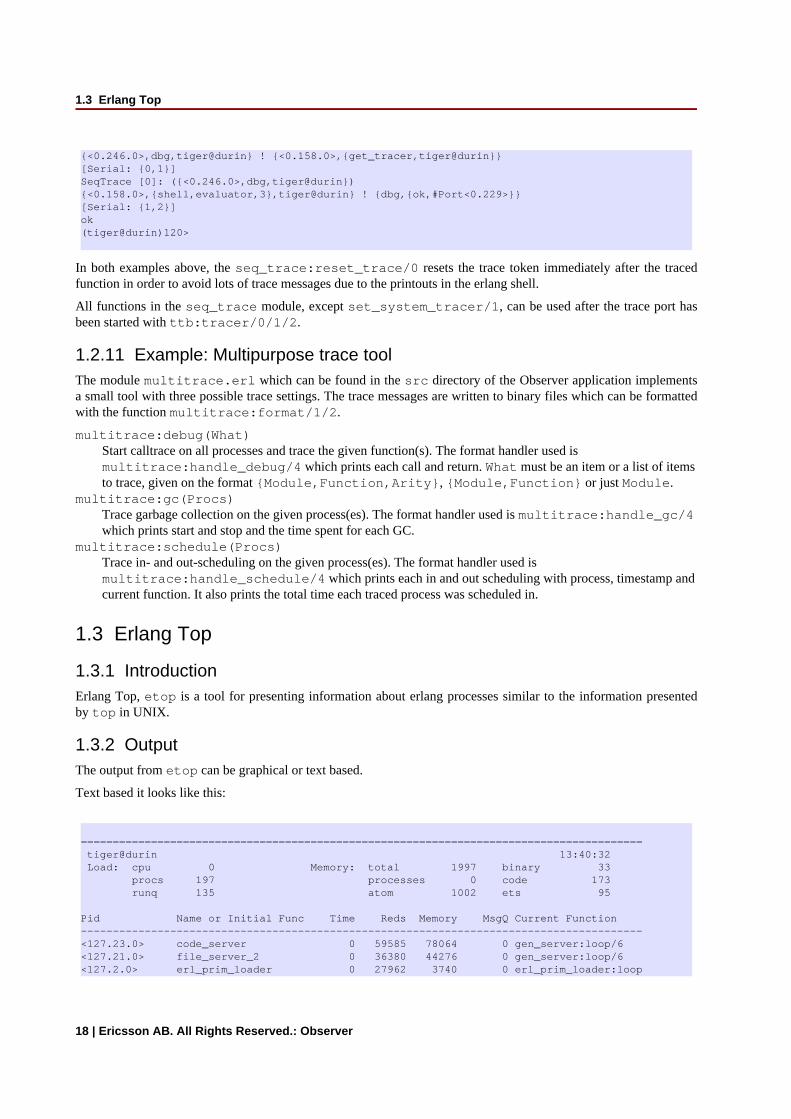
1.3.2 OutputThe output from etop can be graphical or text based.
Text based it looks like this:
======================================================================================== tiger@durin 13:40:32 Load: cpu 0 Memory: total 1997 binary 33 procs 197 processes 0 code 173 runq 135 atom 1002 ets 95
Pid Name or Initial Func Time Reds Memory MsgQ Current Function----------------------------------------------------------------------------------------<127.23.0> code_server 0 59585 78064 0 gen_server:loop/6 <127.21.0> file_server_2 0 36380 44276 0 gen_server:loop/6 <127.2.0> erl_prim_loader 0 27962 3740 0 erl_prim_loader:loop
1.3 Erlang Top
Ericsson AB. All Rights Reserved.: Observer | 19
<127.9.0> kernel_sup 0 6998 4676 0 gen_server:loop/6 <127.17.0> net_kernel 62 6018 3136 0 gen_server:loop/6 <127.0.0> init 0 4156 4352 0 init:loop/1 <127.16.0> auth 0 1765 1264 0 gen_server:loop/6 <127.18.0> inet_tcp_dist:accept 0 660 1416 0 prim_inet:accept0/2 <127.5.0> application_controll 0 569 6756 0 gen_server:loop/6 <127.137.0> net_kernel:do_spawn_ 0 553 5840 0 dbg:do_relay_1/1 ========================================================================================
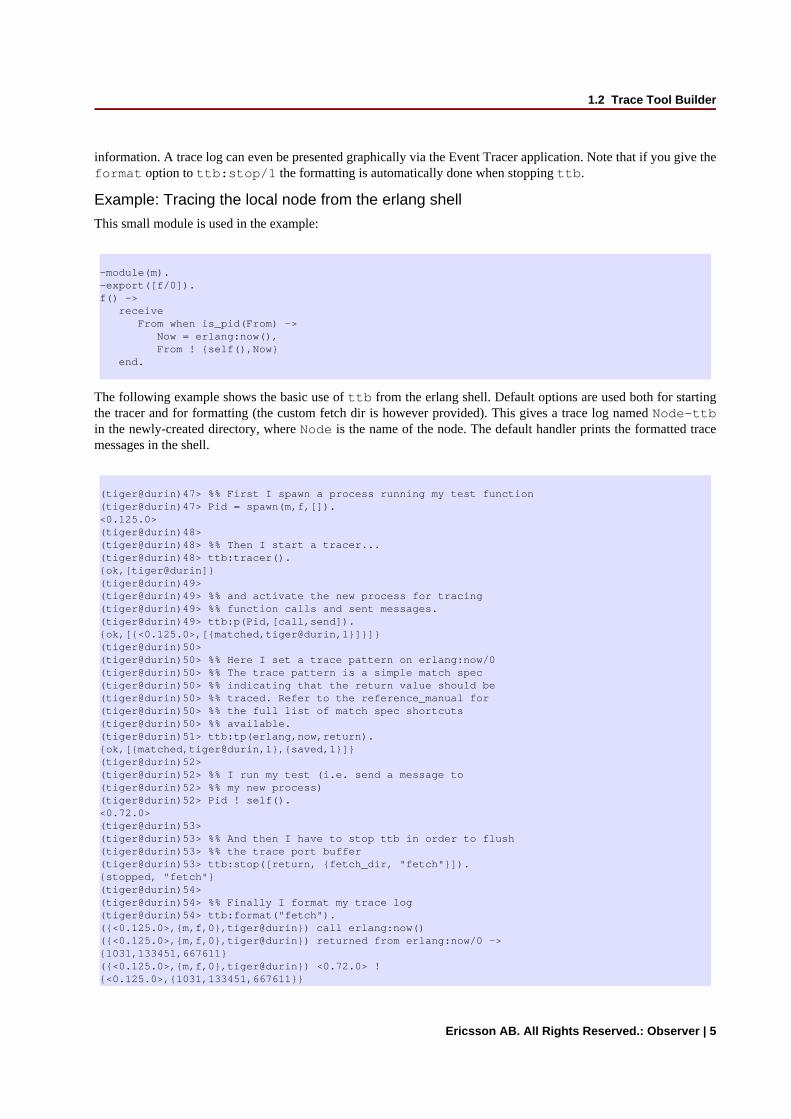
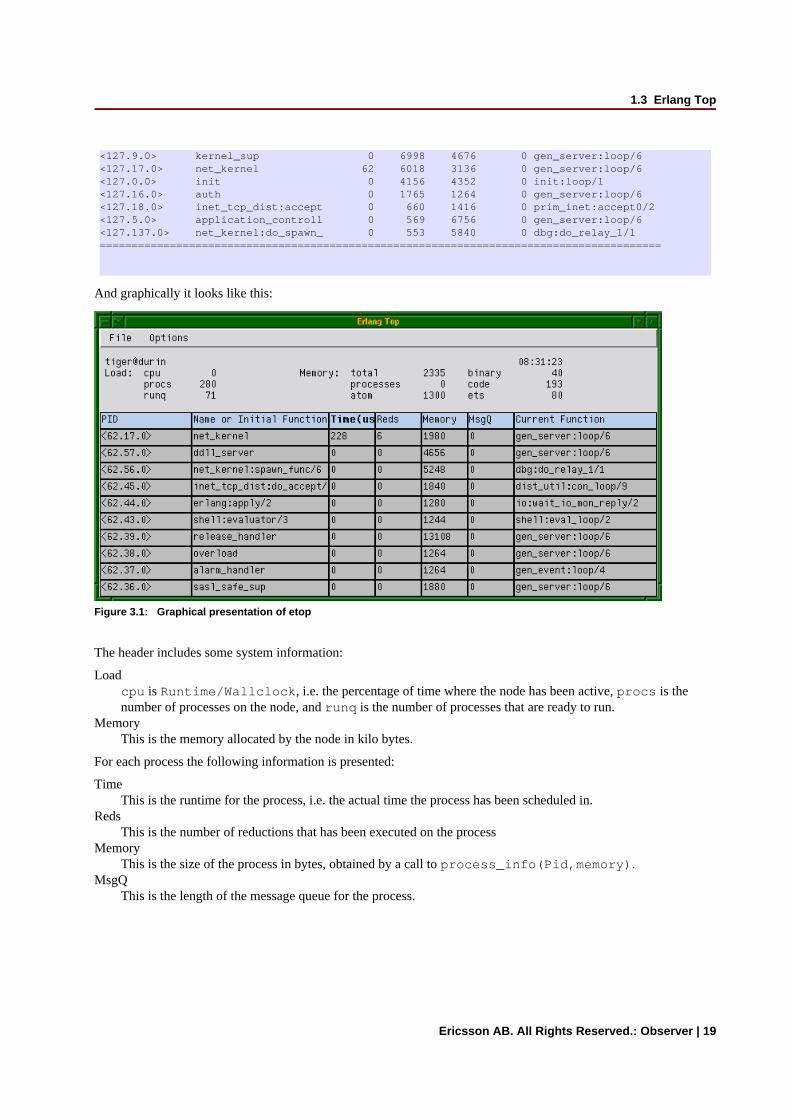
And graphically it looks like this:
Figure 3.1: Graphical presentation of etop
The header includes some system information:
Loadcpu is Runtime/Wallclock, i.e. the percentage of time where the node has been active, procs is thenumber of processes on the node, and runq is the number of processes that are ready to run.
MemoryThis is the memory allocated by the node in kilo bytes.
For each process the following information is presented:
TimeThis is the runtime for the process, i.e. the actual time the process has been scheduled in.
RedsThis is the number of reductions that has been executed on the process
MemoryThis is the size of the process in bytes, obtained by a call to process_info(Pid,memory).
MsgQThis is the length of the message queue for the process.
1.3 Erlang Top
20 | Ericsson AB. All Rights Reserved.: Observer
Note:Time and Reds can be presented as accumulated values or as values since last update.
1.3.3 StartTo start etop with the graphical presentation, use the script getop or the batch file getop.bat, e.g. getop -node tiger@durin
To start etop with the text based presentation use the script etop or the batch file etop.bat, e.g. etop -nodetiger@durin,
1.3.4 ConfigurationAll configuration parameters can be set at start by adding -OptName Value to the command line, e.g. etop -node tiger@durin -setcookie mycookie -lines 15.
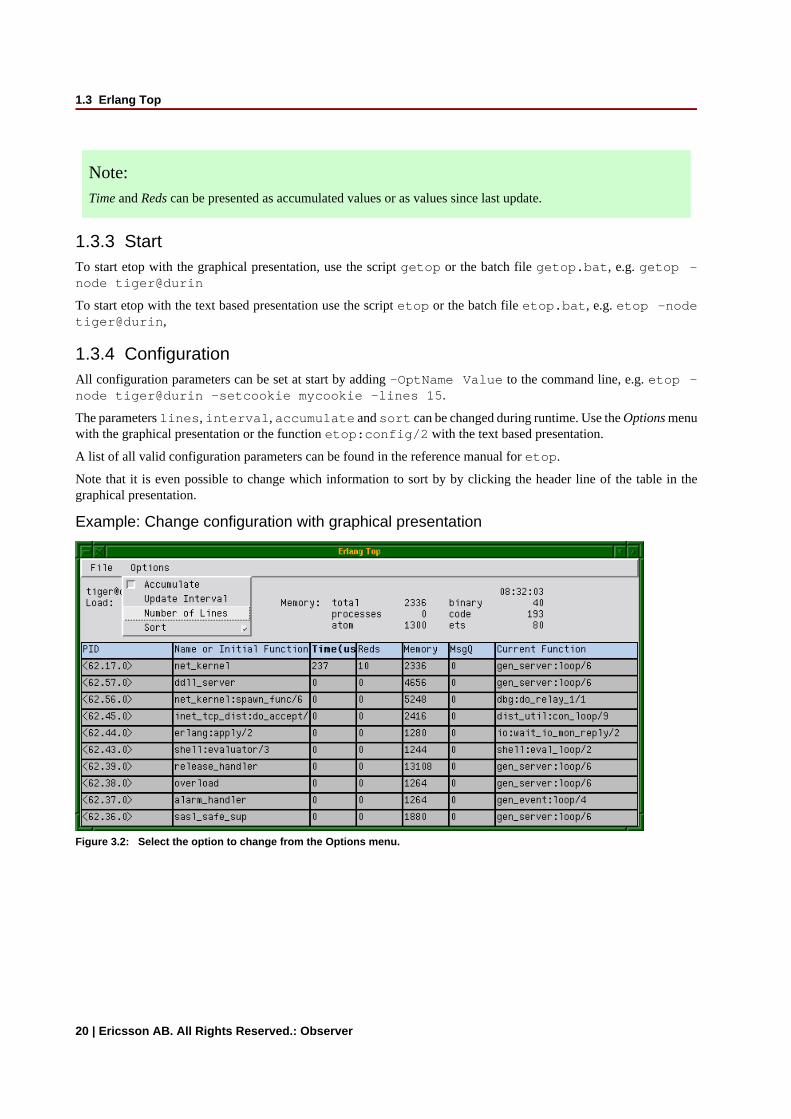
The parameters lines, interval, accumulate and sort can be changed during runtime. Use the Options menuwith the graphical presentation or the function etop:config/2 with the text based presentation.
A list of all valid configuration parameters can be found in the reference manual for etop.
Note that it is even possible to change which information to sort by by clicking the header line of the table in thegraphical presentation.
Example: Change configuration with graphical presentation
Figure 3.2: Select the option to change from the Options menu.
1.3 Erlang Top
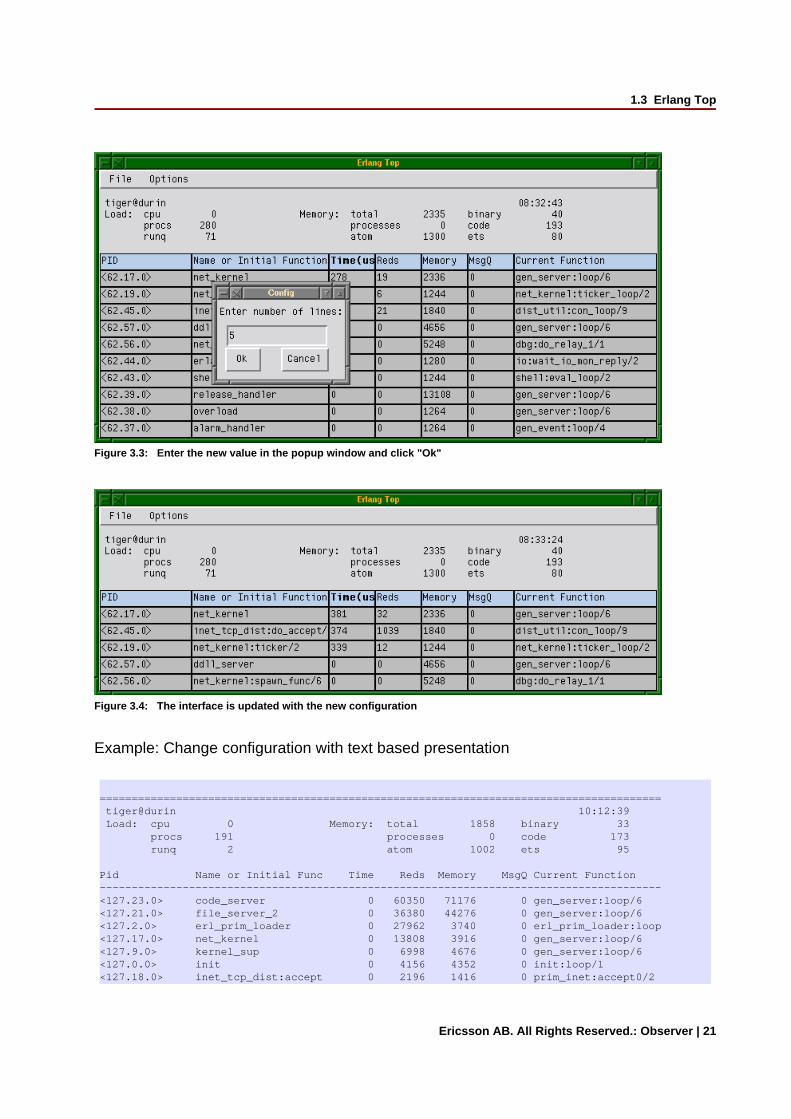
Ericsson AB. All Rights Reserved.: Observer | 21
Figure 3.3: Enter the new value in the popup window and click "Ok"
Figure 3.4: The interface is updated with the new configuration
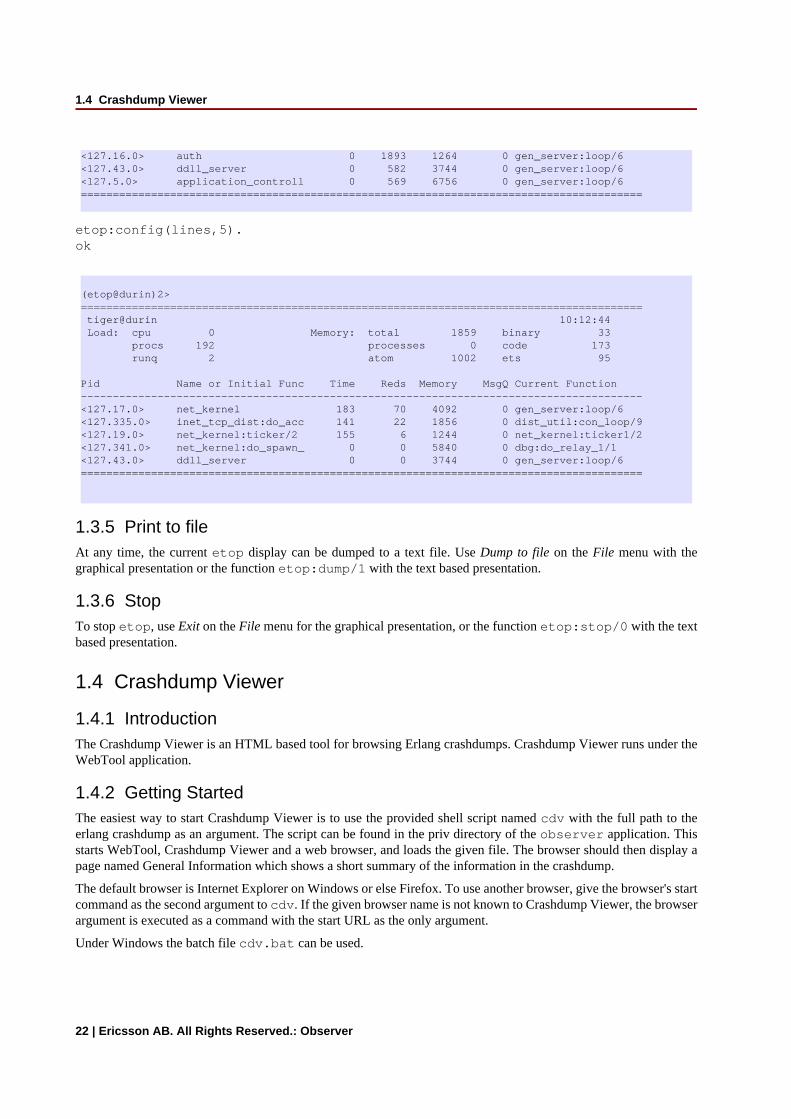
Example: Change configuration with text based presentation
======================================================================================== tiger@durin 10:12:39 Load: cpu 0 Memory: total 1858 binary 33 procs 191 processes 0 code 173 runq 2 atom 1002 ets 95
Pid Name or Initial Func Time Reds Memory MsgQ Current Function----------------------------------------------------------------------------------------<127.23.0> code_server 0 60350 71176 0 gen_server:loop/6 <127.21.0> file_server_2 0 36380 44276 0 gen_server:loop/6 <127.2.0> erl_prim_loader 0 27962 3740 0 erl_prim_loader:loop<127.17.0> net_kernel 0 13808 3916 0 gen_server:loop/6 <127.9.0> kernel_sup 0 6998 4676 0 gen_server:loop/6 <127.0.0> init 0 4156 4352 0 init:loop/1 <127.18.0> inet_tcp_dist:accept 0 2196 1416 0 prim_inet:accept0/2
1.4 Crashdump Viewer
22 | Ericsson AB. All Rights Reserved.: Observer
<127.16.0> auth 0 1893 1264 0 gen_server:loop/6 <127.43.0> ddll_server 0 582 3744 0 gen_server:loop/6 <127.5.0> application_controll 0 569 6756 0 gen_server:loop/6 ========================================================================================
etop:config(lines,5).ok
(etop@durin)2> ======================================================================================== tiger@durin 10:12:44 Load: cpu 0 Memory: total 1859 binary 33 procs 192 processes 0 code 173 runq 2 atom 1002 ets 95
Pid Name or Initial Func Time Reds Memory MsgQ Current Function----------------------------------------------------------------------------------------<127.17.0> net_kernel 183 70 4092 0 gen_server:loop/6 <127.335.0> inet_tcp_dist:do_acc 141 22 1856 0 dist_util:con_loop/9<127.19.0> net_kernel:ticker/2 155 6 1244 0 net_kernel:ticker1/2<127.341.0> net_kernel:do_spawn_ 0 0 5840 0 dbg:do_relay_1/1 <127.43.0> ddll_server 0 0 3744 0 gen_server:loop/6 ========================================================================================
1.3.5 Print to fileAt any time, the current etop display can be dumped to a text file. Use Dump to file on the File menu with thegraphical presentation or the function etop:dump/1 with the text based presentation.
1.3.6 StopTo stop etop, use Exit on the File menu for the graphical presentation, or the function etop:stop/0 with the textbased presentation.
1.4 Crashdump Viewer
1.4.1 IntroductionThe Crashdump Viewer is an HTML based tool for browsing Erlang crashdumps. Crashdump Viewer runs under theWebTool application.
1.4.2 Getting StartedThe easiest way to start Crashdump Viewer is to use the provided shell script named cdv with the full path to theerlang crashdump as an argument. The script can be found in the priv directory of the observer application. Thisstarts WebTool, Crashdump Viewer and a web browser, and loads the given file. The browser should then display apage named General Information which shows a short summary of the information in the crashdump.
The default browser is Internet Explorer on Windows or else Firefox. To use another browser, give the browser's startcommand as the second argument to cdv. If the given browser name is not known to Crashdump Viewer, the browserargument is executed as a command with the start URL as the only argument.
Under Windows the batch file cdv.bat can be used.
1.4 Crashdump Viewer
Ericsson AB. All Rights Reserved.: Observer | 23
It is also possible to start the Crashdump Viewer from within an erlang node by calling crashdump_viewer:start/0. Thiswill automatically start WebTool and display the web address where WebTool can be found. See the documentationfor the WebTool application for further information about how to use WebTool.
Point your web browser to the address displayed, and you should now see the start page of WebTool. At the top ofthe page, you will see a link to "CrashDumpViewer". Click this link to get to the start page for Crashdump Viewer.(Note that if webtool is on localhost, you must configure your web browser to have direct connection to the internet,or you must set no proxy for localhost.)
From the start page of Crashdump Viewer, push the "Load Crashdump" button to load a crashdump into the tool. Thenenter the filename of the crashdump in the entry field and push the "Ok" button. This will bring you to the GeneralInformation page, i.e. the same page as the cdv script will open in the browser.
Crashdumps generated by OTP R9C and later are loaded directly into the Crashdump Viewer, while dumps fromearlier releases first are translated by the Crashdump Translater. The Crashdump Translater creates a new file withthe same name as the original crashdump, but with the extension .translated. If there is no write access to thedirectory of the original file, you will be asked to enter a new path and filename for the translated file.
1.4.3 NavigatingThe lefthand frame contains a menu. Menu folders can be expanded and collapsed by clicking the folder picture. Whena menu item is clicked, the item information is shown in the big information frame.
The filename frame above the information frame shows the full name of the currently viewed Erlang crashdump.
To load a new crashdump, click the "Load New Crashdump" button in the menu frame.
The various information shown in the information frame will contain links to process identifiers (PIDs) and portidentifiers. Clicking one of these links will take you to the detailed information page for the process or port in question.Use the "Back" button in your browser to get back to the startingpoint. If the process or port resided on a remote node,there will be no information available. Clicking the link will then take you to the information about the remote node.
1.4.4 HelpFurther help on how to use the Crashdump Viewer tool can be found in the tool's menu under 'Documentation':
'Crashdump Viewer help' is a short document describing each information page and any additional information thatmight occur, compared to the raw dump described in 'How to interpret Erlang crashdumps'.
'How to interpret Erlang crashdumps' is a document from the Erlang runtime system describing details in the rawcrashdumps. Here you will also find information about each single field in the different information pages. Thisdocument can also be found directly in the OTP online documentation, via the Erlang runtime system user's guide.
1.4 Crashdump Viewer
24 | Ericsson AB. All Rights Reserved.: Observer
2 Reference Manual
The Observer application contains tools for tracing and investigation of distributed systems.
observer
Ericsson AB. All Rights Reserved.: Observer | 25
observerApplication
This chapter describes the OBSERVER application in OTP, which provides tools for tracing and investigation ofdistributed systems.
ConfigurationThere are currently no configuration parameters available for this application.
SEE ALSO
observer
26 | Ericsson AB. All Rights Reserved.: Observer
observerErlang module
The observer is gui frontend containing various tools to inspect a system. It displays system information, applicationstructures, process information, ets or mnesia tables and a frontend for tracing with ttb.
See the user's guide for more information about how to get started.
Exports
start() -> ok
This function starts the observer gui. Close the window to stop the application.
ttb
Ericsson AB. All Rights Reserved.: Observer | 27
ttbErlang module
The Trace Tool Builder ttb is a base for building trace tools for distributed systems.
When using ttb, dbg shall not be used in parallel.
Exports
start_trace(Nodes, Patterns, FlagSpec, Opts) -> Result
Types:
Result = see p/2
Nodes = see tracer/2
Patterns = [tuple()]
FlagSpec = {Procs, Flags}
Proc = see p/2
Flags = see p/2
Opts = see tracer/2
This function is a shortcut allowing to start a trace with one command. Each tuple in Patterns is converted to listwhich is in turn passed to ttb:tpl. The call:
ttb:start_trace([Node, OtherNode],[{mod, foo, []}, {mod, bar, 2}],{all, call},[{file, File}, {handler,{fun myhandler/4, S}}])
is equivalent to
ttb:start_trace([Node, OtherNode], [{file, File}, {handler,{fun myhandler/4, S}}]),ttb:tpl(mod, foo, []),ttb:tpl(mod, bar, 2, []),ttb:p(all, call)
tracer() -> Result
This is equivalent to tracer(node()).
tracer(Shortcut) -> Result
Types:
Shortcut = shell | dbg
shell is equivalent to tracer(node(),[{file, {local, "ttb"}}, shell]).
dbg is equivalent to tracer(node(),[{shell, only}]).
ttb
28 | Ericsson AB. All Rights Reserved.: Observer
tracer(Nodes) -> Result
This is equivalent to tracer(Nodes,[]).
tracer(Nodes,Opts) -> Result
Types:
Result = {ok, ActivatedNodes} | {error,Reason}
Nodes = atom() | [atom()] | all | existing | new
Opts = Opt | [Opt]
Opt = {file,Client} | {handler, FormatHandler} | {process_info,PI} | shell| {shell, ShellSpec} | {timer, TimerSpec} | {overload, {MSec, Module,Function}} | {flush, MSec} | resume | {resume, FetchTimeout}
TimerSpec = MSec | {MSec, StopOpts}
MSec = FetchTimeout = integer()
Module = Function = atom()
StopOpts = see stop/2
Client = File | {local, File}
File = Filename | Wrap
Filename = string()
Wrap = {wrap,Filename} | {wrap,Filename,Size,Count}
FormatHandler = See format/2
PI = true | false
ShellSpec = true | false | only
This function starts a file trace port on all given nodes and also points the system tracer for sequential tracing to thesame port.
The given Filename will be prefixed with the node name. Default Filename is "ttb".
File={wrap,Filename,Size,Count} can be used if the size of the trace logs must be limited. Default valuesare Size=128*1024 and Count=8.
When tracing diskless nodes, ttb must be started from an external "trace control node" with disk access, and Clientmust be {local, File}. All trace information is then sent to the trace control node where it is written to file.
The process_info option indicates if process information should be collected. If PI = true (which is default),each process identifier Pid is replaced by a tuple {Pid,ProcessInfo,Node}, where ProcessInfo is theprocess' registered name its globally registered name, or its initial function. It is possible to turn off this functionalityby setting PI = false.
The {shell, ShellSpec} option indicates that the trace messages should be printed on the console as they arereceived by the tracing process. This implies {local, File} trace client. If the ShellSpec is only (instead oftrue), no trace logs are stored.
The shell option is a shortcut for {shell, true}.
The timer option indicates that the trace should be automatically stopped after MSec milliseconds. StopOpts arepassed to ttb:stop/2 command if specified (default is []). Note that the timing is approximate, as delays relatedto network communication are always present. The timer starts after ttb:p/2 is issued, so you can set up your tracepatterns before.
The overload option allows to enable overload checking on the nodes under trace. Module:Function(check)is performed each MSec milliseconds. If the check returns true, the tracing is disabled on a given node.
ttb
Ericsson AB. All Rights Reserved.: Observer | 29
Module:Function should be able to handle at least three atoms: init, check and stop. init and stop givethe user a possibility to initialize and clean up the check environment.When a node gets overloaded, it is not possible to issue ttb:p nor any command from the ttb:tp family, as itwould lead to inconsistent tracing state (different trace specifications on different node).
The flush option periodically flushes all file trace port clients (see dbg:flush_trace_port/1). When enabled,the buffers are freed each MSec milliseconds. This option is not allowed with {file, {local, File}} tracing.
{resume, FetchTimeout} enables the autoresume feature. Whenever enabled, remote nodes try to reconnect tothe controlling node in case they were restarted. The feature requires runtime_tools application to be started (soit has to be present in the .boot scripts if the traced nodes run with embedded erlang). If this is not possible, resumemay be performed manually by starting runtime_tools remotely using rpc:call/4.ttb tries to fetch all logs from a reconnecting node before reinitializing the trace. This has to finish withinFetchTimeout milliseconds or is abortedBy default, autostart information is stored in a file called ttb_autostart.bin on each node. If this is not desired(i.e. on diskless nodes), a custom module to handle autostart information storage and retrieval can be provided byspecifying ttb_autostart_module environment variable for the runtime_tools application. The modulehas to respond to the following API:
write_config(Data) -> okStore the provided data for further retrieval. It is important to realize that the data storage used must not be affectedby the node crash.
read_config() -> {ok, Data} | {error, Error}Retrieve configuration stored with write_config(Data).
delete_config() -> okDelete configuration stored with write_config(Data). Note that after this call any subsequent calls toread_config must return {error, Error}.
The resume option implies the default FetchTimeout, which is 10 seconds
p(Procs,Flags) -> Return
Types:
Return = {ok,[{Procs,MatchDesc}]}
Procs = Process | [Process] | all | new | existing
Process = pid() | atom() | {global,atom()}
Flags = Flag | [Flag]
This function sets the given trace flags on the given processes. The timestamp flag is always turned on.
Please turn to the Reference manual for module dbg for details about the possible trace flags. The parameterMatchDesc is the same as returned from dbg:p/2
Processes can be given as registered names, globally registered names or process identifiers. If a registered name isgiven, the flags are set on processes with this name on all active nodes.
Issuing this command starts the timer for this trace if timer option was specified with tracer/2.
tp, tpl, ctp, ctpl, ctpg
These functions should be used in combination with the call trace flag for setting and clearing trace patterns. Whenthe call trace flag is set on a process, function calls will be traced on that process if a trace pattern has been set for thecalled function. Trace patterns specifies how to trace a function by using match specifications. Match specificationsare described in the User's Guide for the erlang runtime system erts.
ttb
30 | Ericsson AB. All Rights Reserved.: Observer
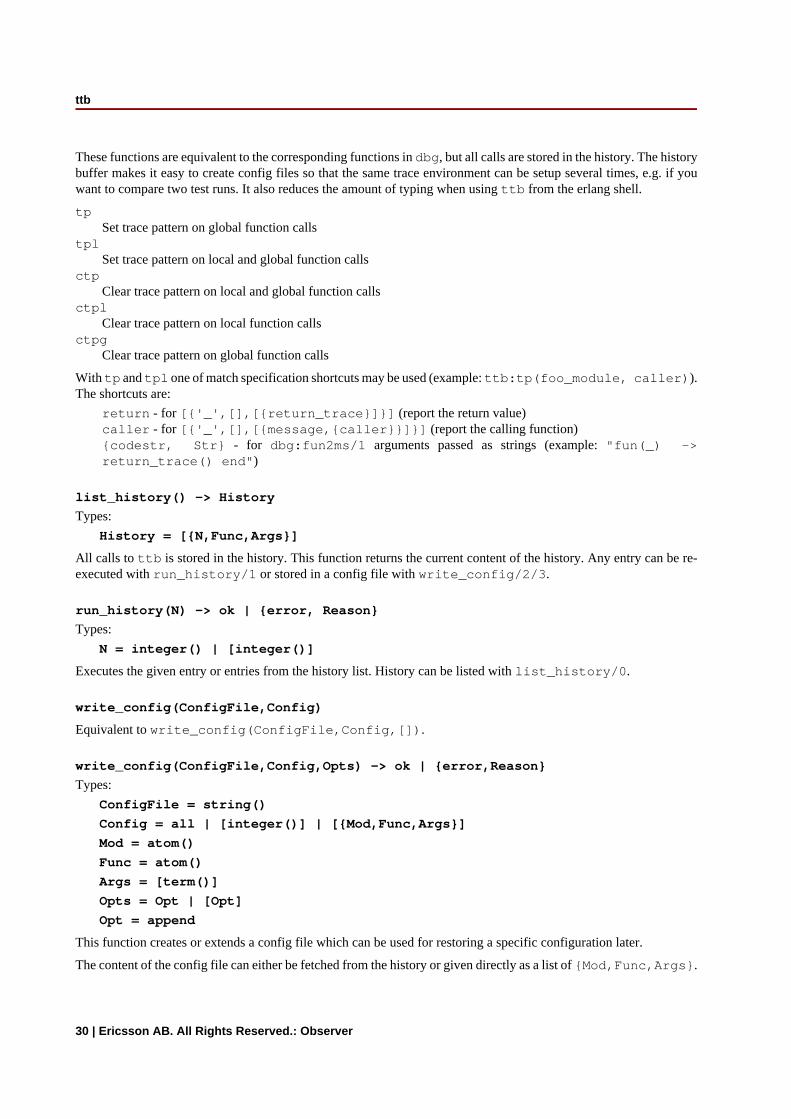
These functions are equivalent to the corresponding functions in dbg, but all calls are stored in the history. The historybuffer makes it easy to create config files so that the same trace environment can be setup several times, e.g. if youwant to compare two test runs. It also reduces the amount of typing when using ttb from the erlang shell.
tpSet trace pattern on global function calls
tplSet trace pattern on local and global function calls
ctpClear trace pattern on local and global function calls
ctplClear trace pattern on local function calls
ctpgClear trace pattern on global function calls
With tp and tpl one of match specification shortcuts may be used (example: ttb:tp(foo_module, caller)).The shortcuts are:
return - for [{'_',[],[{return_trace}]}] (report the return value)caller - for [{'_',[],[{message,{caller}}]}] (report the calling function){codestr, Str} - for dbg:fun2ms/1 arguments passed as strings (example: "fun(_) ->return_trace() end")
list_history() -> History
Types:
History = [{N,Func,Args}]
All calls to ttb is stored in the history. This function returns the current content of the history. Any entry can be re-executed with run_history/1 or stored in a config file with write_config/2/3.
run_history(N) -> ok | {error, Reason}
Types:
N = integer() | [integer()]
Executes the given entry or entries from the history list. History can be listed with list_history/0.
write_config(ConfigFile,Config)
Equivalent to write_config(ConfigFile,Config,[]).
write_config(ConfigFile,Config,Opts) -> ok | {error,Reason}
Types:
ConfigFile = string()
Config = all | [integer()] | [{Mod,Func,Args}]
Mod = atom()
Func = atom()
Args = [term()]
Opts = Opt | [Opt]
Opt = append
This function creates or extends a config file which can be used for restoring a specific configuration later.
The content of the config file can either be fetched from the history or given directly as a list of {Mod,Func,Args}.
ttb
Ericsson AB. All Rights Reserved.: Observer | 31
If the complete history is to be stored in the config file Config should be all. If only a selected number of entriesfrom the history should be stored, Config should be a list of integers pointing out the entries to be stored.
If Opts is not given or if it is [], ConfigFile is deleted and a new file is created. If Opts = [append],ConfigFile will not be deleted. The new information will be appended at the end of the file.
run_config(ConfigFile) -> ok | {error,Reason}
Types:
ConfigFile = string()
Executes all entries in the given config file. Note that the history of the last trace is always available in the file namedttb_last_config.
run_config(ConfigFile,NumList) -> ok | {error,Reason}
Types:
ConfigFile = string()
NumList = [integer()]
Executes selected entries from the given config file. NumList is a list of integers pointing out the entries to beexecuted.
The content of a config file can be listed with list_config/1.
Note that the history of the last trace is always available in the file named ttb_last_config.
list_config(ConfigFile) -> Config | {error,Reason}
Types:
ConfigFile = string()
Config = [{N,Func,Args}]
Lists all entries in the given config file.
write_trace_info(Key,Info) -> ok
Types:
Key = term()
Info = Data | fun() -> Data
Data = term()
The .ti file contains {Key,ValueList} tuples. This function adds Data to the ValueList associated with Key.All information written with this function will be included in the call to the format handler.
seq_trigger_ms() -> MatchSpec
Equivalent to seq_trigger_ms(all)
seq_trigger_ms(Flags) -> MatchSpec
Types:
MatchSpec = match_spec()
Flags = all | SeqTraceFlag | [SeqTraceFlag]
SeqTraceFlag = atom()
ttb
32 | Ericsson AB. All Rights Reserved.: Observer
A match specification can turn on or off sequential tracing. This function returns a match specification which turnson sequential tracing with the given Flags.
This match specification can be given as the last argument to tp or tpl. The activated Item will then become atrigger for sequential tracing. This means that if the item is called on a process with the call trace flag set, the processwill be "contaminated" with the seq_trace token.
If Flags = all, all possible flags are set.
Please turn to the reference manual for the seq_trace module in the kernel application to see the possible valuesfor SeqTraceFlag. For a description of the match_spec() syntax, please turn to the User's guide for the runtimesystem (erts). The chapter Match Specification in Erlang explains the general match specification "language".
Note:The system tracer for sequential tracing is automatically initiated by ttb when a trace port is started withttb:tracer/0/1/2.
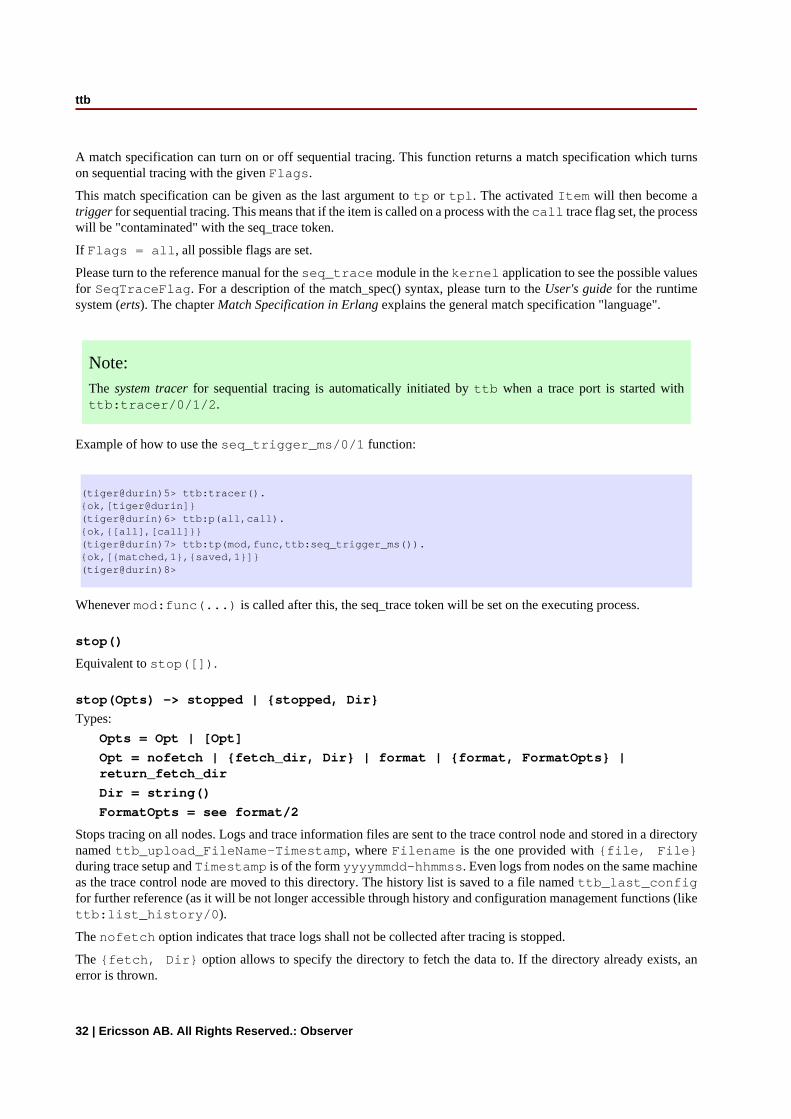
Example of how to use the seq_trigger_ms/0/1 function:
(tiger@durin)5> ttb:tracer().{ok,[tiger@durin]}(tiger@durin)6> ttb:p(all,call).{ok,{[all],[call]}}(tiger@durin)7> ttb:tp(mod,func,ttb:seq_trigger_ms()).{ok,[{matched,1},{saved,1}]}(tiger@durin)8>
Whenever mod:func(...) is called after this, the seq_trace token will be set on the executing process.
stop()
Equivalent to stop([]).
stop(Opts) -> stopped | {stopped, Dir}
Types:
Opts = Opt | [Opt]
Opt = nofetch | {fetch_dir, Dir} | format | {format, FormatOpts} |return_fetch_dir
Dir = string()
FormatOpts = see format/2
Stops tracing on all nodes. Logs and trace information files are sent to the trace control node and stored in a directorynamed ttb_upload_FileName-Timestamp, where Filename is the one provided with {file, File}during trace setup and Timestamp is of the form yyyymmdd-hhmmss. Even logs from nodes on the same machineas the trace control node are moved to this directory. The history list is saved to a file named ttb_last_configfor further reference (as it will be not longer accessible through history and configuration management functions (likettb:list_history/0).
The nofetch option indicates that trace logs shall not be collected after tracing is stopped.
The {fetch, Dir} option allows to specify the directory to fetch the data to. If the directory already exists, anerror is thrown.
ttb
Ericsson AB. All Rights Reserved.: Observer | 33
The format option indicates that the trace logs shall be formatted after tracing is stopped. All logs in the fetchdirectory will be merged. You may use {format, FormatOpts} to pass additional arguments to format/2.
The return_fetch_dir option indicates that the return value should be {stopped, Dir} and not juststopped. This implies fetch.
get_et_handler()
The et handler returned by the function may be used with format/2 or tracer/2. Example:ttb:format(Dir, [{handler, ttb:get_et_handler()}]).
format(File)
Same as format(File,[]).
format(File,Options) -> ok | {error, Reason}
Types:
File = string() | [string()]
This can be the name of a binary log, a list of such logs or the name of a directory containing one or morebinary logs.
Options = Opt | [Opt]
Opt = {out,Out} | {handler,FormatHandler} | disable_sort
Out = standard_io | string()
FormatHandler = {Function, InitialState}
Function = fun(Fd,Trace,TraceInfo,State) -> State
Fd = standard_io | FileDescriptor
This is the file descriptor of the destination file Out
Trace = tuple()
This is the trace message. Please turn to the Reference manual for the erlangmodule for details.
TraceInfo = [{Key,ValueList}]
This includes the keys flags, client and node, and if handler is given as option to the tracer function,this is also included. In addition all information written with the write_trace_info/2function is included.
Reads the given binary trace log(s). The logs are processed in the order of their timestamp as long as disable_sortoption is not given.
If FormatHandler = {Function,InitialState}, Function will be called for each trace message.If FormatHandler = get_et_handler(), et_viewer in the Event Tracer application (et) is used forpresenting the trace log graphically. ttb provides a few different filters which can be selected from the Filter menuin the et_viewer. If FormatHandler is not given, a default handler is used which presents each trace messageas a line of text.
The state returned from each call of Function is passed to the next call, even if next call is to format a messagefrom another log file.
If Out is given, FormatHandler gets the file descriptor to Out as the first parameter.
Out is ignored if et format handler is used.
Wrap logs can be formatted one by one or all in one go. To format one of the wrap logs in a set, give the exact nameof the file. To format the whole set of wrap logs, give the name with '*' instead of the wrap count. See examples inthe ttb User's Guide.
etop
34 | Ericsson AB. All Rights Reserved.: Observer
etopErlang module
etop should be started with the provided scripts etop and getop for text based and graphical presentationrespectively. This will start a hidden erlang node which connects to the node to be measured. The measured node isgiven with the -node option. If the measured node has a different cookie than the default cookie for the user whoinvokes the script, the cookie must be explicitly given witht the -setcookie option.
Under Windows the batch files etop.bat and getop.bat can be used.
The following configuration parameters exist for the etop tool. When executing the etop or getop scripts, theseparameters can be given as command line options, e.g. getop -node testnode@myhost -setcookieMyCookie.
nodeThe measured node.Value: atom()Mandatory
setcookieCookie to use for the etop node - must be the same as the cookie on the measured node.Value: atom()
linesNumber of lines (processes) to display.Value: integer()Default: 10
intervalThe time interval (in seconds) between each update of the display.Value: integer()Default: 5
accumulateIf true the execution time and reductions are accumulated.Value: boolean()Default: false
sortIdentifies what information to sort by.Value: runtime | reductions | memory | msg_qDefault: runtime (reductions if tracing=off)
tracingetop uses the erlang trace facility, and thus no other tracing is possible on the measured node while etop isrunning, unless this option is set to off. Also helpful if the etop tracing causes too high load on the measurednode. With tracing off, runtime is not measured.Value: on | offDefault: on
All interaction with etop when running the graphical presentation should happen via the menus. For the text basedpresentation the functions described below can be used.
See the user's guide for more information about the etop tool.
etop
Ericsson AB. All Rights Reserved.: Observer | 35
Exports
start() -> ok
This function starts etop. Note that etop is preferably started with the etop and getop scripts
start(Options) -> ok
Types:
Options = [Option]
Option = {Key, Value}
Key = atom()
Value = term()
This function starts etop. Use help/0 to see a description of the possible options.
help() -> ok
This function prints the help of etop and its options.
config(Key,Value) -> Result
Types:
Result = ok | {error,Reason}
Key = lines | interval | accumulate | sort
Value = term()
This function is used to change the tool's configuration parameters during runtime. The table above indicates theallowed values for each parameter.
dump(File) -> Result
Types:
Result = ok | {error,Reason}
File = string()
This function dumps the current display to a text file.
stop() -> stop
This function terminates etop.
crashdump_viewer
36 | Ericsson AB. All Rights Reserved.: Observer
crashdump_viewerErlang module
The Crashdump Viewer is an HTML based tool for browsing Erlang crashdumps. Crashdump Viewer runs under theWebTool application.
See the user's guide for more information about how to get started with the Crashdump Viewer.
Exports
start() -> ok
This function starts the crashdump_viewer.
stop() -> ok
This function stops the crashdump_viewer.