net analyte signal standard additions method for simultaneous
TRANSCRIPT
ISSN: 0973-4945; CODEN ECJHAO
E-Journal of Chemistry
http://www.ejchem.net 2012, 9(2), 680-692
Net Analyte Signal Standard Additions
Method for Simultaneous Determination of
Sulfamethoxazole and Trimethoprim in
Pharmaceutical Formulations and Biological Fluids
M. H. GIVIANRAD*and M. MOHAGHEGHIAN
Department of Chemistry, Science and Research Branch,
Islamic Azad University, Tehran, Iran
Received 22 August 2011; Accepted 27 October 2011
Abstract: The applicability of a novel net analyte signal standard addition
method (NASSAM) to the resolving of overlapping spectra corresponding to
the sulfamethoxazole and trimethoprim was verified by UV-visible
spectrophotometry. The results confirmed that the net analyte signal standard
additions method with simultaneous addition of both analytes is suitable for
the simultaneous determination of sulfamethoxazole and trimethoprim in
aqueous media. Moreover, applying the net analyte signal standard additions
method revealed that the two drugs could be determined simultaneously with
the concentration ratios of sulfamethoxazole to trimethoprim varying from
1:35 to 60:1 in the mixed samples. In addition, the limits of detections were
0.26 and 0.23 µmol L-1 for sulfamethoxazole and trimethoprim, respectively.
The proposed method has been effectively applied to the simultaneous
determination of sulfamethoxazole and trimethoprim in some synthetic,
pharmaceutical formulation and biological fluid samples.
Keywords: Sulfamethoxazole, Trimethoprim, NASSAM, Biological Fluids, Pharmaceutical formulations.
Introduction
Sulfamethoxazole (4-amino-N-(5-methylisoxazol-3-yl)-benzenesulfonamide) and trim-ethoprim
(5-(3,4,5- trimethoxybenzyl) pyrimidine- 2,4- diamine) (Figure 1 A and B) occur in a 5:1 (w/w)
mixture as co-trimoxazole in a number of dosage forms, including tablets, oral suspension, and
human or veterinary intravenous infusion medicine. This synergism combination is widely used
for the treatment of a variety of infections caused by Gram-positive and Gram-negative bacteria
such as urinary and respiratory tract infections1. Sulfamethoxazole SMX) inhibits bacterial
(synthesis of dihydrofolic acid by competing with paraaminobenzoic acid. Trimethoprim (TMP)
blocks the production of tetrahydrofolic acid from dihydrofolic acid by binding to and reversibly
inhibiting the required enzyme, dihydrofolate reductase 2.
Net Analyte Signal Standard Additions Method for Simultaneous
681
Various methods have been reported for determination of SMX and TMP in pharmaceutical
formulations and biological fluids3-14
. Most of these methods use a separation method such as
high-performance liquid chromatography (HPLC)3-8
or capillary electrophoresis 9. The USP
monograph15
lists a high-performance liquid chromatographic method as the official assay
procedure for quality control. The British pharmacopoeia16
suggests a sequential method based
on extraction by an organic solvent. However, these methods are expensive and time-consuming.
Besides these methods, UV-Visible spectrophotometry can be used as a rapid, sensitive and
inexpensive analytical tool. However, the lack of specificity of the UV-Visible absorption
spectrophotometry and the problem due to spectral overlap in determination of SMX and TMP
made the use of chemometric techniques inevitable10-14
. Chemometrics such as multicomponent
derivative spectroscopic analysis10
, ratio spectra derivative spectrometry11
, Principal Component
Regression (PCR) analysis12
and bivariate calibration spectrophotometric method13
and ratio
derivative spectrophotometry with simultaneous standard additions14
have been used for
simultaneous determination of SMX and TMP.
Figure 1. Structural formula of Sulfamethoxazole (A) and Trimethoprim (B).
In this work, a sensitive, selective, accurate and inexpensive procedure was applied for
simultaneous spectrophotometric determination of SMX and TMP by using the net analyte signal
standard additions method (NASSAM) with simultaneous addition of both analytes. This method
is a novel standard addition method based on the net analyte signal (NAS) concept. In this paper,
an attempt was made to calculate NAS vectors and attribute them to the analyte concentration
using UV-visible spectrophotometry technique. However, this method was evaluated with the
recommended British Pharmacopoeia method for some pharmaceutical productions.
The net analyte signal (NAS) was defined by Lorber17
, based on spectroscopic methods,
as the part of the spectrum of a mixture that is unique for the analyte of interest, i.e., it is
orthogonal to the spectra of the interferences.
The conventional notation has been employed throughout the subsequent discussion.
Boldface capital letter is used for a matrix, a boldface lower case for a column vector and
lightface lower case italic for a scalar. The superscript T designates the operation of the
vector or matrix transposition and the superscript + indicates the pseudo-inverse of a non-
square matrix. The digitized spectrum is referred to as a spectrum vector or simply as a
vector, while a spectrum vector of a pure component is called a component vector.
Consider a synthetic mixture containing SMX (10mol L-1) and TMP (20 mol L
-1). The
simultaneous determination of two analytes by NASSAM requires having spectrum vector
of the mixture. The known amounts of both SMX and TMP are successively added to the
sample solution. The resulting absorbances are measured and expressed by the following
equations: 00
0 TMPTMPSMXSMX CCA (1)
11 ,,01 sTMPTMPsSMXSMX CCAA (2)
ii sTMPTMPsSMXSMXii CCAA ,,1 (3)
nn sTMPTMPsSMXSMXnn CCAA ,,1 (4)
M. H. GIVIANRAD et al.
682
where A0 and Ai are the absorbances of the synthetic mixture before and after of standard
additions. 0
SMXC , 0
TMPC and
isSMXC ,,
isTMPC ,are the initial concentrations of SMX and TMP and
added concentrations to the sample in the ith
step. Also SMX and
TMP are molar
absorptivities of SMX and TMP, respectively.
The NAS of SMX and TMP compounds, NASSMXi and NASTMPi can be found by the
following equations, respectively:
iSMX ATTINASi
)( (5)
iTMP ASSINASi
)( (6)
where "I" is an identical matrix, "T" and "S" are the matrix of absorbances in different
concentrations of SMX and TMP, respectively. By definition, it is always possible to split
up the spectrum of a sample (Ai) into two distinct parts: NASSMX, which is orthogonal to the
spectra of the interferences and iTAT
where
iTAT is the part of the spectrum that could was
generated by a linear combination of the spectra of the interfering agents. Consequently,
iTAT cannot be unique for the analyte of interest, because it can also be produced by a
mixture of interfering agent. Furthermore, NASSMX is orthogonal to the spectra of the
interferences reflecting the part of the spectrum, which is only depending on the analyte
SMX present in the mixture. A Similar expression can be used for TMP. Therefore, the
orthogonal vectors of SMX and TMP which known as NASSMX and NASTMP can be used for
quantification of the analytes SMX and TMP, respectively17-19
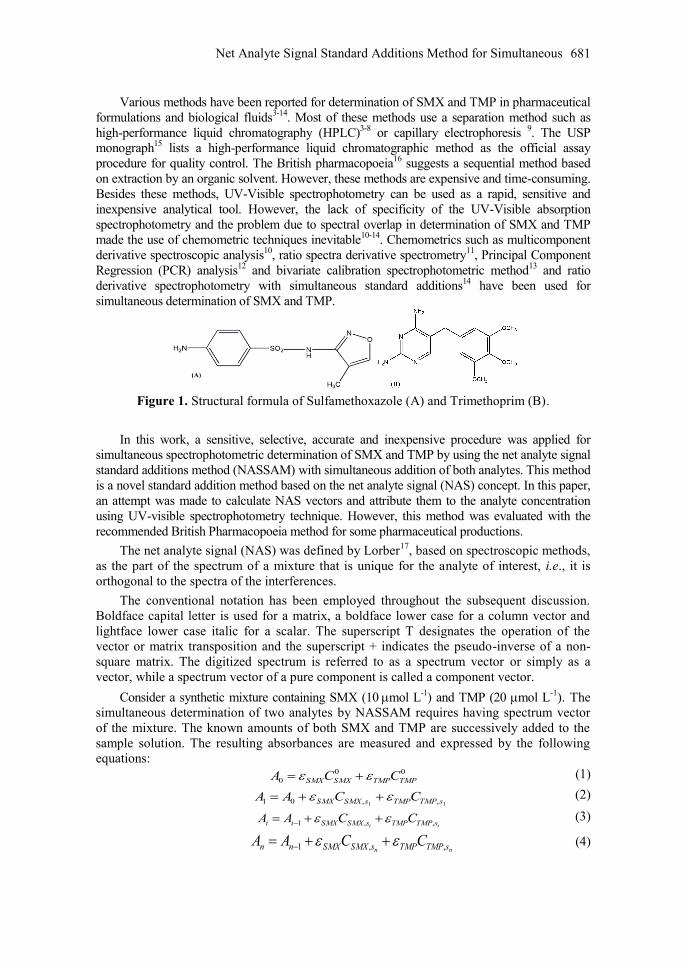
. Figure 2 shows the
geometrical presentation of analyte, interferent, mixtures, iTAT and NASSMX vectors. The
shape of NASSMX only depends on the presence of interferences in the mixture, not on
their specific concentrations and only addition or deletion of components can change
NASSMX. In the following, it is assumed that spectra of samples without the analyte are
available and are remained constant during the determination.
0TAT 1TAT
2TAT
Figure 2. Representation in two dimensional vector space analyte (SMX) and vector space
another analyte (TMP). NAS vector NASSMX will be different from SMX in direction and length.
In binary and/or ternary mixtures when the interferences are known, the NAS can be
calculated for the analytes. Norm of the NAS vector can be used to construct a univariate
calibration model, where this parameter is plotted against the analyte concentration and a
Net Analyte Signal Standard Additions Method for Simultaneous
683
Wavelength, nm
linear relationship is observed. In the case of matrix effect, standard addition plots can be
constructed against added standard additions.
Experimental
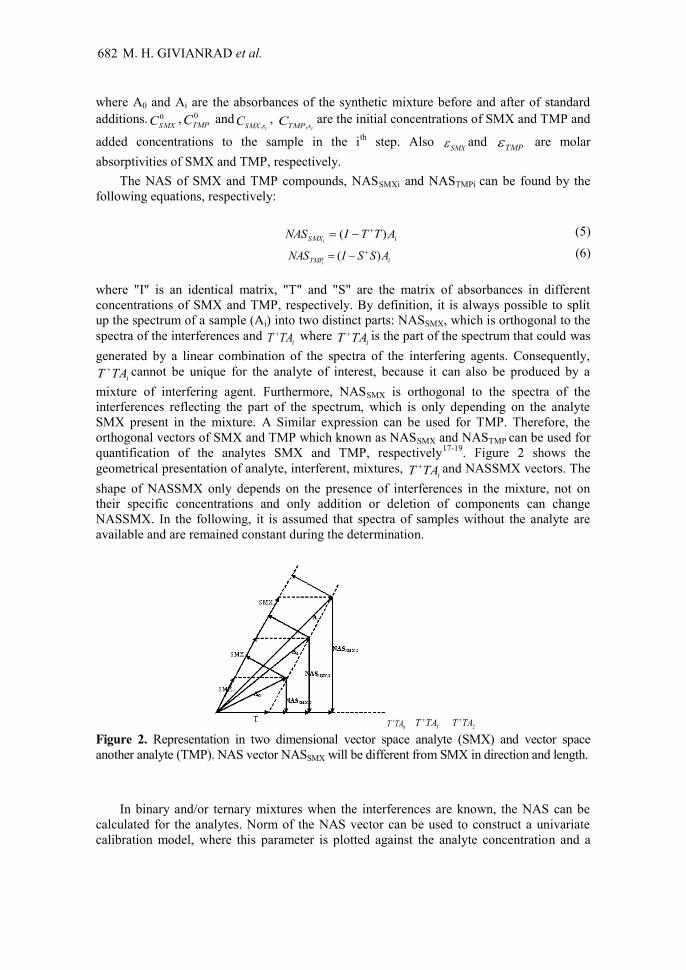
To demonstrate the analytical applicability of the proposed method for the analysis of binary
mixtures, two pure spectra of SMX and TMP were recorded separately. As it is shown in
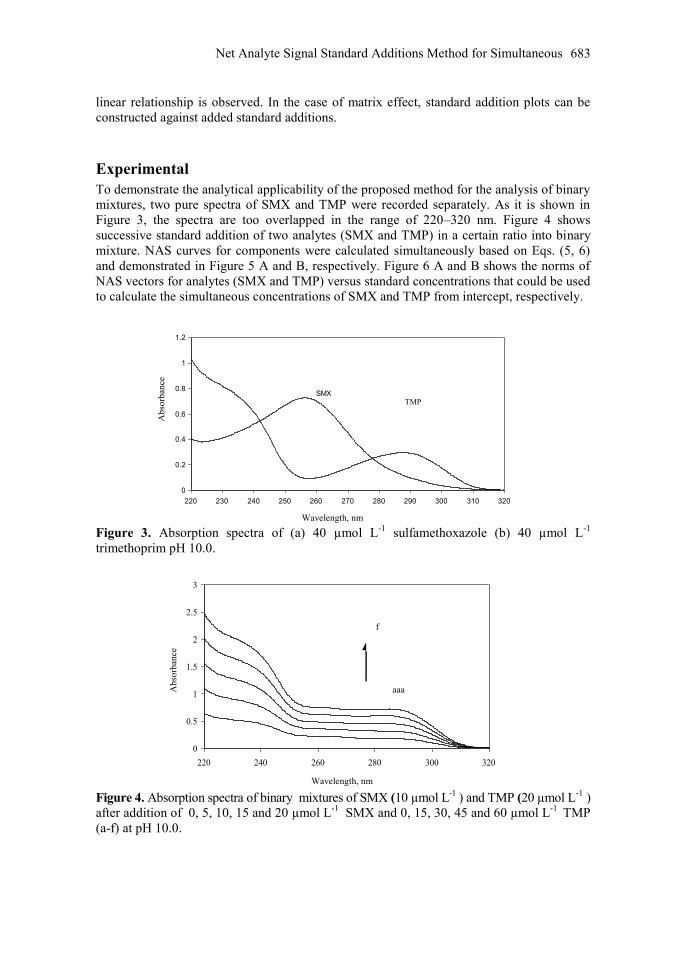
Figure 3, the spectra are too overlapped in the range of 220–320 nm. Figure 4 shows
successive standard addition of two analytes (SMX and TMP) in a certain ratio into binary
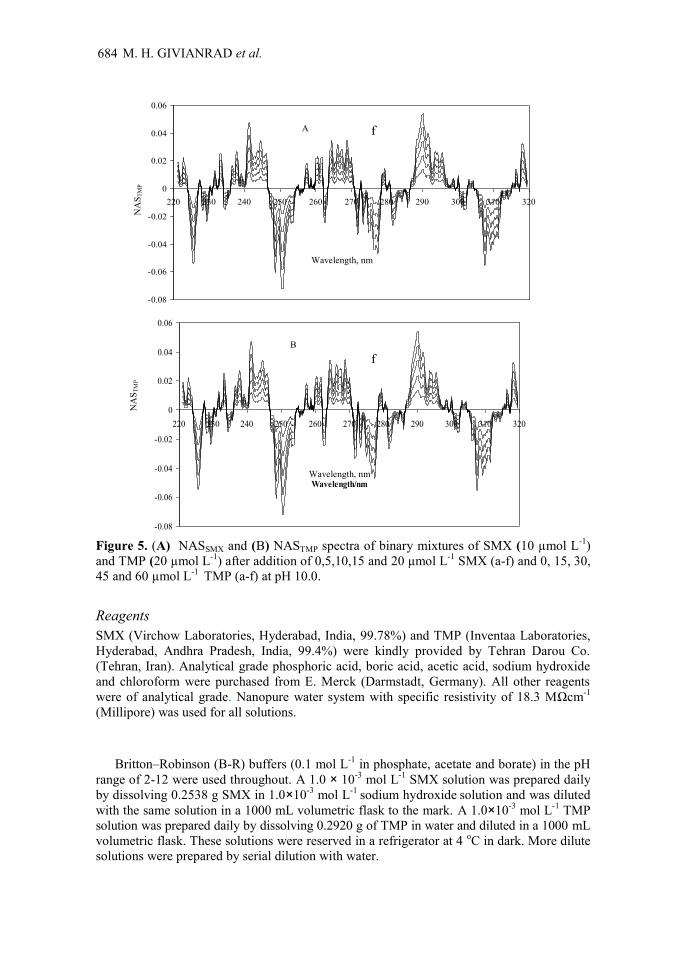
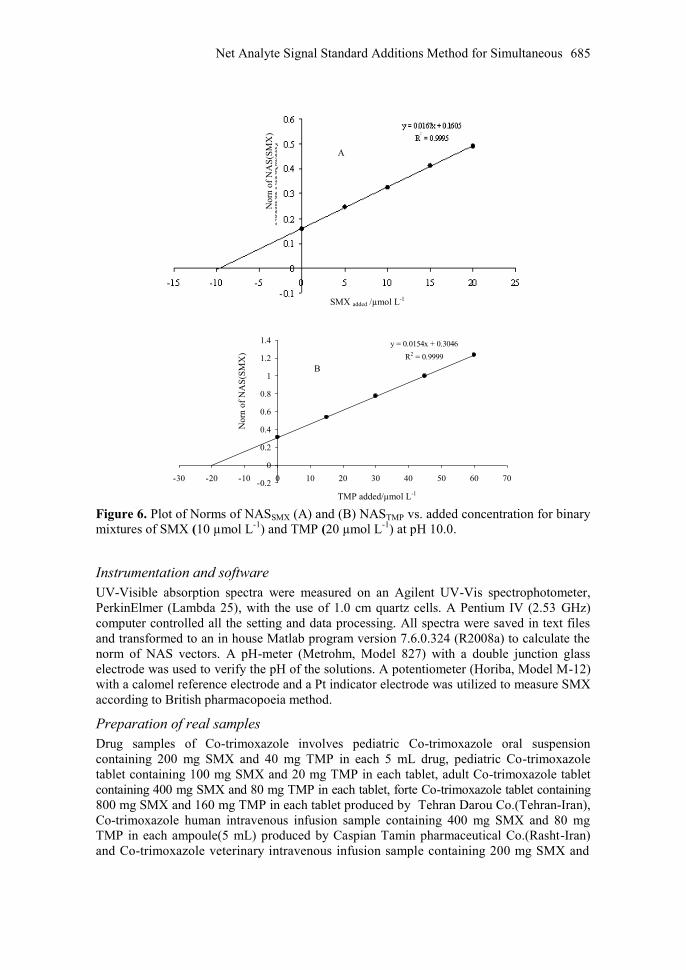
mixture. NAS curves for components were calculated simultaneously based on Eqs. (5, 6)
and demonstrated in Figure 5 A and B, respectively. Figure 6 A and B shows the norms of
NAS vectors for analytes (SMX and TMP) versus standard concentrations that could be used
to calculate the simultaneous concentrations of SMX and TMP from intercept, respectively.
0
0.2
0.4
0.6
0.8
1
1.2
220 230 240 250 260 270 280 290 300 310 320
Wavelength/nm
Absorbance SMX
Figure 3. Absorption spectra of (a) 40 µmol L-1
sulfamethoxazole (b) 40 µmol L-1
trimethoprim pH 10.0.
0
0.5
1
1.5
2
2.5
3
220 240 260 280 300 320
Wavelength/nm
Ab
sorb
an
ce
Figure 4. Absorption spectra of binary mixtures of SMX (10 µmol L-1
) and TMP (20 µmol L-1
)
after addition of 0, 5, 10, 15 and 20 µmol L-1
SMX and 0, 15, 30, 45 and 60 µmol L-1
TMP
(a-f) at pH 10.0.
TMP
f
aaa
Ab
sorb
ance
Wavelength, nm
Abso
rban
ce
M. H. GIVIANRAD et al.
684
-0.08
-0.06
-0.04
-0.02
0
0.02
0.04
0.06
220 230 240 250 260 270 280 290 300 310 320
Wavelength/nm
NA
ST
MP
-0.08
-0.06
-0.04
-0.02
0
0.02
0.04
0.06
220 230 240 250 260 270 280 290 300 310 320
Wavelength/nm
NA
ST
MP
Figure 5. (A) NASSMX and (B) NASTMP spectra of binary mixtures of SMX (10 µmol L
-1)
and TMP (20 µmol L-1
) after addition of 0,5,10,15 and 20 µmol L-1
SMX (a-f) and 0, 15, 30,
45 and 60 µmol L-1
TMP (a-f) at pH 10.0.
Reagents
SMX (Virchow Laboratories, Hyderabad, India, 99.78%) and TMP (Inventaa Laboratories,
Hyderabad, Andhra Pradesh, India, 99.4%) were kindly provided by Tehran Darou Co.
(Tehran, Iran). Analytical grade phosphoric acid, boric acid, acetic acid, sodium hydroxide
and chloroform were purchased from E. Merck (Darmstadt, Germany). All other reagents
were of analytical grade. Nanopure water system with specific resistivity of 18.3 MΩcm-1
(Millipore) was used for all solutions.
Britton–Robinson (B-R) buffers (0.1 mol L-1
in phosphate, acetate and borate) in the pH
range of 2-12 were used throughout. A 1.0 × 10⁻³
mol L-1
SMX solution was prepared daily
by dissolving 0.2538 g SMX in 1.0×10⁻³
mol L-1
sodium hydroxide solution and was diluted
with the same solution in a 1000 mL volumetric flask to the mark. A 1.0×10⁻³
mol L-1
TMP
solution was prepared daily by dissolving 0.2920 g of TMP in water and diluted in a 1000 mL
volumetric flask. These solutions were reserved in a refrigerator at 4 oC in dark. More dilute
solutions were prepared by serial dilution with water.
f A
B
Wavelength, nm
Wavelength, nm
f
NA
ST
MP
NA
ST
MP
Net Analyte Signal Standard Additions Method for Simultaneous
685
y = 0.0154x + 0.3046
R2 = 0.9999
-0.2
0
0.2
0.4
0.6
0.8
1
1.2
1.4
-30 -20 -10 0 10 20 30 40 50 60 70
TMP added/mol L-1
Norm
of
NA
S (T
MP
)
Figure 6. Plot of Norms of NASSMX (A) and (B) NASTMP vs. added concentration for binary
mixtures of SMX (10 µmol L-1
) and TMP (20 µmol L-1
) at pH 10.0.
Instrumentation and software
UV-Visible absorption spectra were measured on an Agilent UV-Vis spectrophotometer,
PerkinElmer (Lambda 25), with the use of 1.0 cm quartz cells. A Pentium IV (2.53 GHz)
computer controlled all the setting and data processing. All spectra were saved in text files
and transformed to an in house Matlab program version 7.6.0.324 (R2008a) to calculate the
norm of NAS vectors. A pH-meter (Metrohm, Model 827) with a double junction glass
electrode was used to verify the pH of the solutions. A potentiometer (Horiba, Model M-12)
with a calomel reference electrode and a Pt indicator electrode was utilized to measure SMX
according to British pharmacopoeia method.
Preparation of real samples
Drug samples of Co-trimoxazole involves pediatric Co-trimoxazole oral suspension
containing 200 mg SMX and 40 mg TMP in each 5 mL drug, pediatric Co-trimoxazole
tablet containing 100 mg SMX and 20 mg TMP in each tablet, adult Co-trimoxazole tablet
containing 400 mg SMX and 80 mg TMP in each tablet, forte Co-trimoxazole tablet containing
800 mg SMX and 160 mg TMP in each tablet produced by Tehran Darou Co.(Tehran-Iran),
Co-trimoxazole human intravenous infusion sample containing 400 mg SMX and 80 mg
TMP in each ampoule(5 mL) produced by Caspian Tamin pharmaceutical Co.(Rasht-Iran)
and Co-trimoxazole veterinary intravenous infusion sample containing 200 mg SMX and
SMX added /µmol L-1
Norn
of
NA
S(S
MX
)
No
rn o
f N
AS
(SM
X)
TMP added/μmol L-1
B
A
M. H. GIVIANRAD et al.
686
40 mg in each 1 mL solution produced by Kela Co.(Belgium), were used as real samples of
pharmaceutical formulations. For tablet samples, 20 tablets were weighed and powdered,
and then a quantity of powder containing 100 mg sulfamethoxazole and 20 mg trimethoprim
was dissolved in 1.0×10⁻³
mol L-1
sodium hydroxide solution and was diluted with the same
solution in a 1000 mL volumetric flask to the mark. For human intravenous infusion
samples, 20 ampoules were mixed and a quantity of drug containing 100 mg
sulfamethoxazole and 20 mg trimethoprim was dissolved in water and diluted in a 1000 mL
volumetric flask to the mark. For veterinary intravenous infusion samples, a quantity of drug
containing 100 mg sulfamethoxazole and 20 mg trimethoprim was dissolved in water and
diluted in a 1000 mL volumetric flask to the mark. More dilute solutions were prepared by
serial dilution with water. However, the quantities of two drugs, which were mentioned by
producer companies, were considered as approximate quantities.
Human serum and plasma samples were obtained and stored frozen until the assay. Into
each of 6 centrifugation tubes containing a certain concentration of SMX and/or TMP,
1.0 mL of the human serum or plasma sample was transferred and then mixed well with
10.0 mL of methanol to precipitate the blood proteins. The precipitated proteins were
separated by centrifuging of the mixture for 20 min at 4000 rpm. The clear supernatant layer
was filtered through a 0.45 μm milli-pore filter to produce protein-free human serum or
plasma. The human serum or plasma samples were transferred into a 25 mL calibrated flask
adding 2 mL solution of B-R buffer of pH 10, diluted to the volume with water and then was
introduced to the optical cell.
British pharmacopoeia method
The British pharmacopoeia method as a standard method for determination of SMX and
TMP in Co-trimoxazole drugs was compared with NASSAM results. According to this
procedure for tablet samples, 20 tablets were weighed and powdered. For determination of
SMX, a quantity of powder containing 0.5 g of SMX was dissolved in 60 mL water and 10 mL
of Conc. hydrochloric acid and 3 g potassium bromide was added to the sample solution.
Then, after cooling the solution in ice, the sample solution was slowly titrated with 0.1 M
sodium nitrite by stirring constantly and the end point was determined potentiometrically.
For determination of TMP, to a quantity of powder containing 50 mg of TMP, 30 mL of
0.1 M sodium hydroxide was added and extracted with four 50 mL quantities of chloroform
and washed each extract with the same 10 mL quantities of 0.1 M sodium hydroxide. Then
the chloroform extracts were combined and extracted with four 50 mL quantities of 1 M
acetic acid, then the combined extracts were washed with 5 mL of chloroform and the
aqueous extracts were diluted to 250 mL with 1 M acetic acid. Finally, 10 mL of the solution,
10 mL of 1 M acetic acid and sufficient water were added to produce solution in a 100 mL
volumetric flask and the absorbance of the resulting solution at the maximum of 271 nm was
measured spectrophotometrically. For determination of SMX and TMP in intravenous
infusion Co-trimoxazole drugs and TMP in Co-trimoxazole oral suspension, a similar
procedure like the above-mentioned procedure was applied. However, for determination of
SMX in oral suspension drugs, 5 mL of the oral suspension was added to 30 mL of 0.1 M
sodium hydroxide, shaken and extracted with four 50 mL quantities of chloroform, washing
each extract with the same two 10 mL quantities of 0.1 M sodium hydroxide. The aqueous
solution and washings were combined and diluted to 250 mL with water, then filtered and 5 mL
of the filtrate was diluted to 200 mL with water. Afterward, 0.5 mL of 4 M hydrochloric
acid and 1 mL of a 0.1% w/v solution of sodium nitrite was added to the 2 mL of above
solution, by protecting from light. Then, after 2 minutes 1 mL of a 0.5%w/v solution of
ammonium sulphamate was added and allowed to stand for 3 minutes, subsequently 1 mL of
a 0.1%w/v solution of N-(1-naphthyl) ethylenediamine dihydrochloride was added and
Net Analyte Signal Standard Additions Method for Simultaneous
687
allowed to stand for 10 minutes. The resulting solution was diluted to 25 mL with water and
consequently, the absorbance was measured at 538 nm.
Recommended procedure
According to the mentioned theoretical section, two standard solution series of SMX and
TMP in 25 mL volumetric flasks containing 2 mL Britton–Robinson buffer solution
(pH 10.0) were prepared from 1-80 µmol with 1.0 µmol increments. Subsequently, the
absorbance spectra of each series solution were accomplished at appropriate wavelength
range (220-320 nm) with 0.1 nm increments. Then, the absorbance spectra of each series
stored in separate text files as T.txt and S.txt, respectively. As already declared, "S" and "T"
are the matrices of the absorbance in different concentrations of SMX and TMP,
respectively. Thus, this part of job was accomplished just for one time, which could be used
for prospective endeavors.
For sample assay, an aliquot of the solution containing SMX and/or TMP and 2 mL
Britton–Robinson buffer solution (pH 10.0) were added into a 25 mL volumetric flask and
made up to the mark with water. After that, a certain portion of the solution was transferred
into a quartz cell to measure its absorbance at appropriate wavelength range (220-320 nm)
with 0.1 nm increments. Then, after each standard addition of both components, the spectra
were saved as text files (A.txt). For calculating the norms of SMX, A.txt and T.txt files and
for calculating the norms of TMP, A.txt and S.txt files were transferred to Matlab program,
respectively. Consequently, the concentration of each component was calculated by standard
addition plot.
Results and Discussion
The absorption spectra of SMX and TMP under certain experimental conditions are shown
in Figure 3. As can be seen, the maximum wavelengths of two compounds are close to each
other and their spectra overlap. Therefore, determination of SMX and TMP in the presence
of each other is impractical by classical spectrophotometry. Therefore, the NASSAM was
used as a chemometrics method to solve matrix effect and interferent errors, simultaneously.
Effect of operational parameters
In order to optimize the procedure for the simultaneous determination of SMX and TMP, the
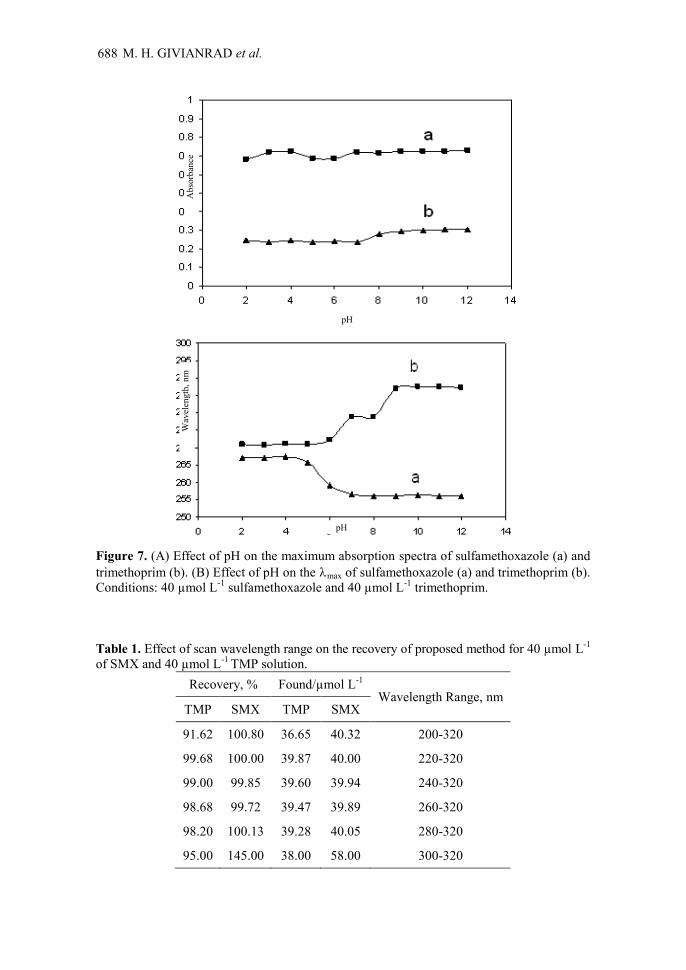
effect of pH and scan wavelength range was studied. As it is shown in Figure 7 A and B, the
absorbance at maximum wavelength does not change significantly, but the overlap between
two species is reduced by increasing of pH. Consequently, pH of 10 was selected as an
optimum to obtain higher selectivity. Also the spectra wavelength range was studied in
different ranges according to Table 1, the best result for recovery and accuracy for
determination of SMX and TMP by the proposed method was obtained in the range of 220-
320 nm. Table 2, shows results for simultaneous determination of SMX and TMP in some
synthetic mixtures. As it is seen, the two drugs could be determined simultaneously with
acceptable recovery for the concentration ratios of sulfamethoxazole to trimethoprim
varying from 1:35 to 60:1 in the mixed samples.
Reproducibility
In order to study the reproducibility of the proposed method, some synthetic mixtures
containing SMX and TMP have been analyzed several times (n=6)20,21
. The results were
shown in Table 3 with their confidence intervals. The means of the calculated RSD (%) were
1.92 and 2.14 for SMX and TMP, respectively.
M. H. GIVIANRAD et al.
688
Figure 7. (A) Effect of pH on the maximum absorption spectra of sulfamethoxazole (a) and
trimethoprim (b). (B) Effect of pH on the max of sulfamethoxazole (a) and trimethoprim (b).
Conditions: 40 µmol L-1
sulfamethoxazole and 40 µmol L-1
trimethoprim.
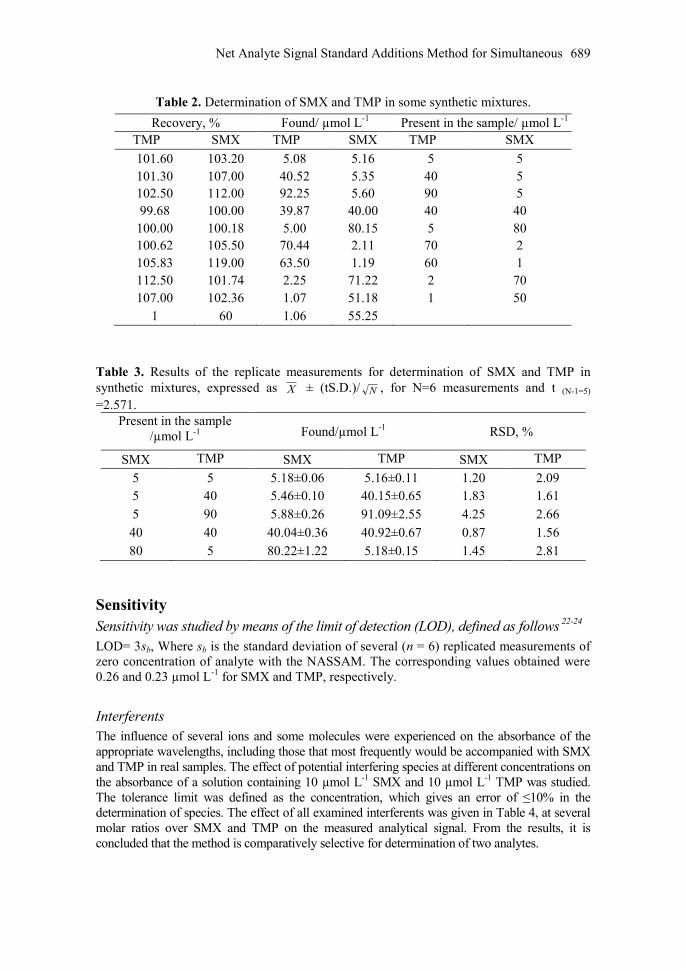
Table 1. Effect of scan wavelength range on the recovery of proposed method for 40 µmol L-1
of SMX and 40 µmol L-1
TMP solution.
Recovery, % Found/µmol L-1
Wavelength Range, nm
TMP SMX TMP SMX
91.62 100.80 36.65 40.32 200-320
99.68 100.00 39.87 40.00 220-320
99.00 99.85 39.60 39.94 240-320
98.68 99.72 39.47 39.89 260-320
98.20 100.13 39.28 40.05 280-320
95.00 145.00 38.00 58.00 300-320
Abso
rban
ce
pH
Wav
elen
gth
, n
m
pH
Net Analyte Signal Standard Additions Method for Simultaneous
689
Table 2. Determination of SMX and TMP in some synthetic mixtures.
Recovery, % Found/ µmol L-1
Present in the sample/ µmol L-1
TMP SMX TMP SMX TMP SMX
101.60 103.20 5.08 5.16 5 5
101.30 107.00 40.52 5.35 40 5
102.50 112.00 92.25 5.60 90 5
99.68 100.00 39.87 40.00 40 40
100.00 100.18 5.00 80.15 5 80
100.62 105.50 70.44 2.11 70 2
105.83 119.00 63.50 1.19 60 1
112.50 101.74 2.25 71.22 2 70
107.00 102.36 1.07 51.18 1 50
1 60 1.06 55.25
Table 3. Results of the replicate measurements for determination of SMX and TMP in
synthetic mixtures, expressed as X ± (tS.D.)/ N , for N=6 measurements and t (N-1=5)
=2.571.
Present in the sample
/µmol L-1
Found/µmol L-1
RSD, %
SMX TMP SMX TMP SMX TMP
5 5 5.18±0.06 5.16±0.11 1.20 2.09
5 40 5.46±0.10 40.15±0.65 1.83 1.61
5 90 5.88±0.26 91.09±2.55 4.25 2.66
40 40 40.04±0.36 40.92±0.67 0.87 1.56
80 5 80.22±1.22 5.18±0.15 1.45 2.81
Sensitivity
Sensitivity was studied by means of the limit of detection (LOD), defined as follows 22-24
LOD= 3sb, Where sb is the standard deviation of several (n = 6) replicated measurements of
zero concentration of analyte with the NASSAM. The corresponding values obtained were
0.26 and 0.23 µmol L-1
for SMX and TMP, respectively.
Interferents
The influence of several ions and some molecules were experienced on the absorbance of the
appropriate wavelengths, including those that most frequently would be accompanied with SMX
and TMP in real samples. The effect of potential interfering species at different concentrations on
the absorbance of a solution containing 10 µmol L-1
SMX and 10 µmol L-1
TMP was studied.
The tolerance limit was defined as the concentration, which gives an error of ≤10% in the
determination of species. The effect of all examined interferents was given in Table 4, at several
molar ratios over SMX and TMP on the measured analytical signal. From the results, it is
concluded that the method is comparatively selective for determination of two analytes.
M. H. GIVIANRAD et al.
690
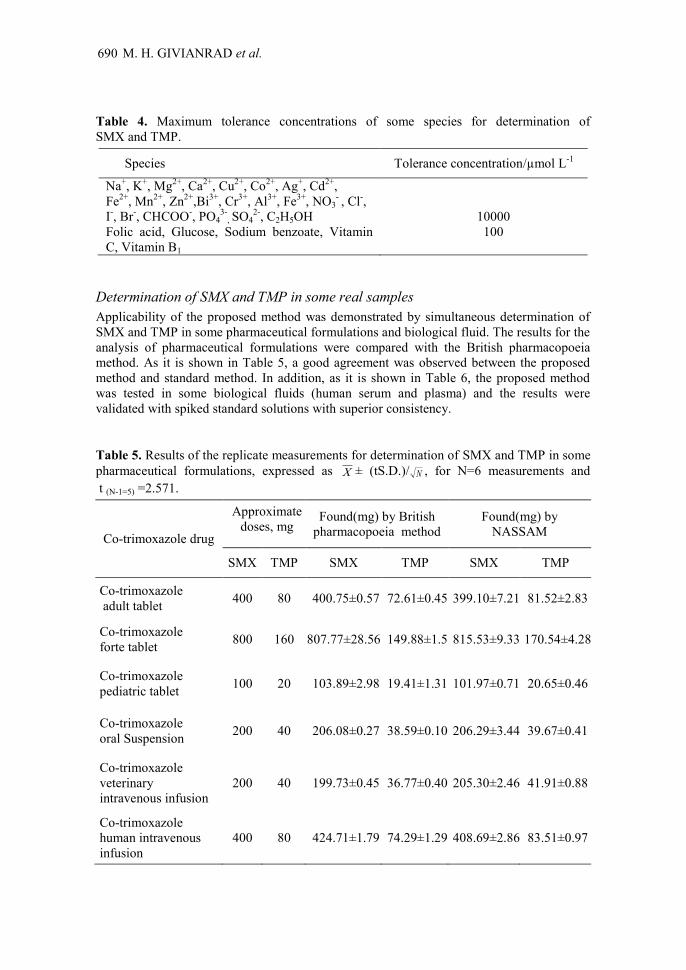
Table 4. Maximum tolerance concentrations of some species for determination of
SMX and TMP.
Species Tolerance concentration/µmol L-1
Na+, K
+, Mg
2+, Ca
2+, Cu
2+, Co
2+, Ag
+, Cd
2+,
Fe2+
, Mn2+
, Zn2+
,Bi3+
, Cr3+
, Al3+
, Fe3+
, NO3- , Cl
-,
I-, Br
-, CHCOO
-, PO4
3-, SO4
2-, C2H5OH
10000
Folic acid, Glucose, Sodium benzoate, Vitamin
C, Vitamin B1
100
Determination of SMX and TMP in some real samples
Applicability of the proposed method was demonstrated by simultaneous determination of
SMX and TMP in some pharmaceutical formulations and biological fluid. The results for the
analysis of pharmaceutical formulations were compared with the British pharmacopoeia
method. As it is shown in Table 5, a good agreement was observed between the proposed
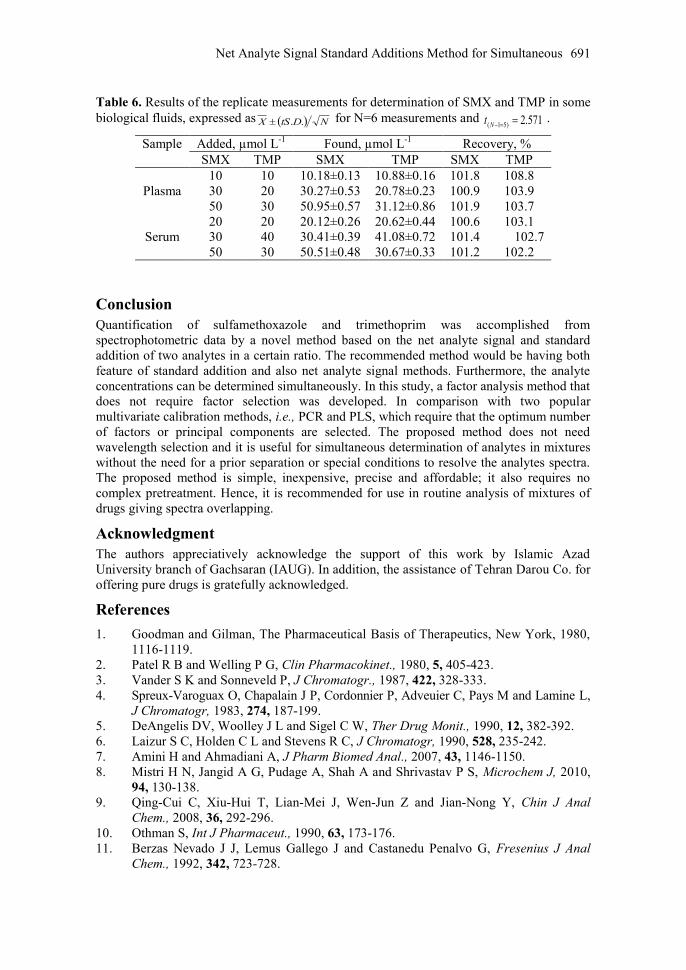
method and standard method. In addition, as it is shown in Table 6, the proposed method
was tested in some biological fluids (human serum and plasma) and the results were
validated with spiked standard solutions with superior consistency.
Table 5. Results of the replicate measurements for determination of SMX and TMP in some
pharmaceutical formulations, expressed as X ± (tS.D.)/ N , for N=6 measurements and
t (N-1=5) =2.571.
Co-trimoxazole drug
Approximate
doses, mg Found(mg) by British
pharmacopoeia method
Found(mg) by
NASSAM
SMX TMP SMX TMP SMX TMP
Co-trimoxazole
adult tablet 400 80 400.75±0.57 72.61±0.45 399.10±7.21 81.52±2.83
Co-trimoxazole
forte tablet 800 160 807.77±28.56 149.88±1.5 815.53±9.33 170.54±4.28
Co-trimoxazole
pediatric tablet 100 20 103.89±2.98 19.41±1.31 101.97±0.71 20.65±0.46
Co-trimoxazole
oral Suspension 200 40 206.08±0.27 38.59±0.10 206.29±3.44 39.67±0.41
Co-trimoxazole
veterinary
intravenous infusion
200 40 199.73±0.45 36.77±0.40 205.30±2.46 41.91±0.88
Co-trimoxazole
human intravenous
infusion
400 80 424.71±1.79 74.29±1.29 408.69±2.86 83.51±0.97
Net Analyte Signal Standard Additions Method for Simultaneous
691
Table 6. Results of the replicate measurements for determination of SMX and TMP in some
biological fluids, expressed as NDtSX .. for N=6 measurements and 571.2)51( Nt .
Sample
Added, µmol L-1
Found, µmol L-1
Recovery, %
SMX
TMP
SMX TMP
SMX
TMP
Plasma
10
10 10.18±0.13
10.88±0.16
101.8
108.8
30 20 30.27±0.53
20.78±0.23
100.9
103.9
50 30 50.95±0.57
31.12±0.86
101.9
103.7
Serum
20 20 20.12±0.26
20.62±0.44
100.6
103.1
30 40 30.41±0.39
41.08±0.72
101.4
102.7
50 30 50.51±0.48
30.67±0.33
101.2
102.2
Conclusion
Quantification of sulfamethoxazole and trimethoprim was accomplished from
spectrophotometric data by a novel method based on the net analyte signal and standard
addition of two analytes in a certain ratio. The recommended method would be having both
feature of standard addition and also net analyte signal methods. Furthermore, the analyte
concentrations can be determined simultaneously. In this study, a factor analysis method that
does not require factor selection was developed. In comparison with two popular
multivariate calibration methods, i.e., PCR and PLS, which require that the optimum number
of factors or principal components are selected. The proposed method does not need
wavelength selection and it is useful for simultaneous determination of analytes in mixtures
without the need for a prior separation or special conditions to resolve the analytes spectra.
The proposed method is simple, inexpensive, precise and affordable; it also requires no
complex pretreatment. Hence, it is recommended for use in routine analysis of mixtures of
drugs giving spectra overlapping.
Acknowledgment
The authors appreciatively acknowledge the support of this work by Islamic Azad
University branch of Gachsaran (IAUG). In addition, the assistance of Tehran Darou Co. for
offering pure drugs is gratefully acknowledged.
References
1. Goodman and Gilman, The Pharmaceutical Basis of Therapeutics, New York, 1980,
1116-1119.
2. Patel R B and Welling P G, Clin Pharmacokinet., 1980, 5, 405-423.
3. Vander S K and Sonneveld P, J Chromatogr., 1987, 422, 328-333.
4. Spreux-Varoguax O, Chapalain J P, Cordonnier P, Adveuier C, Pays M and Lamine L,
J Chromatogr, 1983, 274, 187-199.
5. DeAngelis DV, Woolley J L and Sigel C W, Ther Drug Monit., 1990, 12, 382-392.
6. Laizur S C, Holden C L and Stevens R C, J Chromatogr, 1990, 528, 235-242.
7. Amini H and Ahmadiani A, J Pharm Biomed Anal., 2007, 43, 1146-1150.
8. Mistri H N, Jangid A G, Pudage A, Shah A and Shrivastav P S, Microchem J, 2010,
94, 130-138.
9. Qing-Cui C, Xiu-Hui T, Lian-Mei J, Wen-Jun Z and Jian-Nong Y, Chin J Anal
Chem., 2008, 36, 292-296.
10. Othman S, Int J Pharmaceut., 1990, 63, 173-176.
11. Berzas Nevado J J, Lemus Gallego J and Castanedu Penalvo G, Fresenius J Anal
Chem., 1992, 342, 723-728.
M. H. GIVIANRAD et al.
692
12. Ribone M E, Pagani A P, Goicoechea H C and Olivieri A C, Chem Educador., 2000,
5, 236-241.
13. Lopez-Martinez L, Lopez-de-Alba P L, de-Leon-Rodriguez L M and Yepez-Murrieta M L,
J Pharm Biomed Anal., 2002, 30, 77-85.
14. Hajian R, Haghighi R and Shams N, Asian J Chem., 2010, 8, 6569-6579.
15. United State Pharmacopeia 32, National Formulary 27 2009.
16. British Pharmacopoeia, Volume III, 2009.
17. Lorber A, Anal Chem., 1986, 58, 1167-1172.
18. Lorber A, Farber K and Kawalski B R, Anal Chem., 1997, 69, 1620-1628.
19. Farber N M, Anal Chem., 1998, 70, 5108-5110.
20. Saber-Tehrani M, Hashemi-Moghaddam H, Givianrad M H and Abroomand-Azar P,
Anal Bioanal Chem., 2006, 386, 1407-1412.
21. Saber-Tehrani M, Givianrad M H and Kahkashan P, Bio Trace Elem Res., 2007, 116,
155-169.
22. Givianrad M H, Saber-Tehrani M, Abroomand-Azar P and Mohagheghian M,
Spectrochim Acta., 2011, 78, 1196-1200.
23. Saber-Tehrani M, Givianrad M H, Hashemi-Moghaddam H, Talanta., 2007, 71,
1319-1325.
24. Ganjavi M, Ezzatpanah H, Givianrad M H and Shams A, Food Chem., 2010, 118,
525-528.

Submit your manuscripts athttp://www.hindawi.com
Hindawi Publishing Corporationhttp://www.hindawi.com Volume 2014
Inorganic ChemistryInternational Journal of
Hindawi Publishing Corporation http://www.hindawi.com Volume 2014
International Journal ofPhotoenergy
Hindawi Publishing Corporationhttp://www.hindawi.com Volume 2014
Carbohydrate Chemistry
International Journal of
Hindawi Publishing Corporationhttp://www.hindawi.com Volume 2014
Journal of
Chemistry
Hindawi Publishing Corporationhttp://www.hindawi.com Volume 2014
Advances in
Physical Chemistry
Hindawi Publishing Corporationhttp://www.hindawi.com
Analytical Methods in Chemistry
Journal of
Volume 2014
Bioinorganic Chemistry and ApplicationsHindawi Publishing Corporationhttp://www.hindawi.com Volume 2014
SpectroscopyInternational Journal of
Hindawi Publishing Corporationhttp://www.hindawi.com Volume 2014
The Scientific World JournalHindawi Publishing Corporation http://www.hindawi.com Volume 2014
Medicinal ChemistryInternational Journal of
Hindawi Publishing Corporationhttp://www.hindawi.com Volume 2014
Chromatography Research International
Hindawi Publishing Corporationhttp://www.hindawi.com Volume 2014
Applied ChemistryJournal of
Hindawi Publishing Corporationhttp://www.hindawi.com Volume 2014
Hindawi Publishing Corporationhttp://www.hindawi.com Volume 2014
Theoretical ChemistryJournal of
Hindawi Publishing Corporationhttp://www.hindawi.com Volume 2014
Journal of
Spectroscopy
Analytical ChemistryInternational Journal of
Hindawi Publishing Corporationhttp://www.hindawi.com Volume 2014
Journal of
Hindawi Publishing Corporationhttp://www.hindawi.com Volume 2014
Quantum Chemistry
Hindawi Publishing Corporationhttp://www.hindawi.com Volume 2014
Organic Chemistry International
Hindawi Publishing Corporationhttp://www.hindawi.com Volume 2014
CatalystsJournal of
ElectrochemistryInternational Journal of
Hindawi Publishing Corporation http://www.hindawi.com Volume 2014