marketbeat san antonio, tx · san antonio, tx office q4 2017 marketbeat cushmanwakefield.com san...
TRANSCRIPT

San Antonio, TXOffice Q4 2017
MARKETBEAT
cushmanwakefield.com
San Antonio, TXOffice Q2 2018
MARKETBEAT
About Cushman & WakefieldCushman & Wakefield is a leading global real estate services firm that delivers exceptional value by putting ideas into
action for real estate occupiers and owners. Cushman & Wakefield is among the largest real estate services firms with
48,000 employees in approximately 400 offices and 70 countries. In 2017, the firm had revenue of $6.9 billion across
core services of property, facilities and project management, leasing, capital markets, valuation and other services. To
learn more, visit www.cushmanwakefield.com or follow @CushWake on Twitter.
©2018 Cushman & Wakefield. All rights reserved. The information contained within this report is gathered from multiple
sources believed to be reliable. The information may contain errors or omissions and is presented without any warranty
or representations as to its accuracy.
Economic Indicators
Market Indicators (Overall, All Classes)
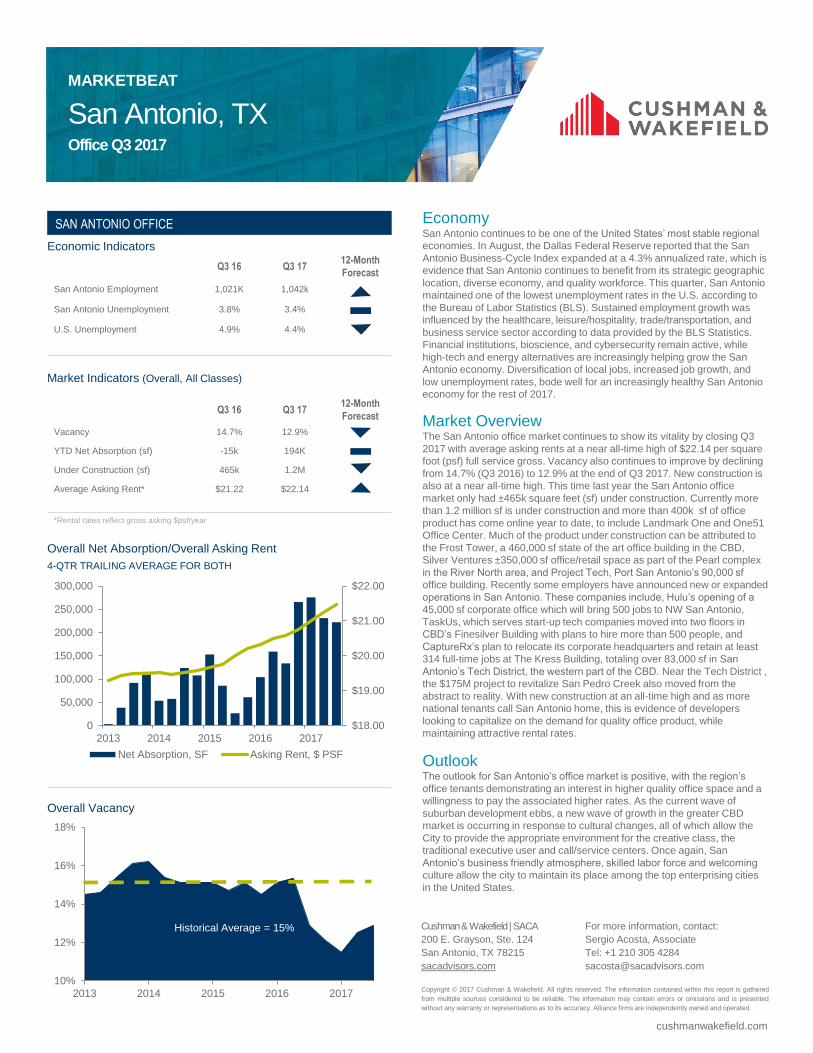
Overall Net Absorption/Overall Asking Rent
4-QTR TRAILING AVERAGE FOR BOTH
Overall Vacancy
Q2 17 Q2 18 12-Month Forecast
San Antonio Employment 1,035k 1,055k
San Antonio Unemployment 3.6% 3.4%
U.S. Unemployment 4.3% 3.8%
Q2 17 Q2 18 12-Month Forecast
Vacancy 12.1% 13.5%
YTD Net Absorption (sf) 404K -199k
Under Construction (sf) 864k 1.1M
Average Asking Rent* $20.77 $22.05
*Rental rates reflect gross asking $psf/year
Economy
A strong economy based on science, healthcare, the US military,
tourism, and trade, San Antonio’s robust market continues to pick
up steam halfway through it’s Tri-Centennial. With employment up
by over 20k jobs from the previous year, and unemployment
falling by 20 basis points over the same period, The River City
continues to be one of the Nation’s most stable areas for growth
and employment. San Antonio’s position along major international
and interstate highways allows the city to enjoy both foreign and
domestic trade, providing growth and expansion for multiple
industries dependent on goods and service. With one of the most
diverse workforces, San Antonio continues to build towards a
stronger and more vibrant economy than ever before.
Market Overview & Outlook
While the first quarter of 2018 showed slowed growth, Q2 for the
Office market shows an increase in productivity and fervor. Class
A rents have stabilized at a significantly higher rate ($1.28 more)
than the year before, fueled by an increase in quality construction
projects near the City’s CBD in the Lower Broadway, Midtown,
and The Pearl submarkets. With renovation and construction
projects underway at The Light Building, The Hixon, and The
Milam Building, Class A space near the CBD is seeing a high
demand from the market. Sites further out, like the Landmark One
building, provide an opportunity for growth in San Antonio’s North
Side, with growth in the North East, and North Central
submarkets as well. With a total of 1.1M square feet under
construction, space continues to be available for high profile
companies looking to migrate to the Alamo City market.
With demand and rental rates high and new construction allowing
more growth and options for industrial clients, San Antonio’s
Office forecast continues to be one of optimism and sustainability.
SAN ANTONIO OFFICE
$18.00
$19.00
$20.00
$21.00
$22.00
$23.00
0
50,000
100,000
150,000
200,000
250,000
300,000
2014 2015 2016 2017 2018
Net Absorption, SF Asking Rent, $ PSF
10%
12%
14%
16%
18%
2013 2014 2015 2016 2017 2018
Historical Average = 15%
Cushman & Wakefield | SACA
200 E. Grayson, Ste. 124
San Antonio, TX 78215
www.sacadvisors.com
For more information, contact:
Ben Kaplan, Analyst
Tel: +1 210 305 4281

San Antonio, TXOffice Q4 2017
MARKETBEAT
cushmanw akefield.com
San Antonio, TXOffice Q1 2018
MARKETBEAT
About Cushman & WakefieldCushman & Wakefield is a leading global real estate services firm with 45,000 employees in more than 70 countries
helping occupiers and investors optimize the value of their real estate. Cushman & Wakefield is among the largest
commercial real estate services firms with revenue of $6 billion across core services of agency leasing, asset services,
capital markets, facility services (C&W Services), global occupier services, investment & asset management (DTZ
Investors), project & development services, tenant representation, and valuation & advisory. To learn more, visit
www.cushmanwakefield.com or follow @CushWake on Twitter.
Copyright © 2018 Cushman & Wakefield. All rights reserved. The information contained within this report is gathered
from multiple sources considered to be reliable. The information may contain errors or omissions and is presented
without any warranty or representations as to its accuracy.
Economic Indicators
Market Indicators (Overall, All Classes)
Overall Net Absorption/Overall Asking Rent
4-QTR TRAILING AVERAGE FOR BOTH
Overall Vacancy
Q1 17 Q1 1812-Month
Forecast
San Antonio Employ ment 1,032k 1,054k
San Antonio Unemploy ment 3.8% 3.1%
U.S. Unemploy ment 4.9% 4.1%
Q1 17 Q1 1812-Month
Forecast
Vacancy 11.2% 13.9%
YTD Net Absorption (sf ) 277K 210K
Under Construction (sf ) 764k 1.76M
Av erage Asking Rent* $20.67 $22.05
*Rental rates reflect gross asking $psf/year
EconomyWith a foundation rooted in the US military, tourism, healthcare, and
international trade, the Alamo City carries its strong and vibrant economy into
its 300th anniversary. Q1 of 2018 showed total employment of 1.05M jobs, up
22k from a year before, and an unemployment rate that fell a full percentage
point over the same period. San Antonio’s strategic location at the junction of
IH-10 (linking Florida to California) and I-35 (the NAFTA corridor) facilitates
access to both international and interstate trade networks. With its large
military presence, world-class medical research facilities, robust business
climate, and thriving hospitality industry, San Antonio’s dynamic economy
enjoys one of the most diverse and skil led workforces in the nation, building a
city that shows no sign of slowing.
Market OverviewAs San Antonio celebrates its Tri -Centennial, it continues to expand its
inventory of office space. While vacancy rates have increased slightly, the
amount of new office space under construction has more than doubled in the
past year, with average rental rates increasing ≈$.70/SF/YR over the same
period, demonstrating the market’s anticipation of continuing demand. While
new projects are underway along typical suburban pathways, the trend toward
CBD and River North development is strengthening. Projects underway
include: Frost Tower, a 460,000 SF office building in the western CBD; Silver
Venture’s two new buildings at The Pearl (10 story & 6 story office buildings
with retail fronting Broadway) and; GreyStreet’sLight & Print Buildings,
totaling 140,000 SF at McCullough & Broadway, which is projected to be
finished by year’s end. Additional buildings that have been announced but not
begun include: 711 Broadway, a six-story, 125,000 SF office building by
Hixon/Cavender and; 1603 Broadway, a 120,000 SF office building adjacent to
the Pearl and combined with a W Hotel. Several other developers are
planning projects that are as yet unannounced. In total, San Antonio has a
total of 1.76 million SF of office space under construction.
OutlookSan Antonio’s fundamental economic strength and successful push for
additional growth create a positive and exciting outlook for the city’s future.
With Mayor Nirenberg promising the addition of 70k new jobs within two years,
a skyline being reinvented by innovative projects, and an increasing number of
innovative companies taking root in The River City, the office market continues
to perform admirably. The renewed focus on office development in the greater
CBD is exciting, and follows previous upgrades in area housing and amenities,
which is expected to continue even as suburban office development continues.
San Antonio’s unique blend of antiquity infused with modernism, business
friendly atmosphere, capable labor force, and world-class infrastructure
continue to allow the city to enjoy one of the most interesting and stable office
markets in the nation.
SAN ANTONIO OFFICE
$18.00
$19.00
$20.00
$21.00
$22.00
0
50,000
100,000
150,000
200,000
250,000
300,000
2013 2014 2015 2016 2017 2018
Net Absorption, SF Asking Rent, $ PSF
10%
12%
14%
16%
18%
2013 2014 2015 2016 2017 2018
Historical Average = 15%
Cushman & Wakefield | SACA
200 E. Grayson, Ste. 124
San Antonio, TX 78215
sacadvisors.com
For more information, contact:
Ben Kaplan, Analyst
Tel: +1 210 305 4281

San Antonio, TX Office Q4 2017
MARKETBEAT
cushmanwakefield.com
San Antonio, TX Office Q4 2017
MARKETBEAT
About Cushman & Wakefield Cushman & Wakefield is a leading global real estate services firm with 45,000 employees in more than 70 countries
helping occupiers and investors optimize the value of their real estate. Cushman & Wakefield is among the largest
commercial real estate services firms with revenue of $6 billion across core services of agency leasing, asset services,
capital markets, facility services (C&W Services), global occupier services, investment & asset management (DTZ
Investors), project & development services, tenant representation, and valuation & advisory. To learn more, visit
www.cushmanwakefield.com or follow @CushWake on Twitter.
Copyright © 2018 Cushman & Wakefield. All rights reserved. The information contained within this report is gathered
from multiple sources considered to be reliable. The information may contain errors or omissions and is presented
without any warranty or representations as to its accuracy.
Economic Indicators
Market Indicators (Overall, All Classes)
Overall Net Absorption/Overall Asking Rent
4-QTR TRAILING AVERAGE FOR BOTH
Overall Vacancy
Q4 16 Q4 17 12-Month
Forecast
San Antonio Employment 1,026k 1,056k
San Antonio Unemployment 3.9% 3.1%
U.S. Unemployment 4.7% 4.1%
Q4 16 Q4 17 12-Month
Forecast
Vacancy 12.1% 13.9%
YTD Net Absorption (sf) 1.1M 72K
Under Construction (sf) 596k 1.3M
Average Asking Rent* $21.00 $21.49
*Rental rates reflect gross asking $psf/year
Economy San Antonio continues to be one of the United States’ most stable regional
economies. In one year San Antonio added over 30,000 jobs, which is evidence
that San Antonio continues to benefit from its strategic geographic location, diverse
economy, and quality workforce. San Antonio continues to maintain one of the
lowest unemployment rates in the U.S. according to the Bureau of Labor Statistics
(BLS). Sustained employment growth was influenced by the healthcare,
leisure/hospitality, trade/transportation, and business service sector according to
data provided by the BLS Statistics. Financial institutions, bioscience, and
cybersecurity remain active, while high-tech and energy alternatives are
increasingly helping grow the San Antonio economy. Diversification of local jobs,
increased job growth, and low unemployment rates suggests that San Antonio's
increased economic activity will continue into 2018 as the City celebrates its 300th
anniversary.
Market Overview The theme for the San Antonio office market in 2017 was the construction of high-
end office product, new deliveries, and companies expanding into the San Antonio
market while existing companies expanded into upgraded space. This time last year
the San Antonio office market only had ±596k square feet (sf) under construction.
Currently more than 1.3 million sf is under construction and more than 600k sf of
speculative office product has come online, to include Landmark One (167,618 sf)
and One51 Office Center (101,562 sf). Much of the product under construction can
be attributed to the Frost Tower, a 460,000 sf state of the art office building in the
CBD, Silver Ventures ±350,000 sf office/retail space as part of the Pearl complex in
the River North area, and Project Tech, Port San Antonio’s 90,000 sf office building.
Local developer Hixon Properties announced this quarter that it is partnering with a
local family to build a six-story,125,000 sf, office building with 15,000 sf of retail on
Broadway near River North. This year some employers have announced new or
expanded operations in San Antonio. These companies include, Hulu’s opening of a
45,000 sf corporate office which will bring 500 jobs to NW San Antonio, TaskUs,
which serves start-up tech companies moved into two floors in CBD’s Finesilver
Building with plans to hire more than 500 people, and CaptureRx’s plan to relocate
its corporate headquarters and retain at least 314 full-time jobs at the San Antonio
Light Building, totaling over 48,000 sf in River North. This quarter, Security Service
Federal Credit Union completed its new 270,000 sf HQ. With new construction at an
all-time high and as more national tenants call San Antonio home, this is evidence
of developers looking to capitalize on the demand for quality office product, while
maintaining attractive rental rates.
Outlook The outlook for San Antonio’s office market remains positive, with the region’s office
tenants demonstrating an interest in higher quality office space and a willingness to
pay the associated higher rates. As the current wave of suburban development
ebbs, a new wave of growth in the greater CBD market is occurring in response to
cultural changes, all of which allow the City to provide the appropriate environment
for the creative class, the traditional executive user and call/service centers. Once
again, San Antonio’s business friendly atmosphere, skilled labor force and
welcoming culture welcomed new companies and allowed the city to maintain its
place among the top enterprising cities in the United States.
SAN ANTONIO OFFICE
$18.00
$19.00
$20.00
$21.00
$22.00
0
50,000
100,000
150,000
200,000
250,000
300,000
2013 2014 2015 2016 2017
Net Absorption, SF Asking Rent, $ PSF
10%
12%
14%
16%
18%
2013 2014 2015 2016 2017
Historical Average = 15%
Cushman & Wakefield | SACA
200 E. Grayson, Ste. 124
San Antonio, TX 78215
sacadvisors.com
For more information, contact:
Sergio Acosta, Associate
Tel: +1 210 305 4284
San Antonio, TX Office Q3 2017
MARKETBEAT
cushmanwakefield.com
Economic Indicators
Market Indicators (Overall, All Classes)
Overall Net Absorption/Overall Asking Rent
4-QTR TRAILING AVERAGE FOR BOTH
Overall Vacancy
Q3 16 Q3 17 12-Month
Forecast
San Antonio Employment 1,021K 1,042k
San Antonio Unemployment 3.8% 3.4%
U.S. Unemployment 4.9% 4.4%
Q3 16 Q3 17 12-Month
Forecast
Vacancy 14.7% 12.9%
YTD Net Absorption (sf) -15k 194K
Under Construction (sf) 465k 1.2M
Average Asking Rent* $21.22 $22.14
*Rental rates reflect gross asking $psf/year
Economy San Antonio continues to be one of the United States’ most stable regional
economies. In August, the Dallas Federal Reserve reported that the San
Antonio Business-Cycle Index expanded at a 4.3% annualized rate, which is
evidence that San Antonio continues to benefit from its strategic geographic
location, diverse economy, and quality workforce. This quarter, San Antonio
maintained one of the lowest unemployment rates in the U.S. according to
the Bureau of Labor Statistics (BLS). Sustained employment growth was
influenced by the healthcare, leisure/hospitality, trade/transportation, and
business service sector according to data provided by the BLS Statistics.
Financial institutions, bioscience, and cybersecurity remain active, while
high-tech and energy alternatives are increasingly helping grow the San
Antonio economy. Diversification of local jobs, increased job growth, and
low unemployment rates, bode well for an increasingly healthy San Antonio
economy for the rest of 2017.
Market Overview The San Antonio office market continues to show its vitality by closing Q3
2017 with average asking rents at a near all-time high of $22.14 per square
foot (psf) full service gross. Vacancy also continues to improve by declining
from 14.7% (Q3 2016) to 12.9% at the end of Q3 2017. New construction is
also at a near all-time high. This time last year the San Antonio office
market only had ±465k square feet (sf) under construction. Currently more
than 1.2 million sf is under construction and more than 400k sf of office
product has come online year to date, to include Landmark One and One51
Office Center. Much of the product under construction can be attributed to
the Frost Tower, a 460,000 sf state of the art office building in the CBD,
Silver Ventures ±350,000 sf office/retail space as part of the Pearl complex
in the River North area, and Project Tech, Port San Antonio’s 90,000 sf
office building. Recently some employers have announced new or expanded
operations in San Antonio. These companies include, Hulu’s opening of a
45,000 sf corporate office which will bring 500 jobs to NW San Antonio,
TaskUs, which serves start-up tech companies moved into two floors in
CBD’s Finesilver Building with plans to hire more than 500 people, and
CaptureRx’s plan to relocate its corporate headquarters and retain at least
314 full-time jobs at The Kress Building, totaling over 83,000 sf in San
Antonio’s Tech District, the western part of the CBD. Near the Tech District ,
the $175M project to revitalize San Pedro Creek also moved from the
abstract to reality. With new construction at an all-time high and as more
national tenants call San Antonio home, this is evidence of developers
looking to capitalize on the demand for quality office product, while
maintaining attractive rental rates.
Outlook The outlook for San Antonio’s office market is positive, with the region’s
office tenants demonstrating an interest in higher quality office space and a
willingness to pay the associated higher rates. As the current wave of
suburban development ebbs, a new wave of growth in the greater CBD
market is occurring in response to cultural changes, all of which allow the
City to provide the appropriate environment for the creative class, the
traditional executive user and call/service centers. Once again, San
Antonio’s business friendly atmosphere, skilled labor force and welcoming
culture allow the city to maintain its place among the top enterprising cities
in the United States.
SAN ANTONIO OFFICE
$18.00
$19.00
$20.00
$21.00
$22.00
0
50,000
100,000
150,000
200,000
250,000
300,000
2013 2014 2015 2016 2017
Net Absorption, SF Asking Rent, $ PSF
10%
12%
14%
16%
18%
2013 2014 2015 2016 2017
Historical Average = 15%
Copyright © 2017 Cushman & Wakefield. All rights reserved. The information contained within this report is gathered
from multiple sources considered to be reliable. The information may contain errors or omissions and is presented
without any warranty or representations as to its accuracy. Alliance firms are independently owned and operated.
Cushman & Wakefield | SACA
200 E. Grayson, Ste. 124
San Antonio, TX 78215
sacadvisors.com
For more information, contact:
Sergio Acosta, Associate
Tel: +1 210 305 4284

San Antonio, TX Office Q22017
MARKETBEAT
cushmanwakefield.com
Economic Indicators
Market Indicators (Overall, All Classes)
Overall Net Absorption/Overall Asking Rent
4-QTR TRAILING AVERAGE FOR BOTH
Overall Vacancy
Q2 16 Q2 17 12-Month
Forecast
San Antonio Employment 1012K 1035k
San Antonio Unemployment 3.7% 4.1%
U.S. Unemployment 4.9% 4.4%
Q2 16 Q2 17 12-Month
Forecast
Vacancy 15.4% 12.1%
YTD Net Absorption (sf) -2k 404K
Under Construction (sf) 300k 1.2M
Average Asking Rent* $20.50 $20.83
*Rental rates reflect gross asking $psf/year
Economy San Antonio closed out the first half of the year as one of the United States’
most stable regional economies. In June, the Dallas Federal Reserve
reported that the San Antonio Business-Cycle Index expanded at a 3.1%
annualized rate, which is evidence that San Antonio continues to benefit
from its strategic geographic location, diverse economy, and quality
workforce. This quarter, San Antonio maintained one of the lowest
unemployment rates in the U.S. according to the Bureau of Labor Statistics
(BLS). Sustained employment growth was influenced by the healthcare,
leisure/hospitality, trade/transportation, and business service sector
according to data provided by the BLS Statistics. Financial institutions,
bioscience, and cybersecurity remain active, while high-tech and energy
alternatives are increasingly helping grow the San Antonio economy.
Diversification of local jobs, increased job growth, and low unemployment
rates, bode well for an increasingly healthy San Antonio economy for the
second half of 2017. According to an article published by Brookings
Institution Metro Monitor report, San Antonio ranked as one of the fastest
recovering economies in the United States.
Market Overview The San Antonio office market closed the first half of the year with average
asking rents of $20.83 per square foot (psf) and vacancy declining from
15.4% (Q2 2016) to 12.1% this quarter. This time last year the San Antonio
office market only had ±300k square feet (sf) under construction.
Construction and new deliveries were the highlight of the first half of 2017,
as more than 1.2 million sf is currently under construction and more than
317,000 sf of office product came online, including Landmark One and
One51 Office Center. Much of the product under construction can be
attributed to the Frost Tower, a 460,000 SF state of the art office building in
the CBD, Silver Ventures ±350,000 SF office/retail space as part of the
Pearl complex in the River North area, and Project Tech, Port San Antonio’s
90,000 sf office building. This year some employers have announced new or
expanded operations in San Antonio. These companies include, Hulu’s
opening of a 45,000 SF center which would bring 500 jobs to NW San
Antonio and CaptureRx’s plan to relocate its corporate headquarters and
retain at least 314 full-time jobs at The Kress Building, totaling over 83,000
SF in San Antonio’s Tech District, the western part of the CBD. Not too far
from the Tech District the $175M project to revitalize San Pedro Creek also
moved from the abstract to reality. With new construction at an all-time high
and as more national tenants call San Antonio home this is evidence of
developers looking to capitalize on the demand for quality office product,
while maintaining attractive rental rates.
Outlook The outlook for San Antonio’s office market is positive, with the region’s
office tenants demonstrating an interest in higher quality office space and a
willingness to pay the associated higher rates. As the current wave of
suburban development ebbs, a new wave of growth in the greater CBD
market is occurring in response to cultural changes, all of which allow the
City to provide the appropriate environment for the creative class, the
traditional executive user and call/service centers. Once again San
Antonio’s business friendly atmosphere, skilled labor force and welcoming
culture allow the city to maintain its place among the top enterprising cities
in the United States.
SAN ANTONIO OFFICE
$18.00
$19.00
$20.00
$21.00
$22.00
0
50,000
100,000
150,000
200,000
250,000
300,000
2013 2014 2015 2016 2017
Net Absorption, SF Asking Rent, $ PSF
10%
12%
14%
16%
18%
2013 2014 2015 2016 2017
Historical Average = 15%
Copyright © 2017 Cushman & Wakefield. All rights reserved. The information contained within this report is gathered
from multiple sources considered to be reliable. The information may contain errors or omissions and is presented
without any warranty or representations as to its accuracy. Alliance firms are independently owned and operated.
Cushman & Wakefield | SACA
200 E. Grayson, Ste. 124
San Antonio, TX 78215
sacadvisors.com
For more information, contact:
Sergio Acosta, Associate
Tel: +1 210 305 4284

San Antonio, TX Office Q12017
MARKETBEAT
cushmanwakefield.com
Economic Indicators
Market Indicators (Overall, All Classes)
Overall Net Absorption/Overall Asking Rent
4-QTR TRAILING AVERAGE FOR BOTH
Overall Vacancy
Q1 16 Q1 17 12-Month
Forecast
San Antonio Employment 1009k 1031k
San Antonio Unemployment 3.8% 3.8%
U.S. Unemployment 5.0% 4.9%
Q1 16 Q1 17 12-Month
Forecast
Vacancy 15.1% 11.2%
YTD Net Absorption (sf) 184k 277K
Under Construction (sf) 396k 764k
Average Asking Rent* $20.25 $20.67
*Rental rates reflect gross asking $psf/year
Economy San Antonio entered 2017 as one of the United States’ most stable regional
economies. In February, the Dallas Federal Reserve reported that the San
Antonio Business-Cycle Index expanded at a 2.4% annualized rate, which is
evidence that San Antonio continues to benefit from its strategic geographic
location, diverse economy, and quality workforce. This quarter, San Antonio
maintained one of the lowest unemployment rates in the U.S. according to the
Bureau of Labor Statistics (BLS). Sustained employment growth was
influenced by the healthcare, leisure/hospitality, trade/transportation, and
business service sector according to data provided by the BLS Statistics.
Financial institutions, bioscience, and cybersecurity remain active, while high-
tech and energy alternatives are increasingly helping grow the San Antonio
economy. Diversification of local jobs, increased job growth, and low
unemployment rates, bode well for an increasingly healthy San Antonio
economy for 2017. According to an article published by the San Antonio
Business Journal, San Antonio ranks #8 among America’s most recession-
recovered large cities.
Market Overview The San Antonio office market started the year with average asking rents of
$20.67 per square foot (PSF) and vacancy declining from 15.1% (Q1 2016) to
11.2% this quarter. In 2016, San Antonio was in the midst of a ±1 MSF wave
of speculative development with asking rental rates at the highest levels ever
reported, which led to concerns about the ability to absorb these new
deliveries. However, market confidence rose as events unfolded and the San
Antonio office market proved it was ready to absorb the new inventory by
ending the year with positive absorption for four consecutive quarters. Last
year the office market experienced significant market shifts. In the Northwest
(NW) submarket USAA leased two buildings for a total of 286,000 square feet
(SF). In River North: San Antonio’s CPS Energy bought two office towers
totaling over 430,000 SF to serve as their new headquarters; GrayStreet
Partners purchased the 60,000 SF Light Building; and Silver Ventures
announced their plans to add ±350,000 SF office/retail space to the Pearl
complex in response to the growing demand for space in the River North area.
The western part of the CBD, known as the “Tech District”, has become a hub
for creative and tech oriented office space users. In the Tech District, Weston
Urban purchased the Milam Building with plans to renovate its 211,000 SF for
creative and tech businesses. This year, the anticipated Frost Tower, a
460,000 SF state of the art office building in the CBD, had its official kick off
for the construction of the $142M project. The $175M project to revitalize San
Pedro Creek also moved from the abstract to reality. Most recently, some
employers have announced new or expanded operations in San Antonio.
These companies include, Hulu’s opening of a 45,000 SF center which would
bring 500 jobs to NW San Antonio and CaptureRx’s plan to relocate its
corporate headquarters and retain at least 314 full-time jobs at The Kress
Building, totaling over 83,000 SF in San Antonio’s Tech District.
Outlook The outlook for San Antonio’s office market is positive, with the region’s office
tenants demonstrating an interest in higher quality office space and a
willingness to pay the associated higher rates. As the current wave of
suburban development ebbs, a new wave of growth in the greater CBD market
is occurring in response to cultural changes, all of which allow the City to
provide the appropriate environment for the creative class, the traditional
executive user and call/service centers. Once again San Antonio’s business
friendly atmosphere, skilled labor force and welcoming culture allow the city to
maintain its place among the top enterprising cities in the United States.
SAN ANTONIO OFFICE
$18.00
$19.00
$20.00
$21.00
$22.00
0
50,000
100,000
150,000
200,000
250,000
300,000
2013 2014 2015 2016 2017
Net Absorption, SF Asking Rent, $ PSF
10%
12%
14%
16%
18%
2013 2014 2015 2016 2017
Historical Average = 15%
Copyright © 2016 Cushman & Wakefield. All rights reserved. The information contained within this report is gathered
from multiple sources considered to be reliable. The information may contain errors or omissions and is presented
without any warranty or representations as to its accuracy. Alliance firms are independently owned and operated.
Cushman & Wakefield | SACA
200 E. Grayson, Ste. 124
San Antonio, TX 78215
sacadvisors.com
For more information, contact:
Sergio Acosta, Associate
Tel: +1 210 305 4284

San Antonio, TX Office Q4 2016
MARKETBEAT
cushmanwakefield.com
Economic Indicators
Market Indicators (Overall, All Classes)
Overall Net Absorption/Overall Asking Rent
4-QTR TRAILING AVERAGE FOR BOTH
Overall Vacancy
Q4 15 Q4 16 12-Month
Forecast
San Antonio Employment 992k 1,007k
San Antonio Unemployment 3.9% 4.0%
U.S. Unemployment 5.0% 4.8%
Q4 15 Q4 16 12-Month
Forecast
Vacancy 14.5% 12.1%
YTD Net Absorption (sf) 245k 1.1M
Under Construction (sf) 372k 596k
Average Asking Rent* $20.33 $21.00
*Rental rates reflect gross asking $psf/year
Economy Year-to-date, San Antonio experienced an annualized 1.8% increase in
job growth, according to the DallasFed. In November, San Antonio
maintained one lowest unemployment rates in the U.S. according to the
Bureau of Labor Statistics (BLS). Sustained employment growth was
contributed by the healthcare, leisure/hospitality, trade/transportation,
and business service sector according to data provided by the BLS
Statistics. Financial institutions, bioscience, and cybersecurity remain
important, while high-tech and energy alternatives are increasingly
helping power the San Antonio economy. Diversification of local jobs,
increased job growth, and low unemployment rates, bodes well for an
increasingly healthy San Antonio economy going into 2017.
Market Overview The San Antonio office market ended the year with average asking rents
of $21.00 per square foot (PSF) and net absorption totaling nearly 1.1
million square feet (MSF), producing positive absorption in every quarter
of the year. Entering 2016, San Antonio was in the midst of a ±1 MSF
wave of speculative development with asking rental rates at the highest
levels ever reported, which led to concerns about the ability to absorb
these new deliveries. However, market confidence rose as events
unfolded, including: USAA’s leasing all of Vista Corporate Center and
WestRidge Two, both recently completed projects in Northwest (NW)
submarket totaling 286,000 square feet (SF); One51 Office Center in Far
West San Antonio leasing to 75% occupancy soon after completion and
leading the developer to move forward with Phase II plans. In other
substantial market shifts, San Antonio’s CBD experienced several
material events including: San Antonio’s electric utility, CPS Energy,
bought two dormant office towers at 500/530 McCullough totaling over
430,000 SF to serve as their new headquarters and; Weston Urban
bought the historic Milam Building with plans to renovate its 211,000 SF
of office space to apartments with first floor retail. These two events
removed over 500,000 SF from the office market and the Milam Building
conversion is an example of the rise of the western CBD, which follows
the successful rebirth of the Rand Building and anticipates the new Frost
Bank Tower and the San Pedro Creek improvements fully underway in
2017. In River North, GrayStreet Partners purchased the 60,000-SF
Light Building with renovation plans aimed at creative and tech oriented
office space users and Silver Ventures announced a new office/retail
development at the Pearl, totaling ±350,000 SF.
Outlook The outlook for San Antonio’s office market is positive, with the region’s
office tenants demonstrating an interest in higher quality office space
and a willingness to pay the associated higher rates. As the current
wave of suburban development ebbs, a new wave of growth in the
greater CBD market is occurring in response to cultural changes, all of
which allow the City to provide the appropriate environment for the
creative class, the traditional executive user and call/service centers.
Once again San Antonio’s business friendly atmosphere, skilled labor
force and welcoming culture allow the city to maintain its place among
the top enterprising cities in the United States.
SAN ANTONIO OFFICE
$18.00
$19.00
$20.00
$21.00
$22.00
0
50,000
100,000
150,000
200,000
250,000
300,000
2013 2014 2015 2016
Net Absorption, SF Asking Rent, $ PSF
12%
14%
16%
18%
2013 2014 2015 2016
Historical Average = 15%
Copyright © 2016 Cushman & Wakefield. All rights reserved. The information contained within this report is gathered
from multiple sources considered to be reliable. The information may contain errors or omissions and is presented
without any warranty or representations as to its accuracy. Alliance firms are independently owned and operated.
Cushman & Wakefield | SACA
200 E. Grayson, Ste. 124
San Antonio, TX 78215
sacadvisors.com
For more information, contact:
Sergio Acosta, Associate
Tel: +1 210 305 4284

San Antonio, TXOffice Q3 2016
MARKETBEAT
cushmanwakefield.com
Economic Indicators
Market Indicators (Overall, All Classes)
Overall Net Absorption/Overall Asking Rent
4-QTR TRAILING AVERAGE FOR BOTH
Overall Vacancy
Q3 15 Q3 1612-Month
Forecast
San Antonio Employment 983k 1,001k
San Antonio Unemployment 3.8% 3.7%
U.S. Unemployment 5.2% 4.9%
Q3 15 Q3 1612-Month
Forecast
Vacancy 15.1% 14.7%
Net Absorption (sf) 84k -15k
Under Construction (sf) 572k 465k
Average Asking Rent* $20.82 $21.22
*Rental rates reflect gross asking $psf/year
EconomyMaking the turn into late 2016 San Antonio is persistently viewed
as one of the United States’ most stable regional economies.
Unemployment remains at a historical low level. San Antonio will
add net new jobs of between 22,300 - 27,300 for 2016, according
to SABÉR Research Institute. Earlier this year, a research survey
funded by major employers and tech industry groups counted
more than 34,000 IT workers in the region. Can San Antonio
aspire to a future as a widely recognized technology hub?
Several high-profile office and multifamily projects under
development or announced in the CBD would help position San
Antonio’s downtown core to accommodate such a shift. As
reported by the San Antonio Express-News, USAA next year will
relocate 100 employees primarily in technology, research and
development, and digital capabilities to its downtown base at 700
North Saint Mary’s Street. Business services, customer services,
and health and human services are driving job growth in greater
San Antonio, stated a Comerica Bank chief economist at a
function attended by local media, while general determent from
investing in oil and gas continues. Meanwhile, the homebuilding
and commercial building sectors are extremely active.
Market OverviewBy year-end, the suburban office market will add at least 1 million
square feet (SF) of new product developed on a speculative
basis and less than two years old. San Antonio’s second-largest
employer, USAA, announced late in Q3 it would lease two
recently completed projects in Northwest, taking a lion share of
the submarket’s growing inventory of vacant new, high-rent office
inventory. The new occupancies by USAA total 286,000 SF. The
prior quarter leasing activity was revised upwards to 386,000 SF.
OutlookThe outlook for San Antonio’s office market appears positive. As
evidenced by the region’s economic stability and sustained
occupancy and rental growth in the office market, new projects
and those soon to hit the market will be positioned to serve
tenants that require best-quality office space in good locations.
SAN ANTONIO OFFICE
$18.00
$19.00
$20.00
$21.00
$22.00
0
50,000
100,000
150,000
200,000
2013 2014 2015 2016
Net Absorption, SF Asking Rent, $ PSF
12%
14%
16%
18%
2013 2014 2015 2016
Historical Average = 15%
Cushman& Wakefield | SACA
200 E. Grayson, Ste. 124
San Antonio, TX 78215
sacadvisors.com
For more information, contact:
Sergio Acosta, Associate
Tel: +1 210 305 4284
Copyright © 2016 Cushman & Wakefield. All rights reserved. The information contained within this report is gathered
from multiple sources considered to be reliable. The information may contain errors or omissions and is presented
without any warranty or representations as to its accuracy. Alliance firms are independently owned and operated.

Office Snapshot 2Q 2016San Antonio, TX
MARKETBEAT
www.cushmanwakefield.comCopyright © 2016 Cushman & Wakefield. All rights reserved. The information contained within this report is gathered from mult iple sources considered
to be reliable. The information may contain errors or omissions and is presented without any warranty or representations as to its accuracy. Alliance
firms are independently owned and operated.
Economic Indicators
Market Indicators (Overall, All Classes)
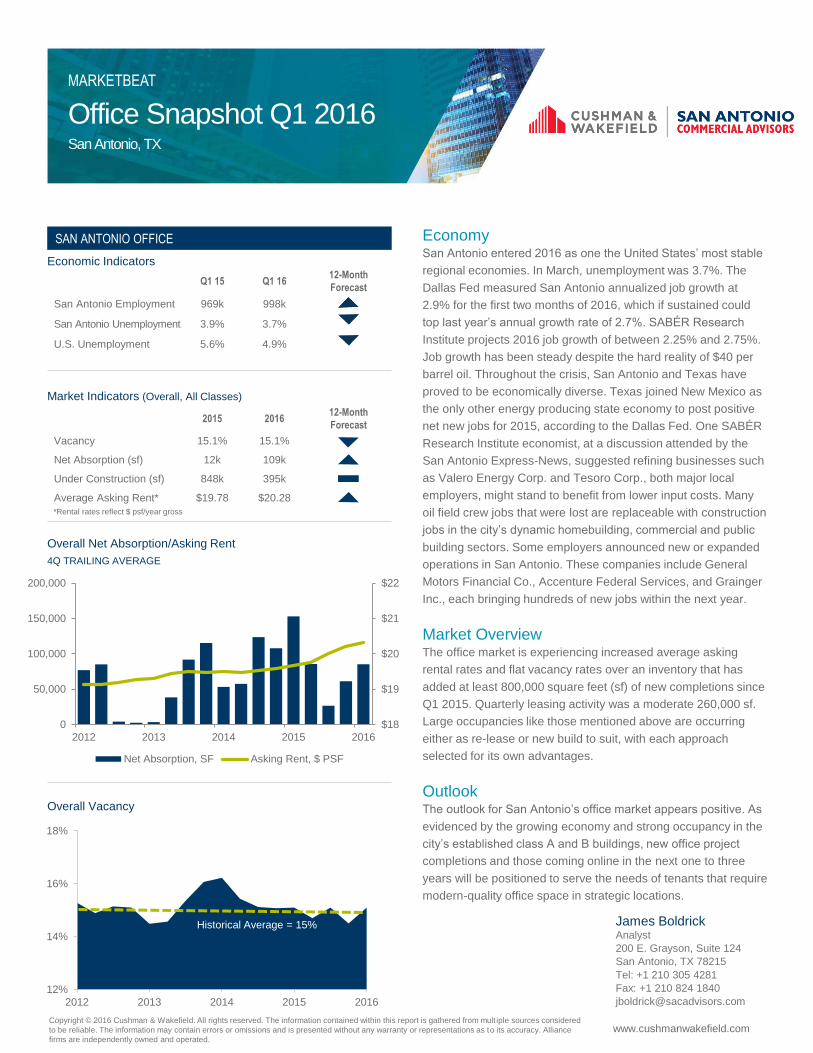
Overall Net Absorption/Asking Rent
4Q TRAILING AVERAGE FOR BOTH
Overall Vacancy
EconomySan Antonio at the midpoint of 2016 was one the United States’
most stable regional economies. The second quarter average
unemployment rate was 3.6%. In May, annualized job growth
accelerated to 4.7%. Dallas Fed researchers noted this was the
best result reported among all Texas metros. A research survey
funded by major employers and tech industry groups highlighted
the local impact of IT jobs. There are 34,000 IT workers in the
region, and approximately 9,700 of these are federal employees
and federal contractors engaged in IT security or other functions.
New data described an energy industry still in retrenchment. An
economist with a Texas energy industry association estimated
one-third of Texas oil and gas workers had been laid off since
2014, and IHS Energy said across North America, 60% of field
workers involved in fracking had been laid off. Elsewhere, the
city’s dynamic homebuilding, commercial and public building
sectors are boosting job growth. Some employers announced
workforce expansions. These companies include General Motors
Financial Co., Accenture Federal Services, and Kohl’s
Department Stores. Kohl’s is hiring 300 new permanent and
seasonal workers to staff its customer service operations center,
which previously employed 950.
Market OverviewThe office market experienced increased average asking rental
rates and relatively flat vacancy with an inventory that added at
least 850,000 square feet (SF) of new building completions since
1Q15. Quarterly leasing activity was a moderate 240,000 SF
while leasing activity for the prior quarter was revised upwards to
360,000 SF. Large occupancies like those mentioned above are
occurring either as re-lease or new build-to-suit projects, with
each approach selected for its own advantages.
OutlookThe outlook for San Antonio’s office market appears positive. As
evidenced by the growing economy and strong occupancy and
rental growth in the city’s established Class A and B buildings,
new office projects and those hitting the market in the next two to
three years will be positioned to welcome tenants that require
modern-quality office buildings in strategic locations.
2Q 15 2Q 1612-Month
Forecast
San Antonio Employment 976k 1.00M
San Antonio Unemployment 3.8% 3.6%
U.S. Unemployment 5.4% 4.9%
2Q 15 2Q 1612-Month
Forecast
Vacancy 14.7% 15.4%
Net Absorption (sf) -19k -2k
Under Construction (sf) 465k 300k
Average Asking Rent* $19.87 $20.50
12%
14%
16%
18%
2012 2013 2014 2015 2016
SAN ANTONIO OFFICE
Historical Average = 15%
$18
$19
$20
$21
$22
0
50,000
100,000
150,000
200,000
2013 2014 2015 2016
Net Absorption, SF Asking Rent, $ PSF
James BoldrickAnalyst
200 E. Grayson, Suite 124
San Antonio, TX 78215
Tel: +1 210 305 4281
Fax: +1 210 824 1840
*Rental rates reflect $ psf/year gross
Office Snapshot Q1 2016 San Antonio, TX
MARKETBEAT
www.cushmanwakefield.com Copyright © 2016 Cushman & Wakefield. All rights reserved. The information contained within this report is gathered from mult iple sources considered
to be reliable. The information may contain errors or omissions and is presented without any warranty or representations as to its accuracy. Alliance
firms are independently owned and operated.
Economic Indicators
Market Indicators (Overall, All Classes)
Overall Net Absorption/Asking Rent
4Q TRAILING AVERAGE
Overall Vacancy
Economy San Antonio entered 2016 as one the United States’ most stable
regional economies. In March, unemployment was 3.7%. The
Dallas Fed measured San Antonio annualized job growth at
2.9% for the first two months of 2016, which if sustained could
top last year’s annual growth rate of 2.7%. SABÉR Research
Institute projects 2016 job growth of between 2.25% and 2.75%.
Job growth has been steady despite the hard reality of $40 per
barrel oil. Throughout the crisis, San Antonio and Texas have
proved to be economically diverse. Texas joined New Mexico as
the only other energy producing state economy to post positive
net new jobs for 2015, according to the Dallas Fed. One SABÉR
Research Institute economist, at a discussion attended by the
San Antonio Express-News, suggested refining businesses such
as Valero Energy Corp. and Tesoro Corp., both major local
employers, might stand to benefit from lower input costs. Many
oil field crew jobs that were lost are replaceable with construction
jobs in the city’s dynamic homebuilding, commercial and public
building sectors. Some employers announced new or expanded
operations in San Antonio. These companies include General
Motors Financial Co., Accenture Federal Services, and Grainger
Inc., each bringing hundreds of new jobs within the next year.
Market Overview The office market is experiencing increased average asking
rental rates and flat vacancy rates over an inventory that has
added at least 800,000 square feet (sf) of new completions since
Q1 2015. Quarterly leasing activity was a moderate 260,000 sf.
Large occupancies like those mentioned above are occurring
either as re-lease or new build to suit, with each approach
selected for its own advantages.
Outlook The outlook for San Antonio’s office market appears positive. As
evidenced by the growing economy and strong occupancy in the
city’s established class A and B buildings, new office project
completions and those coming online in the next one to three
years will be positioned to serve the needs of tenants that require
modern-quality office space in strategic locations.
Q1 15 Q1 16 12-Month
Forecast
San Antonio Employment 969k 998k
San Antonio Unemployment 3.9% 3.7%
U.S. Unemployment 5.6% 4.9%
2015 2016 12-Month
Forecast
Vacancy 15.1% 15.1%
Net Absorption (sf) 12k 109k
Under Construction (sf) 848k 395k
Average Asking Rent* $19.78 $20.28
12%
14%
16%
18%
2012 2013 2014 2015 2016
SAN ANTONIO OFFICE
Historical Average = 15%
$18
$19
$20
$21
$22
0
50,000
100,000
150,000
200,000
2012 2013 2014 2015 2016
Net Absorption, SF Asking Rent, $ PSF
James Boldrick Analyst
200 E. Grayson, Suite 124
San Antonio, TX 78215
Tel: +1 210 305 4281
Fax: +1 210 824 1840
*Rental rates reflect $ psf/year gross

Office Snapshot Q4 2015 San Antonio, TX
MARKETBEAT
www.cushmanwakefield.com Copyright © 2015 Cushman & Wakefield. All rights reserved. The information contained within this report is gathered from mult iple sources considered
to be reliable. The information may contain errors or omissions and is presented without any warranty or representations as to its accuracy. Alliance
firms are independently owned and operated.
Economic Indicators
Market Indicators (Overall, All Classes)
Overall Net Absorption/Asking Rent
4Q TRAILING AVERAGE
Overall Vacancy
Economy San Antonio is continuing to march ahead as one of Texas’ and
the United States’ most stable regional economies. Financial
institutions, life sciences, manufacturing, and transport remain
vital, while high-tech and energy alternatives are picking up
tempo. The city’s defense cyber security commands, research
institutions, and entrepreneurial class are the keys to growth in
the high-tech sector. The Dallas Fed gauged San Antonio job
growth at 3.6% for the year through November 2015, which
would match the previous year’s growth rate. Overall job growth
has stayed on pace despite a prolonged price collapse in oil and
gas markets. Sustained employment growth was contributed by
the healthcare, leisure/hospitality, and professional/business
services sectors this year, one Dallas Fed economist told the
San Antonio Express-News. Commercial contracting businesses
also expressed high employer confidence due to public and
private construction projects on the horizon. Toyota, Microsoft,
and GM Financial were among the companies that announced
plans for large workforce additions in 2015. Unemployment was
3.5% in December, according to the Bureau of Labor Statistics.
Market Overview The office market is experiencing lower vacancy rates and
increased average asking rental rates from one year ago. In the
far north and far west suburbs, increased asking rents and stable
or strengthened occupancy reflected the completion of new office
developments and elevated leasing activity. The class A
suburban office market added at least 600,000 square feet (sf) of
completed new inventory in 2015. The first major downtown
office development since the 1980s, a 400,000-sf tower, is
expected to start construction in 2016.
Outlook The outlook for San Antonio’s office market appears positive. As
evidenced by the growing economy and strong occupancy in the
city’s established class A and B buildings, new office project
completions and those coming online in the next one to two
years will be positioned to serve the needs of tenants that require
modern-quality office space in newer locations.
Q4 14 Q4 15 12-Month
Forecast
San Antonio Employment 960k 993k
San Antonio Unemployment 4.1% 3.5%
U.S. Unemployment 5.7% 5.0%
2014 2015 12-Month
Forecast
Vacancy 15.1% 14.5%
Net Absorption (sf) 432k 245k
Under Construction (sf) 530k 372k
Average Asking Rent* $19.61 $20.33
12%
14%
16%
18%
2012 2013 2014 2015
SAN ANTONIO OFFICE
Historical Average = 15%
$18
$19
$20
$21
$22
0
50,000
100,000
150,000
200,000
2012 2013 2014 2015
Net Absorption, SF Asking Rent, $ PSF
James Boldrick Analyst
200 E. Grayson, Suite 124
San Antonio, TX 78215
Tel: +1 210 305 4281
Fax: +1 210 824 1840
*Rental rates reflect $ psf/year gross

Office Snapshot Q3 2015San Antonio
MARKETBEAT
www.cushmanwakefield.comCopyright © 2015 Cushman & Wakefield. All rights reserved. The information contained within this report is gathered from mult iple sources considered
to be reliable. The information may contain errors or omissions and is presented without any warranty or representations as to its accuracy. Alliance
firms are independently owned and operated.
Economic Indicators
Market Indicators
Net Absorption/Asking Rent
4Q TRAILING AVERAGE
Overall Vacancy
EconomySan Antonio is continuing to drive ahead as one of Texas’ and
the United States’ economic frontrunners. Financial institutions,
lifesciences, manufacturing, and transport remain important,
while high-tech and energy alternatives are increasingly helping
power the region’s economic engine. The construction of solar
farms and manufacture of solar panel parts and LEDs have
made San Antonio a pioneering market in the use of new energy
sources. The city’s national defense and cybersecurity
commands, research universities, and homegrown tech
companies are forming a cogent high-tech economy and culture.
In August, unemployment was 3.6% according to the Bureau of
Labor Statistics, or a flat 3.5% as recorded by the Dallas Fed. In
any case, San Antonio has been relatively insulated from
changes felt across the U.S. as a result of depressed crude
prices. In a recently published analysis, the Dallas Fed noted that
real wage growth for the year ending last March 31 was 6.8%,
compared with 5.4% for Texas and 4.1% for the U.S.
Market OverviewThe office market experienced increased average asking rental
rates and flatter vacancy rates from one year ago. In the far north
and far west suburbs, increased asking rents and stable
occupancy reflected the completion of new office developments
and elevated leasing activity. Direct asking rents at class A
buildings outside of the CBD stood at $23.50 per square foot.
This market will have added at least 600,000 square feet (sf) of
completed new inventory by year end. Development updates this
quarter for the new, 400,000-sf downtown office tower included
the announcement of a world-renowned building architect for the
project. It is scheduled to start construction in 2016.
OutlookThe outlook for San Antonio’s office market appears positive.
Evident from the growing economy and strong occupancy in the
city’s established class A and B buildings, new office projects
coming online in 2015 and 2016 are already positioned to meet
the needs of tenants that demand modern, high-quality office
space in desirable locations.
Q3 14 Q3 1512-Month
Forecast
San Antonio Employment 951k 980k
San Antonio Unemployment 4.4% 3.6%
U.S. Unemployment 6.1% 5.1%
Q3 14 Q3 1512-Month
Forecast
Overall Vacancy 15.1% 15.1%
Net Absorption 319k 84k
Under Construction 891k 572k
Overall Average Asking
Rent$19.79 $20.82
12.0%
14.0%
16.0%
18.0%
2012 2013 2014 2015 Q32015
SAN ANTONIO OFFICE
Historical Average = 15%
$18
$19
$20
$21
$22
0
50,000
100,000
150,000
200,000
2012 2013 2014 Q3 2015
Net Absorption, SF Asking Rent, $ PSF
James BoldrickAnalyst
200 E. Grayson, Suite 124
San Antonio, TX 78215
Tel: +1 210 305 4281
Fax: +1 210 824 1840

San Antonio Commercial Advisors
200 E. Grayson, Suite 124
San Antonio, TX 78215
www.cushmanwakefield.com/knowledge
For more information, contact:
James Boldrick, Analyst
+1(210) 305-4281
The market terms and definitions in this report are based on NAIOP standards. No warranty or
representation, express or implied, is made to the accuracy or completeness of the information contained
herein, and same is submitted subject to errors, omissions, change of price, rental or other conditions,
withdrawal without notice, and to any special listing conditions imposed by our principals.
© 2015 Cushman & Wakefield, Inc. All rights reserved.
ECONOMIC OVERVIEW
Entering 2015 as a city with reinforced job growth
and human capital, San Antonio continues to
maintain velocity as one of Texas’ and the nation’s
economic frontrunners. The region has benefited
from an increased flow of investment in tech,
lifesciences, national defense, cybersecurity, manufacturing, and transport.
The development of new energy sources like solar farms and the
manufacturing of solar panel parts and LEDs are diversifying factors in the
economy here. In the tech sector, local talent incubated at universities,
tech companies, and the area’s major defense installations is starting to
form a cogent economy and culture. In June, unemployment in the region
notched 3.5% for its lowest rate since the 1990s. Falling commodity prices
in 2014 forced oil and gas producers, a significant factor in Texas’
economy, to reduce workforce and capital spending. However, San
Antonio’s economy has remained relatively insulated from these events.
Through May, San Antonio’s year-to-date employment growth rate was
1.5 percentage point more than that of Texas. Construction led all
sectors with 10.0% annualized employment growth in the three months
ending May 31, followed by financial activities at 7.9%. Insurance services
as a component of the financial sector added jobs at a robust 8.8%,
according to the Dallas Fed’s San Antonio Economic Indicators report
published in June. Still, an increasingly important driver for Texas’
economy is the tech sector, with companies selecting to locate in Texas
over other regions of the country that share similar access to highly-
educated labor pools and top-tier research institutions. CCIM Institute
recognized San Antonio as one of the few cities to receive an “A” score
in its June-released U.S. Metropolitan Economic Outlook report. With
strong economic indicators, San Antonio remains one of the most
attractive markets in the nation.
OFFICE MARKET
Overall, the San Antonio office market experienced decreased vacancy
rates and increased average asking rental rates from one year ago. Class A
office inventory in the CBD was stable reflecting a direct vacancy rate of
9.5%, a modest increase from one year ago. In the same submarket and
quality class, average direct asking rental rates increased to $25.23 per
square foot (psf) from $24.35 psf last year. With the class A office market
outside the CBD adding new buildings to absorb the demand of San
Antonio’s growing corporate office user base, the Far North Central and
Far Northwest submarkets will gain more than 600,000 square feet (sf) of
new, speculative, non-medical office product by year-end.
DOWNTOWN
The CBD is again becoming a focal point for real estate investment in the
market. A new, 400,000-sf downtown office tower, the first such project
in 30 years, cleared a political hurdle and is soliciting proposals from
experienced building architects and leasing teams. A world-class
performing arts center, completed in 2014, has turned into a major
cultural asset. In July, UNESCO designated the Spanish missions as a
World Heritage site. Other projects generating interest are the World’s
Fair grounds redevelopment and a proposed linear park. Along the San
Antonio River, several large scale hospitality developments are nearing
completion or are emerging from conceptual stages. With an expanding
economy and renewed interest in downtown as a work/play environment,
private capital will continue to identify more opportunities in the CBD.
OUTLOOK
The outlook for San Antonio’s office market appears positive and able to
absorb the new construction availabilities coming online in the next year
and beyond. These buildings are expected to satisfy user preferences for
modern, high-quality office product. An expanded inventory of class A
office space will combine with existing educational, cultural, and transit
infrastructure assets to serve the needs of a growing economic base.
STATS ON THE GO
Q2 2014 Q2 2015
Y-O-Y CHANGE
12 MONTH FORECAST
Overall Vacancy 15.4% 14.7% -0.7 pp
Direct Asking Rents (psf/yr) $19.61 $20.08 2.4%
YTD Leasing Activity (sf) 1,096,976 553,378 -49.6%
DIRECT RENTAL VS. VACANCY RATES
10.0%
12.0%
14.0%
16.0%
18.0%
$10.00
$13.00
$16.00
$19.00
$22.00
2011 2012 2013 2014 Q2 2015
psf/yr
DIRECT GROSS RENTAL RATE DIRECT VACANCY RATE
Q2 2015 SAN ANTONIO, TX
OFFICE SNAPSHOT MARKETBEAT
A Cushman & Wakefield Research Publication

San Antonio Commercial Advisors
200 E. Grayson, Suite 124
San Antonio, TX 78215
www.cushmanwakefield.com/knowledge
For more information, contact:
James Boldrick, Analyst
+1(210) 305-4281
The market terms and definitions in this report are based on NAIOP standards. No warranty or
representation, express or implied, is made to the accuracy or completeness of the information contained
herein, and same is submitted subject to errors, omissions, change of price, rental or other conditions,
withdrawal without notice, and to any special listing conditions imposed by our principals.
© 2015 Cushman & Wakefield, Inc. All rights reserved.
ECONOMIC OVERVIEW
Entering 2015 as a city with reinforced job growth
and human capital, San Antonio continues to keep
pace as one of Texas’ and the nation’s economic
frontrunners. The region has benefited from an
increased flow of investment in energy, tech, cyber-
security, national defense, biosciences, and real estate. The development of
new energy sources like solar farms and the manufacturing of solar panel parts
are factors in the diversification of local industries. The tech sector continues
to benefit from the expertise of new entrepreneurs with a background in the
area’s major military and defense installations, where private cybersecurity and
other contracting businesses also serve a healthy market for sales of new
technologies. In February, San Antonio experienced an eight-year low
unemployment rate of 3.8%. The oil and gas industry, a significant factor in
Texas’ economy, entered a slowdown period in 2014 as a result of falling
commodity prices worldwide. The Texas Railroad Commission forecast that
the state’s record crude production volumes will level out in the second
quarter of this year. Oil exploration and production companies announced
reductions in workforce and capital spending. However, San Antonio’s
economy has remained relatively insulated from these events. In February, San
Antonio notched a 5.9% annualized employment growth rate, far outpacing
that of Texas at 1.3%. For the three months ending February 28, construction
led all sectors with 17.2% annualized employment growth, followed by
professional, scientific, and technical services at 6.2%. Financial and insurance
services also added a robust number of new jobs, according to the Dallas
Fed’s San Antonio Economic Indicators report published in April 2015. An
increasingly important driver for Texas’ economy has been the proliferation of
the tech sector, with companies opting to locate in Texas over other regions
of the country with similar access to highly-educated labor pools and top-tier
research institutions. In January, Milken Institute ranked San Antonio 10th in
the nation in its analysis of the Best-Performing Cities for economic growth
prospects. CCIM also recognized San Antonio as one of the few cities to
receive an “A” score in its most recent quarterly U.S. Metropolitan Economic
Outlook report. With uniform strong economic indicators, San Antonio
remains one of the most attractive markets in the nation.
OFFICE MARKET
Overall, the San Antonio office market experienced decreased vacancy rates
and increased asking average rental rates from one year ago. By class, class A
office inventory reported the largest decrease in vacancy rates by 1.8
percentage point and increase in average direct rental rates to $23.75 per
square foot. With the class A office market tightening to absorb the demand
of San Antonio’s expanding corporate office user base, the North Central and
Northwest submarkets will see more than 400,000 square feet (sf) of new,
speculative, non-medical office product delivered by the end of this year.
DOWNTOWN
The CBD continues to be a focus for real estate investment as well as new
office occupancies and a strong lease renewal rate. In the last year, separate
private and institutional investor purchases of two of the largest downtown
office buildings, one more than 500,000 sf and the other more than 250,000 sf,
signaled the viability of the urban core. A new 400,000-sf downtown office
tower, the first such project in 25 years, is also proposed. A world-class
performing arts center, opened in 2014, has become a major cultural asset.
Other projects attracting interest are the redevelopment of an underutilized
former World’s Fair site and a proposed linear park along an inner-city
waterway. Along the San Antonio River, several large scale hospitality
developments are nearing completion or emerging from conceptual stages.
With an expanding economy, the commitment of a pro-business city hall and
renewed interest in downtown as a work/play environment, private capital will
continue to flow in as developers find new opportunities in the CBD.
OUTLOOK
The outlook for San Antonio’s office market appears positive and ready to
absorb the stream of new construction availabilities coming online in the next
two years. These buildings promise to satisfy user preferences for modern,
high-quality office product. An expanded inventory of class A office space
options will combine with existing educational, cultural, and transit
infrastructure assets to serve the needs of a growing economic base.
STATS ON THE GO
Q1 2014 Q1 2015
Y-O-Y CHANGE
12 MONTH FORECAST
Overall Vacancy 16.2% 14.8% -1.4pp
Direct Asking Rents (psf/yr) $19.58 $19.80 +1.1%
YTD Leasing Activity (sf) 356,896 229,624 -35.7%
DIRECT RENTAL VS. VACANCY RATES
10.0%
12.0%
14.0%
16.0%
18.0%
$10.00
$13.00
$16.00
$19.00
$22.00
2011 2012 2013 2014 Q1 2015
psf
/yr
DIRECT GROSS RENTAL RATE DIRECT VACANCY RATE
Q1 2015 SAN ANTONIO, TX
OFFICE SNAPSHOT MARKETBEAT
A Cushman & Wakefield Research Publication