mark iii results from w-ear* - slac national … · mark iii results from w-ear* - walter toki...
TRANSCRIPT

SLAGPUP- November 1983 Pm
MARK III RESULTS FROM W-EAR* -
Walter Toki Stanford Linear Accelerator Center
Stanford University, Stanford, California 94305
Talk presented for the MARK III Collaborationt
_ I ABSTRACT I
First results from the MARK III detector at SPEAR, are presented based on 2.7 million J/tc, decays. The t,qc is observed in three modes, J/$ + qqc,
(9c ---, PP, ?lr+n-, and $4). Using the & mode, the qc spin-parity is determined to be O-. The known radiative J/+ decays J/t,b + rf(/ + ?r+n-), +yq’(rj -+
v”, ??n+o, rf’(f -+ K+K-), @(0 + Kii), and ~L(L + nK@ are observed and their branching ratios found to be in agreement with previous measurements. In the J/$ + qK+K- mode a new state is observed at 2.22 GeV, and in the J/+ + 77~’ and rq~+n- modes evidence for new structures near 1.4 GeV is presented.
* Work supported in part by the Department of Energy, contracts DE-AC03-76ER01195, DE AMO3-76SFOOO34 and DEACO3-81ER40050. t members of the MARK III Collaboration are R. M. Baltrusaitis, D. Coffman, J. Hauser, D. G. Hitlin, J. D. Richman, J. J. Russell, and R. H. Schindler, California InstiMe of Technology, K. 0. Bunnell, R. E. C&sell, D. H. Coward, K. F. Einsweiler, D. P. Hutchinson, L. Moss, R. F. Mozley, A. Odian, J. R. Roehrig, W. Toki, Y. Unno, F. Villa, N. Wermes, and D. E. Wisinski, Sfonford Linear Accelerator Center, H. L. Bledsoe, D. E. Do&n, R. Fabrizio, F. Grancagnolo, R. P. Hamilton, C. A. Heusch, J. Perrier, H. F. Sadrozinski, T. L. Schalk, A. Seiden, and D. B. Smith, Llniuertiity of California at Sonto Cruz; J. J. Becker, G. T. Blaylock, H. Cui, B. Eisenstein, G. Gladding, S. A. Plaetzer, A. L. Spadafora, J. J. Thaler, A. Wattenberg, and W. J. Wisniewski, Clniveraity of Illinois, Champaign-Urbono; J. S. Brown, T. H. Burnett, V. Cook, C. Del Papa, A. L. Duncan, P. M. Mockett, A. Nappi, J. C. Sleeman, and H. J. Willutzki, Uniuertiity of Washington, Seattle.
Presented at the 11th SLAC Summer Institute on Particle Physics t Stanford, California, July B-29, 1983 -
-1

1. Introduction
The SPEAR energy range, explored noti for over a decade, has an enormous _ - amount of physics remaining to be studied in both strong and weak interactions. Since the Crystal Ball and MARK II discoveries of new J/11, radiative decays the area has become very topical in strong interaction physics. QCD suggests that J/+‘s radiatively decay to two gluons and these gluons may form bound states or glueballs. This has generated a large amount of theoretical interest. In weak interactions, because the charged and neutral D lifetimes appear to be different, there has been considerable interest in understanding why the naive weak spectator models fail to explain this difference. Since MARK III will have a larger data sample than obtained by MARK II, there may be unexpected results, possibly as exciting as those in kaon physics. It may also prove as interesting to examine with large statistics as are decays of r’s, F’s, qlf’s, and AC%.
_ , 1
MARK III is a general purpose magnetic solenoidal detector that was installed in the west pit at SPEAR in July 1981. The initial checkout was completed in the fall of 1981 and the first data run was done at the J/$J in the spring of 1982. This was followed in the fall of 1982 by running at the T)“. In the spring of 1983 the first half of the running was again devoted to running at the J/$, accumulating a total (1982+1983) of 2.7 X lo6 produced J/q decays. During the second half a run at the tin allowed the accumulation of a total (1982+1983)
integrated luminosity of - 5800 nb-’ or -45,000 produced DD pairs.
This report will describe the detector hardware, the performance of the de- tector on known J/$ decays, and will finally discuss new results on qc decays and radiative J/$J decays. The results being presented are preliminary and are based on analyses completed in July 1983.
2. Apparatus
The MARK III detector has been designed to study e+e- reactions produced at SPEAR.’ The detector is shown in the transverse and axial views in Figs. 1
-2 and 2. The main design goals were to achieve large acceptance for charged and
2

-- -
Shower Counter Drift Chamber
TOF Counter
lnterac tion Region
6-83 4570A 1 -- 3
Fig. 1. Axial view of the MARK III detector.
-==
3

‘c> Muon Counte,r
1 I I , b\\\\\\\\\\\\\\\\\\\\\\\\\\\\\\\\Y
6-83 1 ’
Magnetic Shield Photomult iplier and Base
Light Guide TOF Counter
4570A2
Fig. 2. Transverse view of the MARK III detector.
4

neutral particles, high detection efficiency for low energy gammas, good r/K/p separation by TOF and fine charged track momentum resolution. The typical
-- - events have relatively low multiplicities and charged particle momenta of several - hundred MeV.
The description of the detector will begin with the central section of the drift chamber. The beam pipe and inner detectors were designed to minimize multiple scattering. The beryllium beam pipe is 0.4% r.1. thick, the first inner drift chamber is constructed of aluminum covered foam shells and the inner face of the main drift chamber is phenolic clad paper hexcell covered with Al foil. The main function of the inner drift chamber is to provide a pre-trigger. It has 4 layers with 32 axial sense wires per layer which are staggered by half a cell from layer to layer. The drift times in alternate sense wires in adjacent layers provide a time sum signal. This is fed into a chronotron circuit which is gated on SPEAR beam crossings to reduce the cosmic ray background and to provide a low pre-trigger rate of 3-4 kHz from the raw beam crossing rate of 1.28 mhz.
The second section of the drift chamber has 12 axial staggered sense wires in 32 cells which are read out both in time and charge. The high density of sense wires is useful for dE/dz sampling and Vee reconstruction for KS and A decays. The dE/ds information was not used for the J/$J analysis presented in this talk.
The third section of the drift chamber2 has 4 axial and 2 stereo layers. Three of the axial layers include charge division. The basic cell design has 3 sense wires, two guard wires and five high voltage field shaping wires. This cell structure is repeated from 48 times in the 3rd layer to 128 times in the 8th layer. The drift chamber solid angle coverage is 85% of 47r and the overall momentum resolution as measured on p-pairs in the J/$J data is up/p = 1.5% X dm, p in GeV.
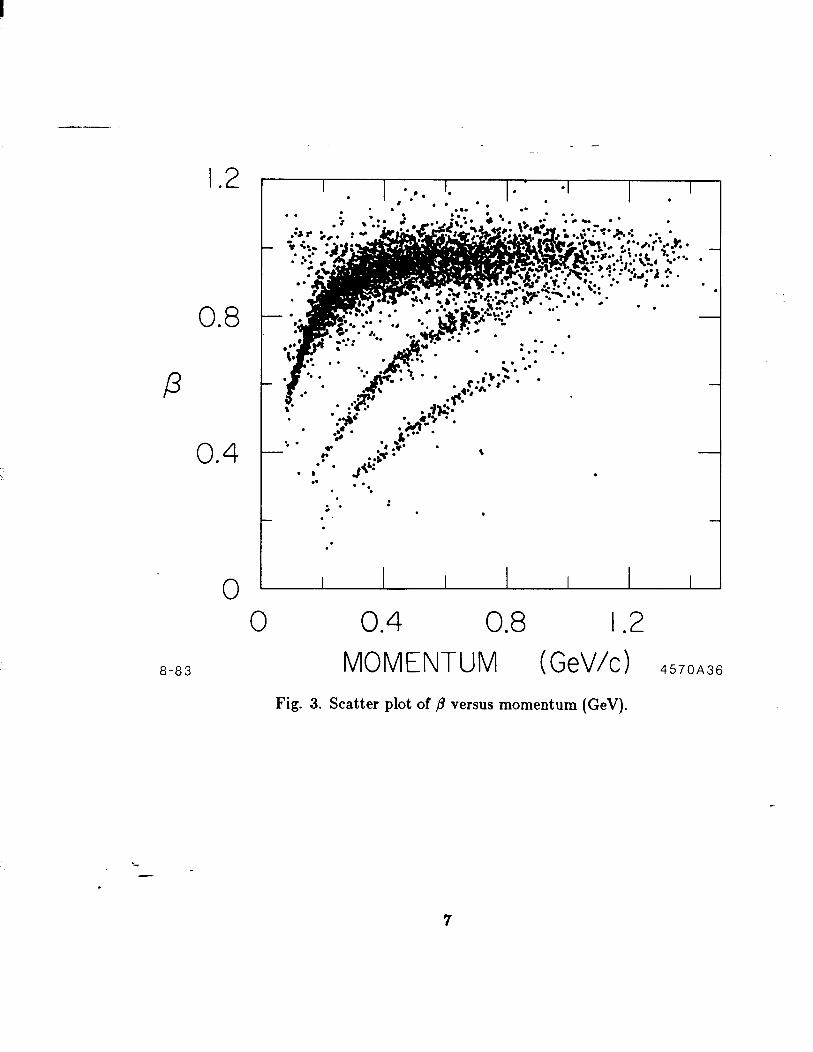
The TOF system 3 has 48 scintillators which are strapped on the exterior of the drift chamber. Each scintillator is read out by two phototubes through lucite lightguides. The radial distance is 1.17 m and the solid angle coverage is 80% of 4~. The thick scintillator (5 cm) and the special design of the light guide enable high TOF resolution. The overall resolution (ato/) is 175 ps for
L- Bhabhas (J/q + e+e-), 169 ps for p-pairs ( J/$J --+ p+p-), and 189 ps for ?T’S -
5

from J/$ + pn decays. The n/K/p separation is displayed in a ,9 vs momentum scatter plot in Fig. 3.
--
The shower counter system consists of a barrel4 --and two-endcaps.5 The entire system is placed inside the magnet coil to improve the low energy gamma detection efficiency. The total angular coverage is 94% of 4n. The shower counter is a gas proportional tube lead sandwich system with a single anode wire in a grounded cathode cell. Each anode wire is a high resistance stainless steel wire which is read out with an ABC on each end to measure energy deposition and position along the wire. The energy resolution on electrons is ~E/E = 17%/G,
E in GeV, the 4 angular resolution (a) is 6 mr on Bhabhas and the position resolution (a) per cell is 1% of the full wire length (337 cm).
_ :
Muon tubes mounted parallel to the beam axis (z-axis) on the exterior of the magnet cover 64% of 4n. They are composed of two double sets of proportional tubes separated by 12.5 cm of steel plate. The 4 posit.ion of the track is deter- mined by hits in two overlapping tubes and the z-position by charge division on the stainless steel anode wire. The resolution in z is 1% of the full wire length. The muon tube position resolution is limited by multiple scattering in the magnet steel.
_ The trigger system6 utilizes hit patterns in layers 1, 3 and 5 to define drift chamber tracks. The number of drift chamber tracks required to trigger is se- lectable by computer control. The actual data taking trigger required 1 drift chamber track and 1 TOF hit, or 2 drift chamber tracks. The event rate at the
J/+ w= -3 Hz and the real hadronic rate was slightly less then 1 Hz.
3. Performance Checks
The detector is studied with a variety of well known J/+ decays. The basic analysis technique is to kinematically fit events using the four constraints of energy and momentum conservation (4-C fit). Kinematic fitting substantially improves the energy resolution for the q’s, and has been successfully applied to
‘_events with up to five y’s and four charged tracks. If the decay includes a x0 or
6
P 03
-- . .
: ..‘
,A
. .
. yk
. I
I .-
iv
. . .
l . .
. l .
.
.
.
.
.

an q, then an additional mass constraint can be applied to the 77 system (5-C). One difficulty is the presence of spurious photons, which are due to hadronic interactions of charged particles in the shower counter. Thesecan be removed by ignoring showers near charged tracks. TOF identification is required when topologies include kaons or protons.
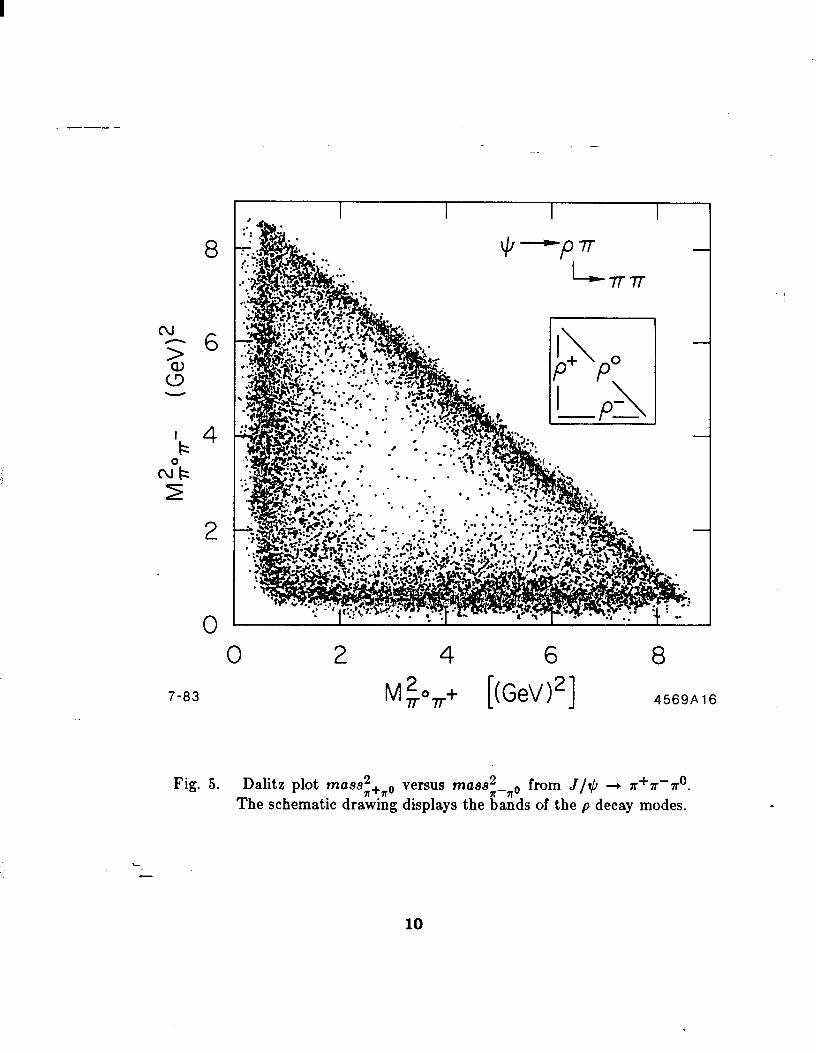
The reaction J/$J + n+n-x’ is studied with high statistics. The events are subjected to a 4-C fit to the hypothesis J/$J + 7~1r+n- resulting in 22k events. A typical event is shown in Fig. 4. The Dalitz plot in Fig. 5 shows clear pore,
P+f-, and p-n+ bands. The charged and neutral p mass plots are shown in Figs. 6(a), (b) and (c). Th e e ffi ciency determined from a Monte Carlo simulation is 48%. The observed branching ratio, BR( J/+ + n+n-no) =(1.49&.22)X 10B2,
is in agreement with Particle Data Table7 values. The ratio of the pn rates is BR( J/$ + pore)/ BR( J/+ + p*nF) =.496f.04, which is expected if the J/S has isospin 0.
The reaction J/q -+ pox0 is very useful to study the shower counter 7 de- tection efficiency and the 77 mass resolution. The 7r” from this decay is produced essentially monochromatically at 1.45 GeV, and the 7’s from these decays have an energy spectrum in the LAB frame that is flat from nearly 0 to 1.45 GeV. The energy spectrum (LAB) and co&, (no CMS) are plotted in Fig. 7. The angular distribution is flat as expected for spin 0 decays except at co~t?~=fl. Those two regions correspond to the 7’s moving parallel and antiparallel to the x0 direction. In the LAD frame the forward going 7 has most of the r” momentum whereas the other 7 has very low momentum. The energy distribution is flat to 100 MeV and falls to 50% at 50 MeV. This decay also allows a study of the 77 mass resolution. Figs. 8(a) and (b) are the reconstructed masses of the x0 using the 4-C fitted energies and raw shower energies respectively. The mass resolution is a factor of three better with the 4-C fitted energies than with the raw shower energies.
The decay J/yb + r# is studied in two decay modes, q1 --) rp” and tj’ ---) q7r+7qq + 77). In the first mode a 4-C kinematic fit to J/$J --) 7@7r-
is applied. Further cuts of mass(q$>200 MeV, to remove pn background, and -- .425<mass(7r+nW)<.925 MeV, to select events with PO’S, are applied. The re- -
8

Fitted $- TT+ f TT’ Event
. . .
. . .
. .
. .
. l
..** .
. . . l . .
l .*
. l
. .
. l
. .
. l S.C. .
. .
. .
. . . . . . .
. .
. .
. .
.
. .
. .
. .
. . . . . . . .
. .
.
. l .
l .
. .
. l
. l
. : D.C. . . . . ’ . ’ .
l .
. .
. l
. l
. l
. l
. .
. .
l .
’ . .
. .
. ’
. .
. ’
. .
. .
l .
’ .
l .
. .
. .
.
. ’
. l
. l
. .
l .
.
.
MeV/c
.
. .
. .
. .
. . . . l .
1 . . . l . . l l
l 7r- 6-83 4570A16
Fig. 4. J/y3 -+ n+n-no event display.
--
9
‘k cu”k >
8
6
4
2
0 0 2
7-83
6
M2 7r0T + kGeV)*l 8
4569Al6
Fig. 5. Dalitz plot rna9.~~+~~ versus massf-n, from J/$ --) ?T+K-A . 0
The schematic drawing displays the bands of the p decay modes.
--
10

Fig. 6. -- -
300
250
200
150
100
50
0
5 250
z+l 200 0 - 2 150 W
pi 100 2 W
50
0
250
200
I50
IO0
50
0 ::;;:, 0.4 0.6 0.8 I.0 0.2 1.4
(a)Mms,+,- (GeV) distribution from J/e + w+n-~* drawn with a fit of a Breit-Wigner curve. (b)Muss,-,o (GeV) distribu- tion from J/tc, -+ n+lr-?r0 drawn with a fit of a Breit-Wigner curve. (c)Mass,+,0 (GeV) distribution from J/q ---) n+n-~* drawn with a fit of a Breit-Wigner curve.
11

JI - TT+lT-7T” I I 1 1-j I I I _ -
600 In 9 0 y 400
if? - E 5 200
I -0.8 -0.4 0 0.4 0.8
cosey ho CM9
I I I I I I
0 0.4 0.8 1.2
lb)
10-85 E, (Lab Frame) 4677A.8
-- -
Fig. 7. (a) Co&+ distribution in the z* CMS from J/$ + p”lro. (b)y energy (GeV) distribution in the LAB frame from the 1.45 GeV R* from J/e + p”lro.
12

-- 4
2
;;>” O I - -
2 = 0 In
\v f$ 1.2 E !s LJ 0.8
0.4
0 ~
lr” mass I I I I I
(0)
(i I I I\, I
I Fit
0.08 0.16 0.24
-
IO-83 mYY 4677A9
Fig. 8. (a)Reconstructed x0 mass distribution using 4-C fitted 7 energies. -- (b) Reconstructed z* mass distribution using raw shower counter - energies.
13

sulting m+~- mass distribution is shown in Fig. 9(a). The fitted mean is 957k.5 MeV and the mass resolution (a) is 9 f .4 MeV. In the second decay mode a kine- matic 4-C fit to J/q + qrq7r+7rt- and a 5-C fit to J/+ + wlr?n- are applied. The resulting mass(r#n-) distribution from the 5-C fits is shown in Fig. 9(b). The mean mass is 958f.3 MeV and the mass resolution (a) is 5.7 MeV. The branching ratio is BR( J/$J + qq’) = (4.6 f .42(statistical) f .65(systematic)) x 10D3. Both branching ratios are in reasonable agreement with the Particle Data Table’ value of BR( J/$ + yq’) =(3.6 f 0.5) X 10m3.
These results demonstate that the MARK III detector performs very well detecting and reconstructing radiative decays. The efficiency for low energy 7 detection is very high. The mass resolution (a) achieved with constraint fitting is 8 MeV for 11”s in p7r decays, 9 MeV for the q’ in the rp mode and 5.7 MeV in the qn+~- mode. The mass scale agrees to within 1 MeV ivith nominal values. The measured branching ratios agree with published values, showing that the luminosity and the Monte Carlo simulation are understood.
4. qc Results
Exnerimental Situation
The Crystal Ball experiment at SPEAR first observed the qc in the inclusive 7 spectrum in J/+ and +!J’ decays,g and obtained the following results,
m=2984f4 MeV , F=12.4f4.1 MeV ,
BR( J/y6 -+ yqc)=(1.27f.36)X 1O-2 .
I.
The observed hadronic modes of the qc have been rather sparse. In the J/$J radiative decays, where the radiative 7 energy is low (ET=112 MeV), the Crystal Ball’* observed 18f6 events in the mode qc + r/lr+?r-. In the $J’ radiative decays, the MARK II observed 3 events in the mode qc + pp, 8 events in the mode qc + n*KFKs and by combining these modes with other hadronic modes a signal of about 25 events was obtained.11 There has been no spin-parity
‘--determination for the qc.
14

2 c3 kz 0 d
x Id
-
150
100
50
0
too
50
0
+-Yr)’ LYPO
-
I I --I AFIt!
I I I
( b)
0.80 0.88 0'.9 6 1.04 lo-83 m 4677A17
Fig. 9. (a)M assrp (GeV) distribution from J/$J + qrp”. (b)A4ussv,+,- (GeV) distribution from J/+ -+ rr/n+n-.
15

MARK III Results
Three qc decay modes from J/+ radiative decays will be presented, J/$ +
7PP9 Jllcl ---) “Ifl7r+?r-, and J/q + 74#. Other modes will-appear in future publications.
In the pp mode the analysis requires TOF identification followed by 4-C
fits to the hypotheses J/$ -+ 7pp and J/ll, --+ 77pji. To remove spurious 7’s
caused by hadronic interactions of the charged tracks in the shower counter, 7’s
close to the p’s and p’s are excluded. Often the p’s annihilate and produce a large amount of background. Figure 10 is a typical event of J/$ --, 7pji. An
important background is J/$J --* r*pp. This is removed by excluding events that fit to J/$ --) 77~~ with m77 w m,~. After these preliminary cuts the qc signal appears just below a large feed through of J/$ -+ pp. This background is removed with a collinearity cut between the p and the ii. The resulting mass plot is shown in Fig. 11. The branching ratio obtained is BR(J/11, + 7~~) x
qrlc + Pfq = (2.2 f .6 f .5) x 10 -‘. IJsing the Crystal Ball inclusive rate, BR( J/t,6 - 7qc)=( 1.27f.36) X lo-‘, the qc branching ratio becomes BR(vc -+ pa) = (.18 f .09) x 10 -2. This is very close to the rate observed for the direct decay J/y3 + pp.12
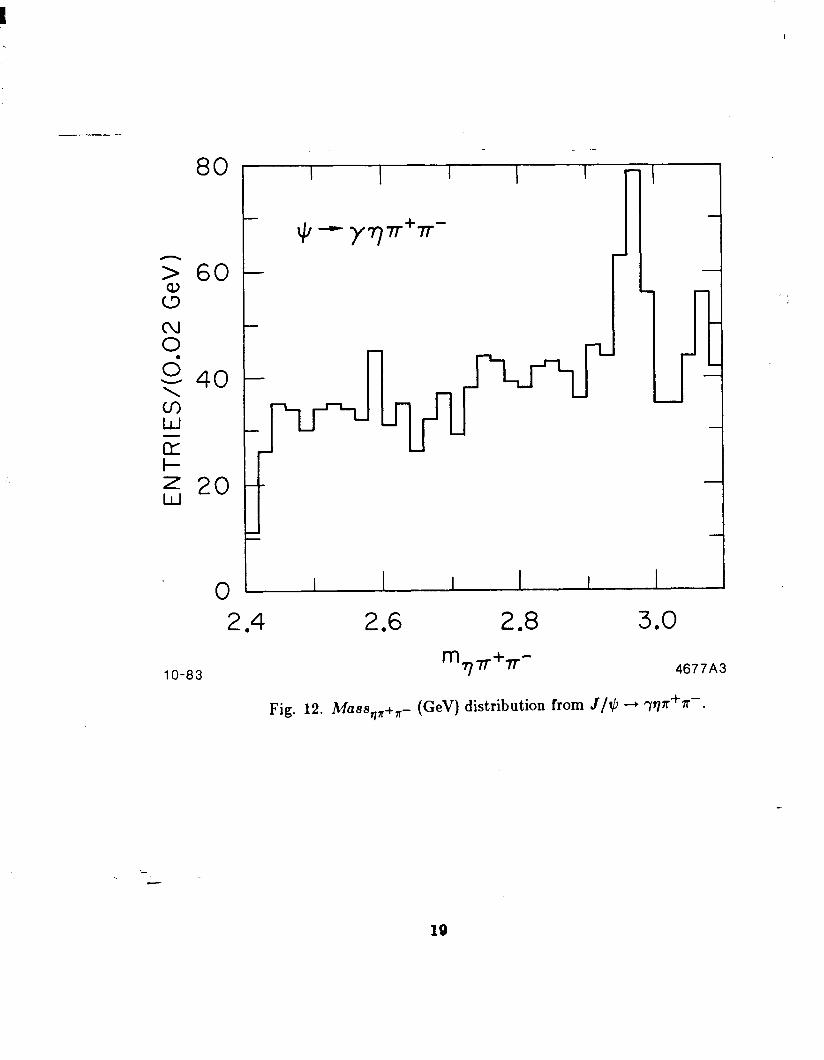
The mode qc + qn+n- * IS observed with a large signal. The events are fit ‘to J/S + 7777r+n- and J/q4 --, 7qn+n-. The mass(&7r-) distribution is shown in Fig. 12. The fitted mass is 2.967&.004(fit)f.Ol(systematic) MeV. The
mass resolution (a) is 20 MeV, which is consistent with the detector resolution as determined by Monte Carlo simulation. The measured branching ratio is BR( J/@ + 7rjc) X BR(qc -+ qn+fr--) = [4.3 f .7(8tUt) f 1.3(8ys)] X 10-4.
The mode qc --) 44 is observed via the 4 decay to K+K-. Figure 13 shows a typical event. The initial data selection required 4 charged prongs with total charge zero and TOF identification for at least one K in each oppositely charged pair. After requiring that there is one 4, it is seen that the other recoiling K+K-pair also forms a 4 as shown in Fig. 14(a). Requiring that both K+K- pairs are 4’s and then looking at the quantity E,,,iJs (missing energy from the
-- two 4’S)-P,iss (missing momentum from the two 4%) as shown in Fig. 14(b), it is -
16

I
--
l ..*.-•..
. . . . .
. . . . . . . . . . . .
. .
lo-83
\cI-- 7% L PF
Fig. 10. J/$J + 7pp event display.
4677A18
17

12
8
4
0
I
J/- yPis
I - -
A-
l I I I -
2.7 2.9 3. I
lo-83 mPp 4677A2
Fig. 11. Musspp (Gev) distribution after the collinearity cut from J/$ + ypp.
18
80
60
40
20
0
c
I I I ’ 1 9 - yv7T+r-
I
-
2.4 2.6 2.8 3.0
lo-83 m?p+7T- 4677A3
Fig. 12. Muss,,+,- (GeV) distribution from J/+ + 7qn+~-.
19

9-y++ Event . . . . l l l l . . . . 2 . . . . . .
. . . l .’
. .
. .* $ l l
. l
l ****m* .
.
l .
. .
. .
. \*
.
. .
. .
. .
. . . . .
. . l :
l . . . . Dl 37 . l?qr . ’
\ l
\\, ’
. . . . . .
. .
. .
. .
.
J . l
. l
. .
l .
l .
’ .
l . .
\ /
. . . l .
. ’ . .*
. . .
. l J‘
.
. .
. . . . -
. . l .
.
l ...** 4677A4
lo-83
Fig. 13. J/$ --) 794 event display.
20

I
20
y I5
E Ln ‘T: IO P z w > w 5
0
20
0
lo-83 E miss- ‘miss tGeV) 4677A26
I
(a) \cI -(pK+K-+ X
J
0.98
M,, (GeV)
-
(b)
Fig* 14* (GeV) distribution recoiling against a 4. (b)Emise- mida (GeV) from the 44.
21
-

seen that the recoiling mass against the &#J system could only be a 7. It should be noted that neither J/$J + 7r”+$ nor J/ll, + 44 is allowed by charge conjugation - invariance. The events are 4-C fit to J/$ + 7K+K-K+K- and the resulting qhj mass is shown in Fig. 15. A clear signal is observed at the qc mass. The efficiency of detecting J/$J + 744 as a function of $4 mass is also shown in Fig. 15. The branching ratio for the qc is BR(J/+ + 7qc) x BR(qc -+ 44) = (1.24f .32) X 10 -4. The fitted mass is 2.978 GeV and its width is consistent with the detector resolution. Due to kaon decays, the efficiency rapidly decreases to a few percent in the mass region near 2 Gev. Therefore it is difficult to determine if there is any structure in the region near 2 GeV.
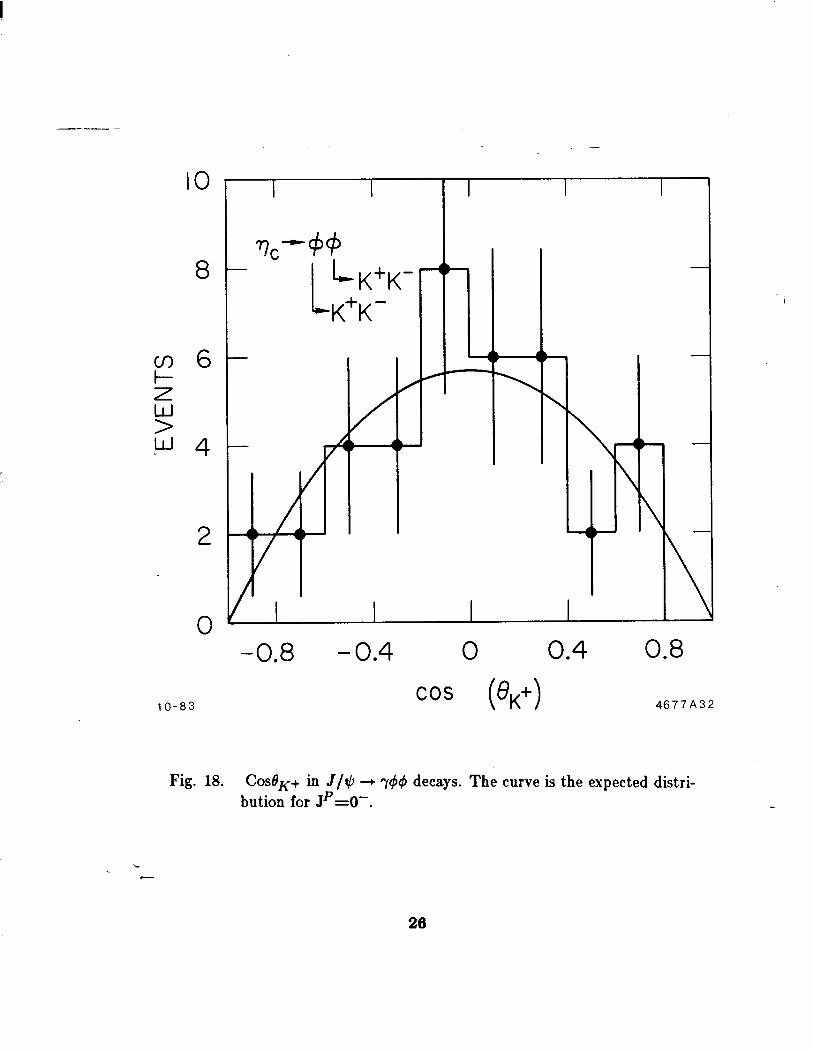
The decay angles in the 44 mode allow a definitive qc spin-parity deter- mination.13-l4 This test is analogous to the no spin-parity analysis15 from the reaction 7r” + e+e-e+e-. The useful decay angles (actually there are seven) are 8,, the angle between the radiative 7 and the e+e- beam direction in the LAD frame, 04, the angle between the qc and one 4 in the qc CMS frame, 8,+, the angle between the 4 and the K+ in the 4 CMS frame, and x, the angle between the decay planes of the 4’s in the qc CMS frame. These decay angles are plotted in Figs. 16, 17, 18 and 19. The lines show what is expected for Jp=O-. The angles x and 0,+ are most sensitive for likelihood tests of Jp and are independent of the initial polarization of the qc. The event distributions are proportional to 1 + ,f3 X cos(2x) and 1 + { X &(0~+), where @ and < depend on the Jp, and P2 is the Legendre polynomial. The likelihood ratios for different Jp’s relative to O-, assuming lowest 1 values, are summarized in Table 1.
Jp=O- is preferred overall as expected. This is the first spin-parity deter- mination of the qc. A more complete analysis will include a simultaneous fit to all the decay angles.
22

8
4
1 Lr I
I- z
4s 25 Q,
2
0 2.0 2.4 2.8 3.2
4639A3 8-83
I .I I I I 8
6
Fig. 15. MUSSES (GeV) distribution from J/$ 3 744 with the mass acceptance overplotted.
23

--
8
6
r 54 > w
2
0 0
1 O-83
1.
I I
0.2 0.4 0.6
Icw I 0.8 I .o
4677A33
Fig. 16. Cad7 in J/S + 744 decays. The curve is the expected distribu- tion for Jp=O-.
24

8
6
2
0
1 O-83
-
0 02 . 0.4 0.6 0.8 1.0
Icos%l I ’ I 4677A31
Fig. 17. Cost94 in J/$J + y&P decays. The curve is the expected distribu- tion for JP=O-.
25
IO
8
P 7 W > *F 4
2
0
I O-83
-
-0.8 -0.4 0 cos ( 8,+
0.4 0.8
4677A32
Fig. 18. CosOK+ in J/q -+ r&15 decays. The curve is the expected distri- bution for JP=O-.
26

r 7 Y W
IO
8
6
4
2
0
lo-83 x (degrees) 4677A34
-
-
-
- I 1
0 20 40 60 80
Fig. 19. x angle in J/q + 744 decays. The curve is the expected distri- bution for Jp=O-.
27

Table 1. Likelihood Ratios for /3 and < Tests
JP
odd* 0+
2-
2+
Likelihood Ratio - Likelihood Ratio of O- to Jp for ,0 of O- to Jp for g
1100 47
>108 7.7
35 5.7
2400 7.7
5. J/$ Radiative Results
Phvsics Interest
Recently there has been much interest in J/ll, radiative decays. Quantum chromodynamics (QCD) allows the existence of bound states of gluons or glueballs and the J/@ radiative decays appear to be an ideal place to look for such states.16 QCD predicts a large branching ratio for radiative decays by comparing the calculated rates between J/$ + ygg and J/t+4 -+ ggg.17-lg The calculation predicts,
I’( J/$ + 7 + hadrons)/I’( J/S + hadrons) x 10%
The known measured decays total -1%. Consequently, if QCD is correct there should be a large number of J/t) radiative decays via 2 gluons which have not yet been seen. If there are bound states of 2 gluons they should be isoscalar SU(3) singlets with even Gparity. There are many models that predict glueball masses in the 1-2 GeV region and it is possible that their widths are narrow. The mass spectrum may be very complicated due to mixing with other qp states. There may also be more complex bound states of gqp #*o-*1 or qtjqij.** The thrust of this discussion is that any new states found in radiative J/t,6 decays are of considerable interest.
-
28

Exnerimental Situation
Recently observed states in radiative decays are c + Kkr23-24 ,9 + KK25 and ,/q,26 and structures near 1700 MeV in q7&27 and pop0 ft% .
In the Kkn channel the iota has been observed to have a very large branching ratio and Crystal Ball determined that the iota decays mainly via 6~ and its spin- parity is O-. Various mixing models have predicted that in analogy to q’, the iota should have a large qp” decay mode.
In the qq channel Crystal Ball first observed the 8 but did not clearly sep arate the state from the f’(1515). They did a maximum likelihood test on the spin-parity of the 8 and found that Jp=2+ is favored over O+. If the 0 is a glueball there are predictions that it should be an SU(3) singlet and should decay to mr.
In the qnn channel Crystal Ball found a broad structure around 1.7 GeV but set a limit on 6 --) flnn. This may be in conflict with the previous observation that the iota decays to &r, because the 6 also decays to q?r.
MARK III Results
MARK III has studied a large number of radiative decays. The prelimi-
nary results on the following decays will be shown: J/$J + +yr+n-, rK+K-, rn°KsKs, +KFKs, yr’K+K-, 7qp”, and &-lr-.
The decay mode to T~+R- is studied by applying a 4-C fit to J/$ + r?r+?r- and removing p-pairs and radiative Bhabha (J/+ + re+e-) events. The resulting mass(n+?r-) distribution is shown in Fig. 20. The f(1270) is clearly seen and feed through of pn decays appears below 800 MeV. This feed-through occurs when one of the two 7’s from the 7r” in the pn decays is not detected and the reaction is incorrectly fitted to J/$J --* 77r+7r-. There are possible hints of structure above the f(1270) but further analysis is required to remove more background. The Dalitz plot in Fig. 21 shows the f(l270) band and the outline
- - of the plr feed through. The f(1270) peak is fitted with a nonrelativistic Breit-
29

120
c 80
x W
E z 40 W
0
lo-83
-
-
- r
’ I’ “I
l/P--y lT-?T-
I 2 . 20 .
m77-+ TT-
28 .
4677A20
Fig. 20. Mass,+,- (GeV) distribution from J/t) + 7n+n-.
30

--
8
6 x
cull= E 4
2
1 O-83
Fig. 21.
_ - I I I
6
,
4677AA2 1
Dalitz plot massi+7 versus massze7 from J/tj + +pr+n-. The schematic drawing displays the bands of the f decays and the p background.
31

Wigner curve and the measured values are,
-- - m = 1278 f 5 MeV and
- I’ 155 f 15 MeV - - = --- .
These are in agreement with Particle Data Table% values.
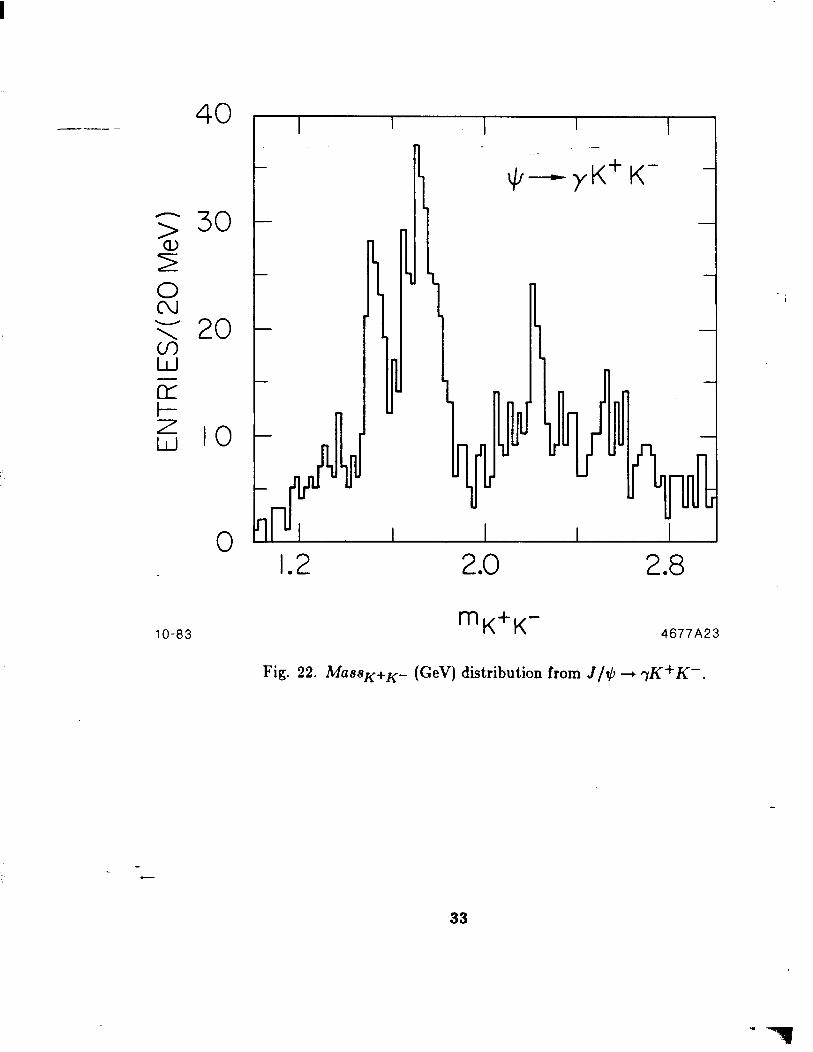
The decay mode J/e + rK+K - is obtained by requiring 4-C fits and TOF indentification. The mass(K+K-) distribution is shown in Fig. 22. The 8 and f’( 1515) are clearly separated and there is evidence for a new state at 2.2 GeV which hereafter will be named the c. The new state has a 7 standard deviation significance. The Dalitz plot shown in Fig. 23 shows diagonal bands correspond- ing to the three states. The states are also observed in the mode J/t,b + 7KsKs with lower statistics. Incoherent Breit-Wigner curves are simultaneously fit to the f’(lSlS), the 8, and the new state, the t. In the fit the masses and the widths of the 0 and the f are allowed to vary but those of the f’(1515) are held fixed. The results are,
me = 1.719 f 6GeV ,
re = .117 f 23GeV ,
mt = 2.22 f .OlS(stat) f .02(sys)GeV and
l-t = .03 f .015( stat) f .02( sys)GeV .
The mass plot with the fitted curves is shown in Fig. 24. The e width appears to be narrow in the K+K- mode. To accurately determine the width, the detector resolution is being examined in both the K+K-and the KsKs decay modes. The branching ratios are,
BR( J/$J + rf’) X BR(f’ -+ K+K-) = (1.6 f .3(stat) f .35(sys)) x low4 ,
BR( J/t/ + @) X BR(8 -+ K+K-) = (4.8 f .7(stat) f .Q(sys)) x 10~~ and
BR( J/+ + r<) X BR(t + KSK-) = (8.0 f S.O(stat) f 1.6(,93/s)) x lo-’ .
The L is observed in three modes, n’K+K-, n*KSKs, and for the first --time in r°KsKs. The mass plots are shown in Figs. 25(a), (b) and (c). Using
32
40
5 30 r” 0 N 5 20 W
lo-83
I I I I -
-
-
-
-
-
28 .
mK+K- 4677A23
Fig. 22. Mass,+,- (GeV) distribution from J/t) + @+K-.
33

6
2
\ ef
/ \
6 \ \\
lo- 83 mE+, 4677A24
Fig. 23. Dalitz plot mass$+7 versus mass&-7 from J/e -+ rK+K-. The schematic drawing displays the bands of the f’(1515), 8 and ( decays.
34

--
40
5 30
2 8 5 20 w cr t- 7 w IO
0 I
_ - I I I II ’
I I I
I .8
8-83 m(W) 4625Al
Fig. 24. MassK+K- (GeV) distribution from J/$ + qK+K- drawn with a fit with three Breit-Wigner curves.
35

Fig. 25.
-
m,°K+K- 30
JI JI -yrrKi? -yrrKi?
m,+ K’K, ( b)
4
01 ’ 1rY-l I I I I I 1.0 1.2 1.4 1.6 1.8 2.0
10-63 4677A6
(a)Mass,oK+p (GeV) distribution from J/$J + yrOK+K-. (b)Mass,*pKs (GeV) distribution from J/S + yr*K’Ks. (W~SS,O&& (GeV) distribution from J/e + yr°KsKs.
38

-- -
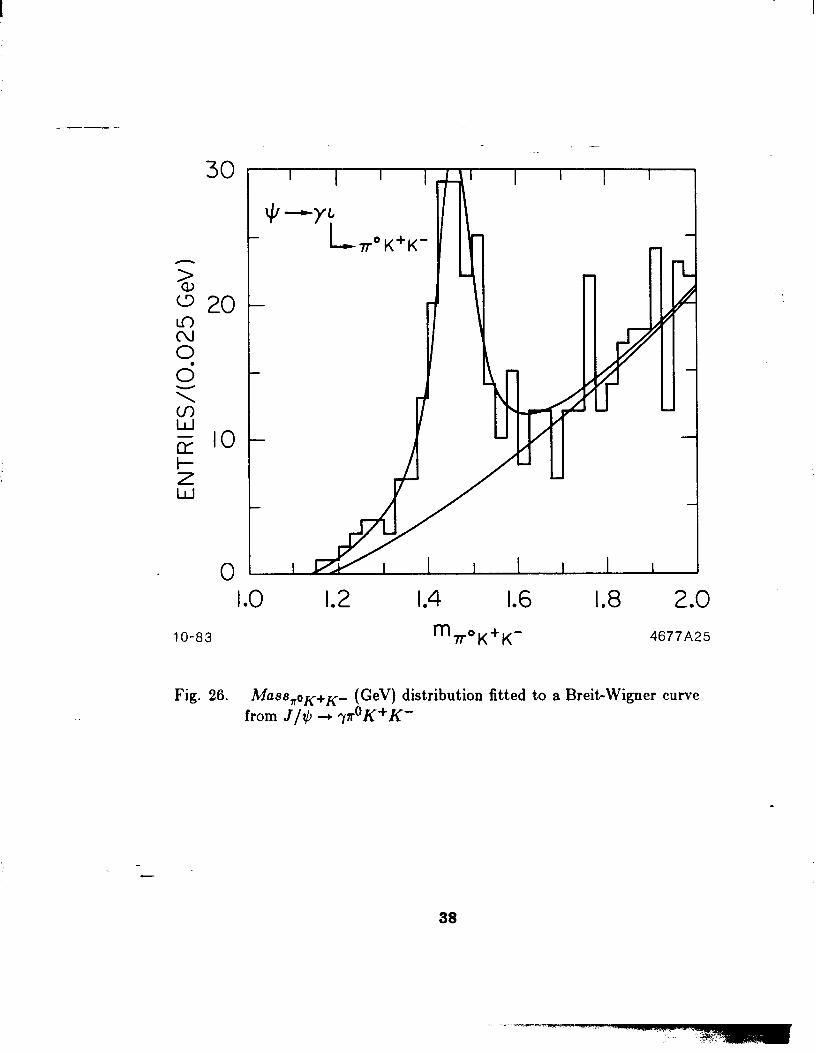
the n°K+K- mode the following values are obtained from a Breit-Wigner fit to the L,
ml =1.46f.OlGeV , -. - r I = .OQ7 f .025 GeV and
BR( J/ll, ---) 7~) x BR( L + n°K+K-)= [5.3 f .b(staf) f l.Q(sys)] X low3 .
The fit is shown in Fig. 26. The width is larger than the MARK II and Crystal Ball values because this analysis has no low mass cut on the K+K- mass. The branching ratios of the other modes are under study. All three branching ratios together will enable a check of the L isospin.
The decay J/q9 + 7qp” is studied in the region above the $. The events are 4-C fit to J/$ + ryr+n-. Figure 27 is a scatter plot of mass(rl,,n+n-) versus mass(n+n-). A large p” signal is observed in a band in the mass(n+n-). For events with mass 1.2<mass(q~,,n+n-)<1.6 GeV, the mass(n+r-) is plotted in Fig. 27(b). The p” is clearly seen for events above the q’. Requiring the p” and removing p’lr background, the resulting ma.ss(~~,,&~-) distribution is shown in Fig. 28. The q’ is off scale in the vertical scale of the plot. A wide structure above 1.4 GeV is clearly visible. Fitting two Breit-Wigner curves with one fixed at a mass of 1.275 GeV, the following values are obtained, mass=1.425 f .014
GeV, I’ = .112 f .067 GeV, and BR[ J/T/J + 7X( 1.42)] x BR[X( 1.42) + rp”]=
[7.4 f 2.2(staf) f 1.3(sys)] X 10 -5. The Breit-Wigner curve with a fixed mass at 1.275 GeV yields an upper limit for possible decays of f( 1270)+ qp” or q( 1275)+ rp” of 1.9 x lo-’ at 90% confidence level. Background investigations and a spin- parity analysis of this structure are currently in progress.
Jlti -+ ~rpr%r- is studied with 4-C and 5-C fits. After fitting to the 4-C hypothesis J/q + ~~~r+n-, the scatter plot of mass(+&?r-) versus mass(r$ is plotted in Fig. 29 with 3 entries per event. x0 and’q vertical bands are observed. In Figs. 30(a) and (b) the m mass is plotted. The x0 and q mass peaks are clearly observed. Cutting on the q peak, .475<mass(rq)<.625, the
--mass(~~n+lr-) is plotted in Fig. 31(a). Cutting off the q peak, .4 < mass(rr) <
37
--
I I I
J/-YL L rr’K+K’
1.8 1 O-83 mrr°K+K- 4677A25
Fig. 26. MassnoK+K- (GeV) distribution fitted to a BreitrWigner curve from J/S -+ yr°K+K-
38

2.0
; 1.6
3 0
E”
I.2
0.8
. ..’
.
. l * . .
b’. l
(a)
I I I
(b)
JI- yy7r+7T-
.
e8
-5 4
0 0.4 0.8 1.2 1.6 2.0 10-63 m,+,- (GeV) 4677AlO
Fig. 27. (a)Scatter plot of massrn+x- versus mass,+,- from events that - fit to J/e + ~TT+T-. (b)Mass,+,- projection of above plot for events satisfying 1.2<massTlmo,+,- <1.6 GeV.
39

I I I I
0.8 1.2 1.6 2.0 lo-83 MASSypo 4677A27
Fig. 28. M~ss~~o (GeV) distribution after requiring that the 7r1+r- are from p” decays. The line is a fit with two Breit-Wigner curves.
40

--
01 I I I 1
0 0.4 0.8
mYY 4677A12 lo-83
Fig. 28. Massrr versus h!a887rn+n- of events that fit to J/$J + 777n+n-. There are three entries per event.
41

--
lo-83
-_ Fig. 30.
400
200
0 A
0.40 0.48 0.56 0.64
mYY 4677A13
a)Massrr (GeV) distribution from 0 to 1 GeV. (b)Maasrr (GeV) d istribution from .4 to .7 GeV.
42
,
.6
0.8
n
” 0 0.2 0.4 0.6 0.8 I.0 600
I I I
(-a k
$-YYY”r+r-
--
Fig. 31.
600
400
200
0 600
t (c) +
I I I I I I I I 0 .8 I .6 2.4
m 10-83 TpT+lr- 467714
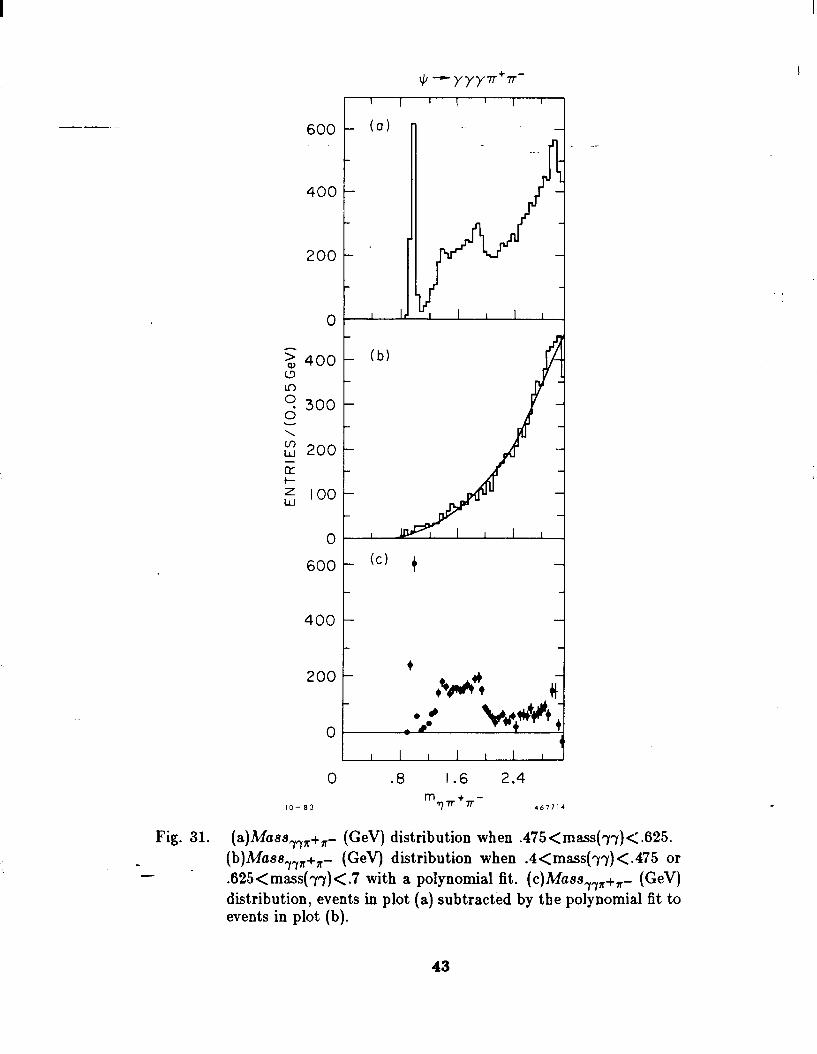
bW88,rn+n- (GeV) distribution when .475<mass(q7)<.625. (wfyyr+,- (GeV) distribution when .4<mass(q7)<.475 or .625<mass(q7)<.7 with a polynomial fit. (c)Mass77z+n- (GeV) distribution, events in plot (a) subtracted by the polynomial fit to events in plot (b).
43

.475 or .625 < mass(rq) < -7, the resulting mass(rrlr+n-) is plotted in Fig. 31(b). This represents the combinatorial background signal. It is fitted with a polynomial and most of this background populates the mass region above 2 GeV. - To obtain the real qn+?r- signal, a polynomial fitted to Fig. 31(b) is subtracted from the events in Fig. 31(a). The resulting plot is shown in Fig. 31(c). The
main structures are the q’, a broad structure from 1 to 2 GeV and the qc. The overall shape appears to be neither a single Breit-Wigner shaped resonance nor phase space. The approximate branching ratio of the entire structure in the l-2 GeV region is 7X 10D3.
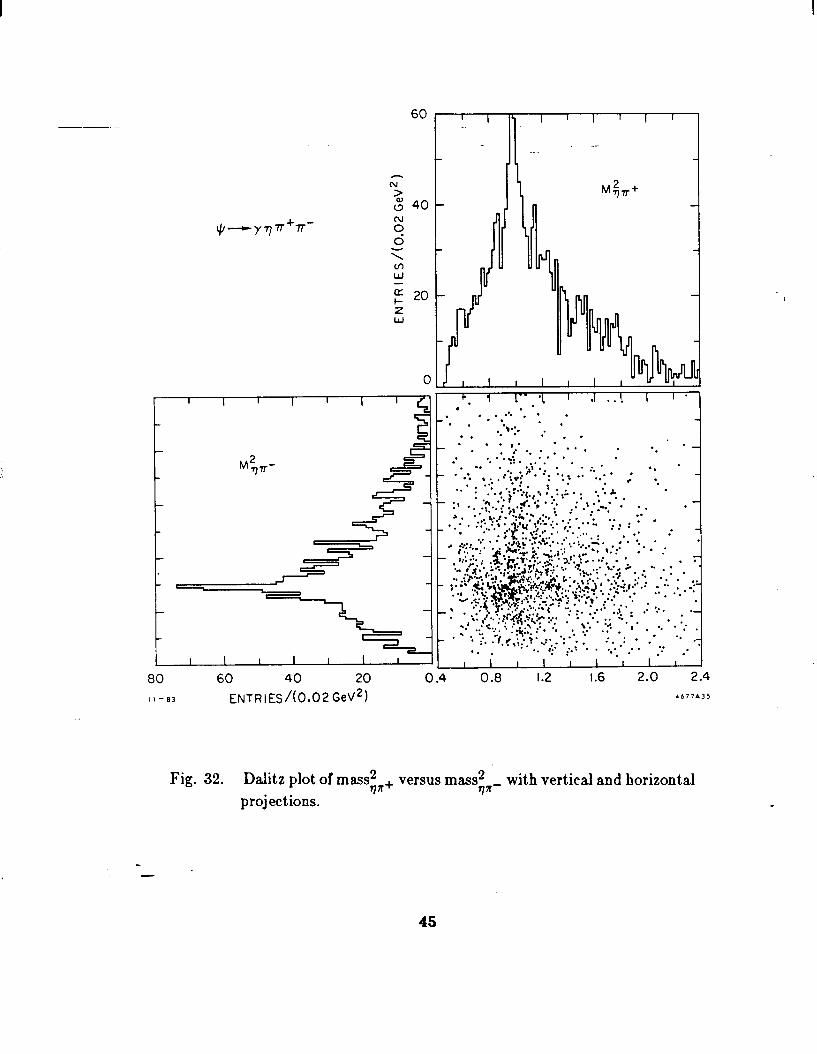
Applying a 5-C fit to the events, the Dalitz plot of mass(qa+)2 vs mass(qa-)2 is shown in Fig. 32 for those events with 1 <mass(r/7r+R-)<2 GeV. The plot shows a clear peak in both modes at .96 GeV2 which corresponds to decay of the 6. Hence the decay J/$ -+ $*nF is being observed. The mass(qn+n-) is now studied with and without requiring the 6. Figures 33(a), (b) and (c) are mass(qn+n-) distributions from the 5-C fit with no background subtraction. The first one is with no cuts, the second with a “6 cut”, .93<mass(qn*)<l.03, and the third with an “anti 6 cut” , .93>ma&(qlr*) or mass(qn*)>l.03. The qn+~- mass plot with the “6 cut”, Fig. 33(b), shows no evidence for the L at 1.44 GeV. However there appears to be a structure at 1.38 GeV. The background is not smooth and the shoulder around 1.3 GeV may be the D( 1285). A conservative limit that the iota cannot be larger than the number of events at 1.44 GeV in Fig. 33(b) yields the result BR( J/+ + L)X BR(L -+ G*x~)x BR(6* -+ VT*) < 1.1 X 10m3 at 95% confidence level. The structure, approximately 50 MeV below where the iota is expected, has been fitted separately to 1 and 2 Breit-Wigner curves with the second resonance in the fit being fixed at the D(1285) mass and width. The fits are applied to the events in Fig. 33(b). The fit to a single Breit-Wigner curve, shown in Fig. 34(a), yields the values mass=1.349f.011 GeV and I’= .147f.036 GeV. The fit to two Breit-Wigner curves, shown in Fig. 34(b), yields the values mass=1.378&.004 GeV and I’= .027&.018 GeV. Further reductions of backgrounds in this mode are being studied to improve the iota
- limit and resolve the emerging structure at 1.38 GeV. -
44
I I I I I I I I I I I I I I I I I
80 60 40 20 0.4 0.8 1.2 1.6 2.0 2.4
ENTRIES/to.02 GeV2) 4677A35
Fig. 32. Dalitz plot of massiT+ versus mass:=- with vertical and horizontal projections.
-
45

--
80
n -
0’ ’ ’ ’ ’ ’ ’ ’ ’ ’ J I.0 1.4 1.8
IO-83 mTpr+7r- 4677A15
Fig. 33. (a) Massq,+,- (GeV) distribution with no “6 cut” after a 5-C - fit. Note that this plot has no background subtraction unlike
Fig. 31(c). (b) Massg,+,- (GeV) distribution with the “S cut” after a 5-C fit. The “6 cut” requires .93<mass(qn*)<1.03. (c) M=s~~+~- (GeV) distribution with the “anti 6 cut” after a 5-C fit. The “anti 6 cut” requires .93>mass,+ or mass,+>>1.03.

-
IO-83
60
40
20
0 L
lY I I I I n 60
40
20
0 I I I
- I.0 1.4 1.8 myrr+7r- 4677A16
Fig. 34. (a)Figure 33(b) fitted with one Breit-Wigner curve. (b)Figure 33(b) fitted with two Breit-Wigner curves with the second fixed at the D(1285) mass.
-
47
0. Future Outlook
The preliminary results presented here are from only radiative J/+!J decays. Studies on J/e hadronic decays are also underway. --. -
MARK III has accumulated ~6 pb-’ on the $‘I for producing neutral and charged D’s. The present plans are to log another 9 pb-’ on the $J” to bring the total integrated luminosity to 15 pb-I. MARK II has accumulated 2.85 pb-’ in total, hence MARK III should gain a factor of 5 in statistics over pre- vious measurements. The D physics topics MARK III expects to explore are 1) measurements of the ratio of semileptonic branching ratios Do to D*; 2) a possi- ble direct measurement of the rat.io of the Kobayashi-Maskawa matrix elements v,.d/vca from the ratio of D + neu to D+ Keu decays and D+ peu to D+ K*ev
decays; 3) new limits on Doti mixing using Do and fro tagged decays; 4) a study of the mechanism of hadronic weak decays from the relative yields of D+ ?TR, D+ Ka; and D+ KK, and 5) measurements of the isospin of D decays. MARK III will later have the opportunity of searching for t.he F, and studying decays of r’s, t/!‘s, and &‘s.
On the horizon, perhaps by the Summer of 1984, there may be an upgrade of SPEAR with the use of minibeta focusing at the interaction region. Little modification of the MARK III detector will be necessary. It is hoped that the luminosity may be increased by a factor of three. This should have a very important impact on the physics program enabling, for example, the possibility of producing 20 million J/T/I events at SPEAR in 17 weeks of running. Consequently MARK III looks forward to pursuing and producing interesting and important physics in the next few years at SLAC.
-

--.-
1.
2.
3.
4.
5.
6.
7.
8.
9.
10.
. 11.
12.
13.
14.
15.
16.
17.
18.
19.
20. 21.
-
REFERENCES
D. Bernstein et al., Stanford Linear -Accelerator Center Report No. SLAGPuB (1983).
J. Roehrig et al., Stanford Linear Accelerator Center Report No. SLAC- Pm-3199 (1983).
J.S. Brown et al., Stanford Linear Accelerator Center Report No. SLAC- PUB-3180 (1983).
W. Toki el al., Stanford Linear Accelerator Center Report No. SLAC- PUB-3140 (1983).
H. Bledsoe et al., Stanford Linear Accelerator Center Report No. SLAC- PUB-3200 (1983).
J. J. Thaler, V. J. Simaitis, J. J. Becker and W. J. Wisniewski, IEEE Trans. on Nucl. Sci. NS - 30, 236 (1978).
M. Roos et al., Phys. Lett. lllB, 1 (1982).
M. Roos et al., Phys. Lett. lllB, 1 (1982).
R. Partridge et al., Phys. Rev. Lett. 45, 1150 (1980).
R. Partridge et al., Phys. Rev. Lett. 45, 1150 (1980).
T. Himel et al., Phys. Rev. Lett. 45, 1146 (1980).
M. Roos et al., Phys. Lett. lllB, 1 (1982).
T.L. ‘Dueman, Phys. Rev. 018, 3423 (1978).
N.P. Chang and CA. Nelson, Phys. Rev. Lett. 40, 1617 (1978).
R. Plano ef al., Phys. Rev. Lett. 26, 3 (1959).
S. Brodsky et al., Phys. Rev. Lett. m, 365 (1978).
M. Chanowitz, Phys. Rev. 012, 918 (1975).
T. Applequist et al., Phys. Rev. Lett. 34, 365 (1975).
L. Okun and M. Voloshin, (Moscow, ITEP), ITEP-95-1976 (1976).
T. Barnes and F.E. Close, Phys. Lett. 116B, 365 (1982).
M. Chanowitz and S. Sharpe, Nucl. Phys. B222, 211 (1983).
48

22.
23. -- ~. 24.
25.
26.
27.
28.
29.
R. Jaffe and K. Johnson, Phys. Lett. e, 201 (1976).
D. Scharre et al., Phys. Lett. m, 329 (1980).
C. Edwards et al., Phys. Rev. Let;. 49, 259 (1982), _
M. Franklin, Ph.D. thesis, Stanford Linear Accelerator Center Report No. SLAG254, August 1982.
C. Edwards et al., Phys. Rev. Lett. 48, 458 (1982).
C. Edwards et al., Phys. Rev. Lett. Sl, 859 (1983).
D. Burke et al., Phys. Rev. Lett. 49, 632 (1982).
M. Roos et al., Phys. Lett. lllB, 1 (1982).
50