lansing-east lansing, mi metro cbsa market area … lansing, mi metro cbsa market area profile ......
TRANSCRIPT

Lansing-East Lansing, MI Metro CBSA
Market Area Profile
April 2016
Prepared by
CADL Community Outreach
For additional information, contact:
Jessica Goodrich
Business Outreach Librarian

Lansing-East Lansing, MI Metro CBSA Market Profile
1 Data obtained from Library business databases, including: DemographicsNow, BusinessDecision and ReferenceUSA; as well as the U.S. Bureau of the Census and
Experian, Alteryx and ESRI forecasts. © 2014, by Experian, © 2014 Alteryx.
Lansing-East Lansing, MI Metro CBSA
This report covers the Lansing-East Lansing, MI
Metro Core-Based Statistical Area.
A Core Based Statistical Area (CBSA) is defined by
the U.S. Office of Management and Budget at a
geographic area that centers on an urban center of
at least 10,000 people and adjacent area that are
socioeconomically tied to the urban center by
commuting.
The Lansing-East Lansing Metropolitan Statistical
Area includes the counties of Eaton, Clinton, and
Ingham.
Lansing-East Lansing, MI Metro CBSA Market Profile
2 Data obtained from Library business databases, including: DemographicsNow, BusinessDecision and ReferenceUSA; as well as the U.S. Bureau of the Census and
Experian, Alteryx and ESRI forecasts. © 2014, by Experian, © 2014 Alteryx.
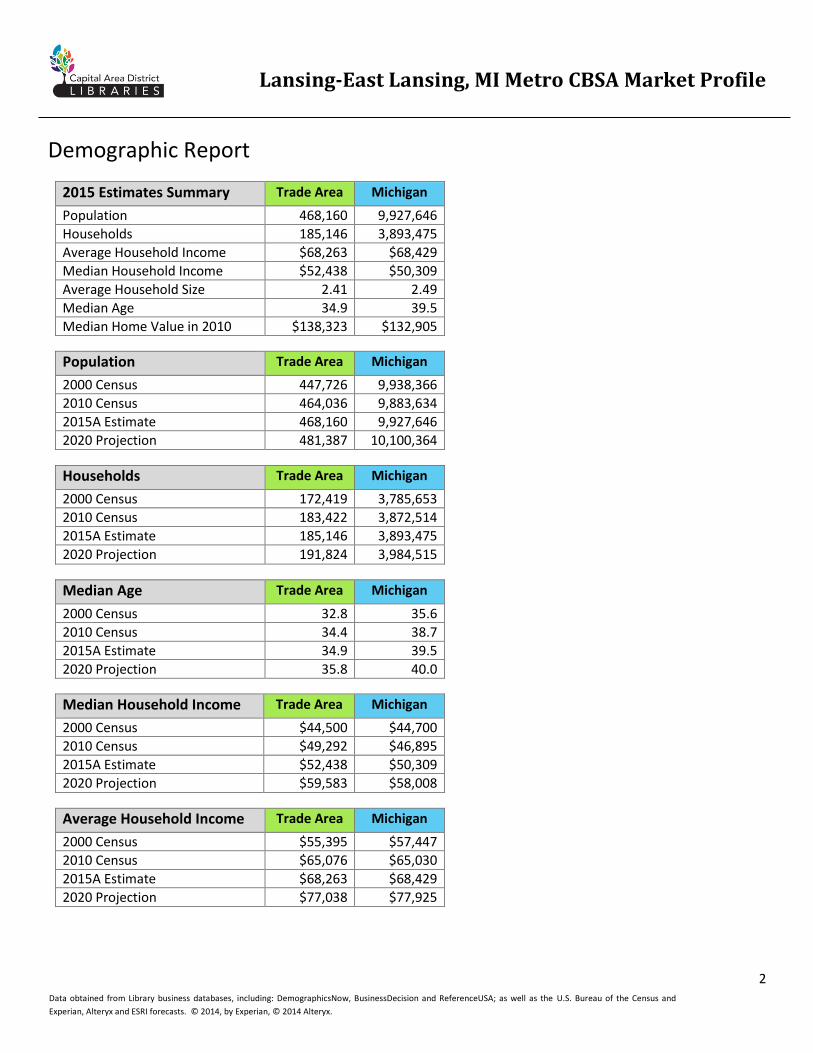
Demographic Report
2015 Estimates Summary Trade Area Michigan
Population 468,160 9,927,646
Households 185,146 3,893,475
Average Household Income $68,263 $68,429
Median Household Income $52,438 $50,309
Average Household Size 2.41 2.49
Median Age 34.9 39.5
Median Home Value in 2010 $138,323 $132,905
Population Trade Area Michigan
2000 Census 447,726 9,938,366
2010 Census 464,036 9,883,634
2015A Estimate 468,160 9,927,646
2020 Projection 481,387 10,100,364
Households Trade Area Michigan
2000 Census 172,419 3,785,653
2010 Census 183,422 3,872,514
2015A Estimate 185,146 3,893,475
2020 Projection 191,824 3,984,515
Median Age Trade Area Michigan
2000 Census 32.8 35.6
2010 Census 34.4 38.7
2015A Estimate 34.9 39.5
2020 Projection 35.8 40.0
Median Household Income Trade Area Michigan
2000 Census $44,500 $44,700
2010 Census $49,292 $46,895
2015A Estimate $52,438 $50,309
2020 Projection $59,583 $58,008
Average Household Income Trade Area Michigan
2000 Census $55,395 $57,447
2010 Census $65,076 $65,030
2015A Estimate $68,263 $68,429
2020 Projection $77,038 $77,925

Lansing-East Lansing, MI Metro CBSA Market Profile
3 Data obtained from Library business databases, including: DemographicsNow, BusinessDecision and ReferenceUSA; as well as the U.S. Bureau of the Census and
Experian, Alteryx and ESRI forecasts. © 2014, by Experian, © 2014 Alteryx.
Per Capita Income Trade Area Michigan
2000 Census $21,332 $21,882
2010 Census $26,319 $25,787
2015A Estimate $27,587 $27,140
2020 Projection $31,273 $31,038
Housing Unit Summary Trade Area % Michigan %
2010 Total Housing Units 199,026 4,532,242
2010 Total Occupied Units 183,422 92.2% 3,872,514 85.4%
Owner Occupied: with a mortgage or loan
87,924 47.9% 1,920,247 49.6%
Owner Occupied: Owned Free and Clear
32,123 17.5% 873,099 22.5%
Renter Occupied 63,375 34.6% 1,079,168 27.9%
2010 Vacant 15,604 7.8% 659,728 14.6%
2015A Total Housing Units 199,374 4,538,980
2015A Total Occupied Units 185,146 92.8% 3,893,475 85.8%
Owner Occupied: with a mortgage or loan
83,633 45.1% 1,802,922 46.3%
Owner Occupied: Owned Free and Clear
35,977 19.4% 971,614 25.0%
Renter Occupied 65,536 35.3% 1,118,939 28.7%
2015A Vacant 14,228 7.1% 645,505 14.2%
2020 Total Housing Units 207,024 4,663,181
2020 Total Occupied Units 191,824 92.7% 3,984,515 85.5%
Owner Occupied: with a mortgage or loan
86,028 44.8% 1,836,261 46.1%
Owner Occupied: Owned Free and Clear
38,017 19.8% 1,006,896 25.3%
Renter Occupied 67,779 35.3% 1,141,358 28.6%
2020 Vacant 15,200 7.3% 678,666 14.6%
Median Home Value Trade Area Michigan
2000 Census $105,351 $109,357
2010 Census $138,323 $132,905
Average Household Size Trade Area Michigan
2000 Census 2.48 2.56
2010 Census 2.41 2.50
2015A Estimate 2.41 2.49
2020 Projection 2.39 2.48
Lansing-East Lansing, MI Metro CBSA Market Profile
4 Data obtained from Library business databases, including: DemographicsNow, BusinessDecision and ReferenceUSA; as well as the U.S. Bureau of the Census and
Experian, Alteryx and ESRI forecasts. © 2014, by Experian, © 2014 Alteryx.
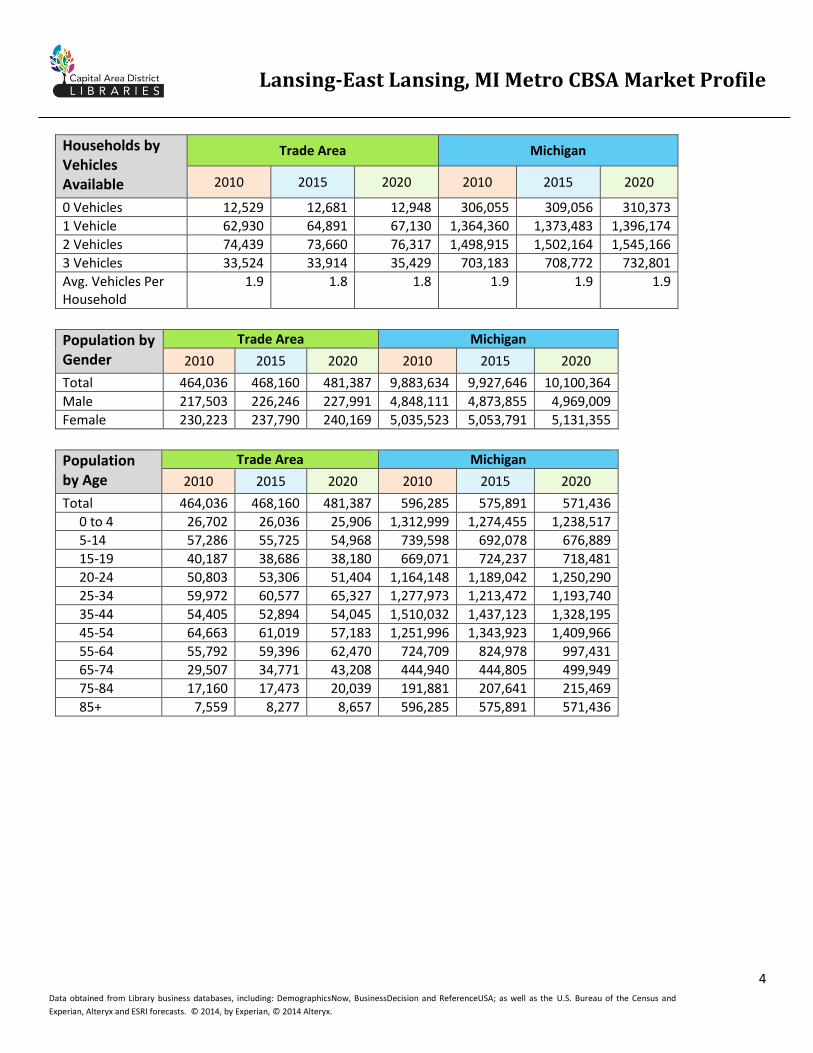
Households by Vehicles Available
Trade Area Michigan
2010 2015 2020 2010 2015 2020
0 Vehicles 12,529 12,681 12,948 306,055 309,056 310,373
1 Vehicle 62,930 64,891 67,130 1,364,360 1,373,483 1,396,174
2 Vehicles 74,439 73,660 76,317 1,498,915 1,502,164 1,545,166
3 Vehicles 33,524 33,914 35,429 703,183 708,772 732,801
Avg. Vehicles Per Household
1.9 1.8 1.8 1.9 1.9 1.9
Population by Gender
Trade Area Michigan
2010 2015 2020 2010 2015 2020
Total 464,036 468,160 481,387 9,883,634 9,927,646 10,100,364
Male 217,503 226,246 227,991 4,848,111 4,873,855 4,969,009
Female 230,223 237,790 240,169 5,035,523 5,053,791 5,131,355
Population by Age
Trade Area Michigan
2010 2015 2020 2010 2015 2020
Total 464,036 468,160 481,387 596,285 575,891 571,436
0 to 4 26,702 26,036 25,906 1,312,999 1,274,455 1,238,517
5-14 57,286 55,725 54,968 739,598 692,078 676,889
15-19 40,187 38,686 38,180 669,071 724,237 718,481
20-24 50,803 53,306 51,404 1,164,148 1,189,042 1,250,290
25-34 59,972 60,577 65,327 1,277,973 1,213,472 1,193,740
35-44 54,405 52,894 54,045 1,510,032 1,437,123 1,328,195
45-54 64,663 61,019 57,183 1,251,996 1,343,923 1,409,966
55-64 55,792 59,396 62,470 724,709 824,978 997,431
65-74 29,507 34,771 43,208 444,940 444,805 499,949
75-84 17,160 17,473 20,039 191,881 207,641 215,469
85+ 7,559 8,277 8,657 596,285 575,891 571,436

Lansing-East Lansing, MI Metro CBSA Market Profile
5 Data obtained from Library business databases, including: DemographicsNow, BusinessDecision and ReferenceUSA; as well as the U.S. Bureau of the Census and
Experian, Alteryx and ESRI forecasts. © 2014, by Experian, © 2014 Alteryx.
Population by Race/Ethnicity
Trade Area Michigan
2010 2015 2020 2010 2015 2020
Total 464,036 468,160 481,387 7,803,115 7,771,948 7,845,973
White 378,492 378,973 384,332 1,400,362 1,400,919 1,389,398
Black 41,407 42,157 43,461 62,007 64,154 66,512
American Indian or Alaska Native
2,345 2,366 2,418 240,803 277,210 324,059
Asian/Native Hawaiian/ Other Pacific Islander
17,670 18,883 21,445 147,029 159,167 174,558
Some Other Race 8,740 9,359 10,518 230,319 254,249 299,865
Two or More Races 15,382 16,422 19,213 436,358 477,355 530,537
Hispanic Ethnicity 28,574 30,793 34,672 9,447,276 9,450,291 9,569,828
Not Hispanic or Latino 435,462 437,367 446,715 7,803,115 7,771,948 7,845,973
Population 25+ by Educational Attainment
Trade Area Michigan
2010 2015 2020 2010 2015 2020
Grade K - 8 5,378 5,261 5,485 156,925 155,609 158,650
Grade 9 - 11 16,150 16,288 17,055 512,334 512,276 521,301
High School Graduate 71,810 73,285 77,024 2,029,998 2,033,665 2,089,153
Some College, No Degree 78,707 78,028 81,787 1,590,693 1,604,109 1,657,050
Associates Degree 27,389 28,336 29,978 549,087 567,184 590,835
Bachelor’s Degree 51,651 53,439 57,018 1,024,754 1,057,872 1,110,163
Graduate Degree 35,456 37,231 39,932 631,594 658,341 694,258
No Schooling Completed 2,517 2,539 2,650 70,295 71,929 73,631
Total Population Age 25+ 289,058 294,407 310,929 6,565,679 6,660,985 6,895,041
Population 15+ by Marital Status
Trade Area Michigan
2010 2015 2020 2010 2015 2020
Married, Spouse Present 176,697 166,546 171,714 3,752,807 3,722,136 3,810,680
Married, Spouse Absent 8,287 11,371 12,021 259,255 265,743 274,491
Divorced 37,971 43,917 45,778 921,113 954,269 983,660
Widowed 16,549 17,949 18,719 503,192 501,465 512,935
Never Married 140,544 146,616 152,281 2,537,982 2,633,687 2,708,645
Age 15 + Population 380,048 386,399 400,513 7,974,349 8,077,300 8,290,411

Lansing-East Lansing, MI Metro CBSA Market Profile
6 Data obtained from Library business databases, including: DemographicsNow, BusinessDecision and ReferenceUSA; as well as the U.S. Bureau of the Census and
Experian, Alteryx and ESRI forecasts. © 2014, by Experian, © 2014 Alteryx.
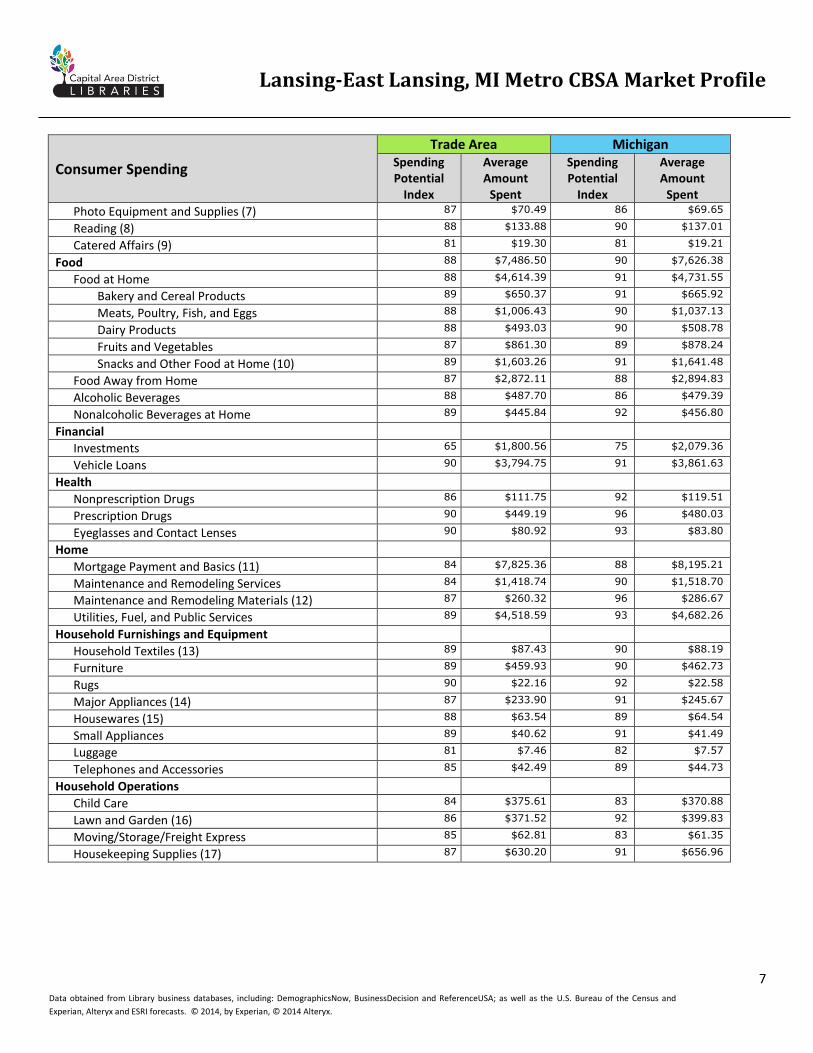
Consumer Spending Data shows the amount that households spend in the listed product and service categories and compares the amounts
to national data.
Consumer Spending
Trade Area Michigan Spending Potential
Index
Average Amount
Spent
Spending Potential
Index
Average Amount
Spent
Apparel and Services 87 $2,010.66 88 $2,028.22
Men's 87 $376.28 87 $377.58
Women's 88 $712.85 89 $716.89
Children's 86 $319.92 87 $324.13
Footwear 87 $395.73 88 $401.74
Watches & Jewelry 86 $124.80 86 $124.55
Apparel Products and Services (1) 83 $81.08 85 $83.33
Computer
Computers and Hardware for Home Use 88 $189.72 88 $189.40
Portable Memory 91 $4.92 89 $4.77
Computer Software 86 $17.32 82 $16.62
Computer Accessories 86 $16.48 88 $16.87
Entertainment & Recreation 87 $2,886.04 90 $2,972.82
Fees and Admissions 86 $554.53 85 $550.76
Membership Fees for Clubs (2) 87 $148.73 86 $147.87
Fees for Participant Sports, excl. Trips 85 $102.85 85 $101.94
Admission to Movie/Theatre/Opera/Ballet 85 $139.39 84 $138.00
Admission to Sporting Events, excl. Trips 93 $61.57 92 $60.92
Fees for Recreational Lessons 83 $101.37 83 $101.47
Dating Services 102 $0.61 93 $0.56
TV/Video/Audio 90 $1,173.92 92 $1,197.36
Cable and Satellite Television Services 90 $805.82 93 $833.15
Televisions 91 $134.39 90 $133.37
Satellite Dishes 92 $1.45 93 $1.46
VCRs, Video Cameras, and DVD Players 91 $9.96 90 $9.90
Miscellaneous Video Equipment 88 $9.50 86 $9.28
Video Cassettes and DVDs 90 $29.02 89 $28.62
Video Game Hardware/Accessories 93 $21.43 90 $20.77
Video Game Software 96 $26.28 92 $25.19
Streaming/Downloaded Video 82 $4.71 80 $4.58
Rental of Video Cassettes and DVDs 89 $20.95 88 $20.68
Installation of Televisions 84 $0.94 84 $0.94
Audio (3) 85 $105.21 85 $104.80
Rental and Repair of TV/Radio/Sound Equipment 79 $4.26 86 $4.61
Pets 87 $494.26 93 $527.43
Toys and Games (4) 90 $110.40 90 $110.75
Recreational Vehicles and Fees (5) 79 $172.52 89 $194.42
Sports/Recreation/Exercise Equipment (6) 83 $156.74 88 $166.22
Lansing-East Lansing, MI Metro CBSA Market Profile
7 Data obtained from Library business databases, including: DemographicsNow, BusinessDecision and ReferenceUSA; as well as the U.S. Bureau of the Census and
Experian, Alteryx and ESRI forecasts. © 2014, by Experian, © 2014 Alteryx.
Consumer Spending
Trade Area Michigan
Spending Potential
Index
Average Amount
Spent
Spending Potential
Index
Average Amount
Spent
Photo Equipment and Supplies (7) 87 $70.49 86 $69.65
Reading (8) 88 $133.88 90 $137.01
Catered Affairs (9) 81 $19.30 81 $19.21
Food 88 $7,486.50 90 $7,626.38
Food at Home 88 $4,614.39 91 $4,731.55
Bakery and Cereal Products 89 $650.37 91 $665.92
Meats, Poultry, Fish, and Eggs 88 $1,006.43 90 $1,037.13
Dairy Products 88 $493.03 90 $508.78
Fruits and Vegetables 87 $861.30 89 $878.24
Snacks and Other Food at Home (10) 89 $1,603.26 91 $1,641.48
Food Away from Home 87 $2,872.11 88 $2,894.83
Alcoholic Beverages 88 $487.70 86 $479.39
Nonalcoholic Beverages at Home 89 $445.84 92 $456.80
Financial
Investments 65 $1,800.56 75 $2,079.36
Vehicle Loans 90 $3,794.75 91 $3,861.63
Health
Nonprescription Drugs 86 $111.75 92 $119.51
Prescription Drugs 90 $449.19 96 $480.03
Eyeglasses and Contact Lenses 90 $80.92 93 $83.80
Home
Mortgage Payment and Basics (11) 84 $7,825.36 88 $8,195.21
Maintenance and Remodeling Services 84 $1,418.74 90 $1,518.70
Maintenance and Remodeling Materials (12) 87 $260.32 96 $286.67
Utilities, Fuel, and Public Services 89 $4,518.59 93 $4,682.26
Household Furnishings and Equipment
Household Textiles (13) 89 $87.43 90 $88.19
Furniture 89 $459.93 90 $462.73
Rugs 90 $22.16 92 $22.58
Major Appliances (14) 87 $233.90 91 $245.67
Housewares (15) 88 $63.54 89 $64.54
Small Appliances 89 $40.62 91 $41.49
Luggage 81 $7.46 82 $7.57
Telephones and Accessories 85 $42.49 89 $44.73
Household Operations
Child Care 84 $375.61 83 $370.88
Lawn and Garden (16) 86 $371.52 92 $399.83
Moving/Storage/Freight Express 85 $62.81 83 $61.35
Housekeeping Supplies (17) 87 $630.20 91 $656.96

Lansing-East Lansing, MI Metro CBSA Market Profile
8 Data obtained from Library business databases, including: DemographicsNow, BusinessDecision and ReferenceUSA; as well as the U.S. Bureau of the Census and
Experian, Alteryx and ESRI forecasts. © 2014, by Experian, © 2014 Alteryx.
Consumer Spending
Trade Area Michigan
Spending Potential
Index
Average Amount
Spent
Spending Potential
Index
Average Amount Spent
Insurance
Owners and Renters Insurance 88 $442.39 94 $474.81
Vehicle Insurance 88 $1,064.29 90 $1,093.57
Life/Other Insurance 86 $396.76 93 $427.10
Health Insurance 89 $2,363.97 94 $2,480.00
Personal Care Products (18) 87 $405.59 89 $415.43
School Books and Supplies (19) 93 $167.64 89 $161.00
Smoking Products 95 $443.25 99 $459.27
Transportation
Vehicle Purchases (Net Outlay) (20) 90 $3,640.20 93 $3,747.89
Gasoline and Motor Oil 90 $3,153.96 93 $3,253.98
Vehicle Maintenance and Repairs 88 $979.82 90 $1,000.26
Travel
Airline Fares 83 $396.82 83 $395.01
Lodging on Trips 84 $379.35 87 $393.99
Auto/Truck/Van Rental on Trips 83 $27.91 83 $27.98
Food and Drink on Trips 85 $396.22 87 $407.58
Notes for Consumer Spending Data The Spending Potential Index (SPI) is household-based, and represents the amount spent for a product or service relative to a national average of
100. Detail may not sum to totals due to rounding. Consumer Spending data are derived from the 2010 and 2011 Consumer Expenditure Surveys,
Bureau of Labor Statistics.
(1) Apparel Products and Services includes material for making clothes, sewing patterns and notions, shoe repair and other shoe services, apparel
laundry and dry cleaning, alteration, repair and tailoring of apparel, clothing rental and storage, and watch and jewelry repair.
(2) Membership Fees for Clubs includes membership fees for social, recreational, and civic clubs. (3) Audio includes satellite radio service, sound components and systems, digital audio players, records, CDs, audio tapes, streaming/downloaded audio,
tape recorders, radios, musical instruments and accessories, and rental and repair of musical instruments.
(4) Toys and Games includes toys, games, arts and crafts, tricycles, playground equipment, arcade games, and online entertainment and games. (5) Recreational Vehicles & Fees includes docking and landing fees for boats and planes, purchase and rental of RVs or boats, and camp fees. (6) Sports/Recreation/Exercise Equipment includes exercise equipment and gear, game tables, bicycles, camping equipment, hunting and fishing
equipment, winter sports equipment, water sports equipment, other sports equipment, and rental/repair of sports/recreation/exercise equipment.
(7) Photo Equipment and Supplies includes film, film processing, photographic equipment, rental and repair of photo equipment, and photographer fees. (8) Reading includes digital book readers, books, magazine and newspaper subscriptions, and single copies of magazines and newspapers.. (9) Catered Affairs includes expenses associated with live entertainment and rental of party supplies. (10) Snacks and Other Food at Home includes candy, chewing gum, sugar, artificial sweeteners, jam, jelly, preserves, margarine, fat, oil, salad dressing,
nondairy cream and milk, peanut butter, frozen prepared food, potato chips, nuts, salt, spices, seasonings, olives, pickles, relishes, sauces, gravy, other
condiments, soup, prepared salad, prepared dessert, baby food, miscellaneous prepared food, and nonalcoholic beverages.
(11) Mortgage Payment and Basics includes mortgage interest, mortgage principal, property taxes, homeowners insurance, and ground rent. (12) Maintenance and Remodeling Materials includes supplies/tools/equipment for painting and wallpapering, plumbing supplies and equipment,
electrical/heating/AC supplies, materials for hard surface flooring, materials for roofing/gutters, materials for plaster/panel/siding, materials for
patio/fence/brick work, landscaping materials, and insulation materials for owned homes.
(13) Household Textiles includes bathroom linens, bedroom linens, kitchen linens, dining room linens, other linens, curtains, draperies, slipcovers, decorative
pillows, and materials for slipcovers and curtains.
(14) Major Appliances includes dishwashers, disposals, refrigerators, freezers, washers, dryers, stoves, ovens, microwaves, window air conditioners, electric
floor cleaning equipment, sewing machines, and miscellaneous appliances.
(15) Housewares includes plastic dinnerware, china, flatware, glassware, serving pieces, nonelectric cookware, and tableware. (16) Lawn and Garden includes lawn and garden supplies, equipment and care service, indoor plants, fresh flowers, and repair/rental of lawn and garden
equipment.

Lansing-East Lansing, MI Metro CBSA Market Profile
9 Data obtained from Library business databases, including: DemographicsNow, BusinessDecision and ReferenceUSA; as well as the U.S. Bureau of the Census and
Experian, Alteryx and ESRI forecasts. © 2014, by Experian, © 2014 Alteryx.
(17) Housekeeping Supplies includes soaps and laundry detergents, cleaning products, toilet tissue, paper towels, napkins, paper/plastic/foil products,
stationery, giftwrap supplies, postage, and delivery services.
(18) Personal Care Products includes hair care products, nonelectric articles for hair, wigs, hairpieces, oral hygiene products, shaving needs, perfume,
cosmetics, skincare, bath products, nail products, deodorant, feminine hygiene products, adult diapers, and personal care appliances.
(19) School Books and Supplies includes school books and supplies for College, Elementary school, High school, Vocational/Technical School, Preschool/Other
Schools, and Other School Supplies.
(20) Vehicle Purchases (Net Outlay) includes net outlay for new and used cars, trucks, vans, motorcycles, and motor scooters.
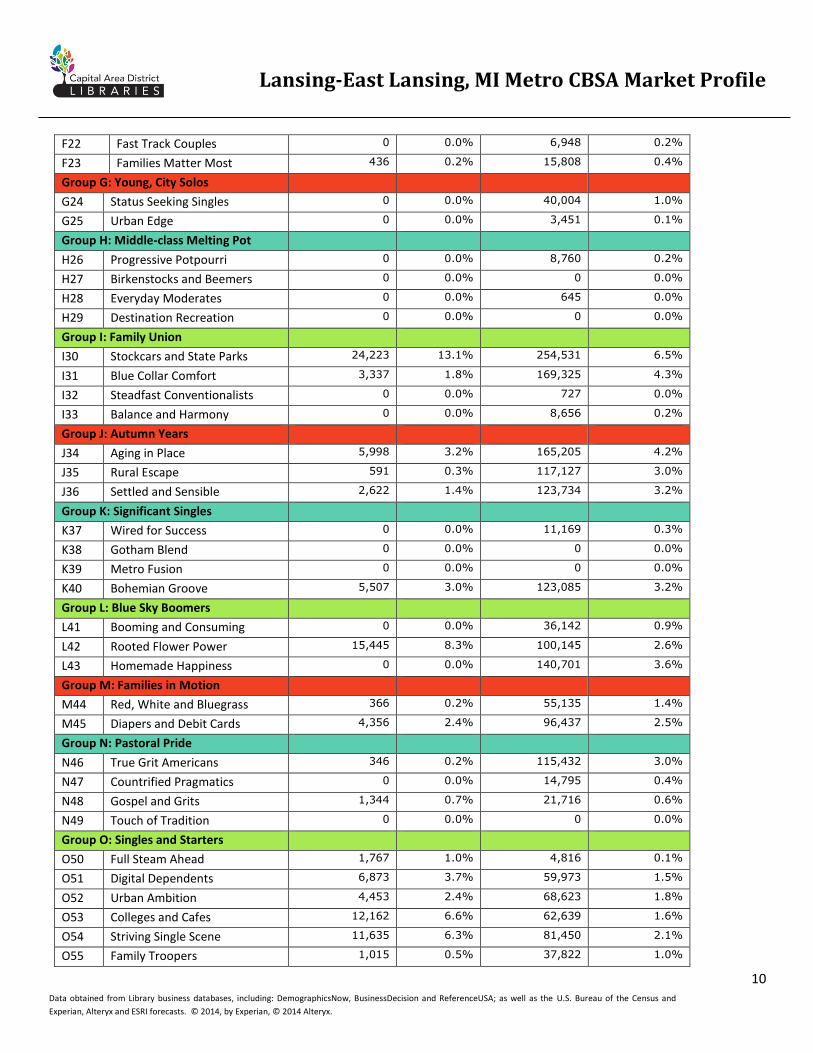
Consumer Lifestyle Consumer segmentation tools classify American consumers into categories that have similar demographic and
socioeconomic characteristics. A popular tool that segments groups is Mosaic by Experian. Additional information on
Mosaic can be found at: http://ow.ly/xjeTo
Household Mosaic Summary Trade Area Michigan
Mosaic Cluster & Segment Households (2014) % Households (2014) %
Group A: Power Elite
A01 American Royalty 0 0.0% 48,033 1.2%
A02 Platinum Prosperity 848 0.5% 23,803 0.6%
A03 Kids and Cabernet 0 0.0% 10,433 0.3%
A04 Picture Perfect Families 301 0.2% 13,160 0.3%
A05 Couples with Clout 0 0.0% 6,374 0.2%
A06 Jet Set Urbanites 0 0.0% 0 0.0%
Group B: Flourishing Families
B07 Generational Soup 0 0.0% 61,007 1.6%
B08 Babies and Bliss 615 0.3% 45,270 1.2%
B09 Family Fun-tastic 6,647 3.6% 64,471 1.7%
B10 Cosmopolitan Achievers 0 0.0% 672 0.0%
Group C: Booming with Confidence
C11 Aging of Aquarius 23,176 12.5% 289,637 7.4%
C12 Golf Carts and Gourmets 0 0.0% 8,277 0.2%
C13 Silver Sophisticates 1,189 0.6% 51,809 1.3%
C14 Boomers and Boomerangs 2,997 1.6% 78,984 2.0%
Group D: Suburban Style
D15 Sports Utility Families 1,445 0.8% 77,404 2.0%
D16 Settled in Suburbia 0 0.0% 18,600 0.5%
D17 Cul de Sac Diversity 0 0.0% 541 0.0%
D18 Suburban Attainment 3,749 2.0% 111,070 2.9%
Group E: Thriving Boomers
E19 Full Pockets, Empty Nests 1,096 0.6% 38,238 1.0%
E20 No Place Like Home 12,015 6.5% 134,112 3.4%
E21 Unspoiled Splendor 10,562 5.7% 218,526 5.6%
Group F: Promising Families
Lansing-East Lansing, MI Metro CBSA Market Profile
10 Data obtained from Library business databases, including: DemographicsNow, BusinessDecision and ReferenceUSA; as well as the U.S. Bureau of the Census and
Experian, Alteryx and ESRI forecasts. © 2014, by Experian, © 2014 Alteryx.
F22 Fast Track Couples 0 0.0% 6,948 0.2%
F23 Families Matter Most 436 0.2% 15,808 0.4%
Group G: Young, City Solos
G24 Status Seeking Singles 0 0.0% 40,004 1.0%
G25 Urban Edge 0 0.0% 3,451 0.1%
Group H: Middle-class Melting Pot
H26 Progressive Potpourri 0 0.0% 8,760 0.2%
H27 Birkenstocks and Beemers 0 0.0% 0 0.0%
H28 Everyday Moderates 0 0.0% 645 0.0%
H29 Destination Recreation 0 0.0% 0 0.0%
Group I: Family Union
I30 Stockcars and State Parks 24,223 13.1% 254,531 6.5%
I31 Blue Collar Comfort 3,337 1.8% 169,325 4.3%
I32 Steadfast Conventionalists 0 0.0% 727 0.0%
I33 Balance and Harmony 0 0.0% 8,656 0.2%
Group J: Autumn Years
J34 Aging in Place 5,998 3.2% 165,205 4.2%
J35 Rural Escape 591 0.3% 117,127 3.0%
J36 Settled and Sensible 2,622 1.4% 123,734 3.2%
Group K: Significant Singles
K37 Wired for Success 0 0.0% 11,169 0.3%
K38 Gotham Blend 0 0.0% 0 0.0%
K39 Metro Fusion 0 0.0% 0 0.0%
K40 Bohemian Groove 5,507 3.0% 123,085 3.2%
Group L: Blue Sky Boomers
L41 Booming and Consuming 0 0.0% 36,142 0.9%
L42 Rooted Flower Power 15,445 8.3% 100,145 2.6%
L43 Homemade Happiness 0 0.0% 140,701 3.6%
Group M: Families in Motion
M44 Red, White and Bluegrass 366 0.2% 55,135 1.4%
M45 Diapers and Debit Cards 4,356 2.4% 96,437 2.5%
Group N: Pastoral Pride
N46 True Grit Americans 346 0.2% 115,432 3.0%
N47 Countrified Pragmatics 0 0.0% 14,795 0.4%
N48 Gospel and Grits 1,344 0.7% 21,716 0.6%
N49 Touch of Tradition 0 0.0% 0 0.0%
Group O: Singles and Starters
O50 Full Steam Ahead 1,767 1.0% 4,816 0.1%
O51 Digital Dependents 6,873 3.7% 59,973 1.5%
O52 Urban Ambition 4,453 2.4% 68,623 1.8%
O53 Colleges and Cafes 12,162 6.6% 62,639 1.6%
O54 Striving Single Scene 11,635 6.3% 81,450 2.1%
O55 Family Troopers 1,015 0.5% 37,822 1.0%

Lansing-East Lansing, MI Metro CBSA Market Profile
11 Data obtained from Library business databases, including: DemographicsNow, BusinessDecision and ReferenceUSA; as well as the U.S. Bureau of the Census and
Experian, Alteryx and ESRI forecasts. © 2014, by Experian, © 2014 Alteryx.
Group P: Cultural Connections
P56 Mid-scale Medley 0 0.0% 16,260 0.4%
P57 Modest Metro Means 0 0.0% 0 0.0%
P58 Heritage Heights 0 0.0% 0 0.0%
P59 Expanding Horizons 0 0.0% 17,430 0.4%
P60 Striving Forward 0 0.0% 2,361 0.1%
P61 Humble Beginnings 0 0.0% 0 0.0%
Group Q: Golden Year Guardians
Q62 Reaping Rewards 458 0.2% 26,414 0.7%
Q63 Footloose and Family Tree 0 0.0% 4,910 0.1%
Q64 Town Elders 2,338 1.3% 88,480 2.3%
Q65 Senior Discounts 2,636 1.4% 48,317 1.2%
Group R: Aspirational Fusion
R66 Dare to Dream 5,418 2.9% 71,492 1.8%
R67 Hope for Tomorrow 2,797 1.5% 84,986 2.2%
Group S: Struggling Societies
S68 Small Town Shallow Pockets 701 0.4% 47,855 1.2%
S69 Urban Survivors 1,645 0.9% 200,267 5.1%
S70 Tight Money 0 0.0% 340 0.0%
S71 Tough Times 2,037 1.1% 38,939 1.0%
Group U: Unclassified
U00 Unclassified 0 0.0% 0 0.0%
The following links contain general overviews for the top 5 segments in the Lansing-East Lansing, MI Metro CBSA.
1. I30 Stockcars and State Parks
2. C11 Aging of Aquarius
3. L42 Rooted Flower Power
4. O53 Colleges and Cafes
5. E20 No Place Like Home
The following links contain general overviews for the top 5 segments in Michigan
1. C11 Aging of Aquarius
2. I30 Stockcars and State Parks
3. E21 Unspoiled Splendor
4. S69 Urban Survivors
5. I31 Blue Collar Comfort
Additional information for each segment as well as profiles for all 71 segments is available at http://ow.ly/Fj4TK