interim condensed consolidated financial statements - cma cgm · interim condensed consolidated...
TRANSCRIPT

INTERIM CONDENSED
CONSOLIDATED FINANCIAL STATEMENTS
* * *
Nine and three-month period ended September 30, 2015


The accompanying notes are part of the interim condensed consolidated financial statements.
Contents
1. Corporate information .................................................................................................................................. 9
2. Accounting policies ....................................................................................................................................... 9
3. Significant events occurred during the period .............................................................................................. 11
4. Operating segments .................................................................................................................................... 12
5. Operating expenses ..................................................................................................................................... 13
6. Gains / (Losses) on disposal of property and equipment and subsidiaries ..................................................... 14
7. Other income and expenses ......................................................................................................................... 14
8. NPV benefits related to assets financed by tax leases .................................................................................. 14
9. Financial result ............................................................................................................................................ 15
10. Income and deferred taxes ......................................................................................................................... 15
11. Goodwill and other intangible assets ..........................................................................................................16
12. Property and equipment ............................................................................................................................ 17
13. Investments in associates and joint ventures ............................................................................................. 20
14. Derivative financial instruments ................................................................................................................. 21
15. Other non-current financial assets ............................................................................................................. 21
16. Working Capital ........................................................................................................................................ 22
17. Securities and other current financial assets ............................................................................................... 23
18. Cash and cash equivalents ......................................................................................................................... 23
19. Borrowings ............................................................................................................................................... 24
20. Provisions, retirement benefit obligations and contingent liabilities ......................................................... 25
20.1 Provisions related to employee benefits ......................................................................................... 26
20.2 Provisions for litigation and other risks and obligations .................................................................. 26
20.3 Contingent liabilities ....................................................................................................................... 26
21. Commitments ............................................................................................................................................ 27
22. Related party transactions ......................................................................................................................... 27
23. Post balance sheet events .......................................................................................................................... 27
CMA CGM / 2 Interim condensed consolidated financial statements Nine and three-month period ended September 30, 2015

The accompanying notes are part of the interim condensed consolidated financial statements.
Interim Consolidated Statement of Profit & Loss
For the nine and three-month period ended September 30, 2015
(in USD million, except for earnings per share)
Note 2015 2014 2015 2014
REVENUE (4) 12,100.6 12,509.1 3,976.8 4,367.9
(5) (10,962.8) (11,632.6) (3,733.1) (4,042.8)
1,137.8 876.4 243.7 325.1
(6) (0.5) 27.8 (0.4) 1.1 (12) (299.2) (298.4) (100.0) (100.0)(7) 20.0 (26.0) 2.5 (0.3)(8) 36.5 54.7 12.0 18.5
894.6 634.5 157.8 244.4
(13) (6.2) 5.4 (17.8) 4.3
(4) 888.4 639.9 140.0 248.7
(207.9) (236.8) (68.4) (73.7)19.3 24.2 6.9 7.6 (7.4) 34.7 (0.8) 45.0
(9) (196.0) (177.9) (62.3) (21.1)692.4 462.0 77.7 227.7
Income taxes (10) (61.8) (50.5) (20.7) (20.1)
630.6 411.5 57.0 207.6
17.5 19.7 6.2 6.4
613.1 391.8 50.8 201.2
42.0 27.7 3.8 13.9
Share of income / (loss) from associates and joint ventures
Other income and expenses
PROFIT FOR THE PERIOD
OWNERS OF THE PARENT
NON CONTROLLING INTERESTS
OPERATING PROFIT BEFORE SHARE OF PROFIT OF ASSOCIATES AND JOINT VENTURES
Interests expense on borrowings
For the three-month period ended September 30,
Earnings per share basic and diluted attributable to the owners of the parent company (in USD)
For the nine-month period ended September 30,
Operating expenses
Gains / (losses) on disposal of property and equipment and subsidiariesDepreciation and amortization of non-current assets
Net present value (NPV) benefits related to assets financed by tax leases
OPERATING PROFIT AFTER SHARE OF PROFIT OF ASSOCIATES AND JOINT VENTURES
OPERATING PROFIT BEFORE GAINS ON DISPOSAL OF PROPERTY AND EQUIPMENT AND SUBSIDIARIES, DEPRECIATION & AMORTIZATION, etc.
of which:
FINANCIAL RESULT
Interests income on cash and cash equivalentOther net financial items
PROFIT BEFORE TAX
Interim condensed consolidated financial statements CMA CGM / 3 Nine and three-month period ended September 30, 2015
The accompanying notes are part of the interim condensed consolidated financial statements.
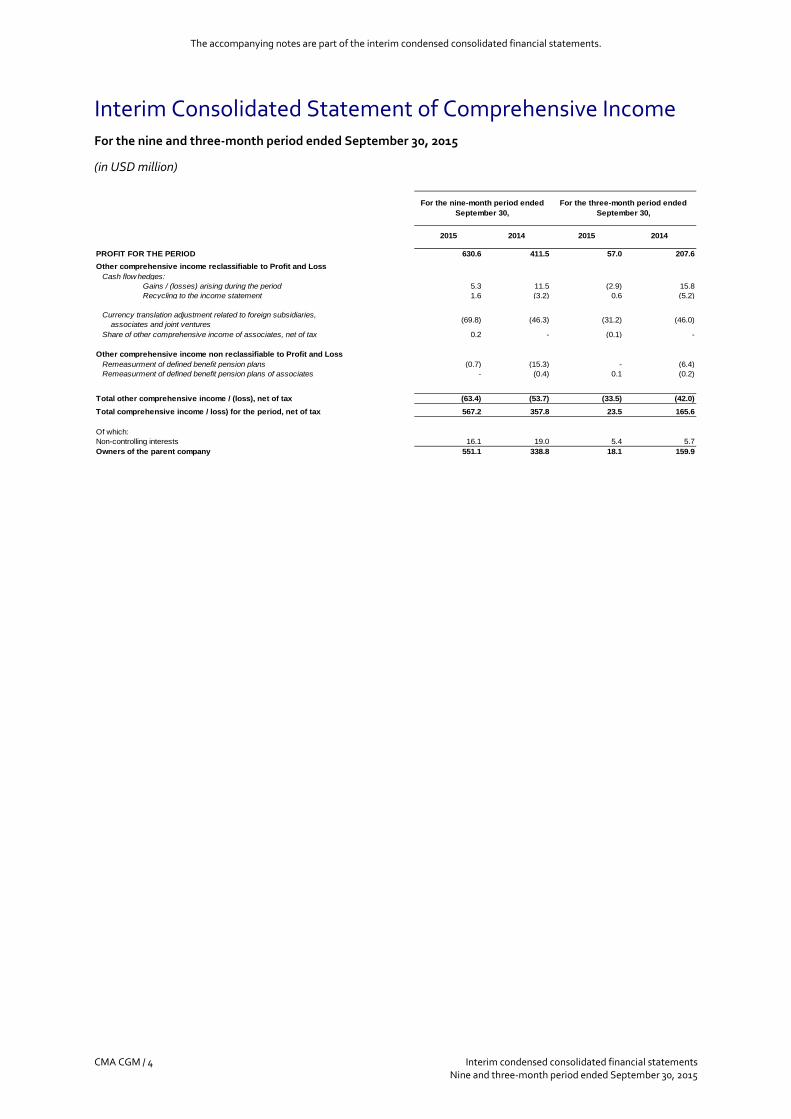
Interim Consolidated Statement of Comprehensive Income
For the nine and three-month period ended September 30, 2015
(in USD million)
2015 2014 2015 2014
630.6 411.5 57.0 207.6
5.3 11.5 (2.9) 15.8 1.6 (3.2) 0.6 (5.2)
(69.8) (46.3) (31.2) (46.0)
0.2 - (0.1) -
(0.7) (15.3) - (6.4)- (0.4) 0.1 (0.2)
(63.4) (53.7) (33.5) (42.0)567.2 357.8 23.5 165.6
Of which:16.1 19.0 5.4 5.7
551.1 338.8 18.1 159.9
Other comprehensive income reclassifiable to Profit and Loss
Non-controlling interests
Gains / (losses) arising during the periodRecycling to the income statement
For the three-month period ended September 30,
Total comprehensive income / loss) for the period, net of taxTotal other comprehensive income / (loss), net of tax
Share of other comprehensive income of associates, net of tax
Currency translation adjustment related to foreign subsidiaries, associates and joint ventures
Remeasurment of defined benefit pension plans of associates
Owners of the parent company
PROFIT FOR THE PERIOD
Cash flow hedges:
Other Comprehensive Income For the nine-month period ended September 30,
Remeasurment of defined benefit pension plansOther comprehensive income non reclassifiable to Profit and Loss
CMA CGM / 4 Interim condensed consolidated financial statements Nine and three-month period ended September 30, 2015

The accompanying notes are part of the interim condensed consolidated financial statements.
Interim Consolidated Statement of Financial Position Assets
As at September 30, 2015
(in USD million)
ASSETS As at September 30, 2015
As at December 31, 2014
Note
Goodwill (11) 315.8 289.7 Other intangible assets (11) 237.1 222.4 INTANGIBLE ASSETS 552.9 512.1
Vessels (12) 6,417.6 5,974.4 Containers (12) 531.1 544.9 Lands and buildings (12) 497.5 540.2 Other properties and equipments (12) 142.6 110.8 PROPERTY AND EQUIPMENT (12) 7,588.8 7,170.3
Deferred tax assets (10) 34.0 34.2 Investments in associates and joint ventures (13) 646.2 686.1 Non-current derivative financial instruments (14) - 3.0 Other non-current financial assets (15) 576.4 657.3 NON-CURRENT ASSETS 9,398.3 9,063.0
Inventories (16) 280.8 384.4 Trade and other receivables (16) 2,208.5 2,382.7 Current income tax asset (16) 18.1 15.6 Current derivative financial instruments (14) - 3.9 Securities and other current financial assets (17) 90.8 77.1 Cash and cash equivalents (18) 1,732.6 2,186.5 Prepaid expenses (16) 333.1 249.4 Assets classified as held-for-sale - 0.5 CURRENT ASSETS 4,663.9 5,300.1
TOTAL ASSETS 14,062.2 14,363.1
Interim condensed consolidated financial statements CMA CGM / 5 Nine and three-month period ended September 30, 2015
The accompanying notes are part of the interim condensed consolidated financial statements.
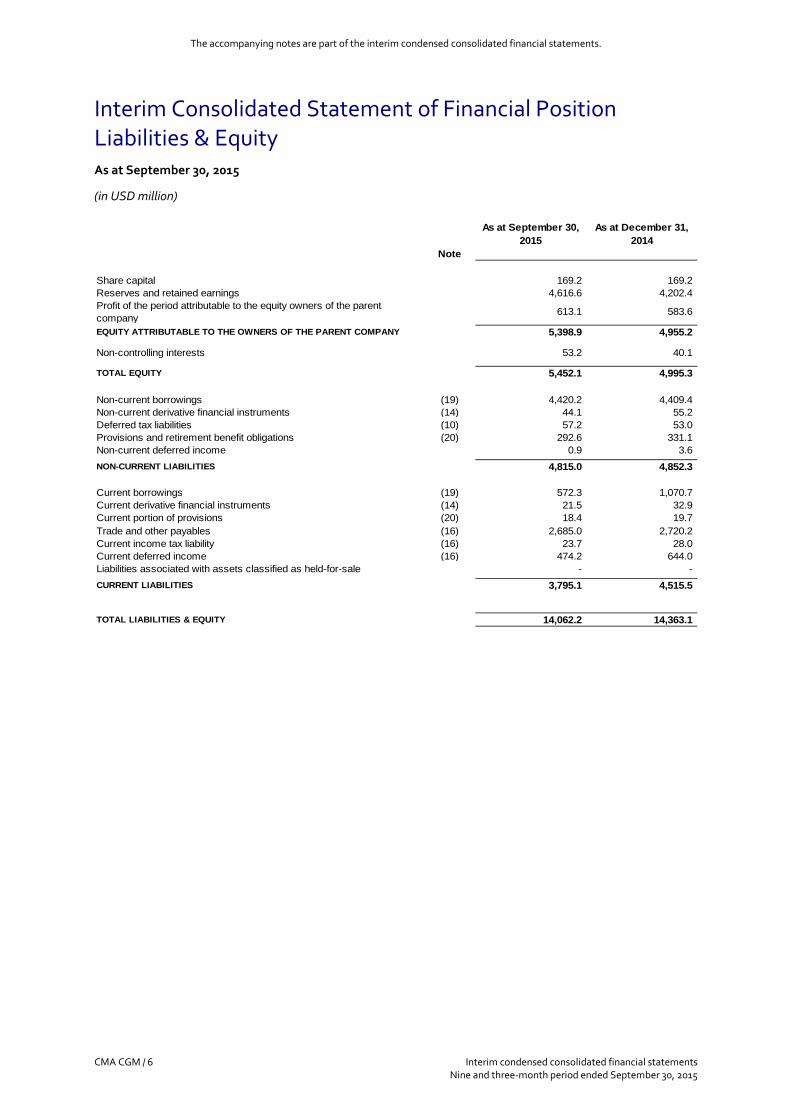
Interim Consolidated Statement of Financial Position Liabilities & Equity
As at September 30, 2015
(in USD million)
LIABILITIES AND EQUITY As at September 30, 2015
As at December 31, 2014
Note
Share capital 169.2 169.2 Reserves and retained earnings 4,616.6 4,202.4 Profit of the period attributable to the equity owners of the parent company 613.1 583.6
EQUITY ATTRIBUTABLE TO THE OWNERS OF THE PARENT COMPANY 5,398.9 4,955.2
Non-controlling interests 53.2 40.1
TOTAL EQUITY 5,452.1 4,995.3
Non-current borrowings (19) 4,420.2 4,409.4 Non-current derivative financial instruments (14) 44.1 55.2 Deferred tax liabilities (10) 57.2 53.0 Provisions and retirement benefit obligations (20) 292.6 331.1 Non-current deferred income 0.9 3.6 NON-CURRENT LIABILITIES 4,815.0 4,852.3
Current borrowings (19) 572.3 1,070.7 Current derivative financial instruments (14) 21.5 32.9 Current portion of provisions (20) 18.4 19.7 Trade and other payables (16) 2,685.0 2,720.2 Current income tax liability (16) 23.7 28.0 Current deferred income (16) 474.2 644.0 Liabilities associated with assets classified as held-for-sale - - CURRENT LIABILITIES 3,795.1 4,515.5
TOTAL LIABILITIES & EQUITY 14,062.2 14,363.1
CMA CGM / 6 Interim condensed consolidated financial statements Nine and three-month period ended September 30, 2015

The accompanying notes are part of the interim condensed consolidated financial statements.
Interim Consolidated Statement of Changes in Equity
As at September 30, 2015 and September 30, 2014
(in USD million)
Bonds redeemable in
shares (**)
Premium, legal reserves, Profit
for the period and other
comprehensive income non
reclassifiable to profit and loss
Other comprehensive
income reclassifiable to profit and loss
Balance as at January 1, 2014 169.2 331.6 4,007.7 (16.6) 4,491.9 49.2 4,541.1
Profit for the period - - 391.8 - 391.8 19.7 411.5
- - (15.3) (37.8) (53.1) (0.7) (53.8)
Total comprehensive income / (expense) for the period - - 376.5 (37.8) 338.7 19.0 357.7
Transaction with non-controlling interests - - (2.5) 1.0 (1.5) (3.8) (5.3)
Dividends - - (40.0) - (40.0) (24.6) (64.6)
Balance as at September 30, 2014 169.2 331.6 4,341.7 (53.4) 4,789.1 39.8 4,828.9
Balance as at January 1, 2015 169.2 331.6 4,536.8 (82.4) 4,955.2 40.1 4,995.3
Profit for the period - - 613.1 - 613.1 17.5 630.6
- - (0.7) (61.3) (62.0) (1.4) (63.4)
Total comprehensive income / (expense) for the period - - 612.4 (61.3) 551.1 16.1 567.2
- - (27.6) 0.2 (27.4) 10.7 (16.7)
Dividends - - (80.0) - (80.0) (13.7) (93.7)Total transactions with Shareholders - - (107.6) 0.2 (107.4) (3.0) (110.4)Balance as at September 30, 2015 169.2 331.6 5,041.6 (143.5) 5,398.9 53.2 5,452.1
Non-controlling interestsTOTAL
Attributable to the equity owners of the parent
Reserves, retained earnings and Profit for the period
Total Equity
Other comprehensive income / (expense), net of tax
Transaction with non-controlling interests
Share capital (*)
Other comprehensive income / (expense), net of tax
(*) The share capital is composed of 10,578,357 shares. The share capital is fully constituted of ordinary shares with the exception of two preference shares held by Yildirim (one “A” preferred share) and the Fonds Strategique d’Investissement (FSI being now Banque Publique d’Investissement (Bpifrance) – one “C” preferred share). (**) In 2011 and 2013, Yildirim subscribed for USD 600 million to bonds mandatorily redeemable in the Company’s preferred shares as at December 31, 2015. As at December 31, 2017, these preferred shares held by Yildirim will automatically be converted into ordinary shares of the Company giving access to 24% of the Company’s ordinary shares on a fully diluted basis. In June 2013, the FSI subscribed for USD 150 million to new bonds mandatorily redeemable in the Company’s ordinary shares, giving access to 6% of the Company’s ordinary shares upon conversion on a fully diluted basis. These bonds matures in December 2020.
Due to their characteristics, these above mentionned bonds resulted in an increase in the Company’s equity for USD 331.6 million and an increase in borrowings, the remaining portion of the nominal amount being initially treated as borrowings, corresponding to the net present value of interest payable during the contractual maturity (see Note 19).
Interim condensed consolidated financial statements CMA CGM / 7 Nine and three-month period ended September 30, 2015

The accompanying notes are part of the interim condensed consolidated financial statements.
Interim Consolidated Statement of Cash Flows
For the nine and three-month period ended September 30, 2015
(in USD million)
Note 2015 2014 2015 2014Profit of the period 630.6 411.5 57.0 207.6
Reconcilation of profit for the period to cash generated from operations :- Depreciation and amortization (12) 299.2 298.4 100.0 100.0 - Net present value (NPV) benefits related to assets financed by tax leases (8) (36.5) (54.7) (12.0) (18.5)- Other income and expense (7) (20.0) 26.0 (2.5) 0.3 - Increase / (Decrease) in provisions 24.0 22.4 9.9 16.0 - Loss / (Gains) on disposals of property and equipment and subsidiaries (6) 0.5 (27.8) 0.4 (1.1)- Share of (Income) / Loss from associates and joint ventures (13) 6.2 (5.4) 17.8 (4.3)- Interest expenses on net borrowings 216.3 227.1 74.9 81.0 - Income tax (10) 61.8 50.5 20.7 20.1 - Other non cash items 5.1 (48.3) (18.3) (42.0)Changes in working capital (16) (67.5) (120.7) (160.5) (29.3)Cash flow from operating activities before tax 1,119.7 779.0 87.4 329.8
- Income tax paid (63.2) (48.3) (18.7) (15.8)Cash flow from operating activities net of tax 1,056.5 730.7 68.7 314.0
Purchases of intangible assets (12) (35.0) (34.4) (13.2) (12.4)Purchases / disposals of subsidiaries, net of cash acquired / divested (12) (47.3) (5.2) (18.4) (2.7)Purchases of property and equipment (12) (341.8) (199.2) (126.0) (47.8)Proceeds from disposal of property and equipment 16.8 148.3 7.5 4.3 Proceeds from disposal of assets classified as held-for-sale - 50.0 - - Dividends received from associates and joint ventures (13) 18.6 12.5 6.4 4.6 Variation in other financial assets (70.7) 42.5 (10.9) 92.3 Variation in securities 3.8 207.9 6.5 2.9 Net cash (used for) / provided by investing activities (455.6) 222.4 (148.1) 41.2 Dividends paid to the owners of the parent company and non-controlling interest (93.3) (62.2) (2.5) (13.6)Proceeds from borrowings, net of issuance costs (19) 901.2 90.5 84.0 0.9 Repayments of borrowings (19) (1,116.3) (451.2) (618.1) (120.6)Principal repayments on finance leases (19) (72.2) (79.4) (14.3) (16.0)Decrease in liabilities associated with assets held-for-sale - (29.5) - - Interest paid on net borrowings (185.0) (190.7) (46.5) (35.6)Refinancing of assets 2.9 - 2.9 0.1 Other financing fees and interests (13.6) (11.4) (11.8) (3.2)Net cash (used for) / provided by financing activities (576.3) (733.9) (606.3) (188.0)
Effect of exchange rate changes on cash and cash equivalents and bank overdrafts (42.8) (18.3) (11.7) (14.1)
Net increase / (decrease) in cash and cash equivalents and bank overdrafts (18.2) 200.9 (697.4) 153.1
Cash and cash equivalents and bank overdrafts at the beginning of the year 1,741.7 1,329.6 Cash and cash equivalents as per balance sheet 1,732.6 1,538.3 Bank overdrafts (9.1) (7.8)Cash and cash equivalents and bank overdrafts at the end of the period (18) 1,723.5 1,530.5
Net increase / (decrease) in cash and cash equivalents and bank overdrafts (18.2) 200.9
Supplementary information: non cash investing or financing activities:- Assets acquired through finance lease or equivalents (12) 383.2 1.7 Supplementary information:- Financial income received 19.9 23.6 - Financial expenses paid (204.9) (214.3)
For the nine-month period ended September
30,
For the three-month period ended September
30,
CMA CGM / 8 Interim condensed consolidated financial statements Nine and three-month period ended September 30, 2015

Notes to the Interim Condensed Consolidated Financial Statements
1. Corporate information The interim condensed consolidated financial statements of CMA CGM S.A. (“CMA CGM”) and its subsidiaries (hereafter referred to together as “the Group” or “the Company”) for the nine and three-month period ended September 30, 2015 were approved by the Board of Directors on November 20, 2015. The Group is headquartered in France and is the third largest container shipping company in the world. The Group operates primarily in the international containerized transportation of goods. Its activities also include container terminal operations and transport by rail, road and river. CMA CGM S.A. is a limited liability company (“Société Anonyme”) incorporated and located in France. The address of its registered office is 4, Quai d’Arenc, 13002 Marseille, France.
2. Accounting policies 2.1 Basis of preparation The interim condensed consolidated financial statements of CMA CGM for the nine and three-month period ended September 30, 2015 have been prepared in accordance with IAS 34 “Interim Financial Reporting” and under the historical cost basis, with the exception of available-for-sale financial assets, securities and derivative financial instruments which have all been measured at fair value. Statement of compliance The interim condensed consolidated financial statements do not include all the information and disclosures required in the annual financial statements prepared in accordance with IFRS as adopted by the European Union, and should be read in conjunction with the Group’s audited annual financial statements for the year ended December 31, 2014. Basis of consolidation The interim condensed consolidated financial statements comprise the financial statements of CMA CGM S.A. and its subsidiaries as at September 30, 2015. The interim condensed consolidated financial statements are presented in U.S. Dollars (“USD”), which is also the currency of the primary economic environment in which CMA CGM S.A. operates (the “functional currency”). The functional currency of the shipping activities is U.S. Dollars. This means that, among other things, the carrying amounts of property, plant and equipment and intangible assets and, hence, depreciation and amortization are maintained in USD from the date of acquisition. For other activities, the functional currency is generally the local currency in the country in which such activities are performed. All values are rounded to the nearest million (USD 000,000) with a decimal, unless otherwise indicated. Seasonality The Company experiences seasonality in its activity characterized by a recurring high level of demand in the summer-fall period. As a result of these seasonal fluctuations, the Company’s cash flows from operations and revenue are not evenly distributed between quarters over the year.
Interim condensed consolidated financial statements CMA CGM / 9 Nine and three-month period ended September 30, 2015

2.2 Change in accounting policies and new accounting policies The accounting policies adopted in the preparation of these interim condensed consolidated financial statements have been applied consistently with those described in the annual consolidated financial statements for the year ended December 31, 2014, except as outlined in the paragraphs below. Adoption of new and amended IFRS and IFRIC interpretations from January 1, 2015
Amendments to IFRIC 21 The IASB issued IFRIC Interpretation 21 Levies, which clarifies the accounting for levies imposed by governments. The scope of the interpretation is broad and covers all levies, except outflows that are in the scope of IAS 12 Income Taxes and penalties for breaches of legislation. These amendments did not have a major impact on the Company’s financial position and performance, and thus, the comparative information has not been restated.
Amendments to IAS 19: Defined Benefit Plans: Employee Contributions The narrow scope amendments apply to contributions from employees or third parties to defined benefit plans. The objective of the amendments is to simplify the accounting for contributions that are independent of the number of years of employee service, for example, employee contributions that are calculated according to a fixed percentage of salary. These amendments did not have a major impact on the Company’s financial position and performance. New IFRS and IFRIC interpretations effective for the financial year beginning on January 1, 2015, not yet aproved by the european union and not early adopted
Amendments to IAS 1 : Disclosure initiatives These amendments consider proposals to see how entities applying IFRS can improve and simplify disclosures within existing disclosure requirements. Even if these amendments would not have a material impact on the Company’s disclosures, the Company will apply such requirement and enhancements starting from its following annual consolidated financial statements. New IFRS and IFRIC interpretations effective for the financial year beginning after January 1, 2015 and not yet aproved by the european union
IFRS 9: Financial instruments IFRS 14: Regulatory Deferral Accounts IFRS 15: Revenue from contracts with customers Amendments to IFRS 11: Accounting for acquisition of interests in joint operations Amendments to IAS 16 and IAS 38: Clarification of acceptable methods of depreciation and
amortization Amendments to IAS 27: Equity accounting in individual financial statements Amendments to IFRS 10 and IAS 28: Sales or contributions of assets between an investor and its
associate or joint venture Amendments to IFRS 10, IFRS 12 and IAS 28: Investment Entities: Applying the Consolidation
Exception 2.3 Significant accounting judgments, estimates and assumptions The preparation of financial statements requires the use of judgments, best estimates and assumptions that affect the reported amount of revenues, expenses, assets and liabilities, and the disclosure of contingent liabilities, at the reporting date.
CMA CGM / 10 Interim Condensed Consolidated Financial Statements Nine and three-month period ended September 30, 2015

Although these interim condensed consolidated financial statements reflect management's best estimates based on information available at the time of the preparation of these financial statements, the outcome of transactions and actual situations could differ from those estimates due to changes in assumptions or economic conditions. The main sensitive accounting methods involving use of estimates and judgments have been described in the annual consolidated financial statements. The Company revised the estimates applied to its container fleet and increased the useful life of its dry container fleet from 12 to 13 years while minor changes also occured on the residual values. As a whole, the impact of the changes in estimates is not significant and has been applied prospectively from January 1, 2015.
3. Significant events occurred during the period Shipping alliances
Implementation of OCEAN THREE The operational implementation of OCEAN THREE occurred in January 2015, through the successive departure of the first vessels under the new offering of services.
Partnership with Hamburg Süd In February 2015, the Group signed with Hamburg Süd, a German shipping company, a new partnership agreement to provide the market with competitive and innovative solutions, which is among the best in terms of coverage, frequency and transit time in North America and South. Business combinations
Closing of LCL On April 29, 2015, the Company finalized its acquisition of 60% in the 25-years old company LCL Logistix, one of India’s logistics leaders. The Company reinforces its position in India and will leverage on LCL Logistix’s Indian network as well as its presence in Canada, in the United States and in East Africa to accelerate its development. The investment was made through CMA CGM Logistics France, the wholly owned subsidiary of the Group specialized in forwarding and logistics solutions. The preliminary goodwill related to this acquisition has been recorded and amounts to USD 6.8 million. Non controlling interests have been valued at their proportionate share in the recognized identifiable net assets. As part of the transaction, the Company entered into certain option agreements with non controlling interests allowing the Group to acquire their shares, and granted a put option to the non controlling interests. These options may be exercised in 3 to 5 years from acquisition date. The put option resulted in the recognition of a liability.
Closing of OPDR On July 1, 2015, the Company finalized the acquisition of 100% of OPDR Group following the approval of the transaction by the European Commission without any condition. OPDR is a sea carrier specialized in short sea maritime services and door to door logistics solutions between North Europe, the Canary Islands, the Iberian Peninsula and Morocco. The preliminary goodwill related to this acquisition has been recorded and amounted to USD 22.6 million at acquisition date (USD 21.7 million as at September 30, 2015).
Interim condensed consolidated financial statements CMA CGM / 11 Nine and three-month period ended September 30, 2015

Terminal development
Closing of Kingston On April 7, 2015, the Company signed an agreement with the Port Authority of Jamaica (Jamport) for a 30-year concession of Kingston Container Terminal. Kingston is a strategic location regarding the widening of the Panama Canal, expected to be completed in 2016, which will allow to deploy larger vessels up to 12,600 TEUs. As part of this agreement, the Company commited to pay a certain level of fixed and variable concession fees. There is no material impact in the interim condensed consolidated financial statements.
Kribi On August 31,2015, the consortium formed by the French companies - CMA CGM and Bolloré - and the Chinese Group CHEC (China Harbour Engineering Company) won the bid process initiated by the Cameroonian government for the 25 years concession of the container terminal. Vessels from all companies, up to 8,000 TEUs capacity will be able to call this 1.4 million TEU capacity container terminal. When finished, it will be composed of a 700 meter length wharf and a 32 hectare platform made for 16 meters draught. A first 350 meter length wharf will be operational within a few months. The Company will hold a significant influence over this terminal which will be equity accounted for in due time. Vessel fleet and orderbook The deliveries of three 17,722 TEU vessels and three 2,100 TEU GuyanaMax vessels, as well as the orderbook update have been detailed in Note 12. New bond issue and early repayment of 2006 and 2011 Senior Notes In June 2015, the Company issued Senior Notes for an amount of EUR 725 million. The characteristics of this bond issuance as well as the use of proceeds have been detailed in Note 19. On July 8, 2015, as mentioned in Note 19, the Company finalized the early redemption of the 2011 Senior Notes for an amount of USD 534.1 million. Rating On May 12, 2015, the international rating agency Moody’s revised the Group’s corporate credit rating upwards from B2 “positive outlook” to B1 “stable outlook”. On June, 17, 2015, the same agency revised its outlook to “positive”.
4. Operating segments For management purposes, the Group reports two operating segments: container shipping activity, which represented approximately 95% of revenue excluding inter-segment elimination during the nine and three-month period ended September 30, 2015, and other activities. CMA CGM is organized as a worldwide container carrier, managing its customer base and fleet of vessels and containers on a global basis. Other activities include container terminal operations, logistics, and transport by rail, road and river. These segments do not result of an agregation of operating segments. Segment performance is evaluated by management based on the following measures:
Revenue; EBIT (“Earnings Before Interests and Taxes”).
CMA CGM / 12 Interim Condensed Consolidated Financial Statements Nine and three-month period ended September 30, 2015

EBIT corresponds to the line item “Operating profit after share of profit / (loss) of associates and joint ventures” presented in the consolidated income statement. EBIT is a non-IFRS quantitative measure used to assist in the assessment of the Company's ability to drive its operating performance. The Company believes that the presentation of EBIT is a relevant aggregate to management for decision making purposes. EBIT is not defined in IFRS and should not be considered as an alternative to Profit / (Loss) for the nine and three-month period ended September 30, 2015 or any other financial metric required by such accounting principles. However, in terms of segment reporting, management believes that EBIT is a more relevant aggregate to assess the segment performance as financial result and income tax are not alllocated to segments. The segment information for the reportable segments for the nine and three-month period ended September 30, 2015 and 2014 is as follows:
2015 2014 2015 2014
Container shipping segment 11,756.5 12,228.8 861.5 607.5
Other activities 607.7 576.9 27.4 30.7
Reconciling items & Eliminations (263.6) (296.7) (0.5) 1.8
Total consolidated measures 12,100.6 12,509.1 888.4 639.9
Revenue EBIT
For the nine-month period ended September 30,
2015 2014 2015 2014
Container shipping segment 3,847.5 4,290.6 146.8 228.4
Other activities 204.1 196.0 11.1 19.6
Reconciling items & Eliminations (74.8) (118.8) (17.9) 0.8
Total consolidated measures 3,976.8 4,367.9 140.0 248.7
Revenue EBIT
For the three-month period ended September 30,
Certain items are unallocated as management considers that they do not affect the recurring operating performance of the Group. Reconciling items impacting EBIT include (i) the impact of the disposal of property and equipment and subsidiaries (see Note 6), (ii) other income and expenses (see Note 7) and (iii) the impairment charge recorded in associates and joint ventures (see Note 13).
5. Operating expenses Operating expenses are analyzed as follows:
2015 2014 2015 2014
Bunkers and consumables (1,704.7) (2,678.7) (530.2) (918.6)Chartering and slots purchases (1,509.2) (1,354.7) (554.2) (475.3)Handling and stevedoring (3,013.0) (2,908.3) (1,020.6) (1,027.9)Inland and feeder transportation (1,430.3) (1,331.9) (501.1) (467.4)Port and canal (884.7) (881.6) (296.4) (314.3)Container rentals and other logistic expenses (971.2) (973.7) (336.8) (337.3)Employee benefits (870.9) (904.4) (284.2) (295.3)General and administrative other than employee benefits (451.5) (459.6) (147.5) (154.6)Additions to provisions, net of reversals and impairment of inventories and trade receivables (15.7) (17.5) (6.6) (10.9)
Operating exchange gains / (losses), net 50.0 24.3 (0.7) 2.8 Other (161.6) (146.5) (54.8) (44.0)
Operating expenses (10,962.8) (11,632.6) (3,733.1) (4,042.8)
For the three-month period ended September 30,
For the nine-month period ended September 30,
Interim condensed consolidated financial statements CMA CGM / 13 Nine and three-month period ended September 30, 2015

The decrease of operating expenses is mainly due to the decline in bunker prices, partly compensated by the effect of increased carried volumes impacting mostly handling and steevedoring costs as well as inland and feeder transportation costs.
6. Gains / (Losses) on disposal of property and equipment and subsidiaries Gains on disposal of property and equipment and subsidiaries consist of the following:
2015 2014 2015 2014
Disposal of vessels - 2.2 - (0.3)Disposal of containers 0.3 24.6 0.6 0.4 Other fixed assets disposal 0.4 1.0 0.2 1.0 Disposal of subsidiaries (1.2) - (1.2) - Gains / (losses) on disposal of property and equipment and subsidiaries (0.5) 27.8 (0.4) 1.1
For the nine-month period ended September 30,
For the three-month period ended September 30,
There was no major disposal in the nine-month period ended September 30, 2015. In the nine-month period ended September 30, 2014, the Company sold certain containers through sale and operating lease back agreements which generated:
an increase in cash and cash equivalents amounting to USD 149.2 million; a gain on disposal amounting to USD 24.6 million.
7. Other income and expenses Other income and expenses can be analyzed as follows :
2015 2014 2015 2014
Impairment of assets (0.2) (6.4) (0.1) - Other 20.2 (19.6) 2.6 (0.3)Other income and (expenses) 20.0 (26.0) 2.5 (0.3)
For the nine-month period ended September 30,
For the three-month period ended September 30,
8. NPV benefits related to assets financed by tax leases As disclosed in Note 2 of the annual consolidated financial statements for the year ended December 31, 2014, the Company benefits from leveraged tax leases in France, the United Kingdom, Taiwan and Singapore. When such agreements qualify as finance leases, the Company recognizes the cost of building vessels as property and equipment, and the net present value (“NPV”) of future lease payments as obligations under finance leases. Under leveraged tax leases, a tax benefit is passed on by the lessor either over the lease term through lower lease payments or at the end of the lease term through the recovery of a cash amount. In such cases, the Company recognizes the tax benefits as follows:
When the Company receives the benefit through lower lease payments, its net present value is accounted for as deferred income within liabilities in the balance sheet (allocated between current and non-current portion depending on twelve month maturity). This benefit is then credited to the statement of income on a vessel by vessel basis over the tax financing period under the heading NPV benefit related to assets which range from 5 to 8 years. This income is presented within Operating profit as it is considered that this benefit is in effect a reduction of the operational running cost of the vessel;
CMA CGM / 14 Interim Condensed Consolidated Financial Statements Nine and three-month period ended September 30, 2015

When the Company benefits from the tax advantage at the end of the lease term, a financial asset is
recognized progressively within other financial assets over the tax financing period and the corresponding income is recorded under the heading NPV benefit related to assets.
9. Financial result The financial result is analyzed as follows:
2015 2014 2015 2014Interests expense on borrowings (207.9) (236.8) (68.4) (73.7)Interests income on cash and cash equivalents 19.3 24.2 6.9 7.6 Cost of borrowings net of interests income on cash and cash equivalents (188.6) (212.6) (61.5) (66.1)
Settlements and change in fair value of derivative instruments (19.6) (25.3) (3.1) (10.1)Foreign currency income and expense, net 46.2 65.1 5.4 64.9 Other financial income and expense, net (34.0) (5.1) (3.1) (9.8)Other net financial items (7.4) 34.7 (0.8) 45.0 Financial Result (196.0) (177.9) (62.3) (21.1)
For the nine-month period ended September 30,
For the three-month period ended September 30,
Settlements and change in fair value of derivative instruments reflect the impact, on the portfolio of derivative financial instruments, of the volatility of currencies and interest rates during the periods presented. Foreign currency income and expense is mainly composed of foreign currency exchange gain / (losses) on financial operations due to the translation of borrowings and financial instruments denominated in currencies different from USD (mainly transactions in euros). In the nine-month period ended September 30, 2015, the appreciation of the USD versus EUR rate resulted in significant exchange gains, as well as in the three-month period ended September 30, 2014. Other financial income and expense include, among others, USD 28.1 million of tender and call premiums and USD 11.8 million of past issuance costs being recognized as a consequence of the early repayment of Senior Notes issued in 2011 (see Note 19).
10. Income and deferred taxes Income taxes
2015 2014 2015 2014
Current income taxes (60.9) (51.3) (24.3) (19.3)Deferred tax income / (expense) (0.9) 0.8 3.6 (0.8)
Income Taxes (61.8) (50.5) (20.6) (20.1)
For the three-month period ended September 30,
For the nine-month period ended September 30,
The current income tax expense for the nine-month period ended September 30, 2015 includes USD (2.1) million related to prior year income tax (USD 0.6 million for the nine-month period ended September 30, 2014).
Interim condensed consolidated financial statements CMA CGM / 15 Nine and three-month period ended September 30, 2015

Deferred taxes Deferred taxes balances breakdown as follows:
Deferred tax assets As at September 30, 2015
As at December 31, 2014
Investment tax credit 0.2 0.1 Tax losses carried forward 11.4 11.2 Retirement benefit obligations 15.8 14.9 Other temporary differences 6.6 8.0
Total deferred tax assets 34.0 34.2
Deferred tax liabilities As at September 30, 2015
As at December 31, 2014
Revaluation and depreciation of property and equipment 17.1 16.4
Undistributed profits from subsidiaries 29.5 28.7 Other temporary differences 10.6 7.9
Total deferred tax liabilities 57.2 53.0
Total net deferred tax assets / (liabilities) (23.2) (18.8)
As at September 30, 2015
As at September 30, 2014
Net deferred tax at the begining of the period (18.8) (10.6) Changes through Profit & Loss (0.9) 0.8 Currency translation adjustment (1.1) (1.0) Acquisition of subsidiaries (2.4) 0.1 Net deferred tax at the end of the period (23.2) (10.7) Tax losses carried forward mainly relate to losses generated by the activities liable to corporate income tax in France. These tax losses are recognized only to the extent of the level of the corresponding deferred tax liability and the foreseeable taxable profit generated by these activities. Income tax impacts related to other comprehensive income are presented in the statement of comprehensive income. 11. Goodwill and other intangible assets Goodwill The carrying amount of goodwill has been allocated to the following operating segments and cash generating units based on the management structure:
As at September 30, 2015
As at December 31, 2014
Beginning of the period 289.7 299.8
Goodwill from acquisitions of the period 29.4 - Impairment - (5.9) Foreign currency translation adjustment (3.3) (4.2)
At the end of the period 315.8 289.7of which:Allocated to container shipping segment 303.1 283.6Allocated to other activities 12.7 6.1
CMA CGM / 16 Interim Condensed Consolidated Financial Statements Nine and three-month period ended September 30, 2015

The line item “Goodwill from acquisitions of the period” corresponds to the goodwill recognized as a result of the preliminary purchase price allocation realized on LCL and OPDR acquisitions (see Note 3). Such purchase price allocations are not presented in detail as being not material at Group level. Other intangible assets Other intangible assets mainly correspond to the currently used information systems and to the new information system currently being developped. During the nine-month period ended September 30, 2015, the capitalized costs of the future system amounted to USD 38.0 million (USD 65.3 milions during the year ended December 31, 2014).
12. Property and equipment Property and equipment are analyzed as follows:
As at September 30, 2015
As at December 31, 2014
VesselsCost 8,145.7 7,498.0 Cumulated depreciation (1,728.1) (1,523.6)
6,417.6 5,974.4 ContainersCost 917.6 919.9 Cumulated depreciation (386.5) (375.0)
531.1 544.9 Lands and buildingsCost 636.6 672.1 Cumulated depreciation (139.1) (131.9)
497.5 540.2 Other properties and equipmentsCost 317.7 282.4 Cumulated depreciation (175.1) (171.6)
142.6 110.8 TotalCost 10,017.6 9,372.4 Cumulated depreciation (2,428.8) (2,202.1)
Property and equipment 7,588.8 7,170.3 As at September 30, 2015, assets held under capital leases, tax lease agreements and other similar arrangements included in the above table represented a cost of USD 2,556.2 million (USD 2,418.6 million as at December 31, 2014) and a cumulated depreciation of USD 478.5 million (USD 423.1 million as at December 31, 2014).
Interim condensed consolidated financial statements CMA CGM / 17 Nine and three-month period ended September 30, 2015

Variations in the cost of property and equipment for the nine-month period ended September 30, 2015 and the year ended December 31, 2014 are analyzed as follows: Cost of Property and equipment Containers Total
Owned Leased In-progress
As at January 1, 2014 4,632.0 2,584.8 181.0 998.3 739.5 295.4 9,431.0 Acquisitions 23.2 2.1 116.5 147.8 1.4 26.2 317.2 Acquisitions of subsidiaries - - - - 1.1 4.0 5.1 Disposals (21.2) (0.1) - (224.9) (0.1) (13.6) (259.9) Reclassification 5.2 - (5.2) - - - - Reclassification to assets held-for-sale (5.9) - - - - - (5.9) Exercise of purchase option on finance leases 411.4 (411.4) - - - - - Foreign currency translation adjustment (2.7) (11.7) - (1.3) (69.8) (29.6) (115.1)
As at December 31, 2014 5,042.0 2,163.7 292.3 919.9 672.1 282.4 9,372.4
Acquisitions 164.0 2.6 490.1 21.2 0.5 46.6 725.0 Acquisitions of subsidiaries - - - 10.7 16.9 5.5 33.1 Disposals (1.8) - - (32.3) - (3.3) (37.4) Reclassification - - - - (5.0) 5.0 - Vessels put into service 446.4 159.6 (606.0) - - - - Foreign currency translation adjustment (1.7) (5.5) - (1.9) (47.9) (18.5) (75.5)
As at September 30, 2015 5,648.9 2,320.4 176.4 917.6 636.6 317.7 10,017.6
Other properties and
equipments
Vessels Lands and buildings
As at September 30, 2015 the Company operates 89 vessels owned or under finance lease or equivalent agreements (79 vessels as at December 31, 2014). In 2015, the line item “vessels put into service” corresponds to the delivery of CMA CGM Kerguelen, Georg Forster, Bougainville, Cayenne, Marseille and St Laurent (see below). In 2014, the line item “exercise of purchase option” is linked to the transfer from leased to owned vessels of the cost of three vessels for USD 411.4 million following the exercise of the purchase option included in the related finance lease. Borrowing costs capitalized in the nine-month period ended September 30, 2015 amounted to USD 10.7 million (USD 11.9 million for the year ended December 31, 2014). Acquisition of property and equipment and reconciliation with cash flow statement Purchases of property and equipment amounted to USD 725.0 million for the nine-month period ended September 30, 2015 (USD 317.2 million for the year ended December 31, 2014). On July 24, 2015, the Company exercised some purchase options on four vessels, which were operated under long term operating lease agreements, for an amount of USD 158.6 million recognized as vessels in property and equipement (see Note 15). The reconciliation of these acquisitions with the CAPEX presented in the statement of cash-flows, under the heading “Purchase of property and equipment” can be presented as follows :
Acquisition of assets presented in the above table a 725.0
(-) CAPEX non cash / financed b 383.2
CAPEX cash from purchases of property and equipment a (-) b = c 341.8
CAPEX cash from purchases of intangible assets d 35.0
CAPEX cash from business combination e 47.3
Total CAPEX as per Consolidated Statement of Cash Flows c (+) d (+) e 424.1
CMA CGM / 18 Interim Condensed Consolidated Financial Statements Nine and three-month period ended September 30, 2015

Variations in the accumulated depreciation for the nine-month period ended September 30, 2015 and the year ended December 31, 2014 are analyzed as follows: Depreciation of Property and equipment Total
Owned Leased In-progress
As at January 1, 2014 (953.7) (323.6) - (393.2) (119.1) (176.0) (1,965.6) Depreciation (185.5) (82.6) - (45.2) (22.9) (21.6) (357.8) Acquisitions of subsidiaries - - - - (0.8) (1.9) (2.7) Disposals 16.8 - - 63.0 - 12.6 92.4 Impairment (6.0) - - - - - (6.0) Reclassification to assets held-for-sale 5.4 - - - - - 5.4 Exercise of purchase option on finance leases (72.1) 72.1 - - - - - Foreign currency translation adjustment 0.9 4.7 - 0.4 10.9 15.3 32.2
As at December 31, 2014 (1,194.2) (329.4) - (375.0) (131.9) (171.6) (2,202.1) Depreciation (149.7) (59.6) - (28.6) (14.3) (17.3) (269.5) Disposals 1.8 - - 16.7 - 3.2 21.7 Foreign currency translation adjustment 0.7 2.3 - 0.4 7.1 10.6 21.1
As at September 30, 2015 (1,341.4) (386.7) - (386.5) (139.1) (175.1) (2,428.8)
Lands and buildings
Other properties and
equipments
Vessels Containers
Including intangible assets, the total depreciation for the nine-month period ended September 30, 2015 amounts to USD 299.2 million (USD 401.1 million for the year ended December 31, 2014). The net book value of property and equipment at the opening and closing of each period presented are analyzed as follows:
Net book value of Property and equipmentTotal
Owned Leased In-progress
As at September 30, 2015 4,307.5 1,933.7 176.4 531.1 497.5 142.6 7,588.8 As at December 31, 2014 3,847.8 1,834.3 292.3 544.9 540.2 110.8 7,170.3 As at January 1, 2014 3,678.3 2,261.2 181.0 605.1 620.4 119.4 7,465.4
VesselsContainers Lands and
buildingsOther
properties and equipments
The net book value of the containers as at September 30, 2015 includes USD 111.0 million related to containers under finance leases (USD 124.3 million as at December 31, 2014). Group fleet development Prepayments made to shipyards relating to vessels under construction are presented within “Vessels” and amount to USD 176.4 million as at September 30, 2015 (USD 292.3 million as at December 31, 2014).
Delivery of Kerguelen, Georg Forster and Bougainville In March, June and August 2015, respectively, the Group received the largest vessels of its current owned fleet, three 17,722 TEU containerships named CMA CGM Kerguelen, CMA CGM Georg Forster and CMA CGM Bougainville. These vessels join the fleet linking Europe to Asia. The delivery of the vessels has been financed through the drawdown of a secured debt for two vessels and through a leverage tax lease qualified as finance lease for the third one, each financing amounting to USD 110.9 million per vessel, resulting in no major cash impact for the Group.
Delivery of Cayenne, Marseille and Saint Laurent In the three-month period ended September 30, 2015, the Company took delivery of three 2,100 TEU GuyanaMax vessels named CMA CGM Cayenne, CMA CGM Marseille, and CMA CGM Saint Laurent, through the drawndown of secured debts with no major cash impact for the Group. These vessels include 530 reefer containers plugs.
Financing of ICE CLASS
On March 30, 2015, the Group signed a 12-year financing arrangement in relation to the construction of three 2,500 TEU vessels for a total amount of USD 76.6 million. Such financing, which is not drawn to date, will cover most of the remaining payments due to the shipyards in relation to these vessels.
Interim condensed consolidated financial statements CMA CGM / 19 Nine and three-month period ended September 30, 2015

Ordering of three 20,600 TEU vessels On April 2, 2015, the Company signed a settlement agreement with a shipyard, by which the parties have agreed (i) to settle all their disputes arising out of certain shipbuilding contracts entered into on 2007 and 2008 and consider that the settlement achieved is in the mutual interests of the parties (see Note 15), and (ii) to formalize a new order of three 20,600 TEU vessels to be delivered in 2017. The financing of this order is currently in progress. The prepayments paid in the period amounted to USD 83.9 million.
Ordering of six 14,000 TEU vessels On May 29, 2015, the Company ordered six 14,000 TEU containerships to be delivered between end 2016 and 2017. The Company is currently seeking for exernal financings, which could result for certain of these vessels to be chartered under long-term bareboat agreements. The prepayments paid in the period amounted to USD 67.0 million. As a result of the above, as at September 30, 2015, the Company has 12 vessels in its orderbook, corresponding to three 2,500 TEU vessels, three 20,600 TEU vessels and six 14,000 TEU vessels (depending on their financing conditions, some of these last 6 vessels may be reclassified out of the statement of financial position).
13. Investments in associates and joint ventures Investments in associates and joint ventures are presented as follows:
As at September 30, 2015
As at December 31, 2014
Beginning of the period 686.1 722.7
Transfer of carrying value of newly controlled entities - (5.8)
New investments in associates and joint ventures 0.5 7.1
Disposal - (0.8) Share of (loss) / profit (6.2) 5.7 Dividend paid or payable to the Company (25.2) (20.3) Other comprehensive income / (expense) 0.2 (1.1) Reclassification from / to other items (0.9) 1.1 Foreign currency translation adjustment (8.1) (22.5)
At the end of the period 646.2 686.1 The line item share of (loss) / profit corresponds to the Company’s share in the profit or loss of its associates and joint ventures. The significant judgements and assumptions made in determining the nature of interests in significant associates and joint ventures, as well as the additional disclosures required under IFRS 12 have been presented in the 2014 annual consolidated financial statements. As at September 30, 2015, the main contributors to investments in associates and joint ventures are (i) Terminal Link Group for USD 401.9 million (USD 421.0 million as at December 31, 2014) and (ii) Global Ship Lease for USD 183.8 million (USD 201.5 million as at December 31, 2014). In the three-month period ended September 30, 2015, Global Ship Lease recorded an impairment charge amounting to USD 20.0 million (at Group share in Global Ship Lease) due to two vessels being reclassified in held for sale.
CMA CGM / 20 Interim Condensed Consolidated Financial Statements Nine and three-month period ended September 30, 2015

14. Derivative financial instruments Derivative financial instruments are analyzed as follows:
Assets Liabilities Assets Liabilities
Interest swaps - cash flow hedge - 65.6 - 81.0 Interest swaps - not qualifying to hedge accounting - - 6.8 7.1 Currency forward contracts - - 0.1 -
Total derivative financial instruments - 65.6 6.9 88.1 of which non-current portion (greater than 1 year) - 44.1 3.0 55.2 of which current portion (less than 1 year) - 21.5 3.9 32.9
As at December 31, 2014
As at September 30, 2015
As at September 30, 2015, the Company does not hold any derivative financial instrument not qualifying to cash flow hedge left. The fair value of the above derivatives financial instruments is determined based on valuation techniques. As such, these instruments are included in level 2 of the fair value hierarchy. 15. Other non-current financial assets Other non-current financial assets are analyzed as follows:
As at September 30, 2015
As at December 31, 2014
Investments in non consolidated companiesGross 86.7 82.8 Impairment (6.0) (6.0)
80.7 76.8 Loans Gross 105.8 111.2 Impairment (54.7) (59.4)
51.1 51.8 DepositsGross 221.0 319.7 Impairment - -
221.0 319.7 Receivable from associatesGross 13.5 16.3 Impairment (2.8) -
10.7 16.3 Other financial assetsGross 213.0 361.4 Impairment (0.1) (168.7)
212.9 192.7 Total other non-current financial assetsGross 640.0 891.4 Impairment (63.6) (234.1) Total other non-current financial assets, net 576.4 657.3 Change in loans and deposits is presented within “Variation in other financial assets” in the consolidated statement of cash flows. Investments in non consolidated companies This line item mainly consists of shares in Rotterdam World Gateway BV for USD 47.3 million in which the Company has a 10% shareholding as well as other entities individually not significant.
Interim condensed consolidated financial statements CMA CGM / 21 Nine and three-month period ended September 30, 2015

Loans “Loans” mainly relates to funds borrowed by certain terminal joint venture. Deposits
Included in “Deposits” are mainly:
USD 82.1 million as at September 30, 2015 (USD 143.9 million as at December 31, 2014) of cash deposited in escrow accounts in relation to certain loan-to-value provisions in financing agreements; and
USD 112.2 million as at September 30, 2015 (USD 105.3 million as at December 31, 2014) of cash deposits which do not qualify as cash and cash equivalents.
On July 24, 2015, the Company exercised some purchase options on four vessels, which were operated under long term operating lease agreements, for an amount of USD 158.6 million recognized as vessels in property and equipement. As part of the transaction, the Company simultaneously received back some funds that were deposited in the lessor’s accounts as part of loan-to-value provisions and initial equity investments originally made by the Company, for a total of USD 106.4 million which reduced the corresponding assets in the statement of financial position. The Company also paid some additionnal costs amounting to USD 6.4 million accounted for as a financial expense. The whole transaction resulted in a net cash outflow of USD 58.6 million. Other financial assets As at September 30, 2015, “Other financial assets” mainly include USD 200.6 million (USD 178.8 million as at December 31, 2014) of financial tax benefit to be received at the maturity of the tax financing period (see Note 8). As at December 31, 2014, “Other financial assets” also included the prepayments paid and other capitalized costs related to vessel orders cancelled for a total amount of USD 168.1 million. The full amount of such prepayments was impaired. Following a settlement agreement with the shipyard, such prepayment and related impairment have been reversed in the nine-month period ended September 30, 2015 (see Note 12).
16. Working Capital The working capital can be analyzed as follows:
As at December 31, 2014
Variations linked to operations
Currency translation adjustment
OthersAs at
September 30, 2015
Inventories 384.4 (103.7) (1.7) 1.8 280.8 Trade and accounts receivable (*) 2,398.3 (89.2) (123.9) 41.4 2,226.6 Prepaid expenses 249.4 82.4 (1.1) 2.4 333.1 Trade and other payables (**) (2,748.2) 8.4 86.6 (55.6) (2,708.8) Deferred income (644.0) 169.6 (0.2) 0.4 (474.2) Net working capital (360.1) 67.5 (40.3) (9.6) (342.5) (*) including current income tax asset (**) including current income tax liability The column “Others” is mainly composed of the acquisition of LCL Logistix and OPDR GmbH.
CMA CGM / 22 Interim Condensed Consolidated Financial Statements Nine and three-month period ended September 30, 2015

Trade and other receivables are analyzed as follows:
As at September 30, 2015
As at December 31, 2014
Trade receivables 1,845.5 1,958.7 Less impairment of trade receivables (91.6) (82.9)
Trade receivables net 1,753.9 1,875.8
Prepayments 70.7 77.1 Other receivables, net 304.5 344.3 Employee, social and tax receivables 97.5 101.1
Trade and other receivables (*) 2,226.6 2,398.3 (*) including current income tax asset Trade and other payables are analyzed as follows:
As at September 30, 2015
As at December 31, 2014
Trade payables 997.8 1,043.2 Employee, social and tax payables 190.4 194.1 Other payables (mainly accruals for port call expenses, transportation costs, handling services) 1,520.5 1,510.9
Trade and other payables (*) 2,708.7 2,748.2 (*) including current income tax liability Other payables include an amount payable in euros of USD 48.8 million owed to Merit Corporation, a related party (USD 49.2 million as at December 31, 2014). This payable bears interest at 7% per annum and mainly corresponds to dividends declared by the Company in 2007 and 2008 but which have not been paid yet. Prepaid expenses and deferred income Prepaid expenses and deferred income mainly include voyages in progress at balance sheet date.
17. Securities and other current financial assets Securities and other current financial assets as at September 30, 2015 include securities at fair value for an amount of USD 8.8 million (USD 13.4 million as at December 31, 2014) and other current financial assets for an amount of USD 82.0 million (USD 63.7 million as at December 31, 2014).
18. Cash and cash equivalents
As at September 30, 2015
As at December 31, 2014
Cash on hand 976.6 921.0 Short term deposits 750.2 1,253.7 Restricted cash 5.8 11.8 Net cash and cash equivalents as per balance sheet 1,732.6 2,186.5 Bank overdrafts (9.1) (444.8)
Net cash and cash equivalents as per cash flow statement 1,723.5 1,741.7
“Restricted cash” as at September 30, 2015 did not include any longer margin calls related to the Company's derivative financial instruments (USD 3.0 million as at December 31, 2014). These amounts are called periodically by financial counterparts in accordance with the Company's standard International Swaps and Derivatives Association (ISDA) agreements.
Interim condensed consolidated financial statements CMA CGM / 23 Nine and three-month period ended September 30, 2015

19. Borrowings Borrowings are presented below and include bank overdrafts, long-term bank borrowings, finance leases and similar arrangements and have the following maturities:
As at September 30, 2015
2017 2018 2019 2020 Onwards
Senior notes 1,117.7 (6.0) 1,123.7 (6.2) (6.8) 330.6 (4.0) 810.1 Bonds redeemable in shares 225.7 65.8 159.9 73.9 47.0 14.5 15.9 8.6 Bank borrowings 1,758.7 324.3 1,434.4 235.6 297.3 189.2 147.7 564.6 Obligations under finance leases 926.4 108.6 817.8 131.5 106.1 101.2 99.1 379.9 Bank overdrafts 9.1 9.1 - - - - - - Securitization program 846.2 (1.8) 848.0 (1.9) 849.9 - - - Other borrowings 108.7 72.3 36.4 2.2 1.7 25.6 0.8 6.1
Total 4,992.5 572.3 4,420.2 435.1 1,295.2 661.1 259.5 1,769.3
Maturity schedule : September 30,Non current portion
Current portion (*)
(*) Current portion is the borrowing that will be reimbursed within the following 12-month period starting from September 30, 2015. Variations in borrowings can be analyzed as follows:
Senior notesBonds
redeemable in shares
Bank borrowings
Obligations under finance
leases
Bank overdrafts
Securitization program
Other borrowings Total
Balance as at January 1, 2015 1,163.2 259.3 1,813.7 898.0 444.8 845.2 55.9 5,480.1
789.2 - 78.9 - - 19.9 0.3 888.3 (792.4) (30.5) (289.5) (75.1) - - (3.9) (1,191.4)
Other increase/decrease in borrowings - - 169.7 107.3 (445.4) - - (168.4)15.0 (3.1) 5.6 6.4 - 1.3 30.7 55.9
- - 4.5 (4.5) - - - Acquisition (disposal) of subsidiaries - - 4.5 - 10.4 - 26.6 41.5
(57.3) - (28.7) (5.7) (0.7) (20.2) (0.9) (113.5)
Balance as at September 30, 2015 1,117.7 225.7 1,758.7 926.4 9.1 846.2 108.7 4,992.5
Foreign currency translation adjustments
Repayment of financial borrowings, net of proceeds from refinancing
Accrued interests and fees amortizationReclassification from / to other liabilities
Proceeds from new borrowings
Borrowings relate to the following assets and their respective average interest rates are as follows:
Senior notesBonds
redeemable in shares
Bank borrowings
Obligations under
finance leases
Other borrowings,
securitization and overdrafts
Average Interest rate
before hedging and amortized
cost
Vessels - - 1,415.5 845.5 - 4.74%Containers - - 93.1 44.9 - 4.96%Land and buildings - - 166.3 5.9 - 1.21%Handling - - - 5.0 - 4.43%Other tangible assets - - 3.0 25.1 - 4.87%General corporate purposes 1,117.7 225.7 80.8 - 964.0 6.12%
Total 1,117.7 225.7 1,758.7 926.4 964.0 New bond issue and early repayment of Notes
Issuance of EUR unsecured Bond and early repayment of 2011 Senior Notes On June 8, 2015, the Company issued a 5.5-year unsecured bond amounting to EUR 550.0 million, maturing in January 2021 and bearing a 7.75% coupon. The cash received by the Company amounted to USD 596.6 million at transaction date, net of issuance premium and costs. On June 12, 2015, the Company issued additional Notes amounting to EUR 175.0 million, with similar characteristics. The cash received by the Company amounted to USD 194.2 million at transaction date, net of issuance premium and costs. The total net proceeds, including additional issuance costs of USD 1.6 million, amount to USD 789.2 million.
CMA CGM / 24 Interim Condensed Consolidated Financial Statements Nine and three-month period ended September 30, 2015

Together with available cash, the proceeds were used to early repay USD & EUR unsecured Notes issued in 2011 and due in 2017 for USD Notes and 2019 for EUR Notes. Some of the 2011 Notes were repurchased through a tender offer on June 8, 2015 for an amount of USD 196.6 million and the remaining Notes have been repurchased on July 8, 2015 for an amount of USD 513.2 million through a call exercise (excluding call premiums).
Early repayment of 2006 Senior Notes On May 19, 2015, the Company launched a consent sollicitation and cash tender offer for all of the outstanding 5.562% corporate asset backed secured Notes due 2021 at a price of 106% of the principal amount. 100% of the holders participated to the tender offer and thus, the payment of the consideration was made on June 3, 2015 in an aggregate amount of USD 74.4 million, including accrued interests and redemption premiums (the carrying value presented in the variation in borrowings above amounts to USD 82.6 million, together with the tender and call repayment, for a total amount of USD 792.4 million). Securitization program The amount of the financing obtained as part of the securitization program has been increased by USD 19.9 million during the nine-month period. The Company currently uses almost all the facility amounting to USD 880 million. As part of the above mentionned new bond issue, the Company has the ability to further extend this facility in the near future. Bonds redeemable in shares As a consequence of the coupon payments on bonds redeemable in shares, the Company records:
a financial expense based on the market rate used to determine the liability component of these instruments; and
a reduction in borrowings for the residual amount paid. Other borrowings As at September 30, 2015, other borrowings include USD 63.6 million of accrued interests (USD 32.9 million as at December 31, 2014).
20. Provisions, retirement benefit obligations and contingent liabilities Provisions are analyzed as follows:
Employee benefits
Litigation Other risks and
obligations
Total of which non current
portioncurrent portion
As at January 1, 2014 119.0 80.4 141.9 341.3 315.8 25.5 Additions for the year 16.5 16.6 65.6 98.7 Reversals during the year (unused) (0.5) - (0.6) (1.1) Reversals during the year (used) (10.2) (12.5) (55.2) (77.9) Reclassification to / from other liabilities 4.2 - - 4.2 Actuarial gain / loss recognized in the OCI 13.2 - - 13.2 Foreign currency translation adjustment (15.0) (1.5) (11.1) (27.6) As at December 31, 2014 127.2 83.0 140.6 350.8 331.1 19.7 Additions for the period 11.7 7.2 7.9 26.8 Reversals during the period (unused) - - (25.5) (25.5) Reversals during the period (used) (5.1) (6.6) (22.9) (34.6) Acquisition of subsidiaries 9.1 - - 9.1 Actuarial (gain) / loss recognized in the OCI 0.7 - - 0.7 Foreign currency translation adjustment (5.6) (0.8) (9.9) (16.3) As at September 30, 2015 138.0 82.8 90.2 311.0 292.6 18.4
Interim condensed consolidated financial statements CMA CGM / 25 Nine and three-month period ended September 30, 2015

20.1 Provisions related to employee benefits The detailed disclosures related to provision for employee benefits have been presented in the annual consolidated financial statements. There has been no significant change applied in the interim condensed consolidated financial statements. 20.2 Provisions for litigation and other risks and obligations Litigation The provision for litigation as at September 30, 2015 corresponds to cargo related and other claims incurred in the normal course of business (same as at December 31, 2014). None of these claims taken individually represents a significant amount. Other risks and obligations Provisions for other risks and obligations mainly include the provision corresponding to the estimated future cash-outflows in relation to the minimum dividend guaranteed to CMHI as part of the disposal of the 49% stake in Terminal Link in June 2013, which amounts to USD 72.8 million (USD 103.3 million as at December 31, 2014), down USD 30.5 million as a consequence of the payment occurred in the nine-month period ended September 30, 2015, the impact of foreign currency translation and unwinding of discount. 20.3 Contingent liabilities The Company is involved in a number of legal and tax disputes in certain countries. Some of these may involve significant amounts, the outcome of which being subject to a high level of uncertainty. The main contingent liabilities are as follows: Formal investigation by the European Commission On November 22, 2013, the European Commission issued a press release stating that it will open a formal investigation towards the shipping sector. CMA CGM, among several other shipping companies, is part of these investigations. The management of the Company has no reason to believe that CMA CGM has behaved in any manner not in accordance with EU competition law and fully cooperates with the European Commission. Legal proceedings initiated by Mistral (Holding) SAL In September 2000, a settlement agreement was signed between Mr Jacques R. Saadé and Mr Johnny Saadé, personally and on behalf of their respective companies ending many years of dispute and legal proceedings related to the sale by Mistral (Holding) SAL of its interest in CMA CGM S.A. As from 2004, Mr Johnny Saadé, CEO of Mistral (Holding) SAL has initiated various civil and commercial legal proceedings before Lebanese and French courts to seek a ruling that the above mentioned settlement agreement was null and void. All such actions have been rejected by civil and commercial jurisdictions in France and by civil courts in Beirut, Lebanon, up to their highest level of jurisdiction. In 2013, Mistral (Holding) SAL has decided to initiate new legal proceedings before the courts in Syria, notwithstanding any link to the territory of Syria. Judgments, which ignored previous contrary decisions rendered in Lebanon and France, were rendered in 2013 and 2014 in favour of Mistral (Holding) SAL by the Syrian Courts. On May 14, 2015, the Plenary Assembly (“Assemblée Plénière”) of the Syrian Supreme Court (i) decided the
CMA CGM / 26 Interim Condensed Consolidated Financial Statements Nine and three-month period ended September 30, 2015

annulment of the judgment rendered on December 14, 2014 by the Syrian Court of Cassation against Mr. Jacques Saadé, CMA CGM SA, Merit Corporation SAL and the other defendants (ii) rejected irrevocably the original legal action from Mistral on the basis of lack of legal ground. This decision is consistent with legal advices obtained by the Company and confirms the previous accounting position taken, no provision being recorded in the interim condensed consolidated financial statements as at September 30, 2015.
21. Commitments Except for new commitments disclosed in Note 3 and Note 12, no other significant commitment has been entered into since the information disclosed in the 2014 annual consolidated financial statements.
22. Related party transactions On March 31, 2015, the Company paid an interim dividend to its shareholders for an amount of USD 40.0 million. Following a decision of the General Meeting of June 10, 2015, the Company paid a complementary dividend of USD 40.0 million. No other new significant transaction has been entered into with related parties compared to the information disclosed in the 2014 annual consolidated financial statements.
23. Post balance sheet events There is no significant post balance sheet event to be reported.
Interim condensed consolidated financial statements CMA CGM / 27 Nine and three-month period ended September 30, 2015