ict job outlook malaysia 2013
TRANSCRIPT

PUBLISHED BY IN COLLABORATION WITH
ICT JOB MARKET OUTLOOKIN MALAYSIAJUNE 2013


ICT Job Market Outlook in MalaysiaJune 2013
Published by:
In collaboration with

COPYRIGHTCopyright © 2013. All rights reserved. No part of this publication may be produced or transmitted in any form or any means, electronic, mechanical, photocopying or otherwise, including recording or the use of any information storage and retrieval system without prior written permission from PIKOM.
Published by:
1106 & 1107, Block B, Phileo Damansara IINo.15, Jalan 16/11, 46350 Petaling JayaSelangor Darul EhsanT: +(603) 7955 2922; F: +(603) 7955 2933;E: [email protected] W: www.pikom.org.my
Wisma JobStreet.com,27, Lorong Medan Tuanku 1, (off Jalan Sultan Ismail), 50300 Kuala Lumpur, MalaysiaT: +(603) 2176 0493 (DL); F: +(603) 2698 7200 W: www.jobstreet.comE: [email protected]
KPMG Malaysia, Level 10, KPMG Tower, 8, First Avenue, Bandar Utama, 47800 Petaling JayaT: +(603) 7721 3656; F: +(603) 7721 3399W: www.kpmg.com.my
ISSN No: 2180-267XRelease date: June, 2013
Editor-in-Chief: Ramachandran Ramasamy, Head of Policy, Capability and Research, PIKOMContributor: Dominic Wong, Senior Marketing Manager – Malaysia, JobStreet.comReviewed by: Woon Tai Hai, Executive Director, KPMG Malaysia
DISCLAIMERThis publication contains fi ndings based on data provided by JobStreet.com Sdn Bhd (449122-K). KPMG Business Advisory Sdn Bhd (150059-H) and PIKOM Services Sdn Bhd (801999-W) collaboratively carried out the data analysis. Although professional effort has been made to ensure the accuracy of data analysis and presentation, all information furnished in this publication are provided strictly on an ‘as is’ and ‘as available’ basis and is so provided for your information and reference only. With this caution, kindly be informed that this release is not presented to address the circumstances of any particular individual or entity. As such, JobStreet.com, KPMG and PIKOM including their sponsors, partners and associates, whether named or unnamed, do not warrant the accuracy or adequacy of the data and fi ndings. Moreover, all parties concerned explicitly disclaim any liability for errors or omissions or inaccuracies pertaining to the contents of this publication. Therefore, the use of data and fi ndings presented in this publication is solely at the user’s risk. PIKOM, JobStreet.com and KPMG shall in no event be liable for damages, loss or expense including without limitation, direct, incidental, special, or consequential damage or economic loss arising from or in connection with the data and / or fi ndings published in this series. However, professional advice can be sought from the producers of this publication.

iii
ICT JOB MARKET OUTLOOK IN MALAYSIA | JUNE 2013
Contents
Message by PIKOM Chairman iv
Message by PIKOM President/CEO v
Preamble 6
Malaysian Economic and ICT Industry Outlook 9
ICT Job Market Salary Trends 14
Regional Benchmarking 25
Employment Outlook and Perceptions 28
Rethinking HR in a Changing World: A Practitioner’s Discourse 33
The Right Talent Development Strategy for Top Talents? 39
Closing The Demand-Supply Gap in ICT Talents 44

iv
ICT JOB MARKET OUTLOOK IN MALAYSIA | JUNE 2013
Message by PIKOM Chairman WOON TAI HAI
In its endeavour to champion the Information Communications Technology (ICT) industry, PIKOM has once again successfully produced the annual “ICT Job Market Outlook in Malaysia” report. This outlook is made possible with the continuing support of Jobstreet.com and KPMG. In order to provide more comprehensive information, due references have also been made to PayScale web-based information, wherever possible. As in the past, the typical information published includes average monthly salaries of ICT professionals, job sentiment index, top paying ICT jobs, hot ICT jobs in demand and the hiring outlook. The salary information is broken down by industry, job category, employment size and geographical location. As an additional feature, this series is accompanied by median data for various types of job functions, gender and years of working experience. Regional data on selected Asian countries and English speaking nations that Malaysia has close diplomatic and trade ties, is provided once again. This time, however, besides atlas based criterion the publication also included Purchasing Power Parity (PPP) adjusted salary information that essentially takes into account foreign exchange fl uctuations and infl ation rates as well as living standards and costs.
As the PIKOM Research Committee Chairman, I would like to see more effort taken in addressing the human capital development issues and challenges. From the employees’ perspective, the issues and challenges of talent migration to better paying destinations are still affecting the industry. As refl ected once again in this outlook, countries such as Hong Kong, Singapore and China in Asia and Australia, New Zealand and United States of America in the English speaking world have a much higher capacity for remuneration which is bound to attract competent Malaysian ICT professionals. If timely efforts are not taken in addressing this dilemma, it will be harder for the industry and the nation as a whole to become globally competitive and productive. On the other hand, employers are equally facing a quandary in getting industry ready ICT graduates. Employers are hesitant to invest in training or equipping fresh graduates with the right skills and knowledge in an employment environment where job hopping is highly prevalent. To overcome this problem, the industry needs to put in place appropriate strategies and measures that can help to enhance staff loyalty. Obviously, competitive remuneration is one of the options for staff retention.
PIKOM would like to take this opportunity to record its sincere thanks and appreciation to Jobstreet.com and KPMG for their invaluable contributions. PIKOM is optimistic that these industry partners will continue to offer their enduring support in the years ahead. PIKOM believes that with its expanded scope and coverage, this outlook will continue to serve its members, industry players and investors, as well as mainstream policy formulators.
v
ICT JOB MARKET OUTLOOK IN MALAYSIA | JUNE 2013
Message by PIKOM President/CEOSHAIFUBAHRIM SALEH
PIKOM is once again pleased to publish the annual “ICT Job Market Outlook in Malaysia” report. As in the past, this series continues to provide information on average monthly salaries earned by information and communications technology (ICT) professionals in Malaysia in 2012.
The report revealed that the ICT job market in Malaysia is expanding and evolving in tandem with the growing demand for information age services such as system integration, cloud computing, data warehousing, software development as a service (SaaS), platform as a service (PaaS), web and portal development, multi-media content provision, big data analytics and networking.
In meeting the changing demands of the industry and human capital requirements, PIKOM has reviewed and realigned its fi ve-year strategy plan during its 2013 planning session. Specifi cally, human capital development is positioned as one of the six key strategies. The others include enhancing value to members, accelerating growth demand, leading the digital trend and increasing competitiveness and globalisation of the Malaysian ICT industry. In human capital development, PIKOM has embarked on programmes to publicise ICT courses through social media networks, re-skill the current talent pool, conduct cross-disciplinary training, promote industrial guided projects for students and to attract Malaysian talents from overseas as well as the Board of Computing Professionals Malaysia (BCPM).
Once again, I would like to take this opportunity to record my sincere appreciation to Jobstreet.com and KPMG for their effort in making this publication into another milestone for PIKOM.

6
ICT JOB MARKET OUTLOOK IN MALAYSIA | JUNE 2013
Preamble
PIKOM, the National ICT Association of Malaysia, has once again taken the lead to compile the “ICT Job Market Outlook in Malaysia, 2013” in collaboration with JobStreet.com and KPMG. PIKOM was mainly responsible for data collation and coordination over and above its provision of ICT industry-specifi c information and outlook. On its part, Jobstreet.com provided the latest salary report of ICT professionals by industry, job market outlook in the respective ICT segments, and survey-based economic perception of job seekers and industry players. Meanwhile, KPMG took on the task to present Malaysia’s economic outlook.
For regional comparisons, due references were made to web published salary information by PayScale Salary Report. The average salary of ICT professionals in Malaysia is compared against selected Asian and English speaking countries that have become attractive destinations for Malaysian talent migration or talent soliciting. The Asian countries considered in the report include Singapore, Indonesia, Thailand, Philippines, Malaysia, China, Korea and India. The English speaking nations covered include United States of America, United Kingdom, Canada, Australia and New Zealand.
PIKOM is the national representative of the information and communications technology (ICT)
industry with more than 1,500 members as at end of 2012. Its members contribute about 80% of
the total ICT revenue in the country.
JobStreet.com is the largest online recruitment service provider for all categories of jobseekers,
from fresh jobseekers after graduation to senior level positions. Job Street operates the JobStreet.
com (www.JobStreet.com) websites presently covering the employment markets in Malaysia,
Singapore, Philippines, Indonesia, India, Japan and Thailand. The group currently services over
50,000 corporate customers and over 6 million jobseekers. Job Street is listed on the Main Board of
Bursa Malaysia Securities (JOBST).
KPMG is an international network specialising in audit, tax and advisory service. KPMG fi rst
established a presence in Malaysia in 1928 and the Malaysian fi rm now has 65 partners and over
1,700 staff located across 10 offi ces. Globally, KPMG operates in 144 countries with a staff size of
137,000 people.

7
ICT JOB MARKET OUTLOOK IN MALAYSIA | JUNE 2013
The main objective of this report is to provide data and information on the following:-i. Average ICT Salaries by Industry
• Agriculture / Plantations / Aquaculture• Automotive / Heavy Industry / Machinery• Banking Institutions• Chemical Industries• Construction / Building, including Civil Engineering• Consulting, both Business and Technical• Private Education• Electrical & Electronics Sector• Financial Services / Securities / Insurance/• Hotel / Restaurant / Food Services • Manufacturing• Oil / Gas / Petroleum Industries• Printing / Publishing• Property / Real Estate• Technology / Aerospace / Bio-technology• Semiconductor / Wafer Fabrication• Services• Telecommunication• Textiles / Garment• Transport / Storage / Freight / Shipping• Utilities• Wholesale / Retail / Trading• Call Centre / ICT-Enabled Services• Computer / ICT (Hardware)• Computer / ICT (Software)
ii. Average Monthly Salaries of ICT Professionals by Job Category• Overall ICT Professional• Junior ICT Executive – fewer than 4 years of experience including fresh entrants • Senior ICT Executive – 5 years and above of working experience• Middle ICT Manager – as declared by the job seekers• Senior ICT Manager – as declared by the job seekers
iii. Average Monthly Salaries of ICT Professionals by Key ICT Industry Segments • ICT Hardware• ICT Software• Call Centre
iv. Top 10 Specialisations Sought v. Regional Benchmarking with Selected Asian Economies vi. Perception by Job Seekers and Employers
• Jobstreet.com Employee Confi dence Index (JECI) • Anticipated Hiring Activities • Top 10 Specialisations Sought • Position Level Sought
8
ICT JOB MARKET OUTLOOK IN MALAYSIA | JUNE 2013
It is pertinent to note that the average monthly salary of ICT professionals for 2012 was RM6,784, registering an increase of 8.7% from RM6,240 the previous year. The record also showed that the ICT professionals in the Senior Manager, Middle Manager and Senior Executive categories experienced significant pay rise of 14.1%, 9.9% and 9.6% respectively in 2012. It is also observed that the salary gap between the Senior Managers and the fresh graduates has widened from 5.44 times in 2011 to 5.71 times in 2012. Such trends are considered unhealthy for the ICT industry where the employment market has been tight over a number of years and, as such, the industry will continue to face problems in retaining its younger staff from job hopping in search of higher remuneration.
Like in the previous years, the oil and gas sector continued to be one of the attractive sectors for ICT professionals, especially those in the junior categories. In terms of geographical locations, the study discovered that the typical salaries of ICT professionals in major cities like Kuala Lumpur and Cyberjaya is 1.75 times higher than of those who work in smaller cities like Ipoh or Kuching. Such disparity is likely to continue in accentuating youth migration to cities that are already overcrowded. The data also showed that big companies tend to pay as high as 1.88 times more than those in the small and micro categories which have less than 10 employees. The study also interestingly revealed that male ICT professionals earn, on average, 34% higher salary than their female counterparts.
Among the various types of job functions investigated, those in ICT Project Management tend to earn significantly higher salary than those in the technical or engineering fields. For instance, in 2012 a typical ICT Project Manager earned an average monthly salary of RM9,700, which is almost twice of that earned by a Junior Software Engineer or 50% more than that of a Senior Software Engineer.
Besides publishing average annual salaries earned by ICT professionals in seven Asian countries, namely Hong Kong, Singapore, China, Thailand, India, the Philippines and Indonesia, the report also provides data for five English speaking nations namely United States, United Kingdom, Canada, New Zealand and Australia that typically attract Malaysians for employment. For making meaningful comparisons, the regional salary data took into consideration the Purchasing Power Parity (PPP) factor. Instead of just publishing the average annual salaries, once again the reporting is done in terms of scaling numbers, which essentially highlighted how many times higher or lower the salaries are compared with other regional markets. Among Asian countries, Hong Kong once again topped the salary scale, where the salary was 1.90 times (with PPP adjusted) higher or 2.53 times (without PPP adjustments) higher than their counterparts in Malaysia in 2012. Similarly, Australia and USA topped the list among the English speaking destinations. Specifically, ICT professionals in Australia netted 3.76 times (without PPP adjustments) higher or 1.90 times (with PPP adjusted) higher than the data reported for Malaysians in this report.
Hot ICT jobs varied across technical, business applications and soft skills categories. In the technical domain, ICT professionals equipped with Java, C#, C++, dotNet, SharePoint and Web Application Developers are highly sought after. Under business applications, the notable fast growing jobs are IT Security Analyst and Big Data Analytics for fending off cyber threats and culling out customer insights from petabytes systems respectively. The demand for both the technical and business applications jobs are attributed to prolific growth experienced in cloud computing and mobile applications.
The report also carries information on the perception of job seekers and potential employers, in particular pertaining to economic performance and ICT job market outlook as gauged by Jobstreet.com on a regular basis. Generally the job seekers and providers indicated a positive outlook for Malaysia in 2013.

9
ICT JOB MARKET OUTLOOK IN MALAYSIA | JUNE 2013
Malaysian Economic and ICT Industry Outlook

10
ICT JOB MARKET OUTLOOK IN MALAYSIA | JUNE 2013
The Malaysian economy grew at an average rate of 5.2% in 2012. The Government of Malaysia has projected an economic growth of between 4.5% and 5.5% in 2013 (Figure 1). However, Malaysia’s economic growth predictions for 2013 vary widely among private fi nancial institutions, international agencies and research institutions. Specifi cally, the Malaysian Institute of Economic Research (MIER) has predicted continuity of resilience in the Malaysian economy in 2013 with a growth rate of 5.6%. The economic growth predictions made by Royal Bank of Scotland and the Overseas Chinese Banking Corporations (OCBC) were 5.5% and 5.2% respectively, which were much higher compared to other private institutions. The predictions made by International Monetary Fund (IMF), Asian Development Bank (ADB) and World Bank (WB) were 4.7%, 4.8% and 5.0% respectively, which is signifi cantly lower than MIER, citing the effect on the export market by the continuing global economic slowdown as the key reason for the lower forecast. Although Malaysia’s growth rate was lower than expected at 4.1% in Q1, 2013, the economy is expected to rebound with economic improvement in the US and positive growth in China.
-10
-8
-6
-4
-2
0
2
4
6
8
10
12
2013
2012
2011
2010
2009
2008
2007
2006
2005
2004
2003
2002
2001
2000
1999
1998
1997
1996
1995
1994
1993
1992
1991
1990
9.0 8.9 9.27.3
6.1
8.9
0.5
5.4
5.8 5.3
5.8 6.5
4.7
6.8 6.8
5.1 5.2
5.5
-1.7
-7.4
9.5 9.9 9.8 10.0
Pre Asian Financial Crisis 1997: 9.2% p.a.Pre Global Financial Crisis 2009: 5.6% p.a.
Projected to grow by 5.5% p.a. in 2013 by Economic Report
Figure 1: Malaysia’s GDP Growth (%): 1990-2013
However, PIKOM is optimistic and concurs with MIER’s prediction of 5.6%. The resilience in the Malaysian economy is poised to continue in 2013 and can be attributed to the following factors:-
i. strong domestic demand arising from economic transformation programmes and on-going mega projects;
ii. increased export earnings owing to strengthening of Ringgit Malaysia against US dollars;
iii. stable overnight lending rates stimulating business investments;
iv. sustained private and public consumption and expenditure;
v. low infl ation rate;
vi. low unemployment rate;
vii. steady and positive growth in the various economic sectors, especially in the Information Communications Technology Services (ICTS); and
viii. higher economic growth forecasts for China, India and ASEAN countries, where at least 60% of Malaysia’s total trade is concentrated at and is highly likely to bring a positive impact on the Malaysian economy in 2013.

11
ICT JOB MARKET OUTLOOK IN MALAYSIA | JUNE 2013
Nonetheless, the Malaysian economy is not totally free from economic encumbrances and faces a number of investment related risk factors such as:-
i. External environment: Risk aversion strategy among potential investors due to globalisation and market liberalization phenomena;
ii. Macro policy environment: Any slacking in the delivery of economic transformation initiatives, mega projects and geographically defi ned corridor projects;
iii. Reducing fi scal defi cit: Poor management on the part of the Government in its ambitious task in reducing the fi scal defi cit from 5.4% of GDP in 2011 to 3% in 2015 may dampen public expenditure and investments, unless the Government achieves the target through revenue-increasing measures or operational cost reduction strategies;
iv. Macro indicators: Fluctuation in oil and commodity prices in global markets could result in higher prices for consumers through increasing infl ation and base lending rates;
v. Capital fl ight: Massive capital outfl ow arising from volatile foreign exchange rates is also bound to hurt export and import earnings;
vi. Quality of Malaysian workforce: Over dependence on low skilled foreign workers may not be healthy for the Malaysian economy in the long term unless a concerted effort is made to increase the quality of the local workforce, ingrained with technological capabilities, innovation culture, R&D capabilities, productivity, quality and competitive edge best practices;
vii. 13th General Election: Typically, during the post-election period the Government takes cognizance and reminds the public of its pledges and promises, and therefore tends to implement developmental projects. From a business perspective, it is imperative and crucial to ensure a familiarity of policies and regulations now that GE13 is done and dusted. The Government should also review policies that may have run their course as this will garner wider public support and boost investor confi dence.
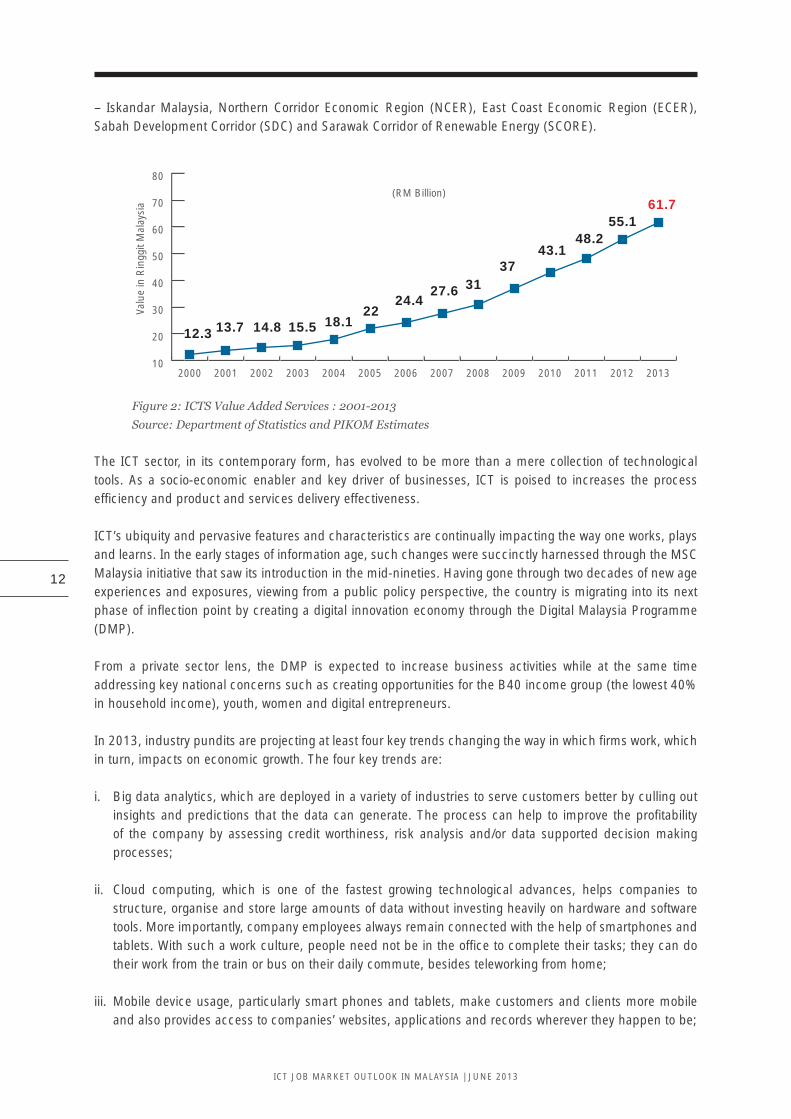
ICT Industry OutlookAs it was in the past, the ICTS segment in Malaysia is projected to register signifi cant growth in 2013. The ICTS segment grew at a Compound Annual Growth Rate (CAGR) of 13.3% by increasing its value added services from RM12.3 billion in 2001 to RM55.1 billion in 2012 (Figure 2). The ICTS segment is poised to reach the mark of RM61.7 billion in 2013 by registering another annual growth rate of 12%. In tandem, the share of ICTS in the national Gross Domestic Product (GDP) increased from 3.4% to 6.3%, almost doubling during the period of 2001-2012.
Traditionally, telecommunications and computer services constitute the ICTS segments as per Malaysian Standard Industry Classifi cation 2000 (MSIC2000). The introduction of MSIC2008 saw the inclusion of publishing services, motion picture, video and television programme, programming and broadcasting and information services as additional items. The new additional segments constitute about 11% of the total ICTS sector contribution in terms of value added services.
PIKOM is confi dent of achieving double digit growth rate in the years ahead through on-going capital intensive economic transformation programmes and mega-projects that have been stimulating domestic demand for ICT Services. To name a few, the ICT intensive big projects include My Rapid Transit (MRT) linking Kajang and Sg. Buluh, Petronas Refi nery and Petrochemical Integrated Development (RAPID) project in Pengerang, Tun Razak Exchange, River of Life, Bandar Malaysia at Sungei Besi as well as the various economic corridors
12
ICT JOB MARKET OUTLOOK IN MALAYSIA | JUNE 2013
– Iskandar Malaysia, Northern Corridor Economic Region (NCER), East Coast Economic Region (ECER), Sabah Development Corridor (SDC) and Sarawak Corridor of Renewable Energy (SCORE).
10
20
30
40
50
60
70
80
20132012201120102009200820072006200520042003200220012000
12.3 13.7 14.8 15.5 18.122
24.427.6 31
3743.1
48.255.1
61.7(RM Billion)
Valu
e in
Rin
ggit
Mal
aysi
a
Figure 2: ICTS Value Added Services : 2001-2013
Source: Department of Statistics and PIKOM Estimates
The ICT sector, in its contemporary form, has evolved to be more than a mere collection of technological tools. As a socio-economic enabler and key driver of businesses, ICT is poised to increases the process effi ciency and product and services delivery effectiveness.
ICT’s ubiquity and pervasive features and characteristics are continually impacting the way one works, plays and learns. In the early stages of information age, such changes were succinctly harnessed through the MSC Malaysia initiative that saw its introduction in the mid-nineties. Having gone through two decades of new age experiences and exposures, viewing from a public policy perspective, the country is migrating into its next phase of infl ection point by creating a digital innovation economy through the Digital Malaysia Programme (DMP).
From a private sector lens, the DMP is expected to increase business activities while at the same time addressing key national concerns such as creating opportunities for the B40 income group (the lowest 40% in household income), youth, women and digital entrepreneurs.
In 2013, industry pundits are projecting at least four key trends changing the way in which fi rms work, which in turn, impacts on economic growth. The four key trends are:
i. Big data analytics, which are deployed in a variety of industries to serve customers better by culling out insights and predictions that the data can generate. The process can help to improve the profi tability of the company by assessing credit worthiness, risk analysis and/or data supported decision making processes;
ii. Cloud computing, which is one of the fastest growing technological advances, helps companies to structure, organise and store large amounts of data without investing heavily on hardware and software tools. More importantly, company employees always remain connected with the help of smartphones and tablets. With such a work culture, people need not be in the offi ce to complete their tasks; they can do their work from the train or bus on their daily commute, besides teleworking from home;
iii. Mobile device usage, particularly smart phones and tablets, make customers and clients more mobile and also provides access to companies’ websites, applications and records wherever they happen to be;

13
ICT JOB MARKET OUTLOOK IN MALAYSIA | JUNE 2013
iv. Social media, an offspring of the Internet age. This new age media, though seen as a disruptive and unproductive activity when staff unnecessarily waste time, can be a powerful tool for customer engagement, relationship building, networking, information sharing, and soliciting feedback, as well as branding products and services.
Despite growing dynamism, the nation’s ICT sector continues to face several persistent challenges:
i. Supply of ICT Graduates: As it was in the recent past, ICT enrolment in both public and private institutions has stagnated. The ICT enrolment in the public universities has not improved much, as the fi gure has been lingering around 25,000 per year over the past three years. Understandably, with budget constraints, it will be diffi cult for public universities to increase their capacity to produce more ICT graduates. ICT enrolment in private universities also has not improved very much and averages around 50,000 per year, which, notably, is half than what it was a decade ago.
ii. Quality of ICT Graduates: Quality, competency and employability of ICT graduates in meeting the industry’s demands continue to remain a critical issue. Low remuneration, especially in comparison to regional countries, rampant job-hopping for better terms of employment, and a declining interest among young people in ICT jobs that demand long working hours continue to plague the growth of the ICT industry. However, initiatives by TalentCorp, which was established in January 2011, helped to redress some of the talent gaps in the ICT sector. The initiatives are carried out via three strategic thrusts: optimise Malaysian talent, attract and facilitate global talent and build networks of top talent. Being new, these endeavours are yet to be realised.
iii. Quality and Competency Standards of Human Capital in ICT Firms: The ICT industry, including its workforce, generally lacks the interest in attaining global standards in process and quality improvement activities. PIKOM’s internal investigation revealed that only 6% of Malaysian Information Communications Technology Service (ICTS) providers have attained Capability Maturity Model Integration (CMMI) certifi cations and less than 1.5% are equipped with the People Capability Maturity Model (PCMM) certifi cation. The numbers were further disheartening upon realising that less than 2% of PIKOM members in the ICTS segment have employees certifi ed with Six Sigma or Lean Six Sigma accreditations. Green ICT Certifi cations have yet to gain a foothold in the Malaysian ICTS landscape. Pursuant of these certifi cations is critical for globalising Malaysian ICT products and services, or to solicit ICT contracts from developed economies like USA; and
iv. Research, development and commercialisation culture: Public and private universities and industries are still behind in creating globally-recognised ICT products and services due to the lack of a strong R&D and patenting culture. Despite the long established presence of some multi-nationals, the country still has weak links in the global R&D and innovation network. This is due to diffi culties in getting the right candidates to embark on high value adding ICT activities that the Government has been passionate about over the past two decades.

14
ICT JOB MARKET OUTLOOK IN MALAYSIA | JUNE 2013
ICT Job Market Salary Trends

15
ICT JOB MARKET OUTLOOK IN MALAYSIA | JUNE 2013
Job Category OverallThe average monthly salary of an ICT professional in Malaysia in 2012 was RM6,784 (Figure 3). This represents an increase of 8.7% from RM6,240 in 2011. This increase was well above the average infl ation rate of 3.2% in 2011 and 1.6% in 2012, resulting in a comfortable living for ICT professionals in Malaysia. Given the optimistic outlook of the economy and other positive factors within the ICT industry, PIKOM anticipates an 8.9% rise in the average salary of ICT professionals in 2013, to a fi gure no less than RM7,387 per month.
4000
4500
5000
5500
6000
6500
7000
7500
8000
20132012201120102009200820072006
4,184 4,446 4,699 5,276 5,626 6,240 6,784 7,387
Aver
age
Mon
thly
Sal
ary
(Rin
ggit
Mal
aysi
a)
Average Monthly Salary
4,184 4,4464,699
5,2765,626
6,240
6,784
8.7%
8.9%
7,387
Figure 3: Average Salary of ICT Professionals: 2006-2013
Source: Jobstret.com and PIKOM, 2013
By Job Category and Years of Working ExperienceIt can be seen from Table 1 that all ICT job categories, except Junior Executive, registered signifi cant increase in the average salary in 2012. ICT professionals in the middle management level received the highest average rate of pay rise of 14.1%, followed by senior management (9.9%) and senior executive category (9.6%). Junior executives received only a raise of 1.7% where their average monthly salary increased from RM3,151 in 2011 to RM3,206 in 2012. The fresh graduates are, on average, netting a monthly salary of RM2,343, which is considered as a signifi cant rise from RM2,238 in the preceding year .
By Job Category
YearFresh
Graduates: (Entry Level)
Junior Executive:(1-4 Years Working
Experience)
Senior Executive:(> 5 Years Working
Experience)
Middle Management:
(Manager)
Senior Management:
(Senior Manager)
Overall
2010 - 2,936 4,514 7,005 10,795 5,626
2011 2,238 3,151 5,039 7,837 12,166 6,240
2012 2,343 3,206 5,521 8,946 13,374 6,784
Percentage Change (%) 4.7 1.7 9.6 14.1 9.9 8.7
Benchmarking Against Average Monthly Salary of Fresh Graduates
2011 1.00 1.41 2.25 3.50 5.44
2012 1.00 1.37 2.36 3.82 5.71
Table 1 : Average Salary of ICT Professionals by Job Category: 2010-2012
Source: Jobstret.com and PIKOM, 2013

16
ICT JOB MARKET OUTLOOK IN MALAYSIA | JUNE 2013
From Table 1, it can also be observed that Senior Managers earned 5.44 times higher than fresh graduates in 2011 and 5.71 times higher in 2012. Similarly, the fi gures for Middle Manager level were 3.50 and 3.82 while for Senior Executives it were 2.25 and 2.36, indicating a widening disparity in the salary structure.
Industry CategoryTable 2 and Table 3 show the average monthly salary of ICT professionals by industry.
Industry(Central Malaysia)
Fresh Graduates / Entry Level(Less than 1 year working experience) %
ChangePercentiles (Ringgit Malaysia) Weighted Mean
25th 50th 75th 2012 2011
Automotive/Heavy Industry/Machinery 1,800 2,300 2,300 2,175 2,175 0.0
Bank 2,000 2,500 2,700 2,425 2,225 9.0
Call Centre/IT-Enabled Services 1,800 2,300 2,700 2,275 2,275 0.0
Computer/IT (Hardware) 2,000 2,400 2,670 2,368 2,213 7.0
Computer/IT (Software) 2,000 2,500 2,800 2,450 2,400 2.1
Construction/Building 1,715 1,800 2,775 2,023 1,800 12.4
Consulting (Business/Technical) 2,000 2,350 2,600 2,325 2,275 2.2
Education 1,600 2,000 2,331 1,983 1,975 0.4
Electrical & Electronics 1,950 2,310 2,800 2,343 2,063 13.5
Financial Services/Securities/Insurance 2,000 2,230 2,800 2,350 2,225 2.6
Hotel/Restaurant/Food Service 1,800 1,800 3,750 2,288 2,225 2.8
Manufacturing 2,150 2,540 2,800 2,508 2,508 0.0
Oil/Gas/Petroleum 2,300 2,800 3,200 2,775 2,418 14.8
Printing/Publishing 2,000 2,000 3,200 2300 2,225 3.4
Science & Technology/Aerospace/BioTechnology 2,500 2,500 2,500 2500 2,350 6.4
Semiconductor/Wafer Fabrication 3,280 3,280 3,280 3280 3,280 0.0
Services 1,900 2,030 2,500 2115 2,000 5.8
Telecommunication 1,700 2,200 2,500 2150 2,120 1.4
Transport/Storage/Freight/Shipping 1,600 2,300 2,800 2250 2,284 -1.5
Wholesale/Retail/Trading 1,500 1,950 2,300 1925 1,800 6.9
Geometric Mean (GM) : (Ringgit Malaysia ) 2343 2,238 4.7
Minimum (Ringgit Malaysia ) 1925
Maximum (Ringgit Malaysia ) 3280
Table 2: Average Monthly Salary of ICT Graduates by Industry in 2012
Source: Jobstret.com and PIKOM, 2013
Fresh graduates by IndustryTable 2 shows that the Semiconductor and Wafer Fabrication industries paid the highest monthly salary of RM3,280 for fresh graduates in 2012 but had not changed since 2011. However, the Oil and Gas industry registered a signifi cant rise in the monthly salary for fresh graduates from RM2,418 in 2011 to RM2,775 in 2012, recording the highest percentage increase of 14.8%. This is followed by the Electrical and Electronics industry where the average salary for fresh graduates increased by 13.5%, which is an increase from RM2,063 in 2011 to RM2,343 in 2012. ICT graduates in the Construction and Building industry also experienced a signifi cant increase of 12.4% in their salary. Besides Semiconductor and Wafer Fabrication, industries like Automotive and Heavy Industry, Manufacturing, Transport, Storage, Freight and Shipping as well as Call Centre and IT enabled Services did not show any improvement in the average salary for fresh graduates in 2012.

Indu
stry
(C
entr
al M
alay
sia)
Sen
ior
Man
agem
ent
(Sen
ior
Man
ager
)M
iddl
e M
anag
emen
t (M
anag
er)
Sen
ior
Exe
cuti
ve(5
or
mor
e w
orki
ng e
xper
ienc
e)Ju
nior
Exe
cuti
ve
(1-4
wor
king
exp
erie
nce)
Per
cent
iles
(Rin
ggit
Mal
aysi
a)W
eigh
ted
Mea
n
Per
cent
iles
(Rin
ggit
Mal
aysi
a)W
eigh
ted
Mea
n
Per
cent
iles
(Rin
ggit
Mal
aysi
a)W
eigh
ted
Mea
n
Per
cent
iles
(Rin
ggit
M
alay
sia)
Wei
ghte
d M
ean
25
th5
0th
75
th2
5th
50
th7
5th
25
th5
0th
75
th2
5th
50
th7
5th
Agr
icul
ture
/Pla
ntat
ions
/Aqu
acul
ture
--
--
--
--
3,40
04,
000
8730
5,03
31,
468
2,50
02,
750
2,30
5
Aut
omot
ive/
Hea
vy In
dust
ry/M
achi
nery
7,35
020
,800
20,8
0017
,438
7,30
08,
800
11,1
009,
000
4,40
05,
050
5,70
05,
050
2,40
03,
950
3,95
03,
563
Ban
k10
,045
13,0
0019
,800
13,9
616,
775
8,50
010
,200
8,49
44,
600
5,50
06,
700
5,57
53,
000
3,40
04,
100
3,47
5
Cal
l C
entr
e/IT
-Ena
bled
Ser
vice
s-
--
-7,
000
8,50
09,
200
8,30
03,
800
4,50
06,
200
4,75
02,
700
3,20
03,
800
3,22
5
Che
mic
al-
--
--
--
-5,
100
7,36
38,
600
7,10
74,
500
4,60
07,
158
5,21
5
Com
pute
r/IT
(H
ardw
are)
15,0
0016
,500
21,6
0017
,400
5,30
06,
500
8,90
06,
800
3,60
04,
700
6,33
84,
835
2,20
03,
200
3,80
03,
100
Com
pute
r/IT
(So
ftwar
e)8,
000
10,0
013
,500
10,3
756,
000
7,50
09,
300
7,57
54,
000
5,07
06,
500
5,16
02,
500
3,00
03,
750
3,06
3
Con
stru
ctio
n/B
uild
ing
--
--
6,20
06,
300
7,50
06,
575
3,50
04,
250
6,00
04,
500
2,50
03,
000
3,30
02,
950
Con
sulti
ng (
Bus
ines
s/Te
chni
cal)
8,00
010
,500
15,0
0011
,000
6,30
08,
600
11,0
008,
625
4,30
05,
857
7,50
05,
879
2,70
03,
200
4,03
03,
283
Educ
atio
n8,
000
8,00
08,
500
8,12
53,
800
5,50
06,
100
5,22
53,
100
4,15
05,
000
4,10
02,
100
2,60
03,
000
2,57
5
Elec
tric
al &
Ele
ctro
nics
--
--
5,36
517
,000
17,0
0014
,091
4,50
05,
138
5700
5119
2,81
03,
300
3,50
03,
228
Fina
ncia
l Ser
vice
s/Se
curit
ies/
Insu
ranc
e10
,045
13,0
0019
,800
13,9
617,
500
8,32
09,
000
8,28
54,
300
5,50
06,
500
5,45
03,
000
3,40
04,
100
3,47
5
Hot
el/R
esta
uran
t/Foo
d Se
rvic
e-
--
-5,
000
7,80
08,
346
7,23
73,
605
5,00
05,
600
4,80
12,
500
2,60
02,
600
2,57
5
Man
ufac
turin
g11
,429
14,0
0017
,350
14,1
507,
000
8,19
010
,000
8,34
54,
000
5,39
66,
400
5,29
82,
660
3,00
03,
966
3,15
7
Oil/
Gas
/Pet
role
um14
,085
16,0
0020
,000
16,5
219,
016
10,0
0013
,000
10,5
045,
500
7,50
09,
500
7,50
03,
000
3,60
04,
500
3,67
5
Prin
ting/
Pub
lishi
ng-
--
-5,
500
7,00
07,
000
6,62
53,
116
4,00
05,
500
4,15
42,
400
2,70
02,
996
2,69
9
Pro
pert
y/R
eal E
stat
e-
--
-6,
200
7,00
08,
200
7,10
05,
100
6,00
06,
200
5,82
52,
900
3,00
03,
960
3,21
5
Scie
nce
& T
echn
olog
y/A
eros
pace
/B
ioTe
chno
logy
9,32
112
,989
15,4
0013
,680
8,50
010
,600
11,0
0010
,175
4,50
06,
750
8,00
06,
500
2,50
03,
100
3,57
73,
069
Sem
icon
duct
or/W
afer
Fab
ricat
ion
--
--
9,00
011
,000
13,7
3011
,183
4,50
05,
275
7,20
05,
563
3,01
03,
700
4,60
03,
753
Serv
ices
13,0
0013
,500
21,2
5015
,313
6,63
08,
600
15,5
009,
833
3,80
05,
200
6,65
05,
213
2,07
53,
400
3,60
03,
119
Tele
com
mun
icat
ion
11,0
0012
,600
15,5
0012
,925
7,17
08,
800
10,0
008,
693
5,20
06,
500
8,50
06,
675
2,75
03,
300
4,20
03,
388
Tran
spor
t/Sto
rage
/Fre
ight
/Shi
ppin
g8,
000
15,0
0017
,460
1386
56,
400
9,00
010
,000
8,60
04,
100
5,42
07,
500
5,61
02,
200
3,20
03,
800
3,10
0
Util
ities
--
--
6,97
57,
000
8,00
07,
244
4,40
25,
000
6,40
05,
201
3,00
03,
202
3,50
03,
226
Who
lesa
le/R
etai
l/Tra
ding
10,0
0012
,000
14,7
0012
,175
8,05
010
,000
11,7
859,
959
3,90
04,
800
5,70
04,
800
3,00
03,
350
4,00
03,
425
Geo
met
ric
Mea
n (G
M):
(R
ingg
it
Mal
aysi
a)1
3,3
74
8,9
46
5,5
21
3,2
06
Min
imum
(R
ingg
it M
alay
sia)
8,1
25
6,6
25
4,1
54
2,5
75
Max
imum
(R
ingg
it M
alay
sia)
17
,43
81
4,0
91
7,5
00
3,7
53
Ta
ble
3 :
Ave
rag
e M
onth
ly S
ala
ry o
f IC
T P
rofe
ssio
na
ls b
y In
du
stry
, 20
12
Sou
rce:
Job
stre
t.co
m a
nd
PIK
OM
, 20
13

Industry (C
entral Malaysia)
Senior M
anagement
(Senior M
anager)M
iddle Managem
ent (M
anager)S
enior Executive
(5 or m
ore working experience)
Junior Executive
(1-4
working experience)
ALL JO
B C
ATEG
OR
IES
20
12
20
11
%
change2
01
22
01
1%
change
20
12
20
11
%
change2
01
22
01
1%
change
20
12
20
11
%
change
Agriculture/P
lantations/Aquaculture
--
--
--
5,0334,600
9.42,305
--
3,405-
-
Autom
otive/Heavy Industry/M
achinery17,438
--
9,0008,925
0.85,050
4,9891.2
3,5633,100
14.97,289
5,16841.0
Bank
13,96111,887
17.48,494
7,9836.4
5,5755,395
3.33,475
3,4002.2
6,9236,459
7.2
Call C
entre/IT-Enabled Services-
--
8,3007,258
14.44,750
4,5564.3
3,2253,225
0.05,028
4,7426.0
Chem
ical-
--
--
-7,107
6,41710.7
5,2154,890
6.66,087
5,6018.7
Com
puter/IT (Hardw
are)17,400
14,47520.2
6,8005,963
14.04,835
4,7691.4
3,1003,002
3.36,489
5,9299.4
Com
puter/IT (Software)
10,37510,000
3.87,575
7,2634.3
5,1605,019
2.83,063
3,0251.2
5,9365,762
3.0
Construction/B
uilding-
--
6,5756,575
0.04,500
4,1009.8
2,9502,900
1.74,436
4,2763.7
Consulting (B
usiness/Technical)11,000
11,0000.0
8,6258,013
7.65,879
5,5256.4
3,2833,150
4.26,541
6,2584.5
Education8,125
8,1250.0
5,2254,950
5.64,100
4,1000.0
2,5752,523
2.14,601
4,5161.9
Electrical & Electronics
--
-14,091
14,0910.0
5,1194,750
7.83,228
3,1133.7
6,1525,928
3.8
Financial Services/Securities/Insurance13,961
10,25036.2
8,2857,575
9.45,450
5,2613.6
3,4753,400
2.26,841
6,10512.1
Hotel/R
estaurant/Food Service-
--
7,2377200
0.54,801
4,8010.0
2,5752,525
2.04,473
4,4360.8
Manufacturing
14,15013,550
4.48,345
8,3400.1
5,2985,175
2.43,157
3,0952.0
6,6666,552
2.2
Oil/G
as/Petroleum
16,52116,146
2.310,504
9,7607.6
7,5007,500
0.03,675
3,5005.0
8,3168,020
3.7
Printing/P
ublishing-
--
6,6256,524
1.54,154
4,1500.1
2,6992,500
8.04,204
4,0753.2
Property/R
eal Estate-
--
7,1006,350
11.85,825
5,3009.9
3,2153,905
-17.75,104
5,0840.4
Science & Technology/A
erospace/B
ioTechnology13,680
13,6800.0
10,1757,339
38.66,500
5,03129.2
3,0692,925
4.97,259
6,20017.1
Semiconductor/W
afer Fabrication-
--
11,1839,496
17.85,563
5,5630.0
3,7533,700
1.46,157
5,8036.1
Services15,313
15,3130.0
9,8339,800
0.35,213
3,92532.8
3,1192,794
11.67,034
6,36910.4
Telecomm
unication13,925
12,8001.0
8,6938,537
1.86,675
6,1937.8
3,3883,250
4.27,099
6,8483.7
Transport/Storage/Freight/Shipping13,865
11,36522.0
8,6007,967
7.95,610
5,4003.9
3,1002,964
4.66,748
6,1709.4
Utilities
--
-7,244
7,2440.0
5,2014,710
10.43,226
3,0924.3
4,9534,725
4.8
Wholesale/R
etail/Trading12,175
12,1750.0
9,9599,888
0.74,800
4,8000.0
3,4253,300
3.86,682
6,6081.1
Geom
etric Mean (G
M): (R
inggit Malaysia)
13
,37
41
2,1
66
9.9
8,9
46
7,8
37
14
.15
,52
15
,03
99
.63
,20
63
,15
11
.76
,78
46
,24
08
.7
Ta
ble 4 :C
omp
arison
of Avera
ge M
onthly Sa
lary of IC
T P
rofessiona
ls by Ind
ustry, 20
11 an
d 20
12
Source: Jobstret.com
an
d P
IKO
M, 20
13

19
ICT JOB MARKET OUTLOOK IN MALAYSIA | JUNE 2013
Experienced ICT Professionals by IndustryThe highest salary earned by ICT professionals differed among industries as well as by the number of years of working experience held. Table 3 shows that the Automobile, Heavy Industry and Machinery as well as the Computer Hardware industries were the top-paying ones in the senior management category, where the maximum monthly salary recorded was RM17,438 in 2012. No data was reported for Semiconductor and Wafer Fabrication, Construction and Building and Chemical industries where the pay could also be equally high. In the middle management level, the maximum monthly salary of RM14,091 was reported in the Electrical and Electronics industry. In the senior executive level, the Oil and Gas industry reported the highest monthly salary of RM7,500. For the junior executive level, the Semiconductor and Wafer fabrication industry offered the highest salary of RM3,753 per month.
Comparison Between 2011 and 2012 by industryTable 4 shows that, on overall, the Automotive, Heavy Industry and Machinery, Science & Technology, Aerospace and Bio-technology as well as the Financial Services industries registered a signifi cant rise in the salary for the ICT professionals of not less than 10% between 2011 and 2012. Discounting the sectors lacking data, Table 4 also shows that ICT professionals in the Senior Management category working in the Financial Services industry received the highest salary increment of 36.2%, which is an increase from RM10,250 to RM13,961 . Further scrutiny revealed that in the Middle Management category, the Science & Technology, Aerospace and Bio-technology industry reported the highest percentage of change (38.6%) in the monthly salary from RM7,339 in 2011 to RM10,175 in 2012. In the Senior Executive category, the Services and Science & Technology, Aerospace and Bio-technology industries recorded the highest pay rise of 32.8% and 29.8% respectively. The Automobile, Heavy Industry and Machinery industry registered the highest pay rise of 14.9% in the Junior Executive category, which is an increase from RM3,100 in 2011 to RM3,563 in 2012.
Top Five Paying Industries
Industry(Central Malaysia)
ALL JOB CATEGORIES
Industry(Central Malaysia)
Senior Executive(5 or more years
working experience)
Oil/Gas/Petroleum 8,316 Oil/Gas/Petroleum 7,500
Automotive/Heavy Industry/Machinery 7,289 Chemical 7,107
Science & Technology/Aerospace/BioTechnology 7,259 Telecommunication 6,675
Telecommunication 7,099 Science & Technology/Aerospace/BioTechnology 6,500
Services 7,034 Consulting (Business/Technical) 5,879
Industry(Central Malaysia)
Senior Management
(Senior Manager)
Industry(Central Malaysia)
Junior Executive (1-4 working experience)
Automotive/Heavy Industry/Machinery 17,438 Chemical 5,215
Computer/IT (Hardware) 17,400 Semiconductor/Wafer Fabrication 3,753
Oil/Gas/Petroleum 16,521 Oil/Gas/Petroleum 3,675
Manufacturing 14,150 Automotive/Heavy Industry/Machinery 3,563
Bank 13,961 Bank 3,475
Industry(Central Malaysia)
Middle Management
(Manager)
Industry(Central Malaysia) Fresh Graduates
Electrical & Electronics 14,091 Semiconductor/Wafer Fabrication 3,280
Semiconductor/Wafer Fabrication 11,183 Oil/Gas/Petroleum 2,775
Oil/Gas/Petroleum 10,504 Science & Technology/Aerospace/BioTechnology 2,500
Science & Technology/Aerospace/BioTechnology 10,175 Computer/IT (Software) 2,450
Wholesale/Retail/Trading 9,959 Bank 2,425
Table 5 : Top Five Paying Industries by Job Category, 2012
Source: Jobstret.com and PIKOM, 2013
20
ICT JOB MARKET OUTLOOK IN MALAYSIA | JUNE 2013
Table 5 shows the top fi ve paying industries for each ICT job category. Of the 25 industries covered in the investigation, the results showed that the Oil, Gas and Petroleum industry dominated the list in all the categories. It is followed by Science & Technology, Aerospace and Bio-technology industry which constituted as one of the top fi ve paying industries for all the job categories, except in the Senior Management level for which the salary remained stagnant between 2011 and 2012.
ICT Industry Segments For the purpose of compiling salary records, Jobstreet.com had categorised the ICT industry segments into ICT hardware, ICT software and ICT-enabled services including call centres.
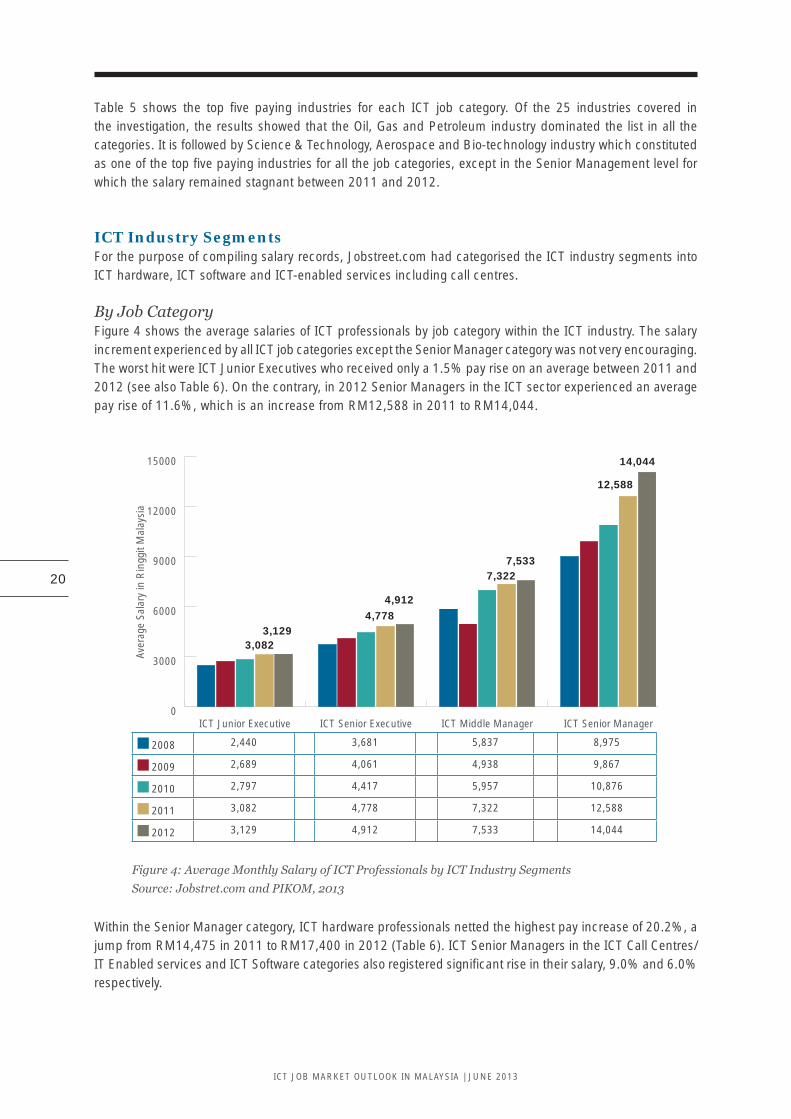
By Job CategoryFigure 4 shows the average salaries of ICT professionals by job category within the ICT industry. The salary increment experienced by all ICT job categories except the Senior Manager category was not very encouraging. The worst hit were ICT Junior Executives who received only a 1.5% pay rise on an average between 2011 and 2012 (see also Table 6). On the contrary, in 2012 Senior Managers in the ICT sector experienced an average pay rise of 11.6%, which is an increase from RM12,588 in 2011 to RM14,044.
0
3000
6000
9000
12000
15000
ICT Senior ManagerICT Middle ManagerICT Senior ExecutiveICT Junior Executive
3,0823,129
4,7784,912
7,3227,533
12,588
14,044
Aver
age
Sala
ry in
Rin
ggit
Mal
aysi
a
2008 2,440 3,681 5,837 8,975
2009 2,689 4,061 4,938 9,867
2010 2,797 4,417 5,957 10,876
2011 3,082 4,778 7,322 12,588
2012 3,129 4,912 7,533 14,044
Figure 4: Average Monthly Salary of ICT Professionals by ICT Industry Segments
Source: Jobstret.com and PIKOM, 2013
Within the Senior Manager category, ICT hardware professionals netted the highest pay increase of 20.2%, a jump from RM14,475 in 2011 to RM17,400 in 2012 (Table 6). ICT Senior Managers in the ICT Call Centres/IT Enabled services and ICT Software categories also registered signifi cant rise in their salary, 9.0% and 6.0% respectively.

21
ICT JOB MARKET OUTLOOK IN MALAYSIA | JUNE 2013
Year
ICT Executive ICT Senior Executive
ICT Hardware
ICT Software
Call Centre/ICT Enabled Services
ICT Industry
ICT Hardware
ICT Software
Call Centre/ICT Enabled Services
ICT Industry
2008 2,325 2,500 2,500 2,440 3,400 3,924 3,749 3,681
2009 2,767 2,557 2,748 2,689 4,130 3,869 4,190 4,061
2010 2,720 2,750 2,925 2,797 4,320 4,505 4,428 4,417
2011 3,002 3,025 3,225 3,082 4,769 5,019 4,556 4,778
2012 3,100 3,063 3,225 3,129 4,835 5,160 4,750 4,912
% change2011-2012 3.3 1.3 0.0 1.5 1.4 2.8 4.3 2.8
Year
ICT Middle Manager ICT Senior Manager
ICT Hardware
ICT Software
Call Centre/ICT Enabled Services
ICT Industry
ICT Hardware
ICT Software
Call Centre/ICT Enabled Services
ICT Industry
2008 5,075 5,995 6,538 5,837 7,971 8,475 10,700 8,975
2009 5,052 5,930 4,018 4,939 9,405 8,998 11,350 9,567
2010 6,625 6,646 7,548 6,957 10,900 9,250 12,758 10,876
2011 6,718 7,263 8,051 7,322 14,475 10,000 13,779 12,588
2012 6,800 7,575 8,300 7,533 17,400 10,600 15,019 14,044
% change2011-2012 1.3 4.3 3.1 2.9 20.2 6.0 9.0 11.6
Table 6: Average Monthly Salary by Job Category and ICT Industry Segment
Source: Jobstret.com and PIKOM, 2013
By ICT User Industries Figure 5 shows the distinction in the average monthly salary earned by ICT professionals working in the ICT Producer and ICT User industries. As in the previous year, there is no distinct difference in salaries earned by ICT professionals in these two segments. The 2012 data revealed that ICT professionals in the Producer industry on the overall earned an average monthly salary of RM6,355, which is marginally higher than their counterparts in the User industry where the average was only RM5,903.
02000400060008000
10000120001400016000
Junior Executive:(1-4 Years Working
Experiance)
Senior Executive:(> 5 Year Working
Experience)
Middle Management:(Manager)
Senior Management: (Senior Manager)
Rin
ggit
Mal
aysi
a
ICT User Industries 13,364 8,519 5,408 3,216
ICT Producer Industries 13,735 9,354 5,437 3,236
Figure 5: Average Monthly Salary of ICT Professionals by Job Category, ICT User Industries and
ICT Producer Industries
Source: Jobstret.com and PIKOM, 2013

22
ICT JOB MARKET OUTLOOK IN MALAYSIA | JUNE 2013
Selected Key ICT Job FunctionsThe average monthly salary earned by key ICT professionals is shown in Table 7. It can be seen from this table that ICT professionals in the managerial category, whether they are Java, HTML, SQL or MCP certifi ed, netted the highest earnings compared to other ICT job functions. IT Project Managers can net an average monthly salary as high as RM17,500, which is almost two times higher than software engineers, who tend to net as high as RM7,917 per month only. As expected, the Senior Software Engineer, on an average, netted RM6,638 per month, which is 50% higher than the earnings of Software Engineers. On an average AutoCAD engineers were paid RM4,783 monthly and the experienced ones can net as high as RM10,000 per month. Being a highly specialized job, the average monthly salary earned by SAP Consultants in 2012 was RM8,542 and the experienced ones netted as high as RM 16,667. Web designers earned the lowest monthly salary, an average of just RM3,692 monthly, among the listed jobs.
Job FunctionsMean
Monthly Salary
Median Monthly Salary
Minimum Monthly Salary
Maximum Monthly Salary
Information Technology, Project Manager (Java, HTML,SQL, Microsoft Certifi ed Professional)
9,700 7,100 4,667 17,500
SAP Consultants 8,542 7,647 3,833 16,667
Information Technology Consultants (Java, HTML and MCP) 7,242 6,967 3,667 13,333
Senior Database/ System Administrators (Microsoft and Cisco Certifi ed) 7,021 6,867 4,250 11,667
Senior Executive Engineer (Java, HTML,SQL, Microsoft Certifi ed Professional (MCP) and Cisco)
6,638 5,973 3,500 11,667
Database/System Administrators (Microsoft and Cisco Certifi ed) 4,783 4,327 2,042 10,000
AutoCAD: Civil Engineering 4,783 3,419 2,167 10,000
Software Engineer (Java, HTML,SQL, Microsoft Certifi ed Professional (MCP) and Cisco)
4,567 2,997 2,417 7,917
Software Developer/Programmer (Java, HTML,SQL) 4,317 3,778 2,417 7,167
Programmer/Analyst (Java, HTML,SQL) 4,288 3,432 2,417 7,000
HTML, Web Designer 3,692 2,773 1,583 6,917
Table 7: Average Monthly Salary of ICT Professionals by Job Function 2012
Source: (http://www.PayScale.com/research/ ) and PIKOM
Years of Working ExperienceTypically one expects the salary of an employee to go up in tandem with the number of years of working experience. As shown in Figure 6, the median salary of those have more than 20 years of working experience earned 5.22 more than those who have less than one year of working experience.
0
2000
4000
6000
8000
10000
12000
20 year or more10-195-91-4Less than 1 Year
1.001.31
2.24
3.39
5.22
Med
ian
Sala
ry (
Rin
ggit
Mal
aysi
a) /
Ben
chm
arki
ng S
cale
Median Salary (RM)
2,244 2,935 5,019 7,616 11,717
Figure 6: Median Monthly Salary of ICT Professionals and Benchmarking Scale by Years of
Experience, 2012
Source: (http://www.PayScale.com/research/ ) and PIKOM

23
ICT JOB MARKET OUTLOOK IN MALAYSIA | JUNE 2013
Employment Size Employment size matters in determining the average monthly salary of employees. As shown in Figure 7, large corporations or multinationals (MNCs) tend to pay higher than smaller ones. Comparing against the smallest sized companies in the 1-9 employees category, which is taken as the baseline, the median salary paid by companies with more than 2,000 employees was 1.88 times more.
010002000300040005000600070008000
More than 2000
600-1999200-59950-19910-491-9
1.00 1.031.27
1.42 1.60
1.88
Med
ian
Sala
ry (
Rin
ggit
Mal
aysi
a) /
Ben
chm
arki
ng S
cale
Median Salary (RM) 3,390 3,493 4,321 4,805 5,426 6,363
Figure 7: Median Monthly Salary of ICT Professionals and Benchmarking Scale by Employment
Size, 2012
Source: (http://www.PayScale.com/research/ ) and PIKOM
Geographical Location As shown in Figure 8, ICT professionals working in Kuala Lumpur and Cyberjaya tend to earn 1.75 times higher than their counter parts working in smaller locations like Ipoh. Even within the Klang Valley, the disparity in the salary is quite distinct, where the average median salary of ICT professionals in Petaling Jaya or Shah Alam tends to be lower than their counterparts in the capital city.
0
1000
2000
3000
4000
5000
6000
IpohKuchingShah AlamJohorePetaling JayaCyberjayaKuala Lumpur
1.75 1.73
1.381.20 1.19 1.03 1.00
Med
ian
Sala
ry (
Rin
ggit
Mal
aysi
a) /
Ben
chm
arki
ng S
cale
Median Salary (RM) 5,092 5,024 4,022 3,499 3,472 2,982 2,906
Figure 8: Average Monthly Salary of ICT Professionals by Geographic Locations, 2011
Source: (http://www.PayScale.com/research/ ) and PIKOM
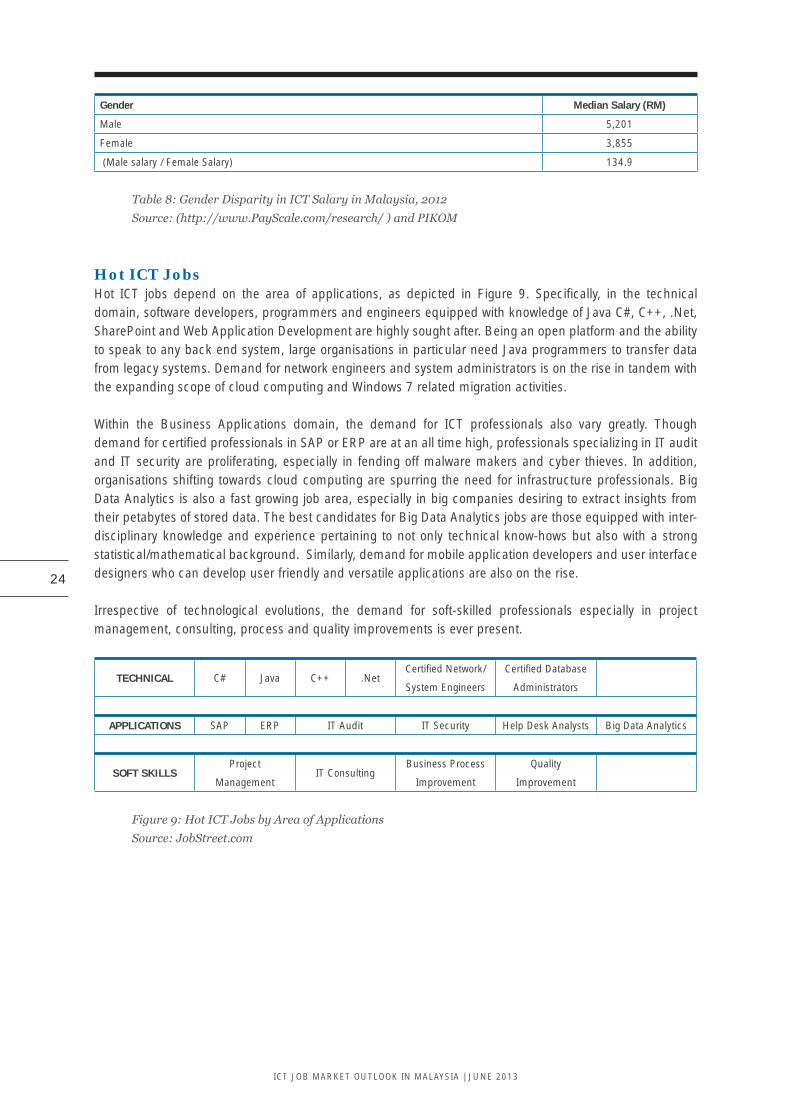
GenderDespite gender equality, the salary data interestingly revealed that male ICT professionals tend to earn a median salary of RM5,201 while females earned a median salary of only RM3,855, which work out to a 35% difference.
24
ICT JOB MARKET OUTLOOK IN MALAYSIA | JUNE 2013
Gender Median Salary (RM)
Male 5,201
Female 3,855
(Male salary / Female Salary) 134.9
Table 8: Gender Disparity in ICT Salary in Malaysia, 2012
Source: (http://www.PayScale.com/research/ ) and PIKOM
Hot ICT Jobs Hot ICT jobs depend on the area of applications, as depicted in Figure 9. Specifi cally, in the technical domain, software developers, programmers and engineers equipped with knowledge of Java C#, C++, .Net, SharePoint and Web Application Development are highly sought after. Being an open platform and the ability to speak to any back end system, large organisations in particular need Java programmers to transfer data from legacy systems. Demand for network engineers and system administrators is on the rise in tandem with the expanding scope of cloud computing and Windows 7 related migration activities.
Within the Business Applications domain, the demand for ICT professionals also vary greatly. Though demand for certifi ed professionals in SAP or ERP are at an all time high, professionals specializing in IT audit and IT security are proliferating, especially in fending off malware makers and cyber thieves. In addition, organisations shifting towards cloud computing are spurring the need for infrastructure professionals. Big Data Analytics is also a fast growing job area, especially in big companies desiring to extract insights from their petabytes of stored data. The best candidates for Big Data Analytics jobs are those equipped with inter-disciplinary knowledge and experience pertaining to not only technical know-hows but also with a strong statistical/mathematical background. Similarly, demand for mobile application developers and user interface designers who can develop user friendly and versatile applications are also on the rise.
Irrespective of technological evolutions, the demand for soft-skilled professionals especially in project management, consulting, process and quality improvements is ever present.
TECHNICAL C# Java C++ .NetCertifi ed Network/
System Engineers
Certifi ed Database
Administrators
APPLICATIONS SAP ERP IT Audit IT Security Help Desk Analysts Big Data Analytics
SOFT SKILLSProject
ManagementIT Consulting
Business Process
Improvement
Quality
Improvement
Figure 9: Hot ICT Jobs by Area of Applications
Source: JobStreet.com

25
ICT JOB MARKET OUTLOOK IN MALAYSIA | JUNE 2013
Regional Benchmarking

26
ICT JOB MARKET OUTLOOK IN MALAYSIA | JUNE 2013
Table 9 shows a comparative analysis of the remuneration earned by ICT professionals in selected Asian and English speaking countries. Here, average remuneration earned by each country is compared against Malaysia, giving rise to a scaling factor that is free from bias caused by foreign exchange fl uctuation. For the purpose of this benchmarking exercise, Malaysia assumes a scaling factor of one. The median data published by PayScale for the year 2012 was used. All measurements are tallied in US dollars. The average value for each country is compiled after taking into consideration three variables, namely IT skills, company size and years of working experience. Two types of benchmarking scales were published, specifi cally one with purchasing power parity (PPP) that takes into account infl ation rates and fl uctuations in the foreign exchange rates and the other without PPP adjustment. Indeed, technically speaking, ambitious job seekers should use PPP adjusted fi gures when searching for overseas jobs.
Comparison Against Asian CountriesWithout any PPP adjustment, the results showed that more advanced Asian economies, in particular Hong Kong and Singapore, recorded average remunerations that were 2.25 to 2.54 times more than the average remuneration earned by Malaysian ICT professionals in 2012 (Table 9). Besides these two countries, China, Thailand and Vietnam offer higher remunerations for ICT professionals, offering 1.87, 1.36 and 1.20 times more than in Malaysia respectively. Comparatively, Indonesia, India and Philippines offer lower remunerations to their ICT professionals. With PPP adjustment, which takes into account for infl ation and foreign exchange rates as well as standard of living, the result showed that Hong Kong still ranked the highest paying nation in Asia for ICT professionals. However, the scaling factor is only 1.90, which is signifi cantly lower than the non-PPP adjusted scaling depicted earlier. Similarly, the scaling factors for Singapore and China lowered to 1.84 and 1.63 respectively. Surprisingly, Vietnam recorded a higher scaling value of 1.87, indicating a much more attractive nation in Asia for talent migration.
Country IT Skil/Speciality
Company Size
Year of Experience
Average Benchmark
ScaleIT Skil/
SpecialityCompany
SizeYear of
ExperienceAverage
Benchmark Scale
Benchmarking Scale: Malaysia=1.00 (Atlias Method)
Benchmarking Scale: Malaysia= 1.00 (Purchasing Power Parity (PPP) Adjusted)
Malaysia 1.00 1.00 1.00 1.00 1.00 1.00 1.00 1.00
Singapore 2.25 2.23 2.31 2.26 1.74 1.72 2.06 1.84
Thailand 1.35 1.49 1.22 1.36 1.45 1.59 1.05 1.36
India 0.50 0.42 0.56 0.49 0.71 0.60 0.68 0.66
China 1.66 2.06 1.89 1.87 1.54 1.91 1.44 1.63
Phillipines 0.15 0.39 0.47 0.44 0.45 0.40 0.46 0.44
Vietnam 1.10 1.10 1.41 1.20 1.61 1.62 2.39 1.87
Hong Kong 254 2.59 2.35 2.53 1.95 2.06 1.69 1.90
Indonesia 0.66 0.73 0.79 0.73 0.57 0.63 0.47 0.56
United Kingdom
2.67 2.41 2.45 2.51 1.38 1.24 1.79 1.47
Canada 3.25 2.96 2.95 3.05 1.57 1.48 2.16 1.72
New Zealand 3.08 2.74 2.75 2.86 1.74 1.55 2.25 1.84
Australia 4.08 3.52 3.59 3.76 1.80 1.60 2.31 1.90
USA 3.43 3.11 3.17 3.24 1.85 1.68 2.70 2.08
Table 9: Benchmarking Salaries Earned by ICT Professionals of Selected Countries and Malaysia,
2012
Source: (http://www.PayScale.com/research/ ) and PIKOM

27
ICT JOB MARKET OUTLOOK IN MALAYSIA | JUNE 2013
Malaysians are typically known to search for better opportunities beyond the shores of Asia. The distant lands that become attractive destinations for Malaysians are mostly English speaking countries, in particular United States of America, United Kingdom, Canada, Australia and New Zealand. Despite the distance, these countries have long diplomatic and trade ties with Malaysia. Moreover, English is a popular lingua franca among Malaysian businesses especially among the private sector and there has been always a natural attraction for Malaysians to do more businesses with such English speaking countries. These destinations are no exceptions for ICT Professionals as well, especially software developers and networking engineers who are in demand at all times globally.
Figure 10 shows that the Australian and USA job markets offer the highest remuneration, 3.76 and 3.24 times more respectively without PPP adjustments than what a typical ICT professional in Malaysia can earn. But, taking into considerations of PPP adjustments, the USA becomes a higher paying destination than Australia, that is, 2.08 and 1.90 times respectively. Without PPP adjustments, Canada with its 3.05 scaling factor also appeared as an attractive destination for ICT jobseekers but the PPP adjusted value reducing to 1.72 suggested otherwise. Similarly, UK’s scaling factor reducing from 2.51 without PPP adjustment to 1.47 PPP adjusted does not suggest it to be a very attractive destination as an ICT job market. Indeed, it can be seen that the cost of living and foreign exchange fl uctuations have signifi cant impact on the salaries earned and thus, becomes a crucial consideration factor for potential job seekers before making any decision on job related migrations.
0.0
0.5
1.0
1.5
2.0
2.5
3.0
3.5
4.0
USA
Aus
tral
ia
Hon
g K
ong
Viet
nam
New
Zeal
and
Sing
apor
e
Can
ada
Chi
na
Uni
ted
Kin
gdom
Thai
land
Mal
aysi
a
Indi
a
Indo
nesi
a
Phi
llipi
nes
0.44
0.44
0.73
0.56
0.490.
661.
001.
36
2.51
1.87
3.05
2.26
2.86
1.20
2.53
3.76
3.24
1.00
1.36 1.
47 1.63 1.
72 1.84 1.
841.
87 1.90
1.90 2.
08
Atlas Method
0.44 0.73 0.49 1.00 1.36 2.51 1.87 3.05 2.26 2.86 1.20 2.53 3.76 3.24
PPP Adjusted
0.44 0.56 0.66 1.00 1.36 1.47 1.63 1.72 1.84 1.84 1.87 1.90 1.90 2.08
Figure 10: Benchmarking Salaries Earned by ICT Professionals in Malaysia and Selected Countries,
2012
Source: (http://www.PayScale.com/research/ ) and PIKOM

28
ICT JOB MARKET OUTLOOK IN MALAYSIA | JUNE 2013
Employment Outlook And Perception

29
ICT JOB MARKET OUTLOOK IN MALAYSIA | JUNE 2013
This report also attempts to present the overall ICT job market outlook from an industry’s perspective and from the perception of potential jobseekers. A total of 227 JobStreet.com clients, managers and senior managers across various industries in Malaysia participated in this survey conducted in February 2013.
JobStreet.com Confi dence Index (JECI)The JobStreet.com Employment Confi dence Index (JECI), which is compiled on a monthly basis, is shown in Table 10. JECI ranges from zero (very poor) to 100 (very good). A low index shows a tough job market situation where employment seekers fi nd it diffi cult to get a job. A high index indicates a comfortable job market, where people are able to secure a good job easily.
As shown in Figure 11, the JECI has signifi cantly dropped from 51.6 in 2011 to 48.8 in 2012, before it shot up slightly in January 2013, indicating increasing confi dence in the local job market.
Month 2013 2012 2011 2010 2009 2008 2007 2006 2005 2004 2003 2002 2001
JAN 49.1 50.5 52.2 47.0 44.9 50.7 52.6 49.6 47.6 41.7 36.2 31.2 42.0
FEB 50.9 52.5 48.7 43.1 49.0 52.7 50.1 47.4 42.3 31.7 31.8 41.5
MAR 50.4 51.2 48.8 43.8 51.8 52.4 49.7 43.3 41.6 34.6 35.7 39.4
APR 48.8 53.2 51.4 46.9 49.7 51.2 50.4 42.8 39.0 31.0 35.2 40.1
MAY 49.7 51.9 51.9 47.8 49.2 50.0 49.9 44.0 39.6 28.7 36.9 37.5
JUN 49.8 53.5 48.1 48.5 48.9 50.1 50.2 41.1 46.4 34.1 35.0 37.5
JUL 41.3 54.1 50.2 49.7 47.9 50.4 47.8 42.0 43.5 32.5 34.7 34.9
AUG 50.9 52.3 51.9 50.2 50.1 48.7 50.1 49.6 45.1 32.7 36.2 32.9
SEPT 48.7 48.8 61.0 48.7 49.6 49.5 50.7 48.6 51.9 34.7 34.0 30.5
OCT 48.8 51.0 53.7 48.3 49.6 48.6 49.6 46.8 49.6 32.9 32.7 32.4
NOV 48.7 49.2 51.6 50.0 47.6 49.3 51.7 47.1 51.3 37.0 34.5 31.2
DEC 48.1 49.4 49.7 50.2 47.3 49.6 51.9 49.0 49.9 36.8 31.6 31.5
Table 10: Job Employment Confi dence Index: January 2001- January 2013
Source: Jobstreet.com
30
40
50
60
2013201220112010200920082007200620052004200320022001
36.134.1
33.6
45.2
45.8
50.1 50.4 49.3
47.7
51.2 51.6
48.8
49.1
JEC
I Ind
ex
Figure 11: Job Employment Confi dence Index: 2001-Jan 2013
Source: Jobstreet.com and PIKOM

30
ICT JOB MARKET OUTLOOK IN MALAYSIA | JUNE 2013
Anticipated Hiring Activities for the next 12 monthAccording to the JobStreet.com Job Outlook Report, the hiring climate is looking positive for the 1st quarter of 2013 (Figure 12).
0
10
20
30
40
50
We're not hiring the forseaable future
Hiring less / Replacing or filling in essential
position only
We're maintaining hiring rate
We're expanding, hence hiring more people
36%
23%18%
1Q2013 1Q2012
25%
42% 43%
4.0%9.0%
Figure 12: Hiring Activities Outlook, 2012
Source: Jobstreet.com
Hiring Prospects: For the First Quarter (Q1) of 2013, Malaysian employers have a brighter job outlook for their hiring initiatives. 36% of the respondents are expecting to increase their hiring in the next 12 months. Less than 5% of respondents acknowledged that they would not be hiring in the foreseeable future, a 5-point drop from the 9% in 2012, which indirectly refl ects a positive job outlook for Q1 of 2013.
Among the 36% who indicated they were expanding, the new hiring is to be mainly in the areas of sales, marketing, accounting/fi nance, and manufacturing.
To gauge the overall job hiring sentiments in terms of annual trends, PIKOM used the Job Hiring Index Score (JHIS) procedure as outlined in the Box below. The result is shown in Figure 13. The JHIS revealed that the index came down to 2.62 in 2012 from 2.69 in 2011. However, the overall job hiring sentiment is shown to be picking up for the year 2013, which is likely given the positive economic outlook.
For comparing the job hiring sentiments over the years, PIKOM calculated a Job Hiring Index
Score (JHIS) using the following procedure:
I=∑ fi W
i / ∑ f
i
In the formula above, “f” denotes the frequency expressed as percentage of responses netted or
implicitly weighted, as such, ∑ fi =1; “W” denotes the values assigned for each response category
and “i” denotes the industry. The values assumed for the various categories of responses were, as
follows:-
4 for “We’re expanding and hence hiring more people”;
3 for “We’re maintaining our hiring rate this year”
2 for “Hiring less, replace / fi ll essential positions only”;
1 for “We’re not hiring in the foreseeable future”
As such, the expected or implicitly weighted average for JHIS value will be 2.5; the average for the
best case scenario where all the respondents indicate “much better” will be 4; similarly, the expected
average for the worst case scenario, where all the responses indicative of “much worse”, would be
1.
Source: PIKOM

31
ICT JOB MARKET OUTLOOK IN MALAYSIA | JUNE 2013
2.50
2.55
2.60
2.65
2.70
2.75
2.80
2.85
2.90
Q1:2013Q1:2012Q1:2011Q1:2010
2.62
JHIS 2.69
2.62
2.86
JHIS 2.62 2.69 2.62 2.86
Figure 13: Job Hiring Index Score 2010-2013
Source: PIKOM
Top Specializations SoughtAs refl ected in Table 11, for most industries jobseekers in sales and marketing are still the most sought after, followed by those with expertise in manufacturing, accounting and engineering. In comparison with the last quarter, three new specializations have entered the top 10 list. They are manufacturing, engineering, and mechanical engineering. Respondents from major industries such as hotel & restaurants, fi nance computer and IT, mining (oil & gas) reported that they would most likely experience a better job growth in the next 12 month.
Top 10 specializations employers seek
1Q 2013 4Q 2012
1 1 Sales
2 2 Marketing
3 (new) − Manufacturing
4 8 Accounting
5(new) − Engineering (Others)
6 6 Engineering (Electrical)
7(new) − Engineering (Mechanical)
8 7 Human Resources
9 9 General Administration
10 4 Customer Service
Table 11: Top 10 Specializations Employers Seek, 2012 -2013
As mapped out in Table 12, the top specializations employers seek has changed over the past fi ve years. Sales, marketing and business development jobs are consistently ranked among the top most sought after jobs. Interestingly Computer & IT (Software), which ranked either third or fourth positions from 2009 to 2012, did not get into the top ten specializations employers seek for the year 2013. On the contrary, manufacturing, mechanical engineering and other engineering jobs drew attention of potential employers. Customer service category is also seen sliding down the top ten.

32
ICT JOB MARKET OUTLOOK IN MALAYSIA | JUNE 2013
2013 2012 2011 2010 2009
Sales Marketing and business development
Marketing and business development
Marketing and business development
Marketing and business development
Marketing and business development
Sales / Marketing (merchandising)
Sales / Marketing (merchandising)
Sales / Marketing (merchandising)
Sales / Marketing (merchandising)
Manufacturing Customer Service Computer & IT (Software)
Customer Service Computer & IT (Software)
Accounting Computer & IT (Software)
Customer Service Computer & IT (Software)
Engineering Mechanical
Engineering (Others) Engineering Mechanical Human Resources Engineering Mechanical Sales / Marketing (technical)
Engineering (Electrical) Human Resources Top Management Human Resources Customer Service
Engineering (Mechanical)
General / Cost Accounting
Sales / Marketing (technical)
Sales / Marketing (technical)
Human Resources
Human Resources Sales / Marketing (technical)
General / Cost Accounting
General / Cost Accounting
General / Cost Accounting
General Administration Maintenance Computer & IT (Hardware)
Top Management
Customer Service Engineering Electrical Education, Training & Development
Clerical / General Administration
Top Management
Table 12:Top Specializations Sought Trend: 2009-2013
Position Level SoughtAccording to respondents, 52% are looking for junior level positions which require less than 4 years of experience followed by 24% who are looking at people with specialised skills, such as accountants and engineers (Figure 14). Only 13% of the respondents are looking for fresh graduates. Human resource managers in many industries expressed diffi culties in hiring fresh graduates as many candidates without working experiences are demanding a high salary. Managerial levels and above might be experiencing a more diffi cult period as only 11% of the respondents are looking to fi ll such positions.
0% 10% 20% 30% 40% 50% 60%
Top Management (President, CEO,GM)
Director / Vice President
Manager / Assistant Manager
Supervisor / Specialist
Junior level (less than 4 years experiance)
Fresh graduate 13%
52%
24%
11%
0.9%
Figure 14: Job Positions Sought After in 2013
33
ICT JOB MARKET OUTLOOK IN MALAYSIA | JUNE 2013
Rethinking HR in a Changing World:A Practitioner’s Discourse BY WOON TAI HAI, EXECUTIVE DIRECTOR, KPMG MALAYSIA

34
ICT JOB MARKET OUTLOOK IN MALAYSIA | JUNE 2013
IntroductionIn the last 5 years, there has been a preoccupation with cost optimisation, cost reduction, sustainable cost management... all things ‘cost’. This has required HR to play its part, largely through making the HR function more effi cient, but not necessarily more effective.
No one expects this focus on costs to change in the short to medium term.
But there is a clear case for HR functions to also generate value in the wider business and that there are some signs that this drive for value creation from HR will become increasingly important.
The “big three” challenges to HR’s new growth agendaThe people agenda in most organisations contains some truly business-critical issues and the need for HR to rise to the “big three” challenges has never been more acute. The “big three” challenges to HR’s new growth agenda are:
balancing the global and the local 1. – managing, hiring and identifying talent globally while retaining important local insightsmanaging a fl exible and virtual workforce 2. – but not at the cost of loyalty and career developmentretaining the best talent 3. – maintaining employee engagement in the face of a less committed, more fl exible workforce.
These “big three” challenges and other key fi ndings were derived from a global study by the Economist Intelligence Unit between May & June 2012, commissioned by KPMG International. The Global study of 418 executives comprised with more than one-third (37 percent) of respondents who identifi ed themselves as C-level executives; with the remainder being at the management level up to senior vice-president. More than one-half of respondents (58 percent) primarily serve an HR function; the remainder (42 percent) represents a wide range of other functions.
The respondents are based in Asia-Pacifi c (32 percent), Europe (30 percent), North America (28 percent) and Latin America (10 percent). A wide range of industries is represented, including manufacturing and energy & natural resources (both at 12 percent), IT, fi nancial services, and healthcare & pharmaceuticals (all at 11 percent). More than one-half of the companies surveyed (53 percent) boast more than 10,000 employees – 22 percent have over 50,000; the remaining 47 percent have between 1,000 and 10,000 employees.
The global study, aptly entitled, “Rethinking Human Resources in a Changing World” examines the nature of the challenges facing the HR function and its future direction. The report’s main fi ndings include the following:
HR is struggling with the challenges of managing a global, fl exible workforce.• The global workforce has become increasingly integrated across borders while simultaneously growing more virtual and fl exible. These developments have made the retention of key talent and building workforces in new markets the top priorities of HR departments over the last 3 years. Survey respondents expect little change in the next 3 years. Yet only about one in four respondents say that HR at their company excels at core issues such

35
ICT JOB MARKET OUTLOOK IN MALAYSIA | JUNE 2013
as sourcing and retaining key talent globally; supporting a virtual and fl exible workforce; and supporting the greater globalisation of the business.
Finding ways to engage with workers will help address • the challenges of this global, fl exible and remote workforce. Insights from interviewees for this study point toward improved employee engagement as the way to address many of these problems. This will involve creative solutions, such as the development of HR policies and approaches that have global application but can be made relevant to local conditions. It will also require new ways to engage meaningfully with a workforce that is less committed to the organisation.
Technology has already transformed HR and the application of data analytics will foster even more • profound change. Sixty-nine percent of companies surveyed say it is more common for the HR function to provide web-based and/or mobile HR platforms (e.g. benefi ts, payroll) than it was 3 years ago; only 3 percent of respondents have cut back on these technology enhancements. These have already enabled HR to do its basic, administrative work faster and more effi ciently. They have also provided employees with more fl exible and tailored training opportunities while creating a positive culture for communication.
Technology with the power to transform HRThe advent of data analytics – the most commonly cited area by respondents for IT investment in the next 3 years – will lead to the next technological quantum leap for HR. Interviewees explain that the application of analytics, if done properly, will enable a more robust understanding of employee-related needs and opportunities. For example, already 57 percent of respondents say that data analytics is helping to identify future talent gaps.
Powerful technologies, emerging in times of heightened fi nancial constraints, present a rare opportunity for HR to enact long-overdue reinvention. Looking ahead, HR needs to:
–– develop greater confi dence, leadership and credibility, so that HR heads can deservedly insist on a place in strategic conversations at the highest levels
–– develop closer partnerships within the company, especially with line managers who will inevitably use technology-driven HR services to play a greater role in employee management
–– recast its strategy so that it begins from a whole-business perspective and is aligned with the needs of the entire company, not just the HR function.
Sixty-nine percent of survey respondents say that in the last 3 years, their companies have increased the use of mobile or web-based platforms. Nearly half (49 percent) are making greater use of the cloud to power these. Web-based and mobile apps have enabled many employees to handle their own HR services, including benefi ts, payroll and performance evaluations. The shift to mobile and web-based platforms has not always been easy, though. Yet the advantages of the HR self-service function are undeniable. Some of the advantages include:
TIM PYNE KPMG HR Transformation Center of Excellence
I believe... talent management should be the
top priority for HR, but business leaders
don’t feel that HR is delivering for them. I
believe that is because talent management is
so often anchored in the present rather than
focusing on the unique roles, capabilities
and skills the organisation needs to suceed
in the future.
36
ICT JOB MARKET OUTLOOK IN MALAYSIA | JUNE 2013
Doing the basics better and more effi ciently – Moving toward a more self-service model has improved basic HR service effi ciency while freeing up HR to focus on delivering more strategic services that add value to the core priorities of the business.
Better training – Moving away from classroom training toward a more interactive, demonstrative approach. This has been a very positive development and had a very powerful impact. It enables employees to learn in more bite-sized chunks and in a much more visual manner.
Creating a positive culture and brand for current employees and potential hires – New technologies are playing an important role in how we connect people in the organisation and how we create a culture that is a medium for people. Organisations are exploring how to use technology to create a company brand that is attractive to people joining it.
The next step: data-driven HRData analytics is the most commonly cited area (selected by 31 percent of respondents) for planned HR technology investment in the next 3 years. Analytics will allow HR to not only be involved in managing talent, but to also collect clearer information on its supply chain of talent and where the most demand for particular skills lies. Rather than acting on instinct alone, the HR function will be able to provide a far more granular roadmap of how the organisation’s people resources need to be reshaped to deliver on the corporate strategy.
Data analytics gives HR departments the long-overdue chance to become more empirical, to provide hard evidence for their opinions, thereby gaining much-needed credibility at the highest levels of the business. Kate Terrell, vice president, Human Resources, Global Products Organisation, at Whirlpool Corporation, a household appliance manufacturer, explains: “When you arm a business partner of the future with analytics, and they can share the facts with their teams to help drive better decision-making, it allows you to be much more strategic, much more insightful, and potentially, much more laser-focused on where you should be spending your time.
The future of HR: Eradicating the stigmaIt is practically a business truism that the HR function is not well respected at many organisations. Whether deserved or not, this stigma is clearly evident in the global survey results.
Only 15 percent of our survey respondents see HR as able to provide insightful and predictive workforce • analytics. Only 17 percent view it as able to demonstrate measurably its value to the business.•
Strikingly though, 81 percent of respondents see talent management as a key competitive advantage over the coming 3 years. There clearly remains a vast gulf between the perceived importance and the perceived effectiveness of HR today. At the very least, HR has a perception problem. In many cases it may have actually failed to deliver real value. As the shifting challenges of globalisation and virtualization combine with the new technological tools available to enable a reshaping of the HR function, executives should take
ROBERT BURTON KPMG HR Transformation Center of Excellence
I believe... that HR functions have tried for
the past 15 years to tranform themselves
into strategic players and earn a place
at the leadership table. But they’ve done
so with limited success because they have
focused on rolling out generic HR models
and universal best pratice, rather than
customized solutions that support the value
drivers of the business. Now they’ve caught
in what I call the “doom loop”.

37
ICT JOB MARKET OUTLOOK IN MALAYSIA | JUNE 2013
a number of steps to improve the function’s contribution and its image.
Make the value of HR more prominent and understoodPerceptions about HR in the wider company may arise from the very nature of its role. As the HR function works behind the scenes, many in the organisation may not be aware of the good things that it is doing. “This is an inevitable part of being a staff support role where HR is the architect and the line managers are owners of the work,” says Professor Ulrich.
HR practitioners need to make sure the company knows and understands the value they can deliver, in part by insisting on being included in strategic conversations. It also involves understanding the needs of the whole business better in order to make that contribution. Learning to listen deeply is one of the skills that HR functions need to develop, not only in terms of the context of their role but in terms of continually improving the organisation.
Think, understand and communicate in the language of businessHR needs to eliminate the jargon of its specialization (the same challenge IT continues to face) and begin to link its work more explicitly to business value. The right business language helps to open the door, but it is also important to provide a robust business case for projects. It entails thinking more carefully about the specifi c business outcomes of the actions that HR recommends. What is the impact on customer service, or the reduction in costs, or the increase in staff loyalty, or other metrics that are more specifi cally relevant to the line managers and departments being supported? Importantly, it is also about taking a fuller perspective of the whole business, including both internal factors as well as external business conditions, and creating HR strategies to fi t. In turn, this requires a far deeper grasp of the organisation’s core business model and strategy and the implications this holds for the rest of the business – to date, something that far too few HR practitioners have mastered. To put this in context, a business that fundamentally focuses on providing low-cost goods will require a fundamentally different HR strategy than one that is focused on delivering leading-edge innovation.
Move from administration to higher-value-added activitiesA technology-enabled HR function will allow professionals to avoid being immersed in the minutiae of record-keeping, transactions and life-cycle processes. But it will also likely reduce the number of HR staff that companies require. These slimmed-down departments will then be able to focus on providing more strategic, higher-order services.
Some of HR’s traditional administrative work will almost inevitably fi nd another functional home, a shift that 45 percent of respondents expect to occur in the next 3 years. There is no compelling reason for HR to manage the transactional administration of payroll, benefi ts, pensions or mobility (transfer administration), particularly where managed on a contractual outsourcing basis. Of course, HR would remain the architect of these systems. But once the desired model is established, there is no reason why HR needs to pedal the wheels.
PAULETTE WELSING KPMG HR Transformation Center of Excellence
I believe... well thought-out predictive workforce
analytics could become as important to the
CEO as the blalance sheet and P&L statement.
Technology and workforce analytics could
really shake up HR as we currently know it.

38
ICT JOB MARKET OUTLOOK IN MALAYSIA | JUNE 2013
ConclusionRethinking Human Resources in a Changing World has provided us with a fresh view of the path ahead for leaders of the HR function. We believe that a number of areas such as workforce analytics, talent management and technology will reinforce the need for HR to make the people agenda as important to business leaders as the balance sheet and P&L statement.
Many of the challenges identifi ed in the global study are long standing. But they are no less urgent for that. Indeed, there is no escaping the prospect of a shrinking and weakened HR function in the coming years. Quite simply, HR has to break out of the trap it has been stuck in for far too long.
Unfortunately, there are no simple solutions, no generic approaches or best practices that will suddenly enable the HR function to become more effective and respected. HR needs to focus on delivering unique talent solutions tailored to each company’s circumstances and requirements.
To do this, HR must develop a deep understanding of the business – in the same way, and using the same “language”, as other managers. The measures it proposes must be tied to business outcomes: the impact on customer service, the reduction in costs, the support of a specifi c new growth area, the increase in staff loyalty and so on.
While communication has a role to play, particularly when it comes to managing expectations – after all, HR needs time to do its work – the required antidote is a relentless focus on identifying ways of adding value to the rest of the business, and proactively meeting the needs of HR’s customers.
For many HR functions, data analytics is an ingredient that has long been missing, for example, it is a way of providing hard evidence about employee-related needs and opportunities and the impact of HR. The insights that can be gleaned from rigorously collecting and analyzing data, and creating insightful forecasts on the back of it, is a key tool in enabling HR to shape the organisation’s people resources to deliver on its underlying corporate strategy.
But this is not just about employing the latest technologies or tools. It is about the HR function using an empirical approach to deliver a unique and differentiated people management strategy that is closely aligned with the company’s goals – and in the process of doing so, restoring HR’s much-needed credibility at the highest levels of the business.
This study suggests that HR perceives its biggest current challenge to be seizing the opportunity to transform itself into a strategic player.
AcknowledgementsThe above article was a reproduction from a global study by the Economist Intelligence Unit between May & June 2012, commissioned by KPMG International.

39
ICT JOB MARKET OUTLOOK IN MALAYSIA | JUNE 2013
The Right Talent Development Strategy for Top Talents? BY KEN LEE, DIRECTOR, KPMG MALAYSIA

40
ICT JOB MARKET OUTLOOK IN MALAYSIA | JUNE 2013
IntroductionYour organisation is unique, and so is the mix of talent you need to deliver your business strategy. Why, then, do so many organisations continue to take a generic ‘best practice’ approach to one of their most important strategic levers: how best to develop their top talents? Do you develop your top talents the same way as you develop the broader employee population? Or should you take a unique and “out-of-the-box” approach?
After all, how well an organisation develops its talent can make or break its business. Developed well, and the organisation will be singing in harmony. But developing talents poorly – and things soon start going off key.
Your talent strategy for your organisation – depends largely on how well you’re able to develop your top talents differently so that you will continue to win in your markets. What follows are several ideas to help guide you through this process and fi nd a compelling approach on “How best to develop your top talents with the right talent development strategy”.
Who are your Top talents and why are they different from everybody else?Since the publication of McKinsey’s seminal study on “War for Talent” in 1998, many organisations to take the stand that managing talents is similar to managing their human capital. This view has evolved over time. “Talents” have been “studied”,” assessed” and “measured” countless times and approaches and defi nitions for talent spotting are many. What remains clear is that views on“potential” is somewhat a generally acceptable word associated to talent.
One approach to identify top talent is based on their performance and potential.
On assessing performance, a typical approach is to look at performance ratings and the track record of consistently delivering high performance. When it comes to assessing potential, it is It is universally recognized that potential is a diffi cult thing to objectively assess. Nevertheless historical performance alone is not enough to predict future success. Some of the valuable prompts used to assess potential include key questions related to ambition, ability, and engagement.
Two sets of illustrative components used to assess talents are:
VALUE
Performance
PerformanceManagement Process
Potential
Talent ManagementProcess
TRACK RECORD ABILITY AMBITION ENGAGEMENT+ + + +
For each of these criteria above, organisations (traditionally HR practitioners) will need to support the business by asking further questions and by pushing them to provide specifi c examples.
Your top talents are those quality people who are your next generation of leaders, critically important to the future success of your business. They are also known as the “Emerging Leaders” a term used to explain the strategic importance of leaders who are committed to role modeling, coaching and inspiring others to be
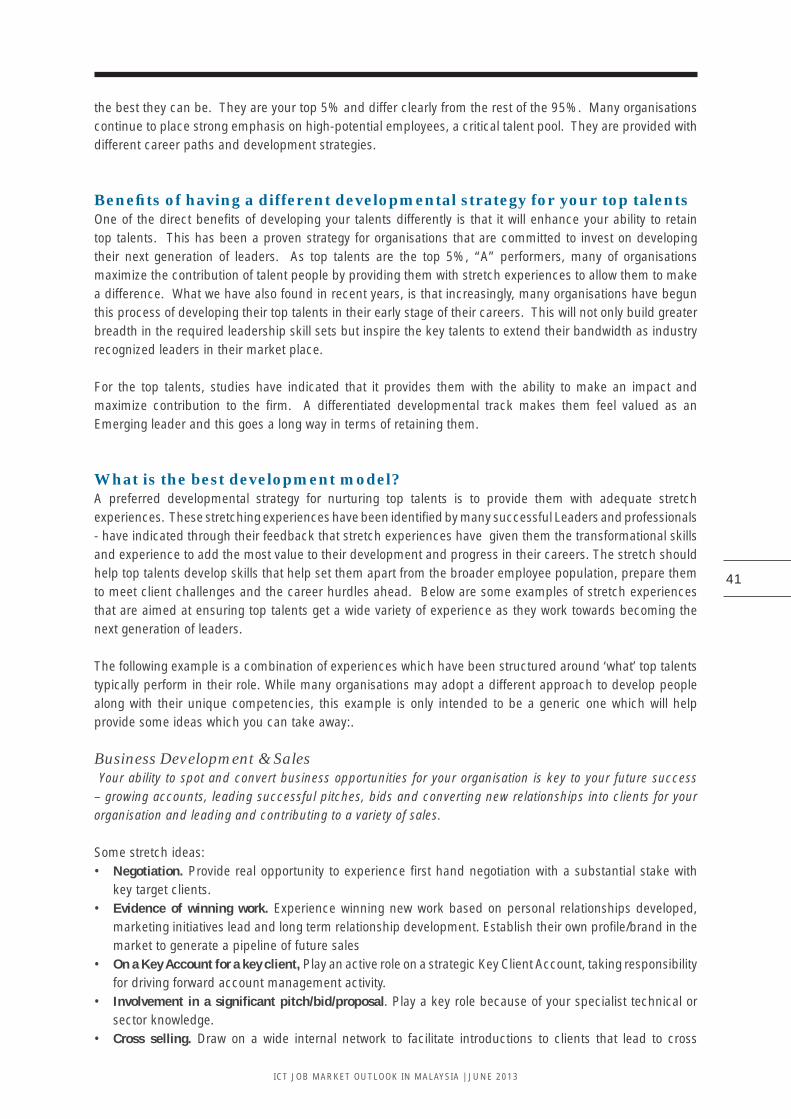
41
ICT JOB MARKET OUTLOOK IN MALAYSIA | JUNE 2013
the best they can be. They are your top 5% and differ clearly from the rest of the 95%. Many organisations continue to place strong emphasis on high-potential employees, a critical talent pool. They are provided with different career paths and development strategies.
Benefi ts of having a different developmental strategy for your top talentsOne of the direct benefi ts of developing your talents differently is that it will enhance your ability to retain top talents. This has been a proven strategy for organisations that are committed to invest on developing their next generation of leaders. As top talents are the top 5%, “A” performers, many of organisations maximize the contribution of talent people by providing them with stretch experiences to allow them to make a difference. What we have also found in recent years, is that increasingly, many organisations have begun this process of developing their top talents in their early stage of their careers. This will not only build greater breadth in the required leadership skill sets but inspire the key talents to extend their bandwidth as industry recognized leaders in their market place.
For the top talents, studies have indicated that it provides them with the ability to make an impact and maximize contribution to the fi rm. A differentiated developmental track makes them feel valued as an Emerging leader and this goes a long way in terms of retaining them.
What is the best development model?A preferred developmental strategy for nurturing top talents is to provide them with adequate stretch experiences. These stretching experiences have been identifi ed by many successful Leaders and professionals - have indicated through their feedback that stretch experiences have given them the transformational skills and experience to add the most value to their development and progress in their careers. The stretch should help top talents develop skills that help set them apart from the broader employee population, prepare them to meet client challenges and the career hurdles ahead. Below are some examples of stretch experiences that are aimed at ensuring top talents get a wide variety of experience as they work towards becoming the next generation of leaders.
The following example is a combination of experiences which have been structured around ‘what’ top talents typically perform in their role. While many organisations may adopt a different approach to develop people along with their unique competencies, this example is only intended to be a generic one which will help provide some ideas which you can take away:.
Business Development & Sales Your ability to spot and convert business opportunities for your organisation is key to your future success – growing accounts, leading successful pitches, bids and converting new relationships into clients for your organisation and leading and contributing to a variety of sales.
Some stretch ideas:Negotiation.• Provide real opportunity to experience fi rst hand negotiation with a substantial stake with key target clients. Evidence of winning work.• Experience winning new work based on personal relationships developed, marketing initiatives lead and long term relationship development. Establish their own profi le/brand in the market to generate a pipeline of future salesOn a Key Account for a key client,• Play an active role on a strategic Key Client Account, taking responsibility for driving forward account management activity. Involvement in a signifi cant pitch/bid/proposal• . Play a key role because of your specialist technical or sector knowledge. Cross selling.• Draw on a wide internal network to facilitate introductions to clients that lead to cross

42
ICT JOB MARKET OUTLOOK IN MALAYSIA | JUNE 2013
function sales or invitations to tender, beyond the initial scope of the work. Maintained and invested in developing relationships with clients Evidence of leading a major pitch. • Lead a complex, high value and/or highly competitive major pitch with minimal support from Leadership, resulting in a win or positive client feedback and strong sustainable relationships. Develop a new business area, • value proposition or marketing approach. Personally responsible for a change in the go to market approach in their area, shaping a new proposition, taking it to market in an innovative way, packaging offering in a different way – that has resulted in new leads and wins for your organisation.
Managing & Leading PeopleAs we work with people, our leader’s skills in both managing and leading teams are critical. A wide variety of responsibilities are crucial, ensuring you are able to manage, and most importantly to inspire and engage our people to create a high performance culture.
Some stretch ideas:Manage complex and/or multiple teams and projects. • Manage, across a number of complicated projects or workstreams, teams and the use of internal experts, as well as maintaining direct and senior communication with key stakeholders. Has been responsible for building team morale, evaluating performance and resolving diffi cult situations with the team or client. Lead a multi-national and/or virtual team. • Lead a large or complex team with members from different countries, integrating different cultures, expectations and delivery styles, making use of the latest technology and communication tools to effectively meet the client’s needs. Leads cross functional teams. • Responsible for client delivery teams from across functions, responsible for identifying and recruiting the necessary internal expertise, managing confl icting priorities and delivery approaches to deliver a seamless and top quality service to the client. Mentoring.• Assume a mentoring role for people in a different part of the business Delivers training or acts as a Development Centre observer.• Co-delivers training on non technical areas to junior colleagues or observes Development or Assessment Centres for Managers or Senior Managers Strategy and communication.• Supports the Firm’s and/or their function’s strategy, by facilitating ‘Engagement’ or ’Cascade’ sessions or senior level business planning meetings. Team growth and recruitment. • Contributes to longer term resource planning discussions and acts as the fi nal, deciding interviewer in graduate or experienced hire recruitment.
Leading Client DeliveryBeing able to demonstrate excellence in a variety of client delivery scenarios is essential for your reputation and your organisation.
Some stretch ideas:Signifi cant responsibility for profi tability & fi nancial performance. • Has a client portfolio of a size expected by country and function. Is responsible for, or contributes to, team fi nancial performance of sizable client portfoliosAdvise a client through a crisis. • Play a primary role in guiding a client through a crisis or major change, eg acquisition, PR crisis or major restructure programme. Leads large or complex accounts. • Responsible for leading delivery teams on large and/or complex accounts, being accountable for the deliverable, whilst also being responsible for client management (stakeholder management, communication, etc) and team management (workfl ow management, team and individual performance, etc). Resource planning. • Act as, or advise, the resource planner for a department, balancing confl icting priorities and stakeholders within tight limitations.

43
ICT JOB MARKET OUTLOOK IN MALAYSIA | JUNE 2013
Innovation. • Apply innovative approaches & skills to work, which has added value and been well received by the client, eg through delivery methods, account or project management, project outcome, communication etc.
Cross-Function Experience & Mobility Gaining experience in other functions, countries and organisations helps you to spot opportunities to add value to your clients, to operate with a one organisation mindset and to develop broad networks. Immersing yourself in another area of our business, or with a client, gains a depth of knowledge, experience and networks that can’t be gained through research and conversations.
Some stretch ideas:Time in another function. • Spend 6 months or more in another function at Manager level or above, delivering work not directly aligned to original skill set. Time on international assignment. • Spend 12 months or more on secondment to another country (preferably at a senior grade and to a strategic or culturally different location). Strategic project. • Take on signifi cant responsibility on a project of strategic importance for the organisation, eg off shoring or restructuring. Relocation. • Relocate to other offi ces or functions permanently, or long term, at a senior level, building a new network and client base. ‘Out of the box’ secondment. • Complete an approved “out of the box” experience, which meets the following criteria: Secondment to: a client, Project support to one of the core Enabling Projects, Executive Assistant to a member of the Board or Executive, or Government departments, a Regulatory Body or Industry Body, a non-government organisation etc.
The Corporate Executive Board through its Learning & Development Roundtable approach, designed a portfolio of skills and work experiences top talents need for future leadership roles. At the core of this approach is “high impact development activities”. These development activities are aimed at creating the greatest impact on performance. Some of these activities include:
Stretch & challenge : Career advancing job assignments, challenging work situations that push one beyond his/her comfort zone
Connecting to other key Leaders: work with different, “diffi cult” and “demanding” leaders. Learn from them
Obtain feedback: Ask direct reports to provide feedback on your greatest strengths and areas for improvement, serve as a sounding board for diffi cult challenges
Practice a new skill: Learn a new skill , practice it & obtain feedback

44
ICT JOB MARKET OUTLOOK IN MALAYSIA | JUNE 2013
Closing the Demand-Supply Gap in ICT Talents BY ASSISTANT PROF. DR. HO CHUK FONG & ASSISTANT PROF. DR. VEE VOON YEE,UNIVERSITY MALAYSIA OF COMPUTER SCIENCE & ENGINEERING (UNIMY)

45
ICT JOB MARKET OUTLOOK IN MALAYSIA | JUNE 2013
Malaysia is facing a shortage of talents in Information and Communication Technologies (ICT) industries, Deputy Education Minister Datuk Dr Wee Ka Siong said in 2011. The shortage in human capital has been the perennial bug bear of the ICT industry, with some efforts to address the issue falling short of expectations and others, even worse, falling by the wayside.
This shortfall in the supply of ICT talents has obvious and serious implications on Malaysia’s hopes of becoming an innovation-led economy and digital nation. After all, the ICT industry is seen as a critical agent of change for national transformation, contributing almost 10% to GDP as reported by Datuk Badlisham Ghazali, the CEO of Multimedia Development Corporation (MDeC) at the MOSTI-PIKOM Leadership Summit 2012. Additionally, ICT contributes in raising productivity and output in other industries as well as the government machinery and public domain.
As we head into a future of increasing digital assimilation and global integration, solving this conundrum remains arguably our most urgent imperative if the nation is to keep pace with the developed world and other fast-emerging economies.
A long-standing problem in quantity and qualityIt is fair to say that the gap in home-grown ICT professionals opened up the very same day we launched the Multimedia Super Corridor. MSC Malaysia marked our entry into the software and services segments of the ICT industry, in the process, complementing and supporting the existing manufacturing sub-sector for computer hardware.
In response, Institutes of Higher Learning (IHLs) began introducing new courses in computer and ICT studies, followed in due time by the establishment of full-blown ICT faculties. The idea was to provide an assembly line of graduates who could fi ll vacancies that were opening up in multinational corporations as well as locally-incorporated small and medium-sized ICT vendors.
However, many of the graduates have not been meeting the requirements of the industries. This has mainly been due to the lack of relevant and practical computing knowledge among graduates. This setback was
further compounded by the somewhat unbalanced emphasis within the tertiary education curricula on information technology rather than the more durable discipline of computer science and software engineering. Many information technology graduates were unable to secure their preferred jobs, eventually leading to frustration and a sense of disillusionment that damaged the appeal of ICT programmes among new undergraduates.
Over time, the divide between the supply and demand of ICT talents became not only a quantitative, but also a qualitative one. Recently, the Ministry of Higher Education (MoHE) revealed that the ICT industry would need an estimated 22,000 professionals by 2020 while also noting that the existing IHLs in the country could only supply some 10,000 in the preceding years.

46
ICT JOB MARKET OUTLOOK IN MALAYSIA | JUNE 2013
It was clear that the status quo would not be in a position to meet this requirement. It is for this reason that the Government had no hesitation to award a full-fl edged university licence to Prestariang Berhad.
A new boutique university for computer studiesKnown as a solutions provider in ICT training, Prestariang launched the University Malaysia of Computer Science & Engineering (UniMy) early this year. It is viewed as the nation’s fi rst boutique university focusing on the fundamentals of computer studies rather than the more transient knowledge and skills of other information technology related disciplines.
This is refl ected in the disciplines it offers, which is built around the following three strategic computer domains:• Computer Engineering• Computer Science• Software Engineering
The university is on track to receive its fi rst batch of students in July and has targeted a maximum enrolment of 600 for 2013 for both its foundation and undergraduate programmes. Another feature that sets UniMy apart from other IHLs is its unique ‘1+3+1’ programme, which comprises a year for Foundation studies, three years for the undergraduate studies and one year for Master’s studies. A three-year PhD programme is also available.
In order to improve the marketability and employability of UniMy graduates, UniMy has incorporated several elements into its undergraduate programmes. First, the syllabus conforms to standards of the Association for Computing Machinery (ACM) and Institute of Electrical and Electronics Engineers (IEEE) Software Engineering Body of Knowledge (SWEBOK). Second, the programmes will be audited yearly by Melbourne School of Engineering at The University of Melbourne, the top university in Australia, to ensure its integrity, sustainability and relevance.
UniMy also offers 13 professional certifi cation courses to students where they are allowed to choose any four according to their preferences. Upon completion, these certifi cates will be issued by international professional bodies including Microsoft, ORACLE, EC-Council, CompTIA and Adobe. Besides, to ensure that its graduates are equipped with the knowledge and skills sets matching those the industry needs, all students have to undergo a six-month industrial attachment with UniMy’s global partners including Microsoft, IBM, Huawei, Dell, Autodesk and EC-Council plus local agencies Multimedia Development Corporation (MDeC), Cyberview Sdn Bhd, Kumpulan Modal Perdana and NanoMalaysia.
Already, the response from industry players has been encouraging. It is likely that they perceive UniMy as the potential solution to an old and growing problem. Many have agreed to adopt and absorb students through training placements, raising the prospect of guaranteed employment for these graduates.
As we head towards 2020, the gap between the demand and supply of ICT talents remains considerable. But at least we now have a light at the end of the tunnel.


Persatuan Industri Komputer Multimedia Malaysia(The National ICT Association of Malaysia)
1106 & 1107, Block B, Phileo Damansara IINo.15, Jalan 16/11, 46350 Petaling JayaSelangor Darul EhsanT +: (603) 7955 2922F +: (603) 7955 2933E+: [email protected]+: www.pikom.org.my
PIKOM, the National ICT Association of Malaysia, is a not-for-profit organisation. It is the largest association representing
information and communications technology (ICT) players in Malaysia. Since its inception in 1986, PIKOM has come of
its age as the voice of ICT industry. It has become an ICT referral centre for government and industry players, as well as
international organisations. In this regard, PIKOM takes on the responsibility to publish ICT-relevant information in a
periodic manner.
Design, production and printing by: MJLAIKC INFOWORKS | Tel: 6012 5050862 | E: [email protected]