ibisworld industry report 23411b road & highway ... road & highway maintenance in the us...
TRANSCRIPT
WWW.IBISWORLD.COM Road & Highway Maintenance in the US October 2013 1
IBISWorld Industry Report 23411bRoad & Highway Maintenance in the USOctober 2013 Maksim Soshkin
Speeding up: Industry demand will rise, supported by state and local outlays
2 About this Industry2 Industry Definition
2 Main Activities
2 Similar Industries
3 Additional Resources
4 Industry at a Glance
5 Industry Performance5 Executive Summary
5 Key External Drivers
6 Current Performance
8 Industry Outlook
11 Industry Life Cycle
13 Products & Markets13 Supply Chain
13 Products & Services
15 Demand Determinants
16 Major Markets
17 International Trade
18 Business Locations
20 Competitive Landscape20 Market Share Concentration
20 Key Success Factors
20 Cost Structure Benchmarks
22 Basis of Competition
23 Barriers to Entry
24 Industry Globalization
25 Major Companies
27 Operating Conditions27 Capital Intensity
28 Technology & Systems
28 Revenue Volatility
29 Regulation & Policy
30 Industry Assistance
31 Key Statistics31 Industry Data
31 Annual Change
31 Key Ratios
32 Jargon & Glossary
www.ibisworld.com | 1-800-330-3772 | [email protected]
WWW.IBISWORLD.COM Road & Highway Maintenance in the US October 2013 2
This industry comprises contractors involved in the maintenance, repair or renovation of existing highways or streets; construction management operations; and those that operate as special trade contractors engaged in
performing subcontract work in the maintenance of highways and streets (e.g. surface repair, road clearing, guardrail repair, drainage repair). The industry does not include services from government establishments.
The primary activities of this industry are
Highway and street maintenance
De-icing and snow clearing highways and streets
Sweeping and cleaning highways and streets
Road pavement repairs (including potholes)
Road signage repair and replacement
Road markings repair/repainting
Landscape maintenance
23412 Bridge & Tunnel Construction in the USEstablishments in this industry are primarily engaged in constructing bridges, tunnels, pedestrian bridges, and elevated highways.
23832 Painters in the USEstablishments in this industry are involved in traffic lane painting.
23811 Concrete Contractors in the USEstablishments in this industry are engage in constructing private driveways and private sidewalks.
23411a Road & Highway Construction in the USEstablishments in this industry are primarily engaged in constructing new highways and streets.
23411c Road & Highway Services in the USEstablishments in this industry are primarily engaged in the provision of specialist highway and street construction services for new construction, maintenance, and renovation.
Industry Definition
Main Activities
Similar Industries
About this Industry
The major products and services in this industry are
Litter control
Maintenance to road fixtures
Pavement management
Seasonal maintenance
Vegetation management
WWW.IBISWORLD.COM Road & Highway Maintenance in the US October 2013 3
About this Industry
For additional information on this industry
www.transportation.org American Association of State Highway and Transportation Officials
www.enr.com Engineering News Record
www.fhwa.dot.gov Federal Highway Administration
www.reedconstructiondata.com Reed Construction Group
www.artba.org The American Road and Transportation Builders Association
Additional Resources
IBISWorld writes over 700 US industry reports, which are updated up to four times a year. To see all reports, go to www.ibisworld.com
WWW.IBISWORLD.COM Road & Highway Maintenance in the US October 2013 4
% c
hang
e
8
−2
0
2
4
6
1806 08 10 12 14 16Year
Government funding for highways
SOURCE: WWW.IBISWORLD.COM
% c
hang
e
12
−6
−3
0
3
6
9
1905 07 09 11 13 15 17Year
Revenue Employment
Revenue vs. employment growth
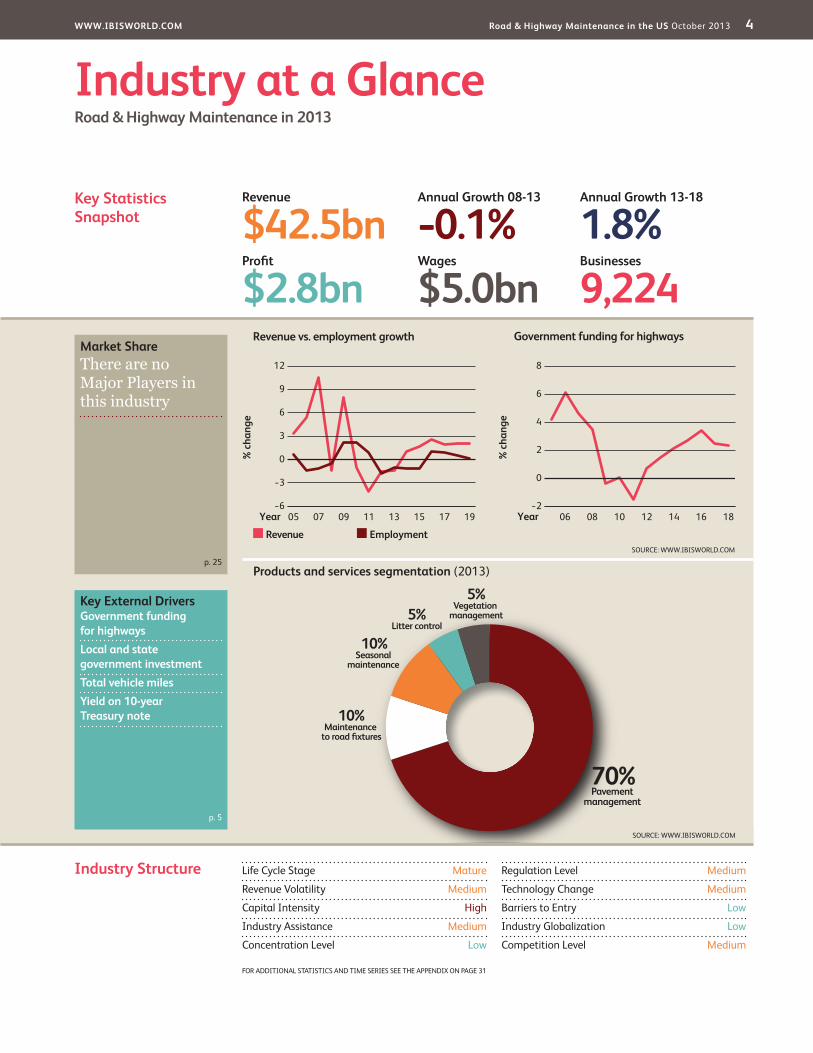
Products and services segmentation (2013)
70%Pavement
management
10%Maintenance
to road fixtures
10%Seasonal
maintenance
5%Litter control
5%Vegetation
management
SOURCE: WWW.IBISWORLD.COM
Key Statistics Snapshot
Industry at a GlanceRoad & Highway Maintenance in 2013
Industry Structure Life Cycle Stage Mature
Revenue Volatility Medium
Capital Intensity High
Industry Assistance Medium
Concentration Level Low
Regulation Level Medium
Technology Change Medium
Barriers to Entry Low
Industry Globalization Low
Competition Level Medium
Revenue
$42.5bnProfit
$2.8bnWages
$5.0bnBusinesses
9,224
Annual Growth 13-18
1.8%Annual Growth 08-13
-0.1%
Key External DriversGovernment funding for highwaysLocal and state government investmentTotal vehicle milesYield on 10-year Treasury note
Market ShareThere are no Major Players in this industry
p. 25
p. 5
FOR ADDITIONAL STATISTICS AND TIME SERIES SEE THE APPENDIX ON PAGE 31
SOURCE: WWW.IBISWORLD.COM
WWW.IBISWORLD.COM Road & Highway Maintenance in the US October 2013 5
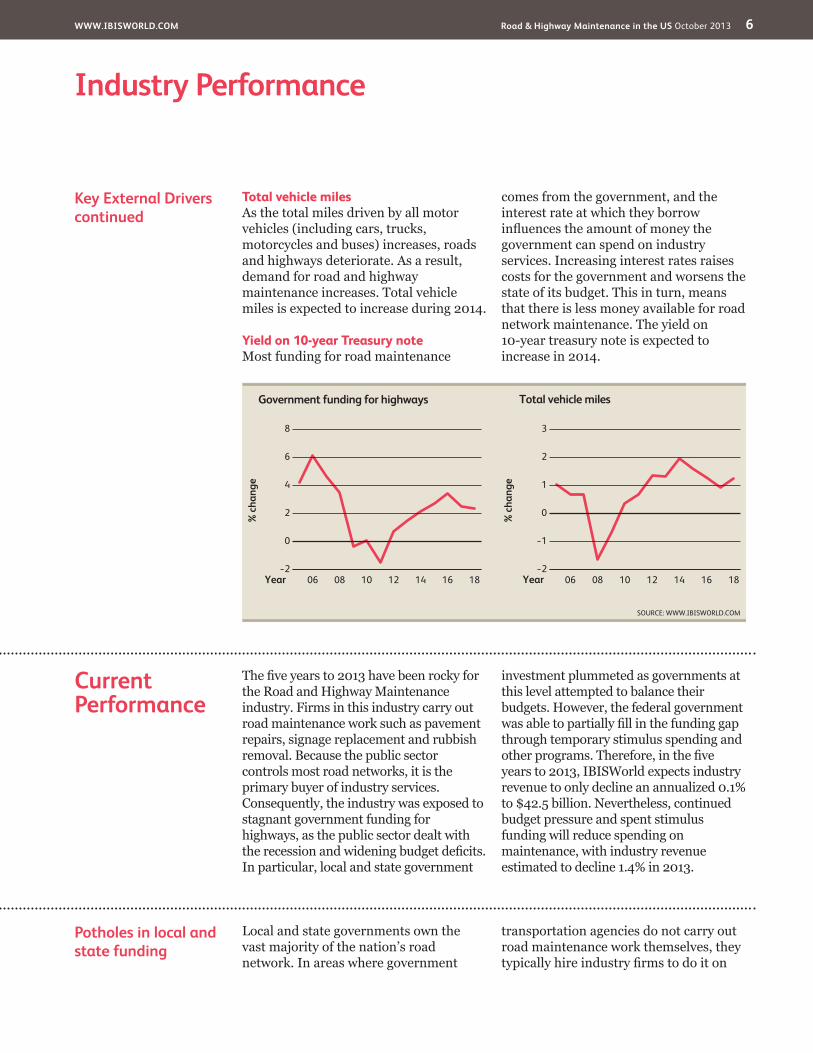
Key External Drivers Government funding for highwaysFederal, state and local government authorities contribute the vast majority of funding for road and highway maintenance; therefore, this industry is particularly sensitive to cyclical fluctuations in government budgetary finances and allocations to road infrastructure. This driver is expected to increase during 2014, representing a potential opportunity for the industry.
Local and state government investmentLocal and state governments are major investors in fixed assets such as structures, equipment and software. Part of this investment is allocated to road network maintenance, which means that climbing investment shows that governments have the resources to fund road maintenance. Local and state government investment is expected to remain stagnant in 2014, representing a potential threat to the industry.
Executive Summary
The Road and Highway Maintenance industry had a bumpy ride in the five years to 2013. Road network owners (primarily federal, state and local governments) hire firms in this industry to provide maintenance services, such as pothole repair, rubbish removal and snow clearing, for their roads and highways. During the recession, budgets on all levels of government came under pressure and funding for road maintenance, and thus demand for industry services, dwindled. However, massive stimulus spending by the
federal government and other funding programs provided enough support for road maintenance to temporarily offset industry revenue losses. Therefore, over the five years to 2013, IBISWorld expects industry revenue to decline at an annualized 0.1% to $42.5 billion, with a 1.4% decline in 2013 as stimulus spending wears off.
During the recession, falling incomes and a housing downturn caused state and municipal tax receipts to decline. As governments at this level have cut spending to balance their budgets, local
and state government investment has fallen every year since 2008. Road network maintenance was one of the expenses cut, which caused demand for industry services to drop. In response to the recession, Congress passed a stimulus package that provided enough funding for maintenance to boost industry revenue by 7.9% in 2009. However, federal spending was a temporary measure and spending on road maintenance eventually started to decline. Facing lower demand and tougher competition, industry firms cut wages and began to mechanize their operations, causing wages to decline at an annualized 0.5% to $5.0 billion over the five years to 2013.
Over the five years to 2018, industry revenue is forecast to climb at an annualized 1.8% to $46.6 billion. Growth will be led by increased use of roads, which causes wear and tear, causing further subcontracting of government maintenance responsibilities and rising demand from private sector road owners. Nevertheless, while government spending on roads and highways will climb, continued budget pressure on the local and state level and uncertainty surrounding future federal spending on infrastructure will greatly diminish revenue growth.
Industry PerformanceExecutive Summary | Key External Drivers | Current Performance Industry Outlook | Life Cycle Stage
Increasing use of roads and highways will eventually push demand
WWW.IBISWORLD.COM Road & Highway Maintenance in the US October 2013 6
Industry Performance
Current Performance
The five years to 2013 have been rocky for the Road and Highway Maintenance industry. Firms in this industry carry out road maintenance work such as pavement repairs, signage replacement and rubbish removal. Because the public sector controls most road networks, it is the primary buyer of industry services. Consequently, the industry was exposed to stagnant government funding for highways, as the public sector dealt with the recession and widening budget deficits. In particular, local and state government
investment plummeted as governments at this level attempted to balance their budgets. However, the federal government was able to partially fill in the funding gap through temporary stimulus spending and other programs. Therefore, in the five years to 2013, IBISWorld expects industry revenue to only decline an annualized 0.1% to $42.5 billion. Nevertheless, continued budget pressure and spent stimulus funding will reduce spending on maintenance, with industry revenue estimated to decline 1.4% in 2013.
Key External Driverscontinued
Total vehicle milesAs the total miles driven by all motor vehicles (including cars, trucks, motorcycles and buses) increases, roads and highways deteriorate. As a result, demand for road and highway maintenance increases. Total vehicle miles is expected to increase during 2014.
Yield on 10-year Treasury noteMost funding for road maintenance
comes from the government, and the interest rate at which they borrow influences the amount of money the government can spend on industry services. Increasing interest rates raises costs for the government and worsens the state of its budget. This in turn, means that there is less money available for road network maintenance. The yield on 10-year treasury note is expected to increase in 2014.
% c
hang
e
3
−2
−1
0
1
2
1806 08 10 12 14 16Year
Total vehicle miles
SOURCE: WWW.IBISWORLD.COM
% c
hang
e
8
−2
0
2
4
6
1806 08 10 12 14 16Year
Government funding for highways
Local and state governments own the vast majority of the nation’s road network. In areas where government
transportation agencies do not carry out road maintenance work themselves, they typically hire industry firms to do it on
Potholes in local and state funding
WWW.IBISWORLD.COM Road & Highway Maintenance in the US October 2013 7
Industry Performance
Federal spending attempts to fill in the pothole
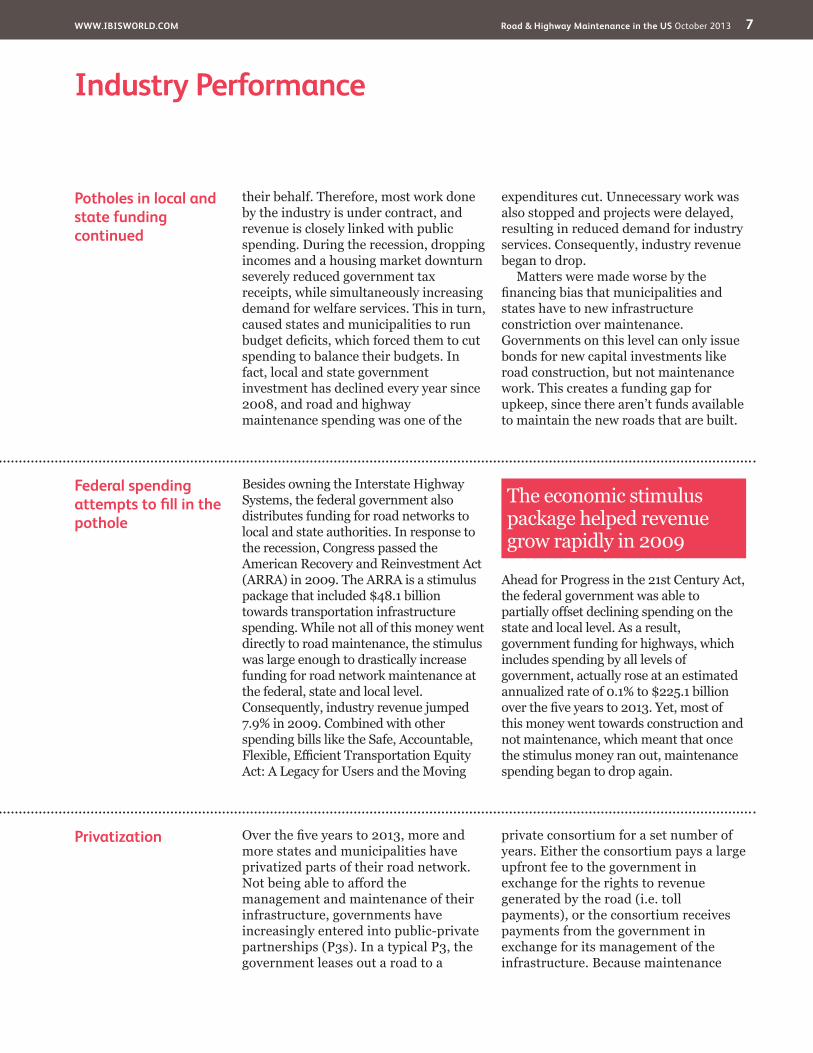
Besides owning the Interstate Highway Systems, the federal government also distributes funding for road networks to local and state authorities. In response to the recession, Congress passed the American Recovery and Reinvestment Act (ARRA) in 2009. The ARRA is a stimulus package that included $48.1 billion towards transportation infrastructure spending. While not all of this money went directly to road maintenance, the stimulus was large enough to drastically increase funding for road network maintenance at the federal, state and local level. Consequently, industry revenue jumped 7.9% in 2009. Combined with other spending bills like the Safe, Accountable, Flexible, Efficient Transportation Equity Act: A Legacy for Users and the Moving
Ahead for Progress in the 21st Century Act, the federal government was able to partially offset declining spending on the state and local level. As a result, government funding for highways, which includes spending by all levels of government, actually rose at an estimated annualized rate of 0.1% to $225.1 billion over the five years to 2013. Yet, most of this money went towards construction and not maintenance, which meant that once the stimulus money ran out, maintenance spending began to drop again.
Privatization Over the five years to 2013, more and more states and municipalities have privatized parts of their road network. Not being able to afford the management and maintenance of their infrastructure, governments have increasingly entered into public-private partnerships (P3s). In a typical P3, the government leases out a road to a
private consortium for a set number of years. Either the consortium pays a large upfront fee to the government in exchange for the rights to revenue generated by the road (i.e. toll payments), or the consortium receives payments from the government in exchange for its management of the infrastructure. Because maintenance
Potholes in local and state funding continued
their behalf. Therefore, most work done by the industry is under contract, and revenue is closely linked with public spending. During the recession, dropping incomes and a housing market downturn severely reduced government tax receipts, while simultaneously increasing demand for welfare services. This in turn, caused states and municipalities to run budget deficits, which forced them to cut spending to balance their budgets. In fact, local and state government investment has declined every year since 2008, and road and highway maintenance spending was one of the
expenditures cut. Unnecessary work was also stopped and projects were delayed, resulting in reduced demand for industry services. Consequently, industry revenue began to drop.
Matters were made worse by the financing bias that municipalities and states have to new infrastructure constriction over maintenance. Governments on this level can only issue bonds for new capital investments like road construction, but not maintenance work. This creates a funding gap for upkeep, since there aren’t funds available to maintain the new roads that are built.
The economic stimulus package helped revenue grow rapidly in 2009
WWW.IBISWORLD.COM Road & Highway Maintenance in the US October 2013 8
Industry Performance
Government spending remains subdued
While the economy will continue to grow in the next few years, local and state governments will still be recovering from the recession. Unemployment rates will stay elevated and housing market growth will remain subdued, which means tax receipts will rise, but remain relatively low. As a consequence, local and state government investment will only grow at
annualized 1.0% over the five years to 2018. Therefore, investment in road network maintenance will continue to rely on federal spending.
However, future federal spending is uncertain. The Highway Trust Fund, the primary source of funding for the Interstate Highway System, is expected to go insolvent in the near future, unless
Industry Outlook
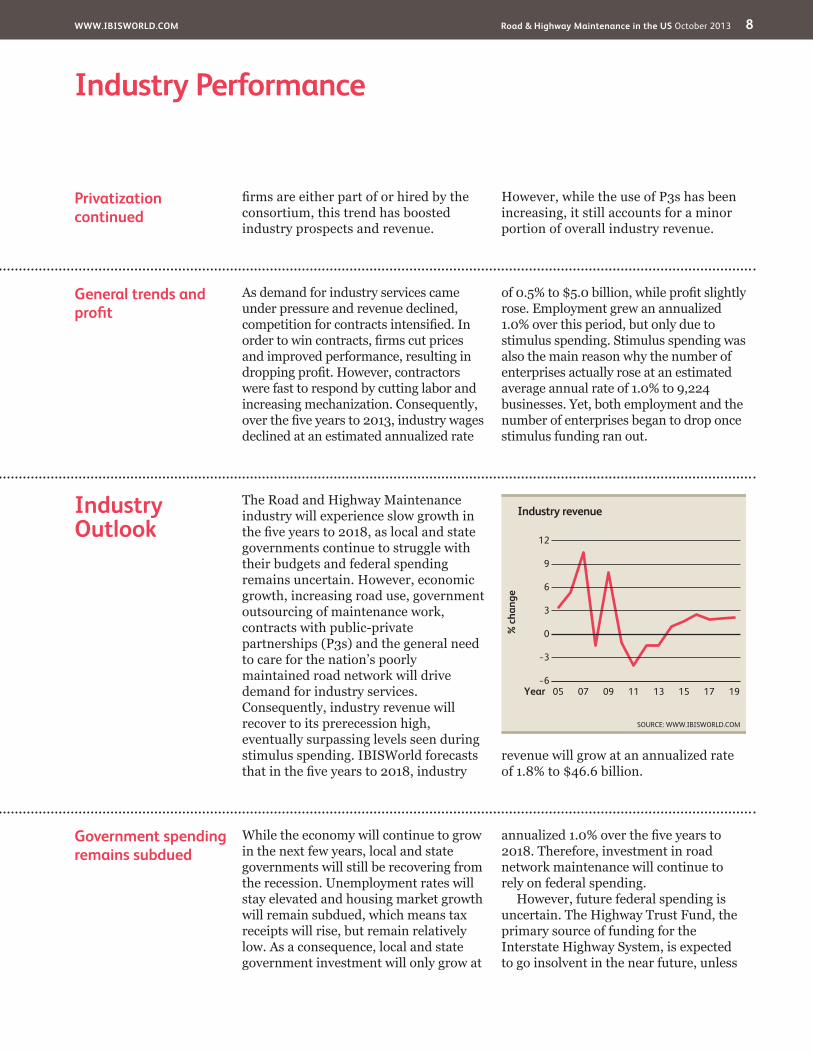
The Road and Highway Maintenance industry will experience slow growth in the five years to 2018, as local and state governments continue to struggle with their budgets and federal spending remains uncertain. However, economic growth, increasing road use, government outsourcing of maintenance work, contracts with public-private partnerships (P3s) and the general need to care for the nation’s poorly maintained road network will drive demand for industry services. Consequently, industry revenue will recover to its prerecession high, eventually surpassing levels seen during stimulus spending. IBISWorld forecasts that in the five years to 2018, industry
revenue will grow at an annualized rate of 1.8% to $46.6 billion.
Privatization continued
firms are either part of or hired by the consortium, this trend has boosted industry prospects and revenue.
However, while the use of P3s has been increasing, it still accounts for a minor portion of overall industry revenue.
General trends and profit
As demand for industry services came under pressure and revenue declined, competition for contracts intensified. In order to win contracts, firms cut prices and improved performance, resulting in dropping profit. However, contractors were fast to respond by cutting labor and increasing mechanization. Consequently, over the five years to 2013, industry wages declined at an estimated annualized rate
of 0.5% to $5.0 billion, while profit slightly rose. Employment grew an annualized 1.0% over this period, but only due to stimulus spending. Stimulus spending was also the main reason why the number of enterprises actually rose at an estimated average annual rate of 1.0% to 9,224 businesses. Yet, both employment and the number of enterprises began to drop once stimulus funding ran out.
% c
hang
e
12
−6
−3
0
3
6
9
1905 07 09 11 13 15 17Year
Industry revenue
SOURCE: WWW.IBISWORLD.COM
WWW.IBISWORLD.COM Road & Highway Maintenance in the US October 2013 9
Industry Performance
Government spending remains subdued continued
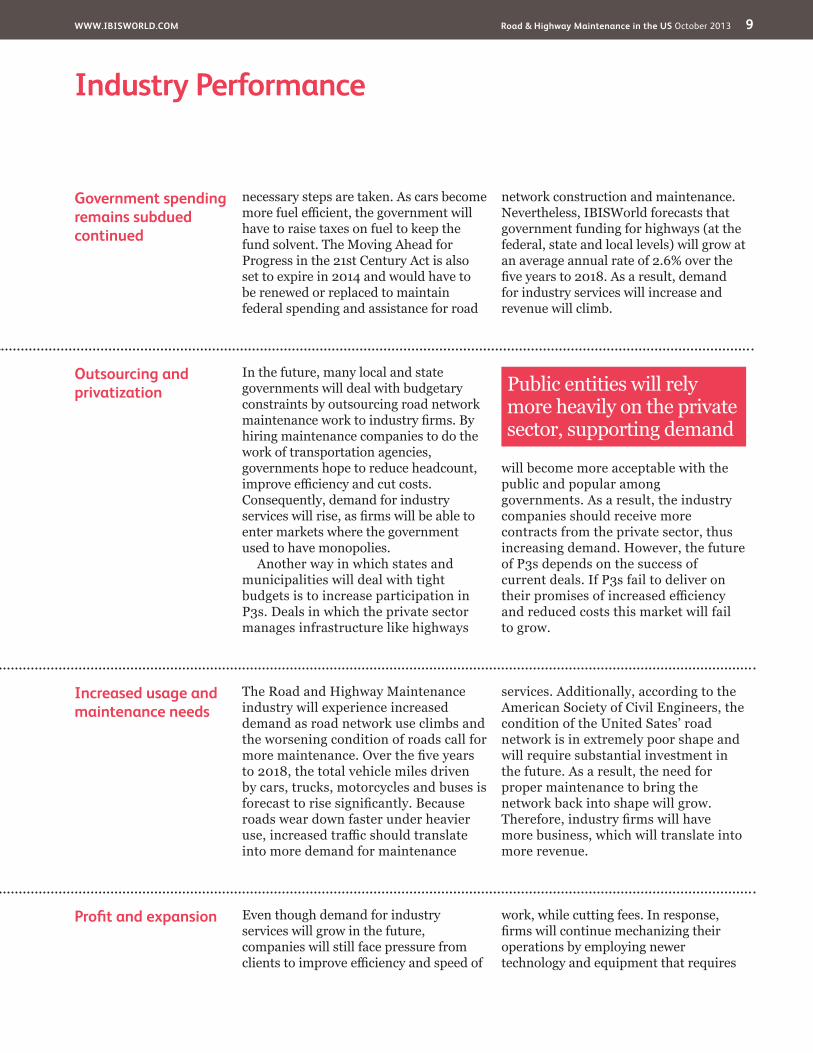
necessary steps are taken. As cars become more fuel efficient, the government will have to raise taxes on fuel to keep the fund solvent. The Moving Ahead for Progress in the 21st Century Act is also set to expire in 2014 and would have to be renewed or replaced to maintain federal spending and assistance for road
network construction and maintenance. Nevertheless, IBISWorld forecasts that government funding for highways (at the federal, state and local levels) will grow at an average annual rate of 2.6% over the five years to 2018. As a result, demand for industry services will increase and revenue will climb.
Outsourcing and privatization
In the future, many local and state governments will deal with budgetary constraints by outsourcing road network maintenance work to industry firms. By hiring maintenance companies to do the work of transportation agencies, governments hope to reduce headcount, improve efficiency and cut costs. Consequently, demand for industry services will rise, as firms will be able to enter markets where the government used to have monopolies.
Another way in which states and municipalities will deal with tight budgets is to increase participation in P3s. Deals in which the private sector manages infrastructure like highways
will become more acceptable with the public and popular among governments. As a result, the industry companies should receive more contracts from the private sector, thus increasing demand. However, the future of P3s depends on the success of current deals. If P3s fail to deliver on their promises of increased efficiency and reduced costs this market will fail to grow.
Increased usage and maintenance needs
The Road and Highway Maintenance industry will experience increased demand as road network use climbs and the worsening condition of roads call for more maintenance. Over the five years to 2018, the total vehicle miles driven by cars, trucks, motorcycles and buses is forecast to rise significantly. Because roads wear down faster under heavier use, increased traffic should translate into more demand for maintenance
services. Additionally, according to the American Society of Civil Engineers, the condition of the United Sates’ road network is in extremely poor shape and will require substantial investment in the future. As a result, the need for proper maintenance to bring the network back into shape will grow. Therefore, industry firms will have more business, which will translate into more revenue.
Profit and expansion Even though demand for industry services will grow in the future, companies will still face pressure from clients to improve efficiency and speed of
work, while cutting fees. In response, firms will continue mechanizing their operations by employing newer technology and equipment that requires
Public entities will rely more heavily on the private sector, supporting demand

WWW.IBISWORLD.COM Road & Highway Maintenance in the US October 2013 10
Industry Performance
less labor. Consequently, profit is forecast to increase. Further, in the five years to 2018, industry employment growth is forecast to be stagnant, while wages will rise at an annualized 1.4% to $5.4 billion, because more skilled employees will be
needed to operate new machines. With fewer government monopolies in the market and improving demand conditions, the number of industry enterprises is also forecast to climb at an average annual rate of 1.3% to 9,829.
Profit and expansion continued
WWW.IBISWORLD.COM Road & Highway Maintenance in the US October 2013 11
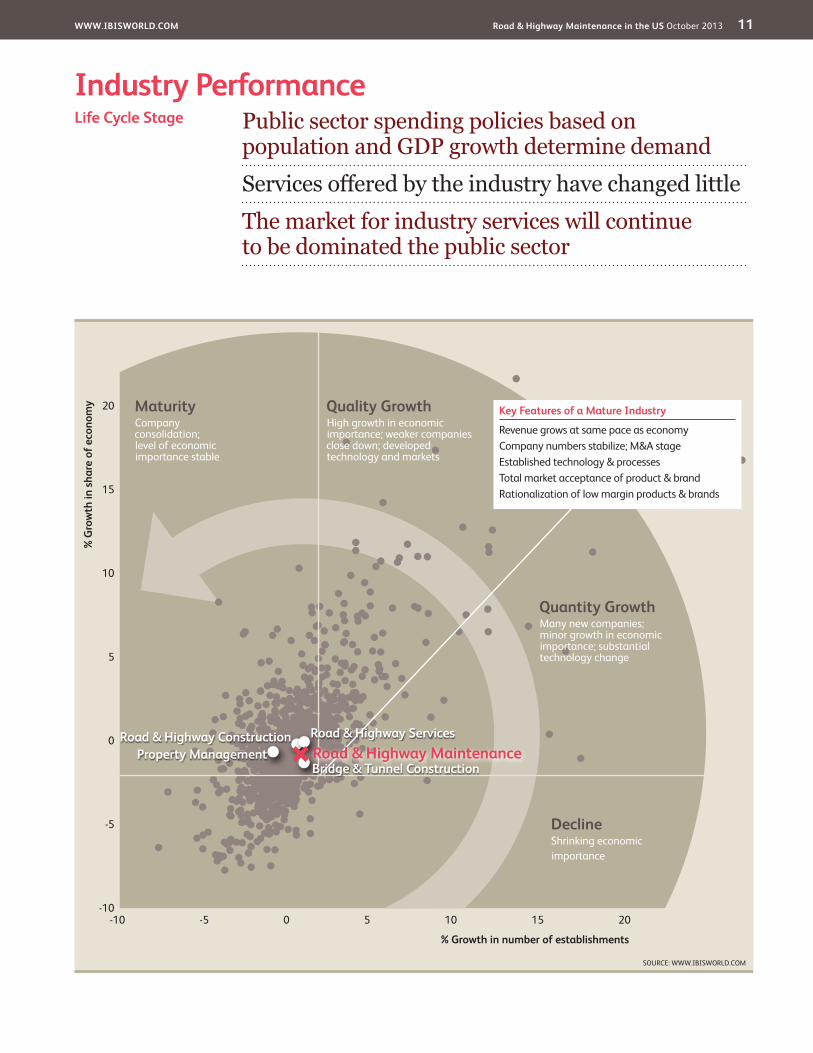
Industry PerformancePublic sector spending policies based on population and GDP growth determine demandServices offered by the industry have changed littleThe market for industry services will continue to be dominated the public sector
Life Cycle Stage
SOURCE: WWW.IBISWORLD.COM
20
15
10
5
0
-5
-10
% G
row
th in
sha
re o
f eco
nom
y
% Growth in number of establishments
-10 -5 0 5 10 15 20
DeclineShrinking economicimportance
Quality GrowthHigh growth in economic importance; weaker companies close down; developed technology and markets
MaturityCompany consolidation;level of economic importance stable
Quantity GrowthMany new companies; minor growth in economic importance; substantial technology change
Key Features of a Mature Industry
Revenue grows at same pace as economyCompany numbers stabilize; M&A stageEstablished technology & processesTotal market acceptance of product & brandRationalization of low margin products & brands
Road & Highway Construction Road & Highway Services
Property ManagementBridge & Tunnel ConstructionRoad & Highway Maintenance

WWW.IBISWORLD.COM Road & Highway Maintenance in the US October 2013 12
Industry Performance
Industry Life Cycle The Road and Highway industry is in a mature stage of its life cycle. In the 10 years to 2018 industry value added, a measure of the industry’s contribution to the overall economy, is forecast to increase at an average annual rate of 1.2%, while GDP will grow 2.1%. Slow growth could primarily be attributed to large cuts in road maintenance spending on the local and state level and does not reflect any long-term decline in the industry. Once government budget recover growth should speed up.
The road and highway network is a vital and necessary national asset and demand for its maintenance will always be there. When funding towards maintenance is cut it is usually due to a poor state of the overall economy, which puts pressure on government budgets. On the other hand, a growing economy and expanding population not only helps governments have more money to allocate towards infrastructure maintenance, but increases commerce, which in turn, creates demand for better maintained roads.
There has also been little change in the services provided by the industry. The way the firms conduct operations and technology involved might be changing (i.e. less labor and more machines, different materials used on roads), but the end product is still the same. Companies still primarily fix things like potholes and pavement, remove rubbish and clear roads. In addition, the pace of technological change within the industry is still relatively slow compared to other industries.
The markets that industry firms serve have also gone through little change. There has been more business from the private sector, but the nation’s road network is still mostly under the control of the public sector. Roads are considered a public good and there is not enough incentives for the private sector to take over all the responsibilities of managing them. Consequently, while there might be an increase in private sector management of roads in the future, it will still remain a government run game.
This industry is Mature

WWW.IBISWORLD.COM Road & Highway Maintenance in the US October 2013 13
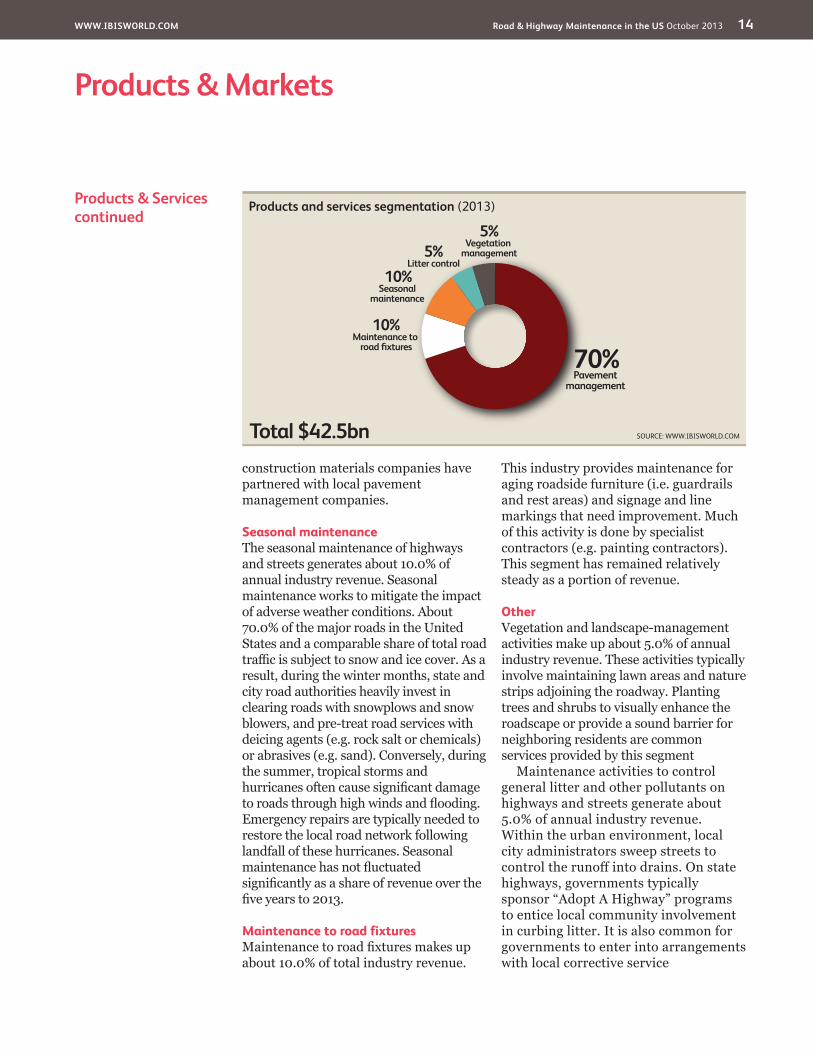
Products & Services Pavement managementThe industry’s principal service is managing road pavement over a surface’s lifetime. This segment makes up about 70.0% of total industry revenue. Maintenance varies depending on the type of road (ranging from seldom-used rural roads to major urban freeways) and the pavement material, such as hot-mix asphalt or concrete slab. Pavement management typically involves
monitoring the pavement for wear and degradation (e.g. pot-holes); scouring the existing asphalt surface and repaving using a new asphalt and gravel mix; or patching concrete cracks. This segment generally calls for substantial planning to optimize the pavement lifespan and minimize the disruption to traffic. Pavement management has grown slightly as a share of revenue over the past five years as an increasing number of
Products & MarketsSupply Chain | Products & Services | Demand Determinants Major Markets | International Trade | Business Locations
KEY BUYING INDUSTRIES
48811 Airport Operations in the US Airport operations fund maintenance and repair work on airport runways and parking facilities.
53131 Property Management in the US Property management funds construction and maintenance of private parking lots and roads in residential subdivisions.
Jun 0923 Administration of Government Programs in the US The public sector is the principal source of highway and street maintenance funding, mainly state and local government.
KEY SELLING INDUSTRIES
21 Mining in the US This industry supplies inputs into construction and maintenance activities (principally crushed stone, gravel and course sand). This industry also uses mined rock salt for the deicing of roads.
23 Construction in the US This industry supplies special construction trade services (e.g. concreting contractors and structural steel erectors).
32412 Asphalt Manufacturing in the US This industry supplies pavement surface material.
32732 Ready-Mix Concrete Manufacturing in the US This industry supplies pavement surface material.
32733 Concrete Pipe & Block Manufacturing in the US This industry supplies infrastructure materials (blocks and pylons).
42384 Industrial Supplies Wholesaling in the US This industry supplies chemicals used for deicing roads.
42493 Flower & Nursery Stock Wholesaling in the US This industry supplies plants and grasses for landscaping and streetscaping.
53241 Heavy Construction Equipment Rental in the US This industry supplies machinery and equipment used for road construction or maintenance (purchase or lease), including graders and bulldozers for construction and snowplows and street sweepers for regular maintenance.
54 Professional, Scientific and Technical Services in the US This industry supplies professional and technical services on contract for the design, management and construction of roads, such as consultant engineers, architects, landscape architects, surveyors and drafters.
Supply Chain
WWW.IBISWORLD.COM Road & Highway Maintenance in the US October 2013 14
Products & Markets
Products & Servicescontinued
construction materials companies have partnered with local pavement management companies.
Seasonal maintenanceThe seasonal maintenance of highways and streets generates about 10.0% of annual industry revenue. Seasonal maintenance works to mitigate the impact of adverse weather conditions. About 70.0% of the major roads in the United States and a comparable share of total road traffic is subject to snow and ice cover. As a result, during the winter months, state and city road authorities heavily invest in clearing roads with snowplows and snow blowers, and pre-treat road services with deicing agents (e.g. rock salt or chemicals) or abrasives (e.g. sand). Conversely, during the summer, tropical storms and hurricanes often cause significant damage to roads through high winds and flooding. Emergency repairs are typically needed to restore the local road network following landfall of these hurricanes. Seasonal maintenance has not fluctuated significantly as a share of revenue over the five years to 2013.
Maintenance to road fixturesMaintenance to road fixtures makes up about 10.0% of total industry revenue.
This industry provides maintenance for aging roadside furniture (i.e. guardrails and rest areas) and signage and line markings that need improvement. Much of this activity is done by specialist contractors (e.g. painting contractors). This segment has remained relatively steady as a portion of revenue.
OtherVegetation and landscape-management activities make up about 5.0% of annual industry revenue. These activities typically involve maintaining lawn areas and nature strips adjoining the roadway. Planting trees and shrubs to visually enhance the roadscape or provide a sound barrier for neighboring residents are common services provided by this segment
Maintenance activities to control general litter and other pollutants on highways and streets generate about 5.0% of annual industry revenue. Within the urban environment, local city administrators sweep streets to control the runoff into drains. On state highways, governments typically sponsor “Adopt A Highway” programs to entice local community involvement in curbing litter. It is also common for governments to enter into arrangements with local corrective service
Products and services segmentation (2013)
Total $42.5bn
70%Pavement
management
10%Maintenance to
road fixtures
10%Seasonal
maintenance
5%Litter control
5%Vegetation
management
SOURCE: WWW.IBISWORLD.COM
WWW.IBISWORLD.COM Road & Highway Maintenance in the US October 2013 15
Products & Markets
DemandDeterminants
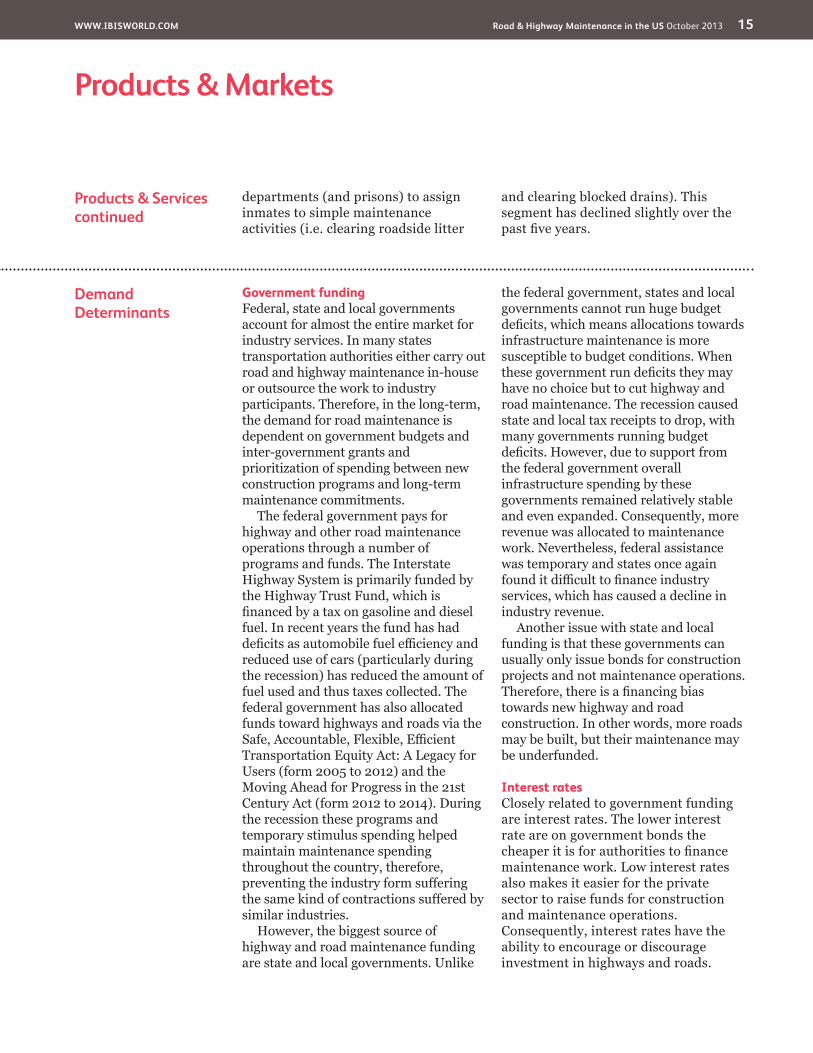
Government fundingFederal, state and local governments account for almost the entire market for industry services. In many states transportation authorities either carry out road and highway maintenance in-house or outsource the work to industry participants. Therefore, in the long-term, the demand for road maintenance is dependent on government budgets and inter-government grants and prioritization of spending between new construction programs and long-term maintenance commitments.
The federal government pays for highway and other road maintenance operations through a number of programs and funds. The Interstate Highway System is primarily funded by the Highway Trust Fund, which is financed by a tax on gasoline and diesel fuel. In recent years the fund has had deficits as automobile fuel efficiency and reduced use of cars (particularly during the recession) has reduced the amount of fuel used and thus taxes collected. The federal government has also allocated funds toward highways and roads via the Safe, Accountable, Flexible, Efficient Transportation Equity Act: A Legacy for Users (form 2005 to 2012) and the Moving Ahead for Progress in the 21st Century Act (form 2012 to 2014). During the recession these programs and temporary stimulus spending helped maintain maintenance spending throughout the country, therefore, preventing the industry form suffering the same kind of contractions suffered by similar industries.
However, the biggest source of highway and road maintenance funding are state and local governments. Unlike
the federal government, states and local governments cannot run huge budget deficits, which means allocations towards infrastructure maintenance is more susceptible to budget conditions. When these government run deficits they may have no choice but to cut highway and road maintenance. The recession caused state and local tax receipts to drop, with many governments running budget deficits. However, due to support from the federal government overall infrastructure spending by these governments remained relatively stable and even expanded. Consequently, more revenue was allocated to maintenance work. Nevertheless, federal assistance was temporary and states once again found it difficult to finance industry services, which has caused a decline in industry revenue.
Another issue with state and local funding is that these governments can usually only issue bonds for construction projects and not maintenance operations. Therefore, there is a financing bias towards new highway and road construction. In other words, more roads may be built, but their maintenance may be underfunded.
Interest ratesClosely related to government funding are interest rates. The lower interest rate are on government bonds the cheaper it is for authorities to finance maintenance work. Low interest rates also makes it easier for the private sector to raise funds for construction and maintenance operations. Consequently, interest rates have the ability to encourage or discourage investment in highways and roads.
Products & Servicescontinued
departments (and prisons) to assign inmates to simple maintenance activities (i.e. clearing roadside litter
and clearing blocked drains). This segment has declined slightly over the past five years.
WWW.IBISWORLD.COM Road & Highway Maintenance in the US October 2013 16
Products & Markets
Major Markets
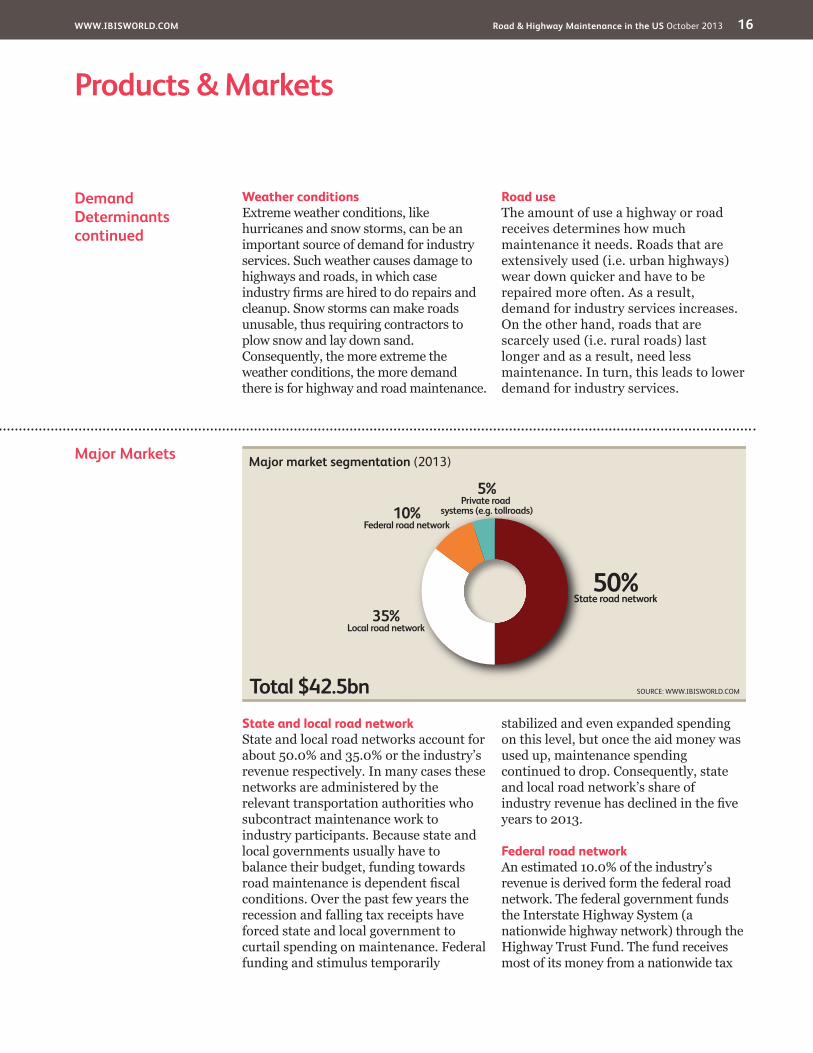
State and local road network State and local road networks account for about 50.0% and 35.0% or the industry’s revenue respectively. In many cases these networks are administered by the relevant transportation authorities who subcontract maintenance work to industry participants. Because state and local governments usually have to balance their budget, funding towards road maintenance is dependent fiscal conditions. Over the past few years the recession and falling tax receipts have forced state and local government to curtail spending on maintenance. Federal funding and stimulus temporarily
stabilized and even expanded spending on this level, but once the aid money was used up, maintenance spending continued to drop. Consequently, state and local road network’s share of industry revenue has declined in the five years to 2013.
Federal road network An estimated 10.0% of the industry’s revenue is derived form the federal road network. The federal government funds the Interstate Highway System (a nationwide highway network) through the Highway Trust Fund. The fund receives most of its money from a nationwide tax
DemandDeterminantscontinued
Weather conditionsExtreme weather conditions, like hurricanes and snow storms, can be an important source of demand for industry services. Such weather causes damage to highways and roads, in which case industry firms are hired to do repairs and cleanup. Snow storms can make roads unusable, thus requiring contractors to plow snow and lay down sand. Consequently, the more extreme the weather conditions, the more demand there is for highway and road maintenance.
Road useThe amount of use a highway or road receives determines how much maintenance it needs. Roads that are extensively used (i.e. urban highways) wear down quicker and have to be repaired more often. As a result, demand for industry services increases. On the other hand, roads that are scarcely used (i.e. rural roads) last longer and as a result, need less maintenance. In turn, this leads to lower demand for industry services.
Major market segmentation (2013)
Total $42.5bn
50%State road network
35%Local road network
10%Federal road network
5%Private road
systems (e.g. tollroads)
SOURCE: WWW.IBISWORLD.COM
WWW.IBISWORLD.COM Road & Highway Maintenance in the US October 2013 17
Products & Markets
International Trade This industry primarily offers a service; therefore, the trade of physical products does not apply to this industry. This sector of the economy is orientated toward the domestic market, which
provides the majority of sales revenue. For more details regarding international operations and foreign-owned firms in the industry, please refer to the Industry Globalization section of this report.
Major Marketscontinued
on fuels. Congress also passes various bill that allocate additional funds towards road network investment and maintenance. The federal government’s vast resources and ability to run large budget deficits has allowed it to continue to allocate funds towards its road network. As a consequence, the federal road network’s portion of industry revenue has climbed in the five years to 2013.
Private road networks Work on privately owned projects includes maintenance on private
residential sub-divisions, agricultural and mining roads and asset management of privately owned toll roads via public-private partnerships. Because most roads are administered by the public sector this market only makes up about 5.0% of the industry’s revenue. However, mounting budget pressure at state and local governments have encouraged the handover of some public road networks to the private sector. In turn, this markets share of industry revenue has increased in the five years to 2013.
WWW.IBISWORLD.COM Road & Highway Maintenance in the US October 2013 18
Products & Markets
Business Locations 2013
MO2.2
West
West
West
Rocky Mountains Plains
Southwest
Southeast
New England
VT0.3
MA2.4
RI0.3
NJ3.1
DE0.4
NH0.7
CT1.2
MD1.5
DC0.1
1
5
3
7
2
6
4
8 9
Additional States (as marked on map)
AZ1.7
CA8.1
NV0.5
OR2.1
WA2.8
MT1.0
NE0.8
MN2.9
IA1.5
OH3.4 VA
3.5
FL4.4
KS1.5
CO2.2
UT0.9
ID1.0
TX6.4
OK1.5
NC3.9
AK0.8
WY0.5
TN1.9
KY1.4
GA2.8
IL4.0
ME0.9
ND0.7
WI1.6 MI
2.8 PA3.7
WV0.6
SD0.8
NM0.6
AR1.4
MS1.3
AL2.0
SC1.6
LA1.8
HI0.3
IN1.7
NY4.7 5
67
8
321
4
9
SOURCE: WWW.IBISWORLD.COM
Mid- Atlantic
Establishments (%)
Less than 3% 3% to less than 10% 10% to less than 20% 20% or more
Great Lakes
WWW.IBISWORLD.COM Road & Highway Maintenance in the US October 2013 19
Products & Markets
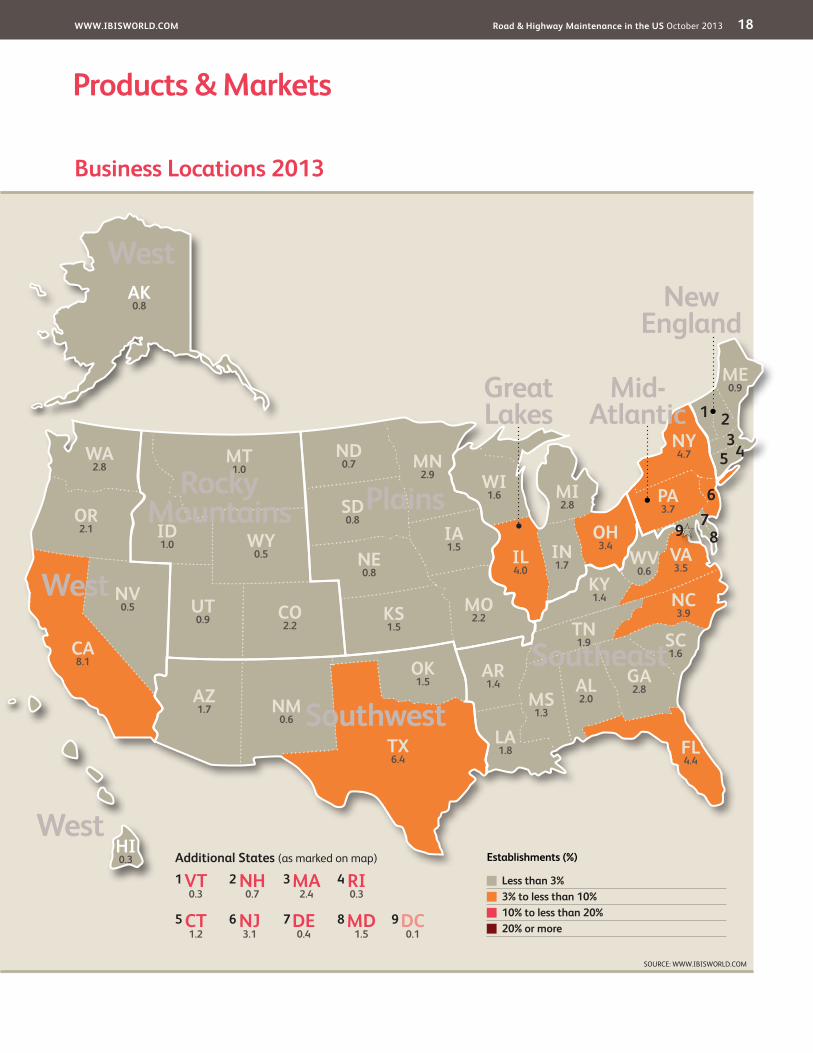
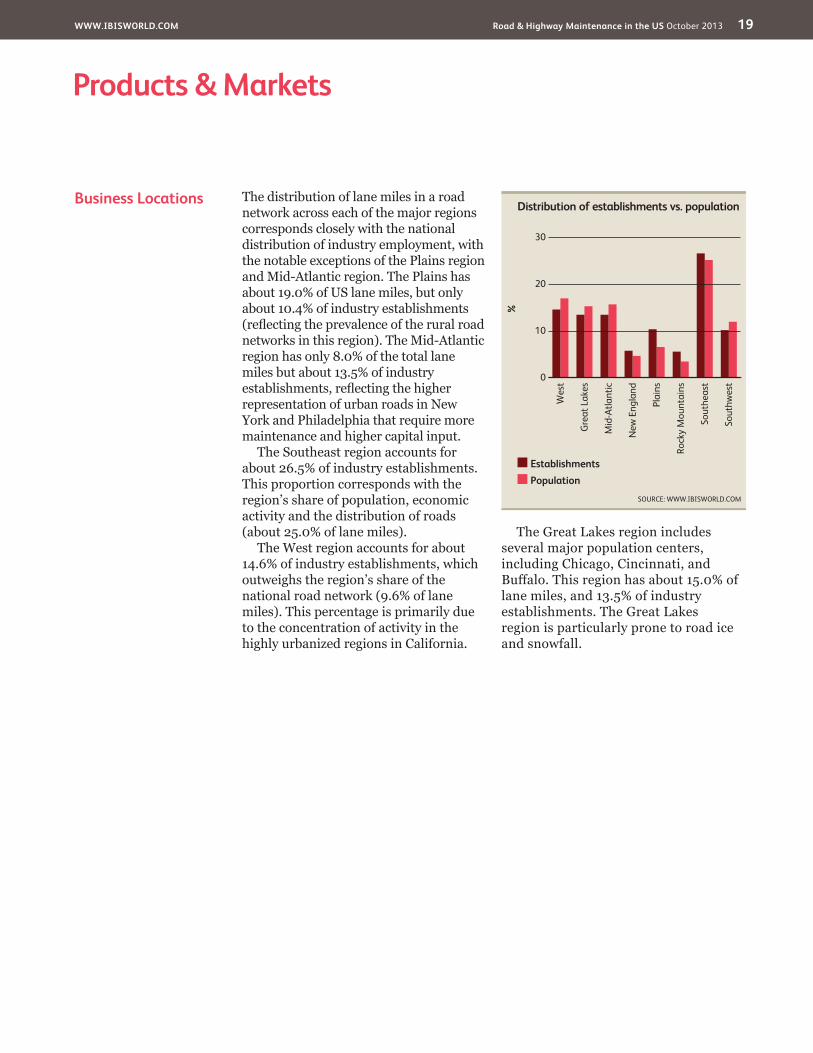
Business Locations The distribution of lane miles in a road network across each of the major regions corresponds closely with the national distribution of industry employment, with the notable exceptions of the Plains region and Mid-Atlantic region. The Plains has about 19.0% of US lane miles, but only about 10.4% of industry establishments (reflecting the prevalence of the rural road networks in this region). The Mid-Atlantic region has only 8.0% of the total lane miles but about 13.5% of industry establishments, reflecting the higher representation of urban roads in New York and Philadelphia that require more maintenance and higher capital input.
The Southeast region accounts for about 26.5% of industry establishments. This proportion corresponds with the region’s share of population, economic activity and the distribution of roads (about 25.0% of lane miles).
The West region accounts for about 14.6% of industry establishments, which outweighs the region’s share of the national road network (9.6% of lane miles). This percentage is primarily due to the concentration of activity in the highly urbanized regions in California.
The Great Lakes region includes several major population centers, including Chicago, Cincinnati, and Buffalo. This region has about 15.0% of lane miles, and 13.5% of industry establishments. The Great Lakes region is particularly prone to road ice and snowfall.
%
30
0
10
20
Sout
hwes
t
Wes
t
Gre
at L
akes
Mid
-Atla
ntic
New
Eng
land
Plai
ns
Rock
y M
ount
ains
Sout
heas
t
EstablishmentsPopulation
Distribution of establishments vs. population
SOURCE: WWW.IBISWORLD.COM
WWW.IBISWORLD.COM Road & Highway Maintenance in the US October 2013 20
Cost Structure Benchmarks
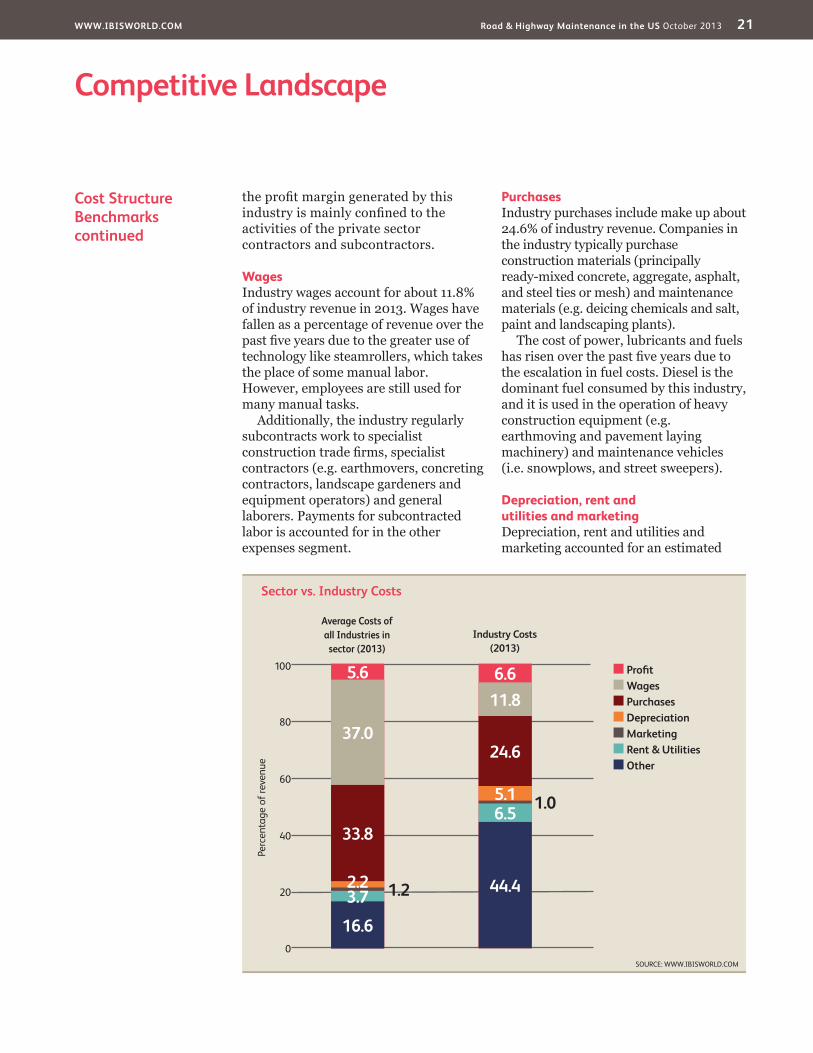
ProfitIndustry profit is expected to account for about 6.6% of industry revenue in 2013. Profit margins have improved from 6.3% of revenue in 2008 as demand conditions strengthened in
2009 and firms used more mechanized equipment instead of labor. Public sector road authorities are the key source of funding for highway and street maintenance and are the key facilitator of maintenance activity. Consequently,
Key Success Factors Ability to accommodate environmental requirementsSuccessful players form an understanding of the environmental implications and minimization of the pollution impact to limit project restrictions.
Ability to effectively communicate and negotiateSuccessful players (typically state transport agencies) must have the capacity to develop infrastructure agreements with private and public sector clients, inform the community and effectively communicate with labor and material suppliers.
Ensuring pricing policy is appropriateFirms must have the ability to correctly price complex infrastructure maintenance programs with the anticipation of periodic changes in
the price of materials and the costs of labor input.
Having good working relationships with subcontracting building trade specialistsOutsourcing projects can often be more cost-effective, so it is essential that the lead contractors in this industry have a good working relationship with subcontractors.
Having links with suppliersSuccessful players typically have strong ongoing relationships with suppliers of material inputs such as concrete, bitumen, steel and aggregate.
Gaining local contractsMost industry projects are managed by local and state authorities. Thus, it is crucial for a firm to be able to get local and state contracts.
Market Share Concentration
The Road and Highway Maintenance industry is extremely fragmented. In 2013, IBISWorld estimates that the top four players in the industry will only account for 1.7% of total revenue. The majority of industry activity is managed and funded by state and local government transport authorities. These agencies either carry out the work themselves or outsource to industry participants. Hired contractors are usually small local firms that have local connections and reputation. Even the larger, nationwide, players can hire subcontractors to do the actual ground
work. However, the increasing use of public-private partnerships (P3s) has increased the number of larger firms, as such projects are usually given to companies with the required capacity and a national, if not international, reputation. Nevertheless, P3s make up a marginal amount of the industry’s total ownership structure and usually subcontract work to local companies. Overall, only about 5.0% of establishments have more than 100 employees, while about 40.0% of establishments employ fewer than five people.
Competitive LandscapeMarket Share Concentration | Key Success Factors | Cost Structure Benchmarks Basis of Competition | Barriers to Entry | Industry Globalization
Level Concentration in this industry is Low
IBISWorld identifies 250 Key Success Factors for a business. The most important for this industry are:
WWW.IBISWORLD.COM Road & Highway Maintenance in the US October 2013 21
Competitive Landscape
Cost Structure Benchmarkscontinued
the profit margin generated by this industry is mainly confined to the activities of the private sector contractors and subcontractors.
WagesIndustry wages account for about 11.8% of industry revenue in 2013. Wages have fallen as a percentage of revenue over the past five years due to the greater use of technology like steamrollers, which takes the place of some manual labor. However, employees are still used for many manual tasks.
Additionally, the industry regularly subcontracts work to specialist construction trade firms, specialist contractors (e.g. earthmovers, concreting contractors, landscape gardeners and equipment operators) and general laborers. Payments for subcontracted labor is accounted for in the other expenses segment.
PurchasesIndustry purchases include make up about 24.6% of industry revenue. Companies in the industry typically purchase construction materials (principally ready-mixed concrete, aggregate, asphalt, and steel ties or mesh) and maintenance materials (e.g. deicing chemicals and salt, paint and landscaping plants).
The cost of power, lubricants and fuels has risen over the past five years due to the escalation in fuel costs. Diesel is the dominant fuel consumed by this industry, and it is used in the operation of heavy construction equipment (e.g. earthmoving and pavement laying machinery) and maintenance vehicles (i.e. snowplows, and street sweepers).
Depreciation, rent and utilities and marketing Depreciation, rent and utilities and marketing accounted for an estimated
Sector vs. Industry Costs
■ Profi t■ Wages■ Purchases■ Depreciation■ Marketing■ Rent & Utilities■ Other
Average Costs of all Industries in sector (2013)
Industry Costs (2013)
0
20
40
60
Perc
enta
ge o
f rev
enue
80
100 5.6
16.6
3.7 1.22.2
33.8
37.0
6.6
44.4
6.5 1.05.1
24.6
11.8
SOURCE: WWW.IBISWORLD.COM
WWW.IBISWORLD.COM Road & Highway Maintenance in the US October 2013 22
Competitive Landscape
Basis of Competition Firms in the Road and Highway Maintenance industry face a moderate level of competition. The public sector is the principal source of funding for highway and street maintenance activity in the United States. The public sector directly manages the maintenance program, performing the work in-house or through subcontractors. The state and local government transport agencies do not compete for maintenance contracts; however, there is intense competition for the work subcontracted by these agencies to the private sector.
Internal Price is the primary basis of competition for public-sector contracts; however, public agencies require evidence of the contractor’s capacity to undertake the project to the required quality and within the agreed timeframe. There is a push for public tendering to move toward a merit-based tendering process (i.e. based on proven record) and also a push for a performance-based tendering procedure under which the contractor is required to meet certain predetermined standards (i.e. grass can’t exceed certain length) or face fee penalties or contract loss.
Larger companies in the industry typically operate from a dominant position within state or local government boundaries. Many small- and medium-scale contractors contest maintenance contracts in narrow regional markets, while relatively few contractors have sufficient scale and proven capabilities to contest the very large long-term asset management contracts. Bigger player also have an advantage because they typically offer services beyond industry-specific work. These can include bridge and tunnel maintenance and management, infrastructure construction and total infrastructure asset management.
Smaller maintenance jobs are offered for tender by the relevant public-sector agency through general media releases and tender notices, and via word-of-mouth referrals where established operators are invited to tender by the prime contractor. Firms competing for non-specialized maintenance work do so mainly on the basis of price and timeliness of construction. Contracting firms attempt to build relationships with local authorities to keep abreast of upcoming contracts.
Cost Structure Benchmarkscontinued
5.1%, 6.5% and 1.0% of industry revenue respectively. Firms buy equipment and tools such as earthmovers, trucks, and road marking machines to carry out their tasks. In the five years to 2013, depreciation has increased as firms mechanized some of their operations in order to reduce labor costs. Rent and utilities includes cost like electric and water bills and rent payments on property and warehouses. Marketing expenses are low because most of the industry’s work is secured by obtaining contracts with government agencies. Therefore, knowledge of local policy and connections are the primary means to get jobs.
OtherOther expenses for the industry are made up of several other categories and accounts for about 40.4% of revenue. These other expenses include equipment rental costs and other business overheads, including the cost of communication services (notably cell phones), equipment repair and maintenance (state transportation departments maintain large vehicle fleets), legal costs and insurance. Subcontracting is also included and accounts for about 30.2% of total industry revenue.
Level & Trend Competition in this industry is Medium and the trend is Steady
WWW.IBISWORLD.COM Road & Highway Maintenance in the US October 2013 23
Competitive Landscape
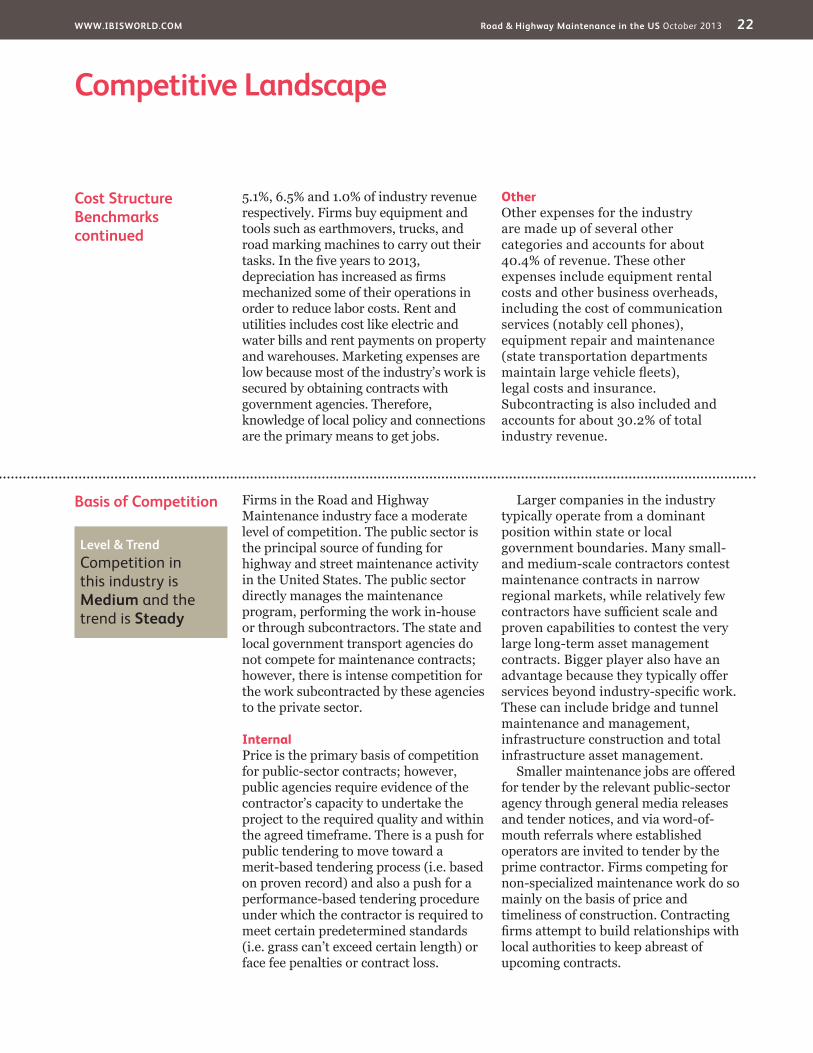
Barriers to Entry Contractors do not face any significant barriers entering this industry. It is relatively easy for new firms to enter the bottom end of the market; on a basic level, they must only obtain local state licensing and registration to start business. Highway- and street-maintenance contracts are funded by local or state government road authorities that may opt to undertake work in-house or subcontract work to the private sector. New entrants have usually have no significant technological disadvantage and capital costs may be contained by leasing specialized equipment or using subcontractors (notably earthmoving contractors and asphalt suppliers).
Smaller scale contractors rely on maintaining a sound reputation and a network of contacts within the construction sector and government to
obtain contracts. New entrants may find it difficult to establish a foothold in a market where they have no proven record of construction and no network of contacts. In certain regions, where the all maintenance work is carried out by transportation authorities, it is impossible for firms to enter because of the government’s monopoly.
Basis of Competitioncontinued
Large-scale maintenance contracts often entail a more complex tendering process; major contractors compete for the job on a variety of criteria, including past performance, design suitability, quality of work, guarantee of completion time and cost. The geographically dispersed nature of highway construction and maintenance activity reduces the capacity for economies of scale and requires larger scale firms to maintain local representation across regions or the entire country.
External The only real source of external competition for the industry are government transportation agencies that do not subcontract work to the private sector. Under these circumstances the relevant agency does all the maintenance work in-house and has a monopoly over the concerned market. Many states and localities operate like this because of the general
unwillingness of the public to hand over responsibility of vital public assets to the private sector.
However, over the past few years more and more projects have been handed over to the private sector because of budgetary pressure at state and local governments. Entire tracks of highway and road are now being run by public-private partnerships (P3s). Under a P3, the government hands over the management of infrastructure to the private sector for a set amount of time. The private consortium that takes on the project typically either pays a large upfront fee to the government for the right to collect all future asset generated revenue (i.e. toll payments) or receives payments from the government in exchange for management and maintenance work that meets performance requirements. P3’s participation in the industry is expected to increase over the years as fiscal conditions at the state and local level remain challenging.
Barriers to Entry checklist Level
Competition MediumConcentration LowLife Cycle Stage MatureCapital Intensity HighTechnology Change MediumRegulation & Policy MediumIndustry Assistance Medium
SOURCE: WWW.IBISWORLD.COM
Level & Trend Barriers to Entry in this industry are Low and Steady
WWW.IBISWORLD.COM Road & Highway Maintenance in the US October 2013 24
Competitive Landscape
Industry Globalization
The Road and Highway Maintenance industry has a low level of globalization. The level of foreign competition and foreign ownership in this industry is negligible. However, there has been a recent upswing in foreign investment into selected toll roads, which is expected to lift the foreign share of maintenance activity over the long term.
The US subsidiary of the UK-based Balfour Beatty PLC is part of the Lone Star Infrastructure LLC consortium,
which secured the contract to design, construct and maintain State Highway 130 in Texas. Additionally, many other foreign-based firms have secured contracts with US-based companies. For example, Australian-based Macquarie Infrastructure Group has recently acquired several toll road projects in the US including: Dulles Greenway; Chicago Skyway; Indiana Toll Road; and South Bay Expressway in San Diego.
Level & Trend Globalization in this industry is Low and the trend is Increasing
WWW.IBISWORLD.COM Road & Highway Maintenance in the US October 2013 25
Other Companies Public entities, which are not included in this industry, perform a large amount of industry activity, and road, street and highway maintenance funding faces broad disbursement channels. As a result, no private-sector company has enough market share to have substantial influence over the industry.
The three states with the largest road and highway maintenance expenditures are California, New York and Texas. However, the amount of money spent in the private sector through contracts with road maintenance firms varies markedly by state and municipality. Some state departments of transportation perform almost all highway and maintenance operations in-house (Oregon), while others outsource the vast majority of work (Texas). Some of the most cited reasons for the outsourcing of highway maintenance activities include an insufficient in-house workforce, a lack of specialized equipment or experience, contractor availability, statutory requirements and cost savings.
However, a growing number of states have started to implement public-private partnerships (P3s), in which management, operations and maintenance of roads and highways are given over to the private sector for an agreed upon time. The private sector consortium that enters into the deal either pays an upfront fee to the government in exchange for a the right to retain revenue generated by the highway and road (i.e. toll payments), or is paid by the government when the consortium meets certain performance benchmarks. Consortiums typically hire maintenance contractors, thus representing a new market for industry participants.
Colas Inc. Estimated market share: 0.7%France-based Colas Inc. is a major infrastructure maintenance, construction and supplier firm. The company has
operations in about 50 countries and made over $17.0 billion in revenue in 2013. The firm’s number one source of income is its roads business, which involves road construction and maintenance. The majority of the remaining revenue comes from sales of road construction-related materials and supplies. Its North America operations employs 5,290 people and brought in about $3.4 billion dollars in 2012. IBISWorld estimates that the company’s industry-specific US operations will generate $297.0 million in 2013.
Transfield Services Estimated market share: 0.5%Transfield Services, headquartered in Sydney, Australia, provides operations, maintenance, asset management and project-management services across diverse industries, including mining, hydrocarbons, transportation, utilities, facilities management and defense. Transfield operates in Australia, New Zealand, the United States, the United Arab Emirates, Qatar, South East Asia, India and Canada. The company generated global revenue of $4.3 billion in fiscal 2013, with about 17.4% generated in the Americas.
In North America, Transfield operates maintenance companies across a variety of industries. Transfield companies include: US Maintenance; Timec Company Inc.; a joint venture with Flint Energy Services Ltd. servicing the oil sands industry; and Transfield Services North America Transport Infrastructure (formerly VMS Inc.), which provides highway and street maintenance.
Transfield Services North America Transportation Infrastructure’s annual revenue is estimated to be about $214.5 million, with an employment base of 680 people. Transfield operates in this industry though its transportation infrastructure subsidiary and has been experiencing nearly static growth.
Major CompaniesThere are no Major Players in this industry | Other Companies
WWW.IBISWORLD.COM Road & Highway Maintenance in the US October 2013 26
Major Companies
Other Companiescontinued
Infrastructure Corporation of America Estimated market share: 0.3%Infrastructure Corporation of America (ICA) is based in Nashville, TN and was founded in 1998. As of 2013, the company employs over 200 people. ICA provides fence-to-fence maintenance of highways and interstates through performance-based contracts for a specified period of time. Fence-to-fence maintenance bundles all the services required to maintain the asset, including pavement maintenance, roadside maintenance, drainage repair, traffic services, vegetation and aesthetics, bridge repair and rest area maintenance. ICA focuses mainly on maintenance activities rather than larger-scale road replacement projects.
ICA became Florida’s first asset management contractor in 2000 and is now one of the state’s largest providers of building and roadway asset management services. ICA manages about 2,000 lane miles of interstate and state roads for the Florida Department of Transportation, the Turnpike Enterprise and the Orlando/Orange County Expressway Authority and
maintains 70.0% of Florida’s rest areas. ICA has extended operations to include 20 long-term asset maintenance contracts in Virginia, Texas and South Carolina. ICA is a privately held company and, due to its nature, does not make any financial information public. IBISWorld estimates that the company’s industry-relevant revenue will reach $145.0 million in 2013.
DBi Services Estimated market share: 0.2%Headquartered in Hazleton, PA, DBi Services was founded in 1978 and is a leader in the management and maintenance of infrastructure assets. In the past five years, the company has finished over $500.0 million worth of projects that were primarily linked to performance. The firm employs over 1,500 people in over 60 locations throughout the United States, Canada, Europe and the Middle East. However, the majority of its operations take place in the United States, with extensive asset maintenance projects in Florida and Virginia. IBISWorld estimates that the company’s US industry-specific revenue will be $85.2 million in 2013.
WWW.IBISWORLD.COM Road & Highway Maintenance in the US October 2013 27
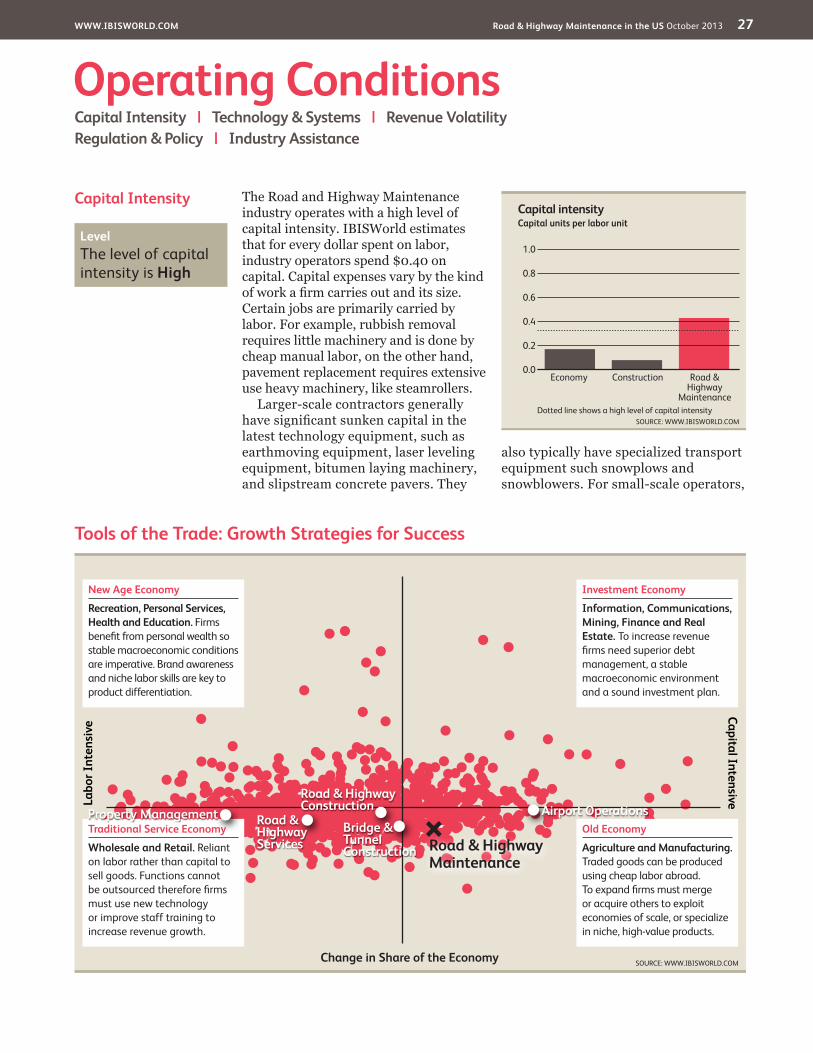
Capital Intensity The Road and Highway Maintenance industry operates with a high level of capital intensity. IBISWorld estimates that for every dollar spent on labor, industry operators spend $0.40 on capital. Capital expenses vary by the kind of work a firm carries out and its size. Certain jobs are primarily carried by labor. For example, rubbish removal requires little machinery and is done by cheap manual labor, on the other hand, pavement replacement requires extensive use heavy machinery, like steamrollers.
Larger-scale contractors generally have significant sunken capital in the latest technology equipment, such as earthmoving equipment, laser leveling equipment, bitumen laying machinery, and slipstream concrete pavers. They
also typically have specialized transport equipment such snowplows and snowblowers. For small-scale operators,
Operating ConditionsCapital Intensity | Technology & Systems | Revenue VolatilityRegulation & Policy | Industry Assistance
Tools of the Trade: Growth Strategies for Success
SOURCE: WWW.IBISWORLD.COM
Labo
r Int
ensi
veCapital Intensive
Change in Share of the Economy
New Age Economy
Recreation, Personal Services, Health and Education. Firms benefi t from personal wealth so stable macroeconomic conditions are imperative. Brand awareness and niche labor skills are key to product differentiation.
Traditional Service Economy
Wholesale and Retail. Reliant on labor rather than capital to sell goods. Functions cannot be outsourced therefore fi rms must use new technology or improve staff training to increase revenue growth.
Old Economy
Agriculture and Manufacturing. Traded goods can be produced using cheap labor abroad. To expand fi rms must merge or acquire others to exploit economies of scale, or specialize in niche, high-value products.
Investment Economy
Information, Communications, Mining, Finance and Real Estate. To increase revenue fi rms need superior debt management, a stable macroeconomic environment and a sound investment plan.
Road & Highway Construction Airport Operations
Road & Highway Services
Property ManagementBridge & Tunnel Construction Road & Highway
Maintenance
Capital intensity
1.0
0.0
0.2
0.4
0.6
0.8
SOURCE: WWW.IBISWORLD.COMDotted line shows a high level of capital intensity
Capital units per labor unit
Road & Highway
Maintenance
ConstructionEconomy
Level The level of capital intensity is High
WWW.IBISWORLD.COM Road & Highway Maintenance in the US October 2013 28
Operating Conditions
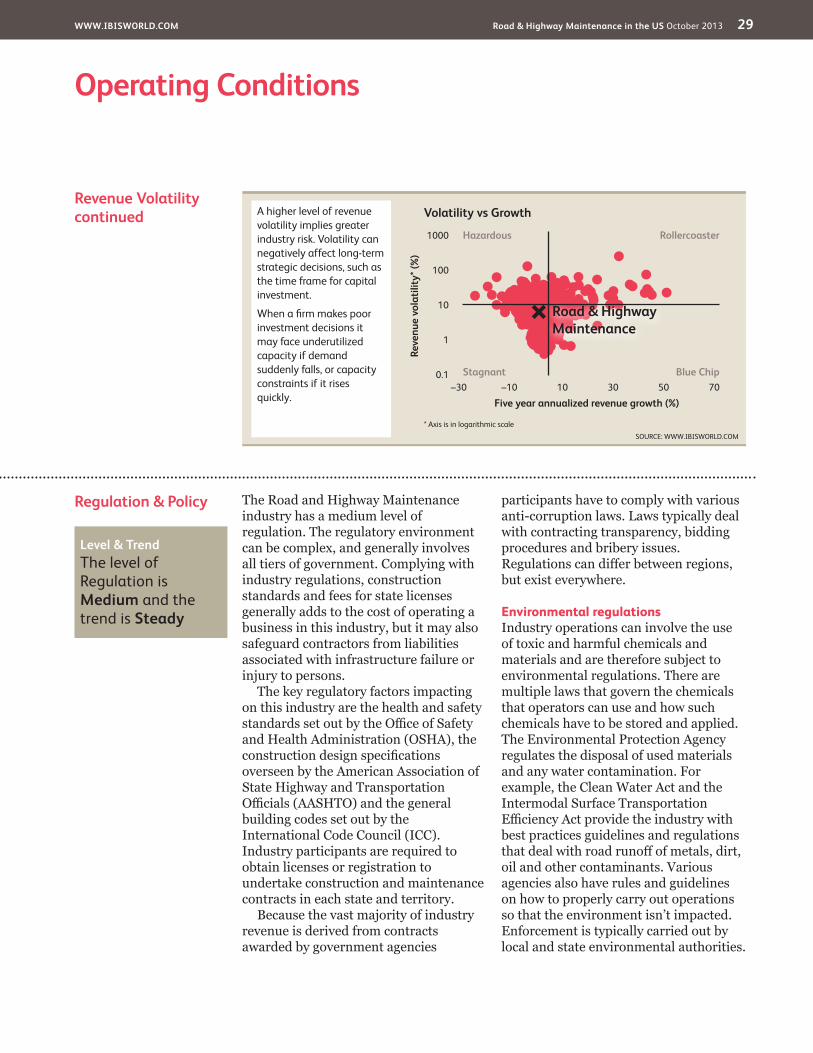
Revenue Volatility The Road and Highway Maintenance industry has a moderate level of revenue volatility. Industry revenue can be stabilized by long-term budgetary allocations for ongoing maintenance. Nevertheless, any disruption or changes in government funding can increase volatility. Revenue growth increased from 0.8% in 2008 to 7.9% in 2009 because of stimulus spending by the
federal government. However, when the stimulus money ran out, revenue dropped by as much as 4.0% in 2011. Volatility can also be increased by weather conditions because they cause sudden increases in demand for industry services (i.e. snow clearing, deicing and cleanup after tropical storms). Year-on-year revenue changes averaged 4.8% over the five years to 2013.
Technology& Systems
The Road and Highway Maintenance industry has a moderate level of technological change. The industry’s advancements are evident in the management of maintenance activities, and the construction materials and equipment used in maintenance.
Incremental improvements in road pavement design have tended to extend the lifespan of the pavement surface, which may reduce the maintenance requirement per road mile. State and local road authorities increasingly have adopted computer aided design (CAD) maintenance systems to monitor maintenance requirements on a particular road and efficiently allocate resources for maintenance. An example of recent innovation would be the Advanced Mobile Asset Collection (AMAC) system. It was developed by DBi in cooperation with Cidaut Technologies and consists of a vehicle attached instrument that measures
the reflectivity and performance of road signs. The data is then inputted into a database, where it can be analyzed and managed.
The equipment and materials used for maintenance projects is subject to incremental improvements, such as advancements in the chemicals used for deicing roads, or improvements in the design and operation of snowplows and snow blowers. Another example from DBi, would be the High Friction Surfacing Treatment system. The system consists of a truck that can apply friction treatment material to road surfaces with minimal labor. The treatment material uses a new mixture of chemicals and ingredients to increase road surface friction, which increases tire traction and therefore, reduces accidents.
Increasing use of GPS has allowed operators to keep track of projects and improve the precision of certain projects, like painting lanes.
Capital Intensitycontinued
much of the capital equipment required for can be leased on a piecemeal basis or subcontracted to specialist operators (e.g., earthmoving contractors, asphalt suppliers).
Over the past few years capital intensity has increased as companies have used more equipment to carry out tasks. Deteriorating funding for maintenance
work has encouraged many firms to cut labor and use machinery in order to increase profit margins. Competition for contracts and more performance oriented contract requirements will continue to increase capital intensity in the future, as companies rely on technology and newer machinery to speed up project times and efficiency.
Level The level of Technology Change is Medium
Level The level of Volatility is Medium
WWW.IBISWORLD.COM Road & Highway Maintenance in the US October 2013 29
Operating Conditions
Regulation & Policy The Road and Highway Maintenance industry has a medium level of regulation. The regulatory environment can be complex, and generally involves all tiers of government. Complying with industry regulations, construction standards and fees for state licenses generally adds to the cost of operating a business in this industry, but it may also safeguard contractors from liabilities associated with infrastructure failure or injury to persons.
The key regulatory factors impacting on this industry are the health and safety standards set out by the Office of Safety and Health Administration (OSHA), the construction design specifications overseen by the American Association of State Highway and Transportation Officials (AASHTO) and the general building codes set out by the International Code Council (ICC). Industry participants are required to obtain licenses or registration to undertake construction and maintenance contracts in each state and territory.
Because the vast majority of industry revenue is derived from contracts awarded by government agencies
participants have to comply with various anti-corruption laws. Laws typically deal with contracting transparency, bidding procedures and bribery issues. Regulations can differ between regions, but exist everywhere.
Environmental regulations Industry operations can involve the use of toxic and harmful chemicals and materials and are therefore subject to environmental regulations. There are multiple laws that govern the chemicals that operators can use and how such chemicals have to be stored and applied. The Environmental Protection Agency regulates the disposal of used materials and any water contamination. For example, the Clean Water Act and the Intermodal Surface Transportation Efficiency Act provide the industry with best practices guidelines and regulations that deal with road runoff of metals, dirt, oil and other contaminants. Various agencies also have rules and guidelines on how to properly carry out operations so that the environment isn’t impacted. Enforcement is typically carried out by local and state environmental authorities.
Revenue Volatilitycontinued
Level & Trend The level of Regulation is Medium and the trend is Steady
SOURCE: WWW.IBISWORLD.COM
Volatility vs Growth
Reve
nue
vola
tility
* (%
)
1000
100
10
1
0.1
Five year annualized revenue growth (%)–30 –10 10 30 50 70
Hazardous
Stagnant
Rollercoaster
Blue Chip
* Axis is in logarithmic scale
Road & Highway Maintenance
A higher level of revenue volatility implies greater industry risk. Volatility can negatively affect long-term strategic decisions, such as the time frame for capital investment.
When a fi rm makes poor investment decisions it may face underutilized capacity if demand suddenly falls, or capacity constraints if it rises quickly.
WWW.IBISWORLD.COM Road & Highway Maintenance in the US October 2013 30
Operating Conditions
Industry Assistance Industry participants usually receive no direct assistance from the government. However, the industry is heavily reliant of government funding. Additionally, the federal government provides states with road and highway funding, which can be seen as an indirect form of industry assistance.
During the height of the recession, Congress passed the American Recovery and Reinvestment Act. The law was a stimulus package that included some $48.0 billion for transportation projects throughout the nation. In particular, $750.0 million went to the maintenance of existing public transportation systems. The Safe, Accountable, Flexible, Efficient Transportation Equity Act: A Legacy for
Users (SAFETEA-LU) was a funding package signed into law in 2005 and through various extensions lasted until 2012. The bill allocated over $250.0 billion to federal surface transportation construction and maintenance projects. Most recently Congress passed the Moving Ahead for Progress in the 21st Century Act of 2012. The law allocates $105.0 billion to federal surface transportation projects over two years and amends and streamlines previous funding passed in the SAFETEA-LU.
In recent years, consistent budget controversies have created uncertainty in the level of future federal government spending on national road and highway construction and maintenance.
Regulation & Policycontinued
Occupational, health and safety regulationsWorkers in road construction and maintenance industries are exposed to a wide range of hazards from both inside and outside the work zone (e.g. falls, electrical accidents and collisions), but the industry is particularly susceptible to traffic at the worksite. OSHA oversees health and safety regulations governing the US economy and sets out specific standards governing the construction industry (code 1926). To protect highway construction workers from the dangers of traffic, OSHA sets out Standard 1926 Subpart G – Signs (.200), Signals (.201), and Barricades (.202) that provides guidance for the set-up of work zone and was derived from the Department of Transportation’s “Manual on Uniform Traffic Control Devices.”
Design and construction specificationsThe American Association of State Highway and Transportation Officials
(AASHTO) is the principal authority overseeing standards and specifications in the construction of roads, and bridges in the United States (e.g., highway pavement design, ride quality and roughness and noise emission). AASHTO points out that it is practically impossible to develop a national construction specification to encompass the many differences in climate, geology, geography, customs, statutes, and regulations across the US, and the guide provides for easy cross reference from state-to-state. The Guide Specifications for Highway Construction includes: Division 100 – General Provisions; Division 200 – Earthwork; Division 300 – Base Courses; Division 400 – Flexible Pavements; Division 500 – Rigid Pavement; Division 550 – Rehabilitation of Portland Cement Concrete Pavement; Division 600 – Miscellaneous Construction; Division 700 – Materials Requirements; and Division 800 – Structures.
Level & Trend The level of Industry Assistance is Medium and the trend is Steady
WWW.IBISWORLD.COM Road & Highway Maintenance in the US October 2013 31
Key StatisticsRevenue
($m)
Industry Value Added
($m)Establish-
ments Enterprises Employment Exports ImportsWages ($m)
Domestic Demand
Government fund-ing for highways
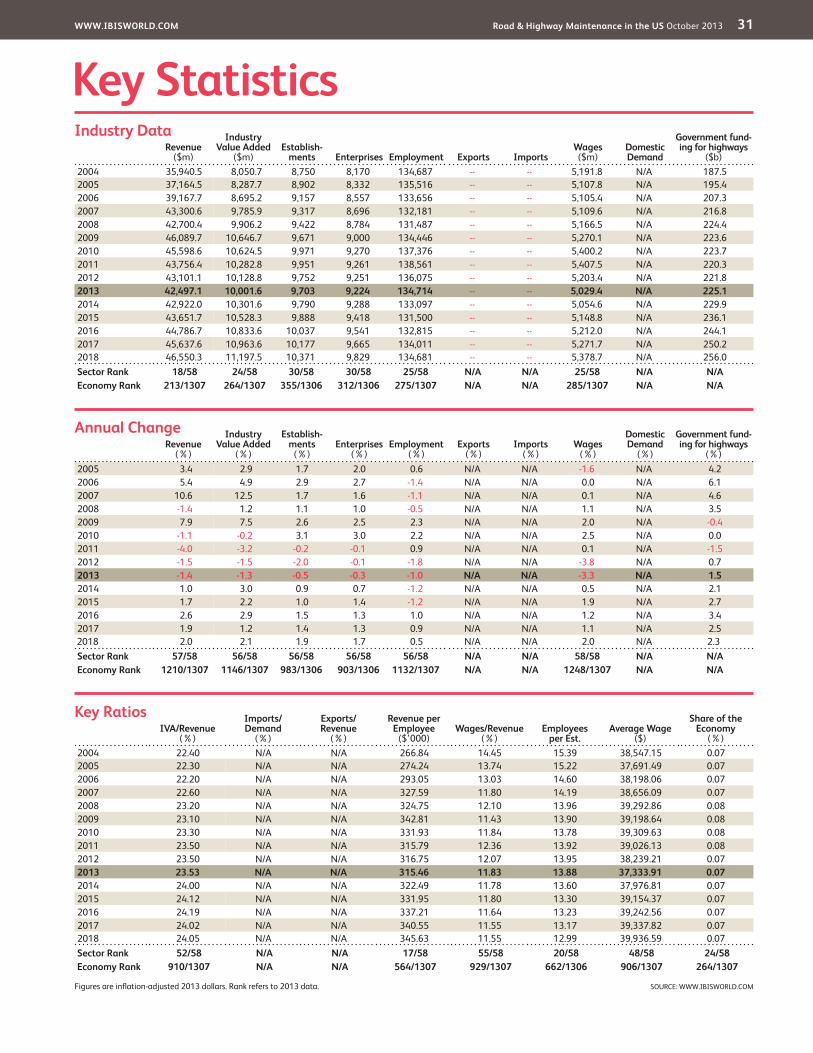
($b)2004 35,940.5 8,050.7 8,750 8,170 134,687 -- -- 5,191.8 N/A 187.52005 37,164.5 8,287.7 8,902 8,332 135,516 -- -- 5,107.8 N/A 195.42006 39,167.7 8,695.2 9,157 8,557 133,656 -- -- 5,105.4 N/A 207.32007 43,300.6 9,785.9 9,317 8,696 132,181 -- -- 5,109.6 N/A 216.82008 42,700.4 9,906.2 9,422 8,784 131,487 -- -- 5,166.5 N/A 224.42009 46,089.7 10,646.7 9,671 9,000 134,446 -- -- 5,270.1 N/A 223.62010 45,598.6 10,624.5 9,971 9,270 137,376 -- -- 5,400.2 N/A 223.72011 43,756.4 10,282.8 9,951 9,261 138,561 -- -- 5,407.5 N/A 220.32012 43,101.1 10,128.8 9,752 9,251 136,075 -- -- 5,203.4 N/A 221.82013 42,497.1 10,001.6 9,703 9,224 134,714 -- -- 5,029.4 N/A 225.12014 42,922.0 10,301.6 9,790 9,288 133,097 -- -- 5,054.6 N/A 229.92015 43,651.7 10,528.3 9,888 9,418 131,500 -- -- 5,148.8 N/A 236.12016 44,786.7 10,833.6 10,037 9,541 132,815 -- -- 5,212.0 N/A 244.12017 45,637.6 10,963.6 10,177 9,665 134,011 -- -- 5,271.7 N/A 250.22018 46,550.3 11,197.5 10,371 9,829 134,681 -- -- 5,378.7 N/A 256.0Sector Rank 18/58 24/58 30/58 30/58 25/58 N/A N/A 25/58 N/A N/AEconomy Rank 213/1307 264/1307 355/1306 312/1306 275/1307 N/A N/A 285/1307 N/A N/A
IVA/Revenue (%)
Imports/ Demand
(%)
Exports/ Revenue
(%)
Revenue per Employee
($’000)Wages/Revenue
(%)Employees
per Est.Average Wage
($)
Share of the Economy
(%)2004 22.40 N/A N/A 266.84 14.45 15.39 38,547.15 0.072005 22.30 N/A N/A 274.24 13.74 15.22 37,691.49 0.072006 22.20 N/A N/A 293.05 13.03 14.60 38,198.06 0.072007 22.60 N/A N/A 327.59 11.80 14.19 38,656.09 0.072008 23.20 N/A N/A 324.75 12.10 13.96 39,292.86 0.082009 23.10 N/A N/A 342.81 11.43 13.90 39,198.64 0.082010 23.30 N/A N/A 331.93 11.84 13.78 39,309.63 0.082011 23.50 N/A N/A 315.79 12.36 13.92 39,026.13 0.082012 23.50 N/A N/A 316.75 12.07 13.95 38,239.21 0.072013 23.53 N/A N/A 315.46 11.83 13.88 37,333.91 0.072014 24.00 N/A N/A 322.49 11.78 13.60 37,976.81 0.072015 24.12 N/A N/A 331.95 11.80 13.30 39,154.37 0.072016 24.19 N/A N/A 337.21 11.64 13.23 39,242.56 0.072017 24.02 N/A N/A 340.55 11.55 13.17 39,337.82 0.072018 24.05 N/A N/A 345.63 11.55 12.99 39,936.59 0.07Sector Rank 52/58 N/A N/A 17/58 55/58 20/58 48/58 24/58Economy Rank 910/1307 N/A N/A 564/1307 929/1307 662/1306 906/1307 264/1307
Figures are inflation-adjusted 2013 dollars. Rank refers to 2013 data.
Revenue (%)
Industry Value Added
(%)
Establish-ments
(%)Enterprises
(%)Employment
(%)Exports
(%)Imports
(%)Wages
(%)
Domestic Demand
(%)
Government fund-ing for highways
(%)2005 3.4 2.9 1.7 2.0 0.6 N/A N/A -1.6 N/A 4.22006 5.4 4.9 2.9 2.7 -1.4 N/A N/A 0.0 N/A 6.12007 10.6 12.5 1.7 1.6 -1.1 N/A N/A 0.1 N/A 4.62008 -1.4 1.2 1.1 1.0 -0.5 N/A N/A 1.1 N/A 3.52009 7.9 7.5 2.6 2.5 2.3 N/A N/A 2.0 N/A -0.42010 -1.1 -0.2 3.1 3.0 2.2 N/A N/A 2.5 N/A 0.02011 -4.0 -3.2 -0.2 -0.1 0.9 N/A N/A 0.1 N/A -1.52012 -1.5 -1.5 -2.0 -0.1 -1.8 N/A N/A -3.8 N/A 0.72013 -1.4 -1.3 -0.5 -0.3 -1.0 N/A N/A -3.3 N/A 1.52014 1.0 3.0 0.9 0.7 -1.2 N/A N/A 0.5 N/A 2.12015 1.7 2.2 1.0 1.4 -1.2 N/A N/A 1.9 N/A 2.72016 2.6 2.9 1.5 1.3 1.0 N/A N/A 1.2 N/A 3.42017 1.9 1.2 1.4 1.3 0.9 N/A N/A 1.1 N/A 2.5
2018 2.0 2.1 1.9 1.7 0.5 N/A N/A 2.0 N/A 2.3Sector Rank 57/58 56/58 56/58 56/58 56/58 N/A N/A 58/58 N/A N/AEconomy Rank 1210/1307 1146/1307 983/1306 903/1306 1132/1307 N/A N/A 1248/1307 N/A N/A
Annual Change
Key Ratios
Industry Data
SOURCE: WWW.IBISWORLD.COM
WWW.IBISWORLD.COM Road & Highway Maintenance in the US October 2013 32
Jargon & Glossary
BARRIERS TO ENTRY High barriers to entry mean that new companies struggle to enter an industry, while low barriers mean it is easy for new companies to enter an industry.
CAPITAL INTENSITY Compares the amount of money spent on capital (plant, machinery and equipment) with that spent on labor. IBISWorld uses the ratio of depreciation to wages as a proxy for capital intensity. High capital intensity is more than $0.333 of capital to $1 of labor; medium is $0.125 to $0.333 of capital to $1 of labor; low is less than $0.125 of capital for every $1 of labor.
CONSTANT PRICES The dollar figures in the Key Statistics table, including forecasts, are adjusted for inflation using the current year (i.e. year published) as the base year. This removes the impact of changes in the purchasing power of the dollar, leaving only the “real” growth or decline in industry metrics. The inflation adjustments in IBISWorld’s reports are made using the US Bureau of Economic Analysis’ implicit GDP price deflator.
DOMESTIC DEMAND Spending on industry goods and services within the United States, regardless of their country of origin. It is derived by adding imports to industry revenue, and then subtracting exports.
EMPLOYMENT The number of permanent, part-time, temporary and seasonal employees, working proprietors, partners, managers and executives within the industry.
ENTERPRISE A division that is separately managed and keeps management accounts. Each enterprise consists of one or more establishments that are under common ownership or control.
ESTABLISHMENT The smallest type of accounting unit within an enterprise, an establishment is a single physical location where business is conducted or where services or industrial operations are performed. Multiple establishments under common control make up an enterprise.
EXPORTS Total value of industry goods and services sold by US companies to customers abroad.
IMPORTS Total value of industry goods and services brought in from foreign countries to be sold in the United States.
INDUSTRY CONCENTRATION An indicator of the dominance of the top four players in an industry. Concentration is considered high if the top players account for more than 70% of industry revenue. Medium is 40% to 70% of industry revenue. Low is less than 40%.
INDUSTRY REVENUE The total sales of industry goods and services (exclusive of excise and sales tax); subsidies on production; all other operating income from outside the firm (such as commission income, repair and service income, and rent, leasing and hiring income); and capital work done by rental or lease. Receipts from interest royalties, dividends and the sale of fixed tangible assets are excluded.
INDUSTRY VALUE ADDED (IVA) The market value of goods and services produced by the industry minus the cost of goods and services used in production. IVA is also described as the industry’s contribution to GDP, or profit plus wages and depreciation.
INTERNATIONAL TRADE The level of international trade is determined by ratios of exports to revenue and imports to domestic demand. For exports/revenue: low is less than 5%, medium is 5% to 20%, and high is more than 20%. Imports/domestic demand: low is less than 5%, medium is 5% to 35%, and high is more than 35%.
Industry Jargon
IBISWorld Glossary
FUNCTIONALLY OBSOLETE (FO) FO generally refers to bridges built to standards that are no longer used. A determination that a bridge is FO does not automatically designate that bridge as structurally deficient or unsafe.
LANE MILES Length of a road or highway’s center line multiplied by the number of lanes
PUBLIC PRIVATE PARTNERSHIP An agreement in which the public sector hands over some kind of infrastructure responsibility to the private sector for a specific amount of time.
SAFETEA-LU Safe, Accountable, Flexible, Efficient Transport Equity Act – A legacy for Users; the act is the third in a series of federal multiyear transport infrastructure funding programs (2005).
SHOVEL-READY PROJECT A project that can commence within a short time frame; i.e. funds and labor can be committed in 90 to 120 days on infrastructure projects.
STRUCTURALLY DEFICIENT (SD) A bridge’s road carrying elements are found to be in poor condition due to deterioration or the inadequacy of the opening provided by the bridge causes intolerable traffic interruptions.

WWW.IBISWORLD.COM Road & Highway Maintenance in the US October 2013 33
Jargon & Glossary
LIFE CYCLE All industries go through periods of growth, maturity and decline. IBISWorld determines an industry’s life cycle by considering its growth rate (measured by IVA) compared with GDP; the growth rate of the number of establishments; the amount of change the industry’s products are undergoing; the rate of technological change; and the level of customer acceptance of industry products and services.
NONEMPLOYING ESTABLISHMENT Businesses with no paid employment or payroll, also known as nonemployers. These are mostly set up by self-employed individuals.
PROFIT IBISWorld uses earnings before interest and tax (EBIT) as an indicator of a company’s profitability. It is calculated as revenue minus expenses, excluding interest and tax.
VOLATILITY The level of volatility is determined by averaging the absolute change in revenue in each of the past five years. Volatility levels: very high is more than ±20%; high volatility is ±10% to ±20%; moderate volatility is ±3% to ±10%; and low volatility is less than ±3%.
WAGES The gross total wages and salaries of all employees in the industry. The cost of benefits is also included in this figure.
IBISWorld Glossary continued

Disclaimer
This product has been supplied by IBISWorld Inc. (‘IBISWorld’) solely for use by its authorized licensees strictly in accordance with their license agreements with IBISWorld. IBISWorld makes no representation to any other person with regard to the completeness or accuracy of the data or information contained herein, and it accepts no responsibility and disclaims all liability (save for liability which cannot be lawfully disclaimed) for loss or damage whatsoever suffered or incurred by any other person resulting from
the use of, or reliance upon, the data or information contained herein. Copyright in this publication is owned by IBISWorld Inc. The publication is sold on the basis that the purchaser agrees not to copy the material contained within it for other than the purchasers own purposes. In the event that the purchaser uses or quotes from the material in this publication – in papers, reports, or opinions prepared for any other person – it is agreed that it will be sourced to: IBISWorld Inc.
At IBISWorld we know that industry intelligence is more than assembling factsIt is combining data with analysis to answer the questions that successful businesses askIdentify high growth, emerging & shrinking marketsArm yourself with the latest industry intelligenceAssess competitive threats from existing & new entrantsBenchmark your performance against the competitionMake speedy market-ready, profit-maximizing decisions
Who is IBISWorld?We are strategists, analysts, researchers, and marketers. We provide answers to information-hungry, time-poor businesses. Our goal is to provide real world answers that matter to your business in our 700 US industry reports. When tough strategic, budget, sales and marketing decisions need to be made, our suite of Industry and Risk intelligence products give you deeply-researched answers quickly.
IBISWorld MembershipIBISWorld offers tailored membership packages to meet your needs.
Copyright 2013 IBISWorld Inc
www.ibisworld.com | 1-800-330-3772 | [email protected]