high temperature hydrogen sulfide and carbonyl sulfide removal with manganese oxide (mno) and iron...
TRANSCRIPT
Ind. Eng. Chem. Res. 1993,32, 139-149 139
Kojima, T.; Furusaki, S.; Saito, K. A. Fundamental Study on Re- covery of Copper with a Cation Exchange Membrane Part 2- Transfer Rate of Copper and Hydrogen Ion Through a Cation Exchange Membrane. Can. J . Chem. Eng. 1982, 60, 650458.
Lonsdale, H. K. The Growth of Membrane Technology. J . Membr.
Martell, A. E.; Smith, R. M. Critical Stability Constant; Plenum: New York, 1974; Vol. 1.
Maetsuyama, H.; Fujii, K.; Teramoto, M. Selective Separation of Rare Earth Metals by Donnan Dialysis in the Presence of Water-Soluble Complexing Agent. J . Chem. Eng. Jpn. 1991,24,
Morel, F. M. M. Principles of Aquatic Chemistry; Wiley-Intersci- ence: New York, 1983; Chapter 6.
Neihof, R.; Sollner, K. The Physical Chemistry of the Differential &tea of Permeation of Ions Across Porous Membranes. Disscws. Faraday SOC. 1956,21, 94-101.
S C ~ . 1982, 10, 81-181.
253-255.
Newman, J. S. Electrochemical Systems; Prentice-Halk Englewd Cliffs, NJ, 1960; Chapter 7.
Sudoh, M.; Kameri, H.; Nakamnura, S. Donnan Dialysis Concen- tration of Cupric Ions. J. Chem. Eng. Jpn. 1987,20, 34-40.
Takahashi, K.; Tsuboi, K.; Takeuchi, H. Mass Transfer across Cation Exchange Membrane. J . Chem. Eng. Jpn. 1989, 22, 352-357.
Wallace, R. M. Concentration and Separation of Ions by Donnan Membrane Equilibrium. Ind. Eng. Chem. Process Des. Deu. 1967,
Wen, C. P.; Hamil, H. F. Metal Counterion Transport in Donnan
Wills, G. B.; Lightfoot, E. N. Membrane Selectivity. MChE J. 1961,
Received for review April 28, 1992 Revised manuscript received September 16, 1992
Accepted October 3, 1992
6, 423-431.
Dialysis. J . Membr. Sci. 1981, 8, 51-68.
7, 213-276.
High Temperature H2S and COS Removal with MnO and FeO on yA1203 Acceptors
J. Peter Wakker,? Albert W. Gerritsen, and Jacob A. Moulijn* Department of Chemical Engineering, Delft University of Technology, Julianalaan 136, 2628 BL Delft, The Netherlands
A process has been developed to remove H2S and COS at high temperatures (675-1075 K) from fuel gases produced by a coal gasification plant. The process uses MnO or FeO on y-A1203 acceptors which can be regenerated after sulfidation with a gas containing steam. The acceptors should be used in a fixed bed or moving bed reactor. It is important to know what influence the raw fuel gas composition of a coal gasification plant and operating temperature and pressure have on the sul- fidation behavior of the acceptors. Experiments are carried out in a laboratory setup to determine these influences. After an initial deactivation the acceptors can be used over 400 sulfidation-re- generation cycles. Water adversely affects the capacity, whereas CO favors the capacity due to the watewas shift reaction. Trace compounds can influence the capacity negatively as, e.g., HC1, whereas hydrocarbons do not influence acceptor performance. An optimum between capacity and stability is reached a t a operating temperature of 875 K. An increasing pressure does not influence the sulfidation reaction, but the water-gas shift reaction may be positively influenced.
Introduction The composition of a raw fuel gas produced by a coal
gasifier can vary over a wide range, depending upon the type of gasifier (fixed bed, fluidized bed, entrained bed) and the type of coal used. The main compounds produced by a gasifier are CO, H2, COz, HzO, N2, H2S, and COS. There are large differences in gas composition. The hy- drogen concentration varies from 29 to 40 vol %, the carbon monoxide concentration even from 16 to 65 vol % , the carbon dioxide concentration between 1 and 31 vol % , water between 1 and 20 vol %, hydrogen sulfide plus carbonyl sulfide between 0.1 and 1.5 vol %, and methane (and traces of other hydrocarbons) between 0 and 10 vol % (Brainard, 1982a,b; Miles, 1976; Nelson, 1979a-c; Schilling et al., 1979; Schlinger and Richtor, 1980; Shap- pert, 1983; Synthesis Fuel Associates, 1983). The fuel gas can be used to produce electricity, as a synthesis gas or as a reducing gas. In this paper we mainly consider the use of the fuel gas to produce electricity in a coal gasification combined cycle (CGCC) power plant. Before the fuel gas can be used it must be cleaned. A wide variety of existing commercial and well-developed gas processing systems is available for the removal of sulfur, ammonia, and other undesirables from the fuel gas. In general these are low
Present address: Akzo Chemicals bv., P.O. Box 10,7400 AA Deventer, The Netherlands.
temperature processes involving the use of various liquids with either an organic or aqueous base. Consequently, the gas must be cooled before admission to the scrubbing towers. However, when gas cleaning is carried out at high temperatures, the overall efficiency can be improved and lead to lower kilowatt-hour prices. In high temperature gas cleaning the following steps can be distinguished: dust removal, desulfurization, removal of halogens, removal of alkali metals and other trace compounds, and the removal of nitrogeneous compounds.
A number of proceases for high temperature regenerative H2S removal is currently under investigation. The most important ones use zinc ferrite (e.g. Ayala and Marsh, 1991), zinc titanate (e.g. Gangwal et al., 1989) and copper based sorbents (Desai and Brown, 1990). The main dis- advantages of these processes are the limited applicability and the regeneration route. When these sorbent materials are used in highly reducing gases, as, e.g., the case with the Shell gasification process, the metal oxide is reduced into the metallic state, or metal carbides are formed. This results in loss of strength and capacity of the sorbent.
Regeneration of these sorbents is carried out with an oxygen/nitrogen mixture. The regeneration is a highly exothermic reaction, and therefore only low oxygen con- centrations can be used. SOz is formed in low concen- trations. Further, the regeneration is complicated by sulfate formation. Due to the oxidative character of the regeneration, inevitable hydrogen consumption takes place
0888-5885/93/2632-0139$04.00/0 0 1993 American Chemical Society
140 Ind. Eng. Chem. Res., Vol. 32, No. 1,1993
during the next sulfidation. This hydrogen can be better used to produce electricity.
Two processes which possibly can produce elemental sulfur during regeneration are the mixed metal oxide process (Anderson and Hill, 1988) and iron oxide on silica (Wal, 1987), but both processes have not been proven yet.
The process discuased in this paper can overcome several of the disadvantages of the above processes. The acceptors tested are able to remove H2S from the fuel gas to levels less than 20 ppm according to the following reaction: MeO/7-A1203 + H2S e
Me = Mn or Fe (1) It has been proven by Wakker (1992) that the active compound in this reaction is a metal aluminate, MeA1204 (Me = Mn or Fe), making steam regeneration of the sul- fided acceptor material possible. Also other reactions occur, e.g., the water gas shift reaction and COS formation and capture. COS may be removed by direct reaction with the acceptor, or may be converted to H a which reacts with the acceptor according to reaction 1. The performance of the acceptors is strongly dependent upon gas composition and process variables such as temperature. Especially the water concentration is expected to have a strong influence on the acceptor performance as water shifts the equilib- rium in reaction 1 to the left. Therefore, the acceptor can be regenerated with a gas containing steam and H2S is formed back in a high concentration.
Moreover, the gas produced by a coal gasifier can contain a number of compounds which may deactivate the acceptor or influence the acceptor performance negatively by blocking active sites. Among these compounds are heavy metals, HC1, HF, NH3, and HCN, and hydrocarbons. Because it is impractical to add heavy metals in low con- centrations to a synthetic gas mixture, one best can observe the influence of heavy metals by carrying out experiments under realistic conditions. These experiments are de- scribed elsewhere by Wakker and Gerritsen (1990b). The expected HCl concentrations for the Shell and Texaco gasification processes, fed with Australian Wambo coal, are 600 and 500 ppm and the HF concentrations 224 and 188 ppm, respectively. Wambo coal only contains 0.05 wt % Cl and 0.01 wt % F on a dry base (Alderliesten et al., 1990). Tests done with HC1 and hydrocarbons will be discussed in this paper as well.
Experimental Section Acceptor Preparation. The acceptor material is pre-
pared by wet impregnation. The carrier (7-A1203, AKZO/Ketjen 001-1.5E, ground and sieved, particle di- ameter 0.25-0.42 mm, surface area 260 m2/g) is added to the impregnation solution (3.3 mL of solution/g of carrier) and shaken a few times during impregnation. The im- pregnation time is about 16 h. For preparation of a manganese containing acceptor, a 2 M manganese acetate (Merck, pa.) solution is used. An iron containing acceptor is prepared from an 1 M iron(II1) ammonium oxalate (Riedel de Hiihn, p.a.) solution. After impregnation the material ie filtered, dried at room temperature during 5-6 h, and calcined in static air a t 575 K during 60 h. The manganese is now present as Mn02 or Mn203, and iron, as Fez03 or Fe30,. The last step in preparation is reduc- tion, carried out in situ in the reactor a t reaction tem- perature to obtain the active metal aluminate, MnAl2O4 or FeA1201. The manganese containing acceptors consisted of 7.10-8.23 wt % Mn on 7-A120, and the iron containing acceptor of 4.64 wt % Fe on 7-Al2OP Fresh acceptors have a surface area of 180-200 m2/g and an average pore di- ameter of 4-5 nm.
MeS/y-A1203 + H20
Instrumental Details. The apparatus used to obtain the sulfidation-regeneration cycles is described in detail by Wakker and Gerritsen (1990a). The laboratory setup consists of a gas dosage section, a fixed bed reactor, and an analysis section. In the gas dosage section oxygen and water are removed from all gases, except for H2S, HC1, and hydrocarbons which are used without further purification. After passing mass flow controllers, the gas flows are mixed and flow to the reactor (a quartz tube). The reactor feed contains 0-70 vol % CO, 0-40 vol '3% H2, 0-15 vol ?& H20, 0-10 vol % hydrocarbons, 0-1 vol % HC1,0-1 vol % COS, 0-1 vol % H2S, the balance being Np The tests are carried out a t temperatures between 675 and 1075 K, using 3 g of acceptor material. The total flow rate was always kept at 67.5 pmol/min. When tests are carried out with water in the feed gas, small fluctuations in the H2S concentration leaving the reactor are observed due to a not completely stable H20 dosage. After breakthrough, the H2S dosage is stopped and the acceptor material is regenerated with a gas containing steam. This is done by injecting liquid water into the reactor where it evaporates and is heated to reaction temperature before reaching the acceptor material. The amount of H2S leaving the reactor is mea- sured by a continuous titration system. An additional gas chromatographic analysis of the reactor effluent compo- sition is carried out when COS, C02, and H20 concentra- tions also have to be measured. After regeneration a new sulfidation-regeneration cycle is started.
When experiments were carried out a t elevated pressure, the quartz reactor tube was replaced by a stainless steel (RVS 316) reactor with the same internal diameter. This reactor could only be used up to 725 K because at higher temperatures the steel reacts with H2S, thus causing in- correct experimental data. Therefore another reactor, made of a ferritic stainless steel (an Al-CI-Fe alloy), which does not react with H2S up to temperatures of 1075 K, has been used as well. The internal diameter of this reactor was 12 mm. For the same bed length and residence time to be obtained, 5.1 g of acceptor was used and the flow rate was increased to 178 pmol/min. The pressure was varied in the range of 0.1-0.5 MPa.
Results and Discussion Acceptor Deactivation. Whenever a fresh acceptor
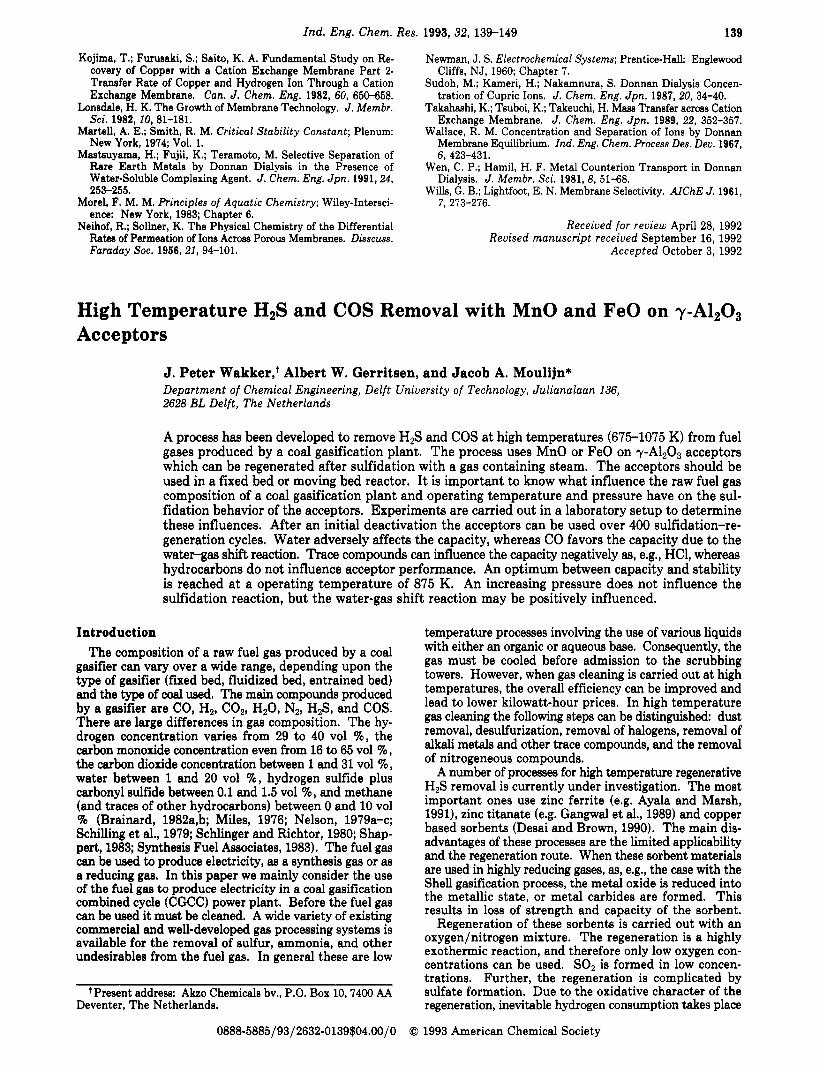
is tested, a stable performance is obtained only after an initial period of deactivation. During this period the suLfur removal capacity decreases with time. As shown in Figure lA, the deactivation process is quite strong during the first five to ten sulfidation-regeneration cycles a t 875 K; the breakthrough capacity (the amount of sulfur captured at breakthrough of the acceptor bed, or, in other words, the amount of sulfur captured at the moment the H2S con- centration in the reactor exit rises above 100 ppm) of a fresh manganese containing acceptor decreases from about 1.7 wt % S to about 0.8 wt % S. The decrease in break- through capacity between the first and the second cycle is caused by the sulfidation of MnO present as small crystallites which can be sulfded but not regenerated with steam. Temperature programmed sulfidation (TPS) (Wakker, 1992) measurements showed that the formation of MnA120, is relatively slow; not all MnA1204 is formed after reduction of the acceptor in the reactor. Moreover, part of the MnA120 cannot be sulfided as ita reactivity is too low at 875 K. Only when higher temperatures are applied (e.g. 1075 K) can all MnA1204 be sulfided.
In the next 40 sulfidation-regeneration cycles the deactivation slows down: f i y the breakthrough capacity becomes constant a t about 0.65 wt % S, but it may be higher for other acceptor batches. The decrease in
Ind. Eng. Chem. Res., Vol. 32, No. 1, 1993 141
.- 0
c M
8 $ 1
i Y
1 .oo R #
0.00 .... 0 50 100 150 200 250 300 350
Cycle number [-I Figure 1. Deactivation of MnO/y-A1203 and Fe0/y-Al2O3 at 875 K: (A, top) = 7.1 wt % Mn on y-A120,; (B, bottom) A = 4.6 wt % Fe on yA1203.
breakthrough capacity during these 40 cycles is caused by a decrease in the surface area of the acceptor; the surface area decreases from about 200 to about 140 m2/g. The sulfur capture capacity remains almost constant at this level for at least 400 sflidation-regeneration cycles. The same change in the breakthrough capacity can be observed for the iron containing acceptor (Figure 1B). Due to its lower metal content a fresh acceptor has a breakthrough capacity of about 1 wt % S. This value decreases to a stable capacity of about 0.45 wt % S.
The deactivation is negligibly slow at 657 K, whereas it is much faster and stronger at 1075 K. Deactivation is not caused by an accumulation of sulfur on the acceptor: the amount of sulfur regenerated equals the amount of sulfur captured, except for the first cycle.
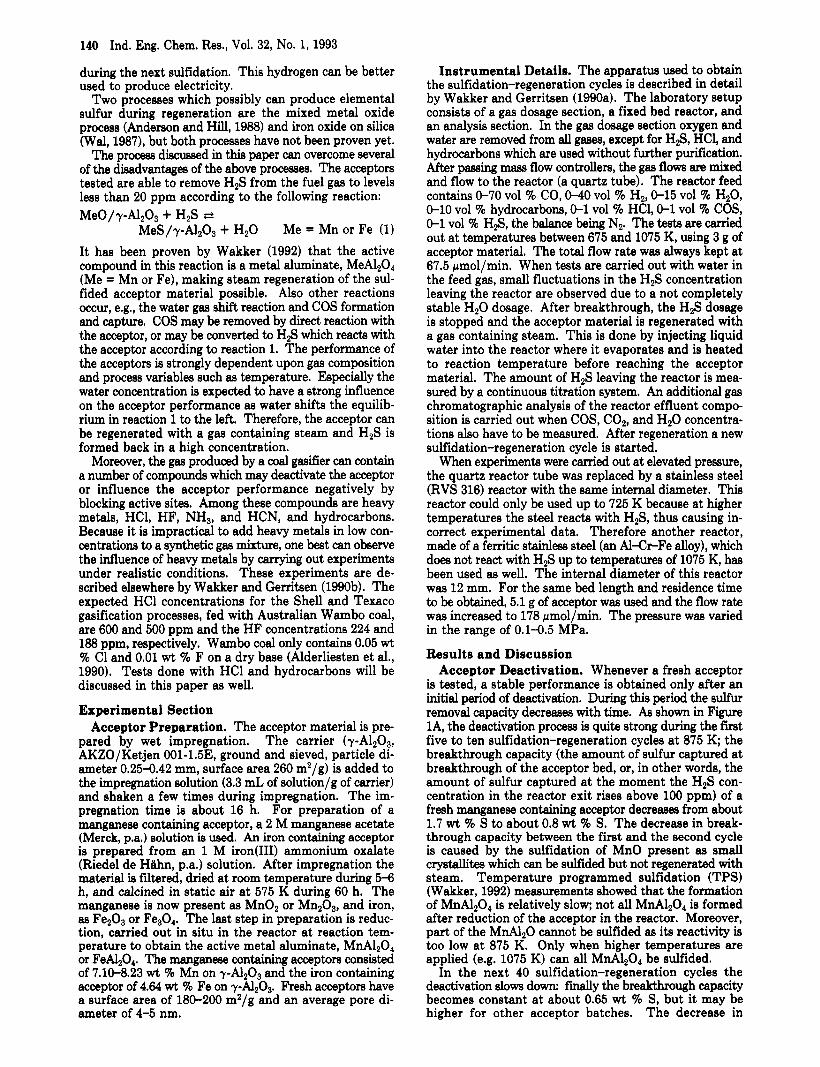
Influence of Temperature on Acceptor Capacity. The influence of temperature on acceptor capacity can be obtained in two different ways. The first way is to stabilize the acceptor at a certain high temperature, here 875 or 1075 K, and then to measure the breakthrough capacity at lower temperatures, here from 675 to 875 K and from 875 to 1075 K. The results obtained in this way are shown in Figure 2 for both the manganese and the iron containing acceptors. In this way the effect of temperature on breakthrough capacity is demonstrated because at all temperatures the testa are carried out with the same, stabilized material. It is clear that higher temperatures favor the breakthrough capacity, but also deactivation due to excessive sintering of the acceptor. This is shown clearly by the breakthrough capacities at 875 K for the materials stabilized at 875 and 1075 K, respectively. The latter has a breakthrough capacity that is about 50% lower than that of the acceptor stabilized at 875 K. The difference in capacity can be explained by the surface area of the ac- ceptor. The acceptor stabilized at 875 K has a surface area of 141 m2/g, and the acceptor stabilized at 1075 K, one of 70 m2/g.
The eecond way to study the effect of temperature is to start with a fresh acceptor that was used for a certain number of cycles at a low temperature, here 675 K. Such an acceptor did not deactivate appreciably. The influence of temperature is determined by increasing the tempera-
3
6
/ P
0 ' 1
6 2 5 1 2 5 825 925 1025 1125
Temperature (K)
Figure 2. Influence of temperature on breakthrough capacity of stabilized acceptors: A = 8.2 w t % Mn; A = 8.1 w t % Mn; = 4.5 wt % Fe; 0 = 4.6 wt % Fe on -pA1203
1'50 I
0.00 2 h!iO 700 750 800 850 900
Temperature ( K )
Figure 3. Influence of temperature on breakthrough capacity of a nonstabilized acceptor: = 9.1 w t % Mn/y-AI2O3
ture (e.g. with steps of 50 K) and measuring the break- through capacity. In this case the acceptor will have different characteristics at each temperature (e.g. surface area), but it will more closely correspond to the material

142 Ind. Eng. Chem. Res., Vol. 32, NO. 1, 1993
I
f O O L
F
5 a B 0 5 0 - \ '
0.00 ' " " " " " " 0 5 10 15
Water content of feed (Wv) Figure 4. Influence of the water concentration on breakthrough capacity at 875 K: = 7.1 wt '3% Mn; 0 = 4.6 wt % Fe on y-A1203. Feed: 1 vol % HzS; 10 vol % Hz, x vol % HzO; Nz (balance).
which would be used at that temperature in reality. Figure 3 shows the results of these measurements. It is obvious that the breakthrough capacity of an acceptor used for a long time at 875 K will decrease to the value shown in Figure 2. At 875 K an optimum is reached between the capacity and stability (lifetime) of the acceptor.
Influence of Water in the Feed Gas. The effect of the water concentration in the feed gas on breakthrough capacity is shown in Figure 4. The upper line shows the influence of water on an iron containing acceptor; the lower line, on a manganese containing acceptor. Because the results obtained have to be corrected for acceptor deac- tivation, and to facilitate comparison of different acceptors (e.g. different metal loadings), the breakthrough capacity is shown on a relative scale. The breakthrough capacity with a dry feed gas is used as a reference and given the value 1. Because the breakthrough capacity with a dry feed is 1 w t 90 S in most cases, the relative breakthrough capacity can be compared directly with the normal breakthrough capacity. As can be seen from Figure 4, water strongly decreases
acceptor capacity. The influence is relatively strongest at low water concentrations. The presence of 2.8 vol % water lowers the breakthrough capacity by almost 40% for the manganese containing acceptor; a water concentration to 13.8 vol % results in a decrease of 75% in breakthrough capacity. This means that the higher the water concen- tration is, the smder the effect of an increase in the water concentrations is. The effects of water in the feed gas are less strong when an iron containing acceptor is used. This effect can be explained by the calculated equilibrium constants of the sulfidation reaction: in the case of MnA120, the equilibrium constant is about 1 at 875 K, whereas the equilibrium constant for FeA1204 is about 2 at the same temperature. So, FeA1204 will be less affected by the presence of water. The negative effect of water was expected because the sulfidation reaction (reaction 1) will shift to the left side if water is added to the feed gas.
More information can be obtained from complete sul- fidation curves measured at different water concentrations. In Figure 5 breakthrough curves are shown of the man- ganese containing acceptor. Curve A corresponds to a reference feed gas containing no water. Curves B and C correspond to a feed containing 2.8 and 6.1 vol % H20, respectively. On the ordinate a dimensionless gas-phase concentration Xa is shown:
Xa = Ca/G (2)
where X, = dimensionless gas-phase concentration of H2S, C, = gas-phase concentration of H2S (mol/m3), and Co =
0.00 ~ " ' ~ l i ~ ' ' ' ' " ' " ' " ' " " ' " ' " ' " " ' " " " ~ ' 0 500 1000 1500 2000 2500 3000 3500 4000 4500
Time (s)
Figure 5. Breakthrough curves at 875 K for different water con- centrations: (A) 0 vol % H20; (B) 2.8 vol % HzO (C) 6.1 vol % HzO. Acceptor: 7.1 wt % Mn/r-AlzO,.
3 1 I - t I
0 " " " " ' " " " 0 10 20 30 40 50 60 70
Carbon monoxide content of feed ( % v )
Figure 6. Influence of carbon monoxide and hydrogen concentra- tion on breakthrough capacity at 875 K; 0 = 7.1 wt % Mn/y-Alz03 B, A = 4.6 wt % Fe/y-Alz03.
gas-phase concentration of H2S in the feed (mol/m3). The abscissa gives the time proceeded after introduction of Ha in the reactor feed or, in other words, after the beginning of the sulfidation.
It is clear that the breakthrough capacity decreases as the breakthrough point shifts to a shorter time. The shape of the sulfidation curve changes also. In the case of feed containing no water, the acceptor keeps on capturing 10-2070 of the H2S present in the feed gas during a long time after breakthrough. When water is added, the breakthrough curve resembles more or less a step. After breakthrough almost no H2S is captured. This effect is strongest a t the highest water concentration. The break- through curve closely corresponds to the curve predicted by the equilibrium theory (Soerawidjaja, 1985).
Influence of Carbon Monoxide and Hydrogen in the Feed Gas. As carbon monoxide and hydrogen are the key compounds formed during gasification of coal, their in- fluence on sulfidation behavior and breakthrough capacity is crucial. The influence of carbon monoxide and hydrogen on breakthrough capacity is shown in Figure 6. Again the breakthrough capacity of a feed gas containing N2, H2, and H2S only is used as a reference and given the value 1. It is clear that carbon monoxide has a positive effect on breakthrough capacity. The breakthrough capacity can increase by a factor of up to 2.5. When the hydrogen concentration is increased, the positive effect of carbon monoxide is less pronounced.
The effect of carbon monoxide and the effect of hy- drogen on breakthrough capacity can be explained by the water-gas shift reaction:
Ind. Eng. Chem. Res., Vol. 32, No. 1, 1993 143
CO + H20 H2 + COP (3)
Carbon monoxide consumes the water produced by reac- tion 1 during sulfidation and increases the driving force for the same reaction by lowering the water concentration in the acceptor. Hydrogen and carbon dioxide are products of the shift reaction. Therefore, both hydrogen and carbon dioxide present in the feed gas will lower the amount of water converted via the shift reaction and thus the amount of H2S captured by the acceptor.
In literature two mechanisms for the shift reaction are described, the so-called regenerative mechanism and the so-called associative mechanism. The regenerative mech- anism (Rethwisch and Dumesic 1986a,b; Newsome, 1980) proceeds via reduction of the metal oxide with CO and subsequent oxidation with H20, e.g., in the case of Fe304 (magnetite):
(4)
(5 )
It is not very likely that this mechanism proceeds on the sites used for H2S removal because it is shown by Soer- awidjaja (1985) and others (Ren-Yuan et al., 1987; Berry and Jobson, 1988a,b; Berry et al., 1985,1986; Kundig et al., 1966; Dumesic and Topsoe, 1977) with Mossbauer spectroscopy that iron carried by alumina, kept in a humid hydrogen atmosphere, will always be present as Fe2+: due to the strong metal support interaction, neither oxidation with H20 nor reduction with hydrogen or carbon monoxide to FeO is possible.
In the associative mechanism reactants adsorb on the alumina carrier and form an adsorbed species, surface formate, which decomposes and forms the products of the shift reaction (Grenoble and Estadt, 1981):
co + * e c o * (6)
H2O + 2* HO* + H* (7)
CO* + HO* e *COOH* (8)
*COOH* e C02* + H* (9)
c02* e cop + * (10)
2H* H2 + 2* (11)
It is uncertain which of the steps determines the overall reaction rate. According to Newsome (1980) the adsorption of CO is the rate determining step, whereas Udovic and Dumesic (1984) state that CO adsorption is fast and re- versible and the reaction between CO* and H20* is rate determining. Using IR measurements, Amenomiya (Amenomiya, 1978, 1979; Amenomiya and Pleizier, 1982) concluded that the decomposition of the formate complex is rate determining.
As no literature is available on the water-gas shift re- action over MnO/y-A1203, and Soerawidjaja (1985) has shown that manganese is also present as Mn2+ under re- action conditions, while the measured effects of CO are the same as for Fe0/y-Al2O3, it is assumed that the mecha- nism over both acceptor types will be the same as well.
As is shown by Wakker (1992), up to three different types of manganese oxide can be distinguished: first small crystallites which cannot be regenerated with steam, sec- ond a surface MnA1204 spinel, and third a bulklike Mn- A1204 compound. The last two types will behave similarly toward the shift reaction, namely, as described in the above discussion. The first type, however, causes the reaction system to become more complicated. During the first
CO + Fe304 ~i C02 + 3Fe0
H20 + 3Fe0 e H2 + Fe304
3 1 I
- I
V 825 K
- Y b 1 Y 725 K i
0 ' I 0 10 20 30 40 50 60 70
CO concentration ( W v )
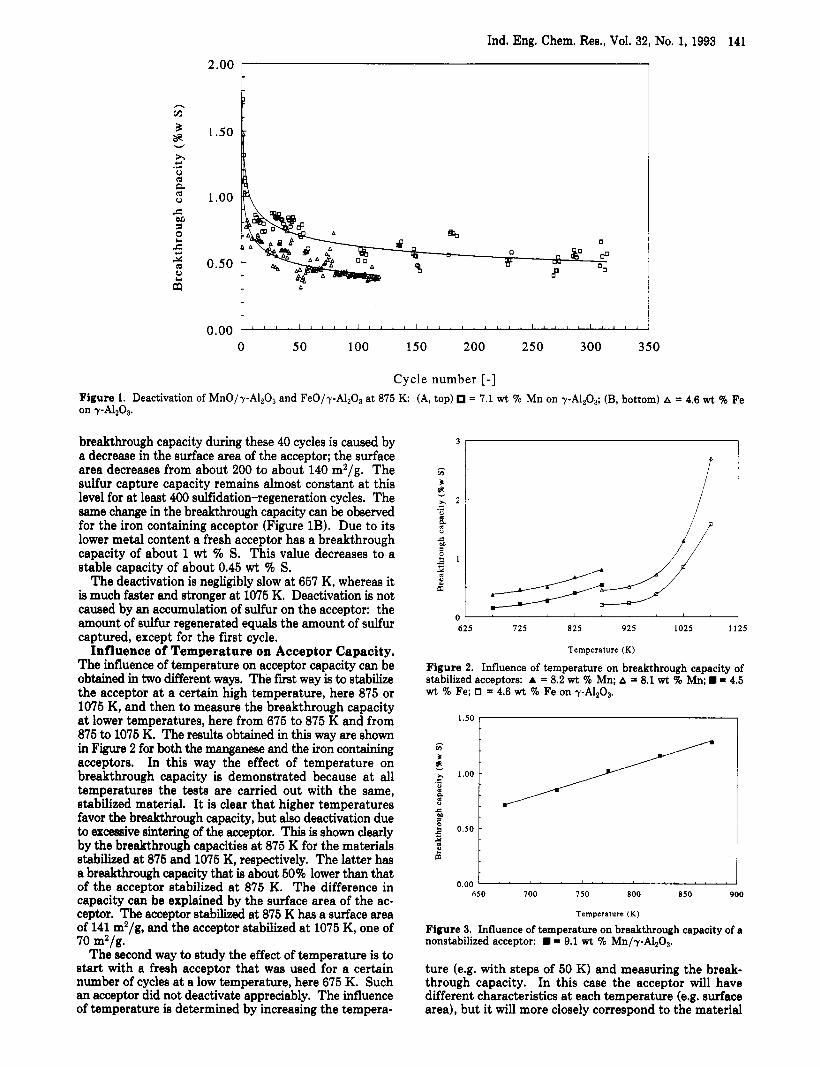
Figure 7. Influence of temDerature and CO concentration on breakthrough capacity: A, v - 3 . 6 wt % Fe/y-A1203; 0 = 4.6 wt % Fe/y-A1203.
sulfidation these crystallites are converted to manganese sulfide. A number of sulfur tolerant shift catalysts are described in literature, e.g., molybdenum sulfide on alu- mina (Hou et al., 1983). It is possible that defects in the crystallite structure catalyze the shift reaction or that some sites are regenerated with steam and catalyze the shift reaction before they are sulfided again. Due to this com- plex system a contribution of the regenerative mechanism cannot be excluded beforehand. It is important to note that Mn/y-A1203 is not a real shift catalyst. Compared to Fe304/Cr203 turnover frequencies are quite low.
Gas chromatographic analysis of the reactor effluent showed that with both the iron and the manganese con- taining acceptors the shift reaction is on equilibrium at 875 K. This means that the amount of water converted will be the same. The stronger positive effect for FeO/y-A1203 than for MnO/y-A1203 is caused by the lower metal loading of the iron containing acceptor: less water wil l be produced by sulfiding a certain amount of acceptor. As the same CO concentration is present in the feed, the result is that the partial pressure of water in the iron containing acceptor will be lower and a stronger positive effect of CO is ob- served.
Figure 7 shows the effect of CO in the feed gas a t dif- ferent temperatures. It is clear that the positive effect of CO is almost negligible at low temperatures and substantial a t high temperatures. Obviously the rate of the shift re- action at low temperatures is too low to let the shift re- action reach equilibrium within the given residence time in the reactor. Therefore, almost no H20 is converted, and H2S capture is only slightly improved. At high tempera- tures the reaction rate of the shift reaction is high enough to reach equilibrium. Thus, the shift reaction needs a high temperature or a long residence time to reach equilibrium.
When complete breakthrough curves of the manganese containing acceptor are compared for a feed with 0,20, and 40 vol ?% carbon monoxide, no differences are observed, except of the breakthrough point which shifts to higher breakthrough times as the breakthrough capacity increases with increasing carbon monoxide concentration.
Results of experiments with a feed gas containing both carbon monoxide and water are shown in Figures 8 and 9. Figures 8 and 9 show the breakthrough capacity as a function of the H20 concentration at different CO con- centrations. It follows from Figure 8 that the adverse effect of water can be compensated partially if the feed gas contains a substantial amount of carbon monoxide. At high water concentrations (e.g., more than 6 vol 7%) the positive effect of carbon monoxide becomes less strong.

144 Ind. Eng. Chem. Res., Vol. 32, No. 1, 1993
1.50 I 1
x 4 wv co c t \\\ I
c M + 0 I
5 10 15
0.00 t , , , , , , , . . , , , , , ! 0
Water content of feed ( W v )
Figure 8. Influence of the H20 and CO concentrations in the feed gas on breakthrough capacity of 7.1 wt % Mn/r-A1203 at 875 K.
1.50 1 I
% v C O 1 0.00 ' I
0 I 2 3
Water content of feed ( W v )
Figure 9. Influence of the H 2 0 and CO concentrations in the feed gas on breakthrough capacity of 8.0 wt % Mn/y-Al2Os at 875 K.
Figure 9 shows that a t low water concentrations the neg- ative effect of water can be eliminated, or a t least mini- mized, if a feed gas with a high carbon monoxide concen- tration is used.
The usefulness of the acceptors is therefore optimal for gas streams with low water contents (up to a maximum of approximately 5 vol %) and high carbon monoxide concentrations.
Effects of Pressure on Sulfidation Behavior. All experiments described so far are carried out a t a pressure of 0.1 MPa. However, a coal gasification plant operates at a considerably higher pressure, up to 4 MPa. Therefore it is necessary to know what influence pressure has on sflidation behavior. The influence of pressure on the equilibrium of reaction 1 is expected to be negligible: the same number of gas molecules participate in the sulfdation reaction and in the regeneration reaction. Figure 10 shows the breakthrough capacity as a function of pressure at two different temperatures, 725 and 875 K, and a feed gas containing N2, H2, and H2S. No influence on breakthrough capacity can be observed when pressure is raised to 0.5 MPa. As the shape of the corresponding breakthrough curves remains the same it is concluded that the kinetics of the sflidation reaction are probably not influenced by increasing the total pressure. Increasing pressure up to 4 MPa will therefore not influence sulfidation behavior of the acceptor.
When the feed gas contains a significant amount of carbon monoxide, the breakthrough capacity increases as described before. However, a t 725 K the breakthrough capacity increases with increasing pressure, whereas at 875 K it is independent of the pressure. In both cases the shape of the breakthrough curve is independent of pres-
I 0 0 00 0 10 0 20 0 30 0.40 0 5 0
Pressure (MPa)
J
Figure 10. Influence of pressure on breakthrough capacity of 8.96 wt % Mn/y-A1203 at 725 (e) and 875 (0) K, for a feed gas of 89 vol % N2, 10 vol % H2, and 1 vol % H P , and at 725 (A) and 875 (A) K far a feed gas of 39 vol % NP, 10 vol % H2, 50 vol 90 CO, and 1
sure. The different influence of pressure on acceptor performance at 725 and 875 K when the feed contains CO was surprising, but can be explained by the shift reaction. At 725 K the equilibrium constant of the shift reaction is about 9, whereas the equilibrium constant a t 875 K is 2.5. Theoretically more water can be converted at the lower temperature. However, the shift reaction is relatively slow at 725 K, causing the shift reaction not to attain equilib- rium at 0.1 MPa. Increasing the pressure results in more adsorbed species of CO and H20 on alumina (see reactions 7 and 8). As, according to different investigators (New- some, 1980; Udovic and Dumesic, 1984; Amenomiya, 1978, 1979; Amenomiya and Pleizier, 19821, the rate determining steps in the shift reaction are covered by reactions 7-10, the overall reaction rate will increase and a lower partial pressure of water is obtained. At 875 K the shift reaction reaches equilibrium: therefore no influence of the pressure is observed at 875 K. This also means that a t a relatively low temperature the positive effect of the shift reaction is stronger than at high temperatures when the shift re- action can reach equilibrium, e.g., caused by a high pres- sure or a sufficiently long residence time in the reactor.
Depending upon temperature and gas composition, pressure can influence breakthrough capacity. A higher pressure can cause the shift reaction to reach equilibrium. The sulfidation reaction itself is not influenced by pressure.
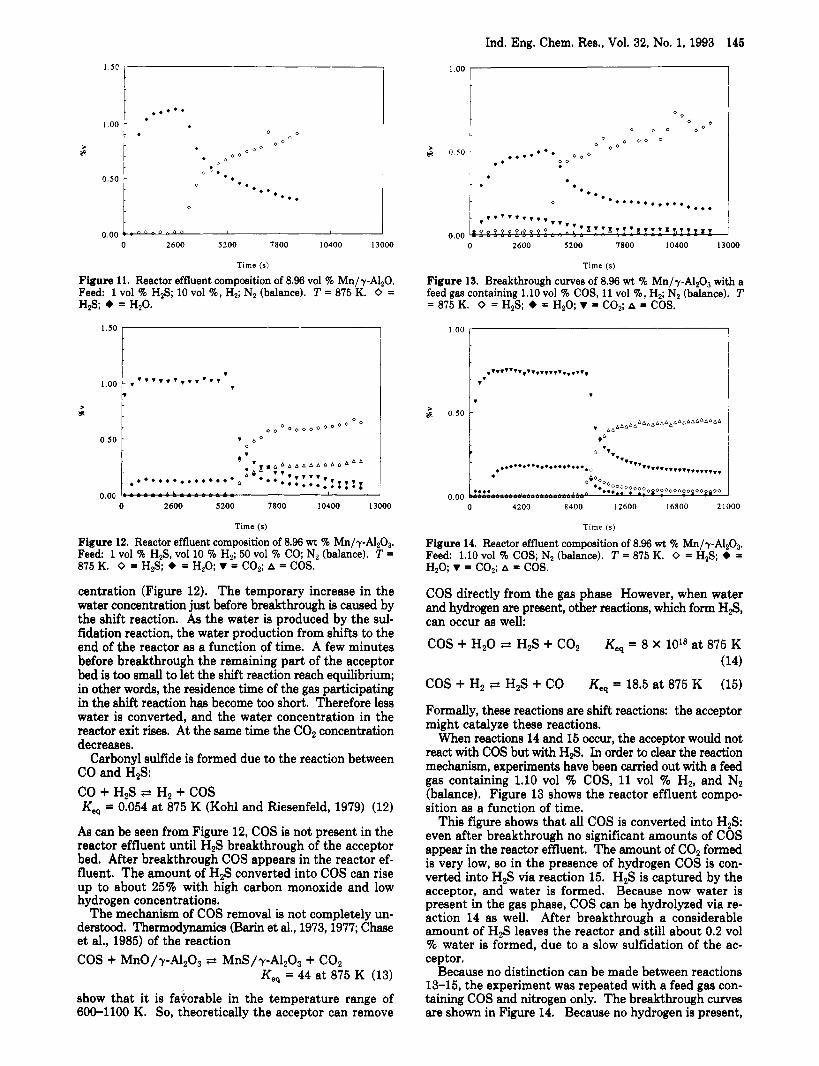
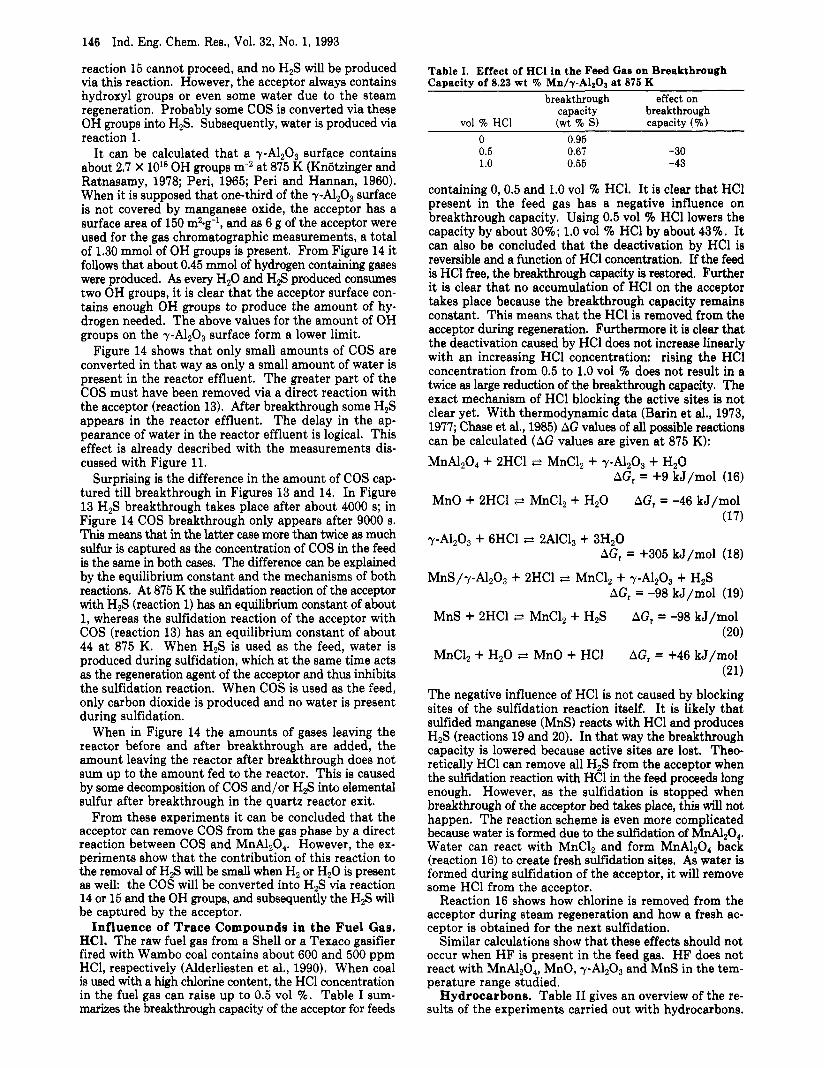
Reactor Effluent Composition in the Presence of Carbon Monoxide in the Feed Gas. When the gas to be desulfurized contains carbon monoxide, not only the breakthrough capacity increases with an increasing carbon monoxide concentration, but also marked changes occur in the reactor effluent composition during sulfidation compared with feeds free of carbon monoxide. These changes are the appearance of carbon dioxide and carbonyl sulfide in the reactor effluent. These changea are viaualjzed when Figures 11 and 12 are compared. Figure 11 shows the breakthrough curves of a feed containing 1 vol % HzS, 10 vol 9'0 H2, and N2 (balance) only. The reactor effluent contains H2S and H20 only. Figure 12 shows the break- through curves of a feed containing 1 vol % H2S, 10 vol % H2, 50 vol % CO, and N2 (balance): besides H20 (in a low concentration due to the shift reaction) and H2S, COP, and COS appear in the reactor effluent as well.
Carbon dioxide is formed according to the shift reaction (reaction 3). As there is no carbon dioxide present in the feed gas, it is a direct proof for the Occurrence of the shift reaction. The raise in the carbon dioxide concentration corresponds very well with the decrease in the water con-
V O ~ % H2S.
Ind. Eng. Chem. Res., Vol. 32, No. 1, 1993 145
0.00 0 2600 5200 7800 10400 13000
Time (s)
Figure 11. Reactor effluent composition of 8.96 vol % Mn/y-Al,O. Feed: 1 vol % H2S; 10 vol %, H,; N2 (balance). T = 875 K. 0 = HZS; + = H20.
0.50
0.oc 0 2600 5200 7800 10400 13000
Time (s)
Figure 12. Reactor effluent composition of 8.96 wt % Mn/y-AlzO,. Feed 1 vol % H2S, vol 10 % H2; 50 vol % CO; N2 (balance). T =
centration (Figure 12). The temporary increase in the water concentration just before breakthrough is caused by the shift reaction. As the water is produced by the sul- fidation reaction, the water production from shifts to the end of the reactor as a function of time. A few minutes before breakthrough the remaining part of the acceptor bed is too small to let the shift reaction reach equilibrium; in other words, the residence time of the gas participating in the shift reaction has become too short. Therefore less water is converted, and the water concentration in the reactor exit rises. At the same time the COz concentration decreases.
Carbonyl sulfide is formed due to the reaction between CO and HzS:
Keg = 0.054 at 875 K (Kohl and Riesenfeld, 1979) (12)
As can be seen from Figure 12, COS is not present in the reactor effluent until H2S breakthrough of the acceptor bed. After breakthrough COS appears in the reactor ef- fluent. The amount of H2S converted into COS can rise up to about 25% with high carbon monoxide and low hydrogen concentrations.
The mechanism of COS removal is not completely un- derstood. Thermodynamics (Barin et al., 1973,1977; Chase et al., 1985) of the reaction COS + MnO/y-Al,03 F' MnS/y-A1203 + COz
Keg = 44 at 875 K (13) show that it is favorable in the temperature range of 600-1100 K. So, theoretically the acceptor can remove
875 K. 0 HZS; + = H2O; V = CO2; A COS.
CO + H2S e H2 + COS
1 .oo
t
L . v v v T T T
0 2600 5200 7800 10400 13000
' x 7 I V 3 T T T X T, T T y y 0.00 O BQ:;:"?; . . G I - -
Time ( 5 )
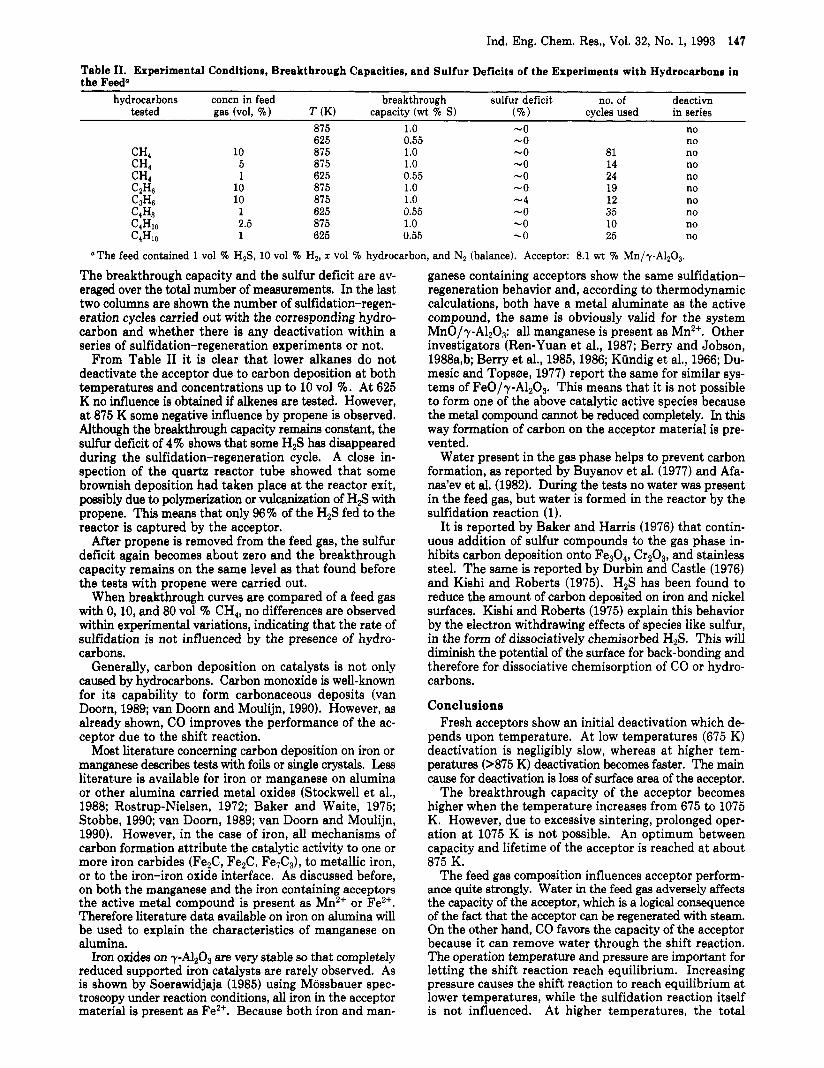
Figure 13. Breakthrough curves of 8.96 wt % Mn/y-A1203 with a feed gas containing 1.10 vol % COS, 11 vol %, H,; N2 (balance). T = 875 K. 0 = H2S; + H,O; V = CO2; A = COS.
1.00 1
t. . I
*...**.***....*..... 0 00
0 4200 8400 12600 16800 21000
Time (5)
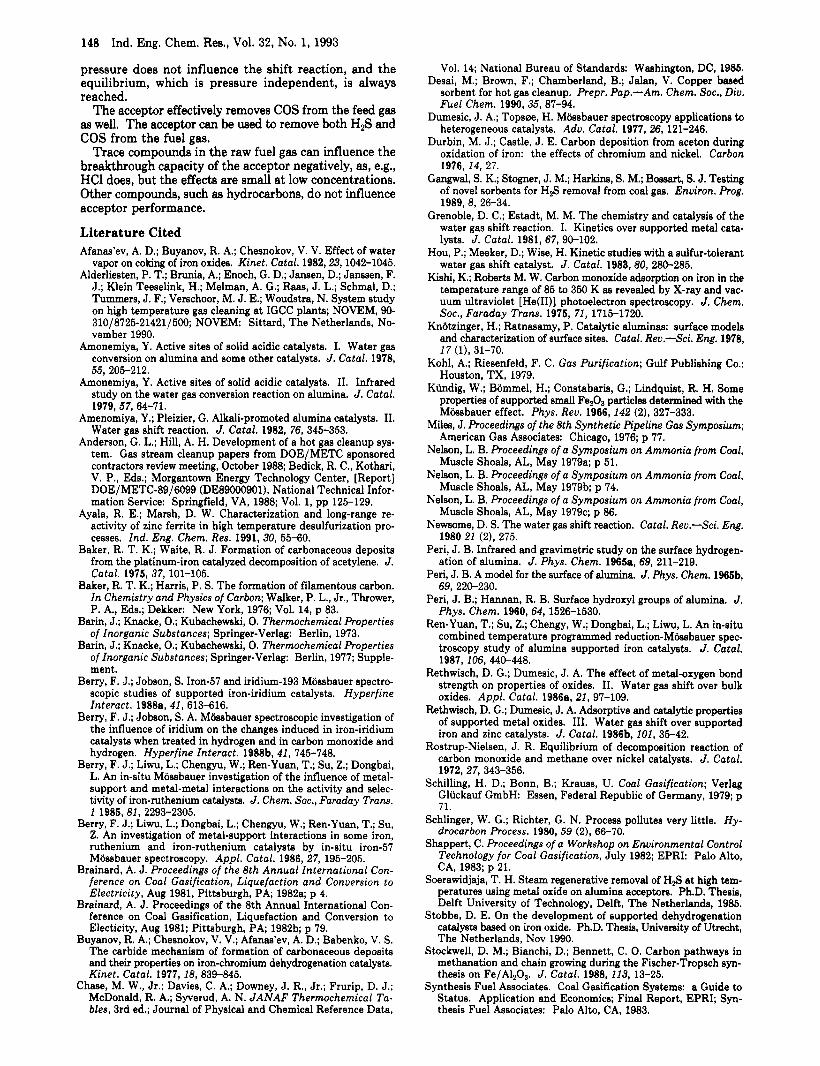
Figure 14. Reactor effluent composition of 8.96 wt % Mn/y-AlzOp Feed: 1.10 vol % COS; Nz (balance). T = 875 K. 0 = H2S; + =
COS directly from the gas phase However, when water and hydrogen are present, other reactions, which form H a , can occur as well:
COS + HzO e H2S + COz Keq = 8 X 10l8 at 875 K (14)
COS + H2 e H2S + CO (15)
Formally, these reactions are shift reactions: the acceptor might catalyze these reactions.
When reactions 14 and 15 occur, the acceptor would not react with COS but with H a . In order to clear the reaction mechanism, experiments have been carried out with a feed gas containing 1.10 vol % COS, 11 vol % Hz, and N2 (balance). Figure 13 shows the reactor effluent compo- sition as a function of time.
This figure shows that all COS is converted into HzS: even after breakthrough no significant amounts of COS appear in the reador effluent. The amount of COP formed is very low, so in the presence of hydrogen COS is con- verted into H2S via reaction 15. H2S is captured by the acceptor, and water is formed. Because now water is present in the gas phase, COS can be hydrolyzed via re- action 14 as well. After breakthrough a considerable amount of H2S leaves the reactor and still about 0.2 vol ?4 water is formed, due to a slow sulfidation of the ac- ceptor.
Because no distinction can be made between reactions 13-15, the experiment was repeated with a feed gas con- taining COS and nitrogen only. The breakthrough curves are shown in Figure 14. Because no hydrogen is present,
H2O; V CO,; A = COS.
Keg = 18.5 at 875 K
146 Ind. Eng. Chem. Res., Vol. 32, No. 1, 1993
reaction 15 cannot proceed, and no H2S will be produced via this reaction. However, the acceptor always contains hydroxyl groups or even some water due to the steam regeneration. Probably some COS is converted via these OH groups into H,S. Subsequently, water is produced via reaction 1.
It can be calculated that a yA1203 surface contains about 2.7 X 10¹⁸ OH groups m-2 at 875 K (Knotzinger and Ratnasamy, 1978; Peri, 1965; Peri and Hannan, 1960). When it is supposed that one-third of the yAl,O3 surface is not covered by manganese oxide, the acceptor has a surface area of 150 m2.g-l, and as 6 g of the acceptor were used for the gas chromatographic measurements, a total of 1.30 mmol of OH groups is present. From Figure 14 it follows that about 0.45 mmol of hydrogen containing gases were produced. As every H20 and H a produced consumes two OH groups, it is clear that the acceptor surface con- tains enough OH groups to produce the amount of hy- drogen needed. The above values for the amount of OH groups on the -pA1203 surface form a lower limit.
Figure 14 shows that only small amounts of COS are converted in that way as only a small amount of water is present in the reactor effluent. The greater part of the COS must have been removed via a direct reaction with the acceptor (reaction 13). After breakthrough some H,S appears in the reactor effluent. The delay in the ap- pearance of water in the reactor effluent is logical. This effect is already described with the measurements dis- cussed with Figure 11.
Surprising is the difference in the amount of COS cap- tured till breakthrough in Figures 13 and 14. In Figure 13 H2S breakthrough takes place after about 4000 s; in Figure 14 COS breakthrough only appears after 9000 s. This means that in the latter case more than twice as much sulfur is captured as the concentration of COS in the feed is the same in both cases. The difference can be explained by the equilibrium constant and the mechanisms of both reactions. At 875 K the sulfidation reaction of the acceptor with H2S (reaction 1) has an equilibrium constant of about 1, whereas the sulfidation reaction of the acceptor with COS (reaction 13) has an equilibrium constant of about 44 at 875 K. When H2S is used as the feed, water is produced during sulfidation, which at the same time acts as the regeneration agent of the acceptor and thus inhibits the sulfidation reaction. When COS is used as the feed, only carbon dioxide is produced and no water is present during sulfidation.
When in Figure 14 the amounts of gases leaving the reactor before and after breakthrough are added, the amount leaving the reactor after breakthrough does not sum up to the amount fed to the reactor. This is caused by some decomposition of COS and/or H2S into elemental sulfur after breakthrough in the quartz reactor exit.
From these experiments it can be concluded that the acceptor can remove COS from the gas phase by a direct reaction between COS and MnA120,. However, the ex- periments show that the contribution of this reaction to the removal of H a wil l be small when H2 or H20 is present as welk the COS will be converted into HzS via reaction 14 or 15 and the OH groups, and subsequently the H2S wil l be captured by the acceptor.
Influence of Trace Compounds in the Fuel Gas. HCl. The raw fuel gas from a Shell or a Texaco gasifier fired with Wambo coal contains about 600 and 500 ppm HCl, respectively (Alderliesten et al., 1990). When coal is used with a high chlorine content, the HC1 concentration in the fuel gas can raise up to 0.5 vol %. Table I sum- marizes the breakthrough capacity of the acceptor for feeds
Table I . Effect of HCl in the Feed Cas on Breakthrough Capacity of 8.23 wt % Mn/y-A1203 at 875 K
breakthrough effect on capacity breakthrough
vol % HC1 (wt % S) capacity (70) 0 0.95 0.5 0.67 -30 1.0 0.55 -43
containing 0,0.5 and 1.0 vol % HCl. It is clear that HCl present in the feed gas has a negative influence on breakthrough capacity. Using 0.5 vol % HC1 lowers the capacity by about 30%; 1.0 vol % HCl by about 43%. It can also be concluded that the deactivation by HC1 is reversible and a function of HC1 concentration. If the feed is HCl free, the breakthrough capacity is restored. Further it is clear that no accumulation of HC1 on the acceptor takes place because the breakthrough capacity remains constant. This means that the HC1 is removed from the acceptor during regeneration. Furthermore it is clear that the deactivation caused by HCl does not increase linearly with an increasing HC1 concentration: rising the HC1 concentration from 0.5 to 1.0 vol 5% does not result in a twice as large reduction of the breakthrough capacity. The exact mechanism of HC1 blocking the active sites is not clear yet. With thermodynamic data (Barin et al., 1973, 1977; Chase et al., 1985) AG values of all pmible reactions can be calculated (AG values are given at 875 K): MnA1204 + 2HC1 + MnC1, + yAl,O, + H,O
MnO + 2HC1 @ MnC1, + H20
r-Al,03 + 6HC1 e 2AlC13 + 3Hz0
MnS/y-Alz03 + 2HC1 ~i MnC1, + 7-Al,03 + HzS
AGr = +9 kJ/mol (16)
AGr = -46 kJ/mol (17)
AGr = +305 kJ/mol (18)
AGr = -98 kJ/mol (19)
(20)
(21)
The negative influence of HC1 is not caused by blocking sites of the sulfidation reaction itself. It is likely that sulfided manganese (MnS) reacts with HC1 and produces H2S (reactions 19 and 20). In that way the breakthrough capacity is lowered because active sites are lost. Theo- retically HC1 can remove all H2S from the acceptor when the sflidation reaction with HC1 in the feed proceeds long enough. However, as the sulfidation is stopped when breakthrough of the acceptor bed takes place, this will not happen. The reaction scheme is even more complicated because water is formed due to the sulfidation of MnAlz04. Water can react with MnC1, and form MnAlZO4 back (reaction 16) to create fresh sulfidation sites. As water is formed during sulfidation of the acceptor, it will remove some HCl from the acceptor.
Reaction 16 shows how chlorine is removed from the acceptor during steam regeneration and how a fresh ac- ceptor is obtained for the next sulfidation.
Similar calculations show that these effects should not occur when HF is present in the feed gas. HF does not react with MnAlz04, MnO, 7-Al,03 and MnS in the tem- perature range studied.
Hydrocarbons. Table I1 gives an overview of the re- sults of the experiments carried out with hydrocarbons.
MnS + 2HC1 F? MnCl, + HzS
MnC1, + HzO + MnO + HCl
AGr = -98 kJ/mol
AG, = +46 kJ/mol
Ind. Eng. Chem. Res., Vol. 32, No. 1, 1993 147
Table 11. Experimental Conditions, Breakthrough Capacities, and Sulfur Deficits of the Experiments with Hydrocarbons in the Feed"
hydrocarbons concn in feed breakthrough sulfur deficit no. of deactivn tested gas (vol, %) T (K) capacity (wt % S) (%) cycles used in series
875 1.0 -0 no 625 875 875 625 875 875 625 875 625
0.55 1.0 1.0 0.55 1.0 1.0 0.55 1.0 0.55
-0 -0 -0 -0 -0 -4 -0 -0 -0
no 81 no 14 no 24 no 19 no 12 no 35 no 10 no 25 no
"he feed contained 1 vol % H2S, 10 vol % H2, x vol % hydrocarbon, and N2 (balance). Acceptor: 8.1 wt % Mn/y-A1203.
The breakthrough capacity and the sulfur deficit are av- eraged over the total number of measurements. In the last two columns are shown the number of sulfidation-regen- eration cycles carried out with the corresponding hydro- carbon and whether there is any deactivation within a series of sulfidation-regeneration experiments or not.
From Table I1 it is clear that lower alkanes do not deactivate the acceptor due to carbon deposition at both temperatures and concentrations up to 10 vol % . At 625 K no influence is obtained if alkenes are tested. However, a t 875 K some negative influence by propene is observed. Although the breakthrough capacity remains constant, the sulfur deficit of 4% shows that some H2S has disappeared during the sulfidation-regeneration cycle. A close in- spection of the quartz reactor tube showed that some brownish deposition had taken place at the reactor exit, possibly due to polymerization or vulcanization of H a with propene. This means that only 96% of the H2S fed to the reactor is captured by the acceptor.
After propene is removed from the feed gas, the sulfur deficit again becomes about zero and the breakthrough capacity remains on the same level as that found before the tests with propene were carried out.
When breakthrough curves are compared of a feed gas with 0,10, and 80 vol % CH,, no differences are observed within experimental variations, indicating that the rate of sulfidation is not influenced by the presence of hydro- carbons.
Generally, carbon deposition on catalysts is not only caused by hydrocarbons. Carbon monoxide is well-known for its capability to form carbonaceous deposits (van Doorn, 1989; van Doorn and Moulijn, 1990). However, as already shown, CO improves the performance of the ac- ceptor due to the shift reaction.
Most literature concerning carbon deposition on iron or manganese describes teats with foils or single crystals. Less literature is available for iron or manganese on alumina or other alumina carried metal oxides (Stockwell et al., 1988; Rostrup-Nielsen, 1972; Baker and Waite, 1975; Stobbe, 1990; van Doorn, 1989; van Doorn and Moulijn, 1990). However, in the case of iron, all mechanisms of carbon formation attribute the catalytic activity to one or more iron carbides (FezC, Fe2C, Fe7C3), to metallic iron, or to the iron-iron oxide interface. As discussed before, on both the manganese and the iron containing acceptors the active metal compound is present as Mn2+ or Fez+. Therefore literature data available on iron on alumina will be used to explain the characteristics of manganese on alumina.
Iron oxides on yA1203 are very stable so that completely reduced supported iron catalysts are rarely observed. As is shown by Soerawidjaja (1985) using Mossbauer spec- troscopy under reaction conditions, all iron in the acceptor material is present as Fez+. Because both iron and man-
ganese containing acceptors show the same sulfidation- regeneration behavior and, according to thermodynamic calculations, both have a metal aluminate as the active compound, the same is obviously valid for the system MnO/y-A1203: all manganese is present as Mn2+. Other investigators (Ren-Yuan et al., 1987; Berry and Jobson, 1988a,b; Berry et al., 1985, 1986; Kundig et al., 1966; Du- mesic and Topsae, 1977) report the same for similar sys- tems of FeO/y-A1203. This means that it is not possible to form one of the above catalytic active species because the metal compound cannot be reduced completely. In this way formation of carbon on the acceptor material is pre- vented.
Water present in the gas phase helps to prevent carbon formation, as reported by Buyanov et al. (1977) and Afa- nas'ev et al. (1982). During the tests no water was present in the feed gas, but water is formed in the reactor by the sulfidation reaction (1).
It is reported by Baker and Harris (1976) that contin- uous addition of sulfur compounds to the gas phase in- hibits carbon deposition onto Fe304, Cr203, and stainless steel. The same is reported by Durbin and Castle (1976) and Kishi and Roberts (1975). HzS has been found to reduce the amount of carbon deposited on iron and nickel surfaces. Kishi and Roberta (1975) explain this behavior by the electron withdrawing effects of species like sulfur, in the form of dissociatively chemisorbed H2S. This will diminish the potential of the surface for back-bonding and therefore for dissociative chemisorption of CO or hydro- carbons.
Conclusions Fresh acceptors show an initial deactivation which de-
pends upon temperature. At low temperatures (675 K) deactivation is negligibly slow, whereas at higher tem- peratures (>875 K) deactivation becomes faster. The main cause for deactivation is loas of surface area of the acceptor.
The breakthrough capacity of the acceptor becomes higher when the temperature increases from 675 to 1075 K. However, due to excessive sintering, prolonged oper- ation at 1075 K is not possible. An optimum between capacity and lifetime of the acceptor is reached at about 875 K.
The feed gas composition influences acceptor perform- ance quite strongly. Water in the feed gas adversely affects the capacity of the acceptor, which is a logical consequence of the fact that the acceptor can be regenerated with steam. On the other hand, CO favors the capacity of the acceptor because it can remove water through the shift reaction. The operation temperature and pressure are important for letting the shift reaction reach equilibrium. Increasing pressure causes the shift reaction to reach equilibrium at lower temperatures, while the sulfidation reaction itself is not influenced. At higher temperatures, the total
148 Ind. Eng. Chem. Res., Vol. 32, No. 1, 1993
pressure does not influence the shift reaction, and the equilibrium, which is pressure independent, is always reached.
The acceptor effectively removes COS from the feed gas as well. The acceptor can be used to remove both H2S and COS from the fuel gas.
Trace compounds in the raw fuel gas can influence the breakthrough capacity of the acceptor negatively, as, e.g., HC1 does, but the effects are small at low concentrations. Other compounds, such as hydrocarbons, do not influence acceptor performance.
Literature Cited Afanas’ev, A. D.; Buyanov, R. A.; Chesnokov, V. V. Effect of water
vapor on coking of iron oxides. Kinet. Catal. 1982,23,1042-1045. Alderliesten, P. T.; Brunia, A.; Enoch, G. D.; Janaen, D.; Janssen, F.
J.; Klein Teeselink, H.; Melman, A. G.; h a s , J. L.; Schmal, D.; Tummers, J. F.; Verschoor, M. J. E.; Woudstra, N. System study on high temperature gas cleaning at IGCC plants; NOVEM, 90- 310/8725-21421/500; NOVEM: Sittard, The Netherlands, No- vember 1990.
Amonemiya, Y. Active sites of solid acidic catalysts. I. Water gas conversion on alumina and some other catalysts. J . Catal. 1978,
Amonemiya, Y. Active sites of solid acidic catalysts. 11. Infrared study on the water gas conversion reaction on alumina. J . Catal. 1979,57,64-71.
Amenomiya, Y.; Pleizier, G. Alkali-promoted alumina catalysts. 11. Water gas shift reaction. J. Catal. 1982, 76, 345-353.
Anderson, G. L.; Hill, A. H. Development of a hot gas cleanup sys- tem. Gas stream cleanup papers from DOE/METC sponsored contractors review meeting, October 1988; Bedick, R. C., Kothari, V. P., Eds.; Morgantown Energy Technology Center, [Report] DOE/METC-89/6099 (DE89000901), National Technical Infor- mation Service: Springfield, VA, 1988; Vol. 1, pp 125-129.
Ayala, R. E.; Marsh, D. W. Characterization and long-range re- activity of zinc ferrite in high temperature desulfurization pro- cesses. Ind. Eng. Chem. Res. 1991, 30, 55-60.
Baker, R. T. K.; Waite, R. J. Formation of carbonaceous deposits from the platinum-iron catalyzed decomposition of acetylene. J . Catal. 1975, 37, 101-105.
Baker, R. T. K.; Harris, P. S. The formation of filamentous carbon. In Chemistry and Physics of Carbon; Walker, P. L., Jr., Thrower, P. A., Eds.; Dekker: New York, 1976; Vol. 14, p 83.
Barin, J.; Knacke, 0.; Kubachewski, 0. Thermochemical Properties of Inorganic Substances; Springer-Verlag: Berlin, 1973.
Barin, J.; Knacke, 0.; Kubachewski, 0. Thermochemical Properties of Inorganic Substances; Springer-Verlag: Berlin, 1977; Supple- ment.
Berry, F. J.; Jobson, S. Iron-57 and iridium-193 Mossbauer spectro- scopic studies of supported iron-iridium catalysts. Hyperfine Interact. 1988a, 41, 613-616.
Berry, F. J.; Jobson, S. A. Mossbauer spectroscopic investigation of the influence of iridium on the changes induced in iron-iridium catalysts when treated in hydrogen and in carbon monoxide and hydrogen. Hyperfine Interact. 1988b, 41, 745-748.
Berry, F. J.; Liwu, L.; Chengyu, W.; Ren-Yuan, T.; Su, 2.; Dongbai, L. An in-situ Mossbauer investigation of the influence of metal- support and metal-metal interactions on the activity and selec- tivity of iron-ruthenium catalysts. J . Chem. Soc., Faraday Trans. 1 1985,81, 2293-2305.
Berry, F. J.; Liwu, L.; Dongbai, L.; Chengyu, W.; Ren-Yuan, T.; Su, 2. An investigation of metal-support interactions in some iron, ruthenium and iron-ruthenium catalysts by in-situ iron-57 Mossbauer spectroscopy. Appl. Catal. 1986, 27, 195-205.
Brainard, A. J. Proceedings of the 8th Annual International Con- ference on Coal Gasification, Liquefaction and Conversion to Electricity, Aug 1981, Pittsburgh, PA; 1982a; p 4.
Brainard, A. J. Proceedings of the 8th Annual International Con- ference on Coal Gasification, Liquefaction and Conversion to Electicity, Aug 1981; Pittsburgh, PA; 1982b; p 79.
Buyanov, R. A.; Chesnokov, V. V.; Afanas’ev, A. D.; Babenko, V. S. The carbide mechanism of formation of carbonaceous deposits and their properties on iron-chromium dehydrogenation Catalysts. Kinet. Catal. 1977, 18, 839-845.
Chase, M. W., Jr.; Davies, C. A,; Downey, J. R., Jr.; Frurip, D. J.; McDonald, R. A.; Syverud, A. N. JANAF Thermochemical Ta- bles, 3rd ed.; Journal of Physical and Chemical Reference Data,
55, 205-212.
Vol. 14; National Bureau of Standards: Washington, DC, 1985. Desai, M.; Brown, F.; Chamberland, B.; Jalan, V. Copper based
sorbent for hot gas cleanup. Prepr. Pap.-Am. Chem. SOC., Diu. Fuel Chem. 1990,35, 87-94.
Dumesic, J. A.; Topsee, H. Miissbauer spectroscopy applications to heterogeneous catalysts. Adv. Catal. 1977,26, 121-246.
Durbin, M. J.; Castle, J. E. Carbon deposition from aceton during oxidation of iron: the effects of chromium and nickel. Carbon 1976, 14, 27.
Gangwal, S. K.; Stogner, J. M.; Harkins, S. M.; Bossart, S. J. Testing of novel sorbents for H2S removal from coal gas. Enuiron. Prog.
Grenoble, D. C.; Estadt, M. M. The chemistry and catalysis of the water gas shift reaction. I. Kinetics over supported metal cata- lysts. J. Catal. 1981,67,90-102.
Hou, P.; Meeker, D.; Wise, H. Kinetic studies with a sulfur-tolerant water gas shift catalyst. J . Catal. 1983,80, 280-285.
Kishi, K.; Roberts M. W. Carbon monoxide adsorption on iron in the temperature range of 85 to 350 K as revealed by X-ray and vac- uum ultraviolet [He(II)] photoelectron spectroscopy. J. Chem. Soc., Faraday Trans. 1975, 71, 1715-1720.
Knotzinger, H.; Ratnasamy, P. Catalytic aluminas: surface models and characterization of surface sites. Catal. Rev.-Sci. Eng. 1978,
Kohl, A.; Riesenfeld, F. C. Gas Purification; Gulf Publishing Co.: Houston, TX, 1979.
Kiindig, W.; Bommel, H.; Constabaris, G.; Lindquist, R. H. Some properties of supported small FezO3 particles determined with the Miissbauer effect. Phys. Rev. 1966,142 (2), 327-333.
Miles, J. Proceedings of the 8th Synthetic Pipeline Gas Symposium; American Gas Associates: Chicago, 1976; p 77.
Nelson, L. B. Proceedings of a Symposium on Ammonia from Coal, Muscle Shoals, AL, May 1979a; p 51.
Nelson, L. B. Proceedings of a Symposium on Ammonia from Coal, Muscle Shoals, AL, May 1979b; p 74.
Nelson, L. B. Proceedings of a Symposium on Ammonia from Coal, Muscle Shoals, AL, May 1979c; p 86.
Newsome, D. S. The water gas shift reaction. Catal. Rev.-Sci. Eng. 1980 21 (21, 275.
Peri, J. B. Infrared and gravimetric study on the surface hydrogen- ation of alumina. J . Phys. Chem. 1965a, 69, 211-219.
Peri, J. B. A model for the surface of alumina. J. Phys. Chem. 1965b, 69, 220-230.
Peri, J. B.; Hannan, R. B. Surface hydroxyl groups of alumina. J . Phys. Chem. 1960,64,1526-1530.
Ren-Yuan, T.; Su, 2.; Chengy, W.; Dongbai, L.; Liwu, L. An in-situ combined temperature programmed reduction-Miissbauer spec- troscopy study of alumina supported iron catalysts. J . Catal. 1987, 106,440-448.
Rethwisch, D. G.; Dumesic, J. A. The effect of metal-oxygen bond strength on properties of oxides. 11. Water gas shift over bulk oxides. Appl. Catal. 1986a, 21, 97-109.
Rethwisch, D. G.; Dumesic, J. A. Adsorptive and catalytic properties of supported metal oxides. 111. Water gas shift over supported iron and zinc catalysts. J. Catal. 1986b, 101, 35-42.
Rostrup-Nielsen, J. R. Equilibrium of decomposition reaction of carbon monoxide and methane over nickel catalysts. J. Catal.
Schilling, H. D.; Bonn, B.; Krauss, U. Coal Gasification; Verlag Gluckauf GmbH: Essen, Federal Republic of Germany, 1979; p 71.
Schlinger, W. G.; Richter, G. N. Process pollutes very little. Hy- drocarbon Process. 1980,59 (2), 66-70.
Shappert, C. Proceedings of a Workshop on Environmental Control Technology for Coal Gasification, July 1982; EPRI Palo Alto, CA, 1983; p 21.
Soerawidjaja, T. H. Steam regenerative removal of H2S at high tem- peratures using metal oxide on alumina acceptors. Ph.D. Thesis, Delft University of Technology, Delft, The Netherlands, 1985.
Stobbe, D. E. On the development of supported dehydrogenation catalysts based on iron oxide. Ph.D. Thesis, University of Utrecht, The Netherlands, Nov 1990.
Stockwell, D. M.; Bianchi, D.; Bennett, C. 0. Carbon pathways in methanation and chain growing during the Fischer-Tropsch syn- thesis on Fe/A1203. J . Catal. 1988, 113, 13-25.
Synthesis Fuel Associates. Coal Gasification Systems: a Guide to Status. Application and Economics; Final Report, EPRI; Syn- thesis Fuel Associates: Palo Alto, CA, 1983.
1989,8, 26-34.
17 (l), 31-70.
1972,27, 343-356.
Ind. Eng. Chem. Res. 1993,32, 149-159 149
Udovic, T. J.; Dumesic, J. A. Adsorptive properties of magnetite surfaces as studied by temperature programmed desorption studies of 02, NO, C02 and CO adsorption. J. Catal. 1984,89,314.
van Doorn, J. Carbon deposition on hydrotreating catalysts. Ph.D. Thesis, University of Amsterdam, Sept 1989.
van Doom, J.; Moulijn, J. A. Carbon deposition on catalysts. Catal.
Wakker, J. P. Development of a high temperature steam regenerative H a removal process based on alumina supported MnO and FeO. Ph.D. Dissertation, Delft University of Technology, Delft, The Netherlands, 1992.
Wakker, J. P.; Gerritsen, A. W. High temperature H$ removal from process gases in a steam regenerative process using MnO or FeO
Today 1990, 7, 257-266.
on alumina acceptors. Prepr. Pap.-Am. Chem. SOC., Diu. Fuel Chern. 1990a, 35, 170-178.
Wakker, J. P.; Gerritsen, A. W. Coal gasification: high temperature H2S removal in a steam regenerative process under realistic con- ditions. Prepr. Pap.-Am. Chem. SOC., Diu. Fuel Chem. 1990b, 35, 179-187.
Wal, W. J. J. van der. Desulfurization of process gas by means of iron oxide-on-silica sorbents. Ph.D. Thesis, University of Utrecht, Utrecht, The Netherlands, January 1987.
Received for review April 6 , 1992 Revised manuscript received August 26, 1992
Accepted October 15, 1992
Analysis of Nonequilibrium Adsorption/Desorption Kinetics and Implications for Analytical and Preparative Chromatography
Roger D. Whitley,*?+ Kevin E. Van Cott, and N.-H. Linda Wang School of Chemical Engineering, Purdue University, West Lafayette, Indiana 47907-1283
The assumption of local equilibrium in liquid chromatography can give misleading results when applied to high-affinity solutes, such as proteins, or other macromolecules. When adsorption or desorption becomes the rate-limiting step in a system, a number of symptoms will be present: symmetric and asymmetric spreading of waves, slow development of constant pattern, apparent loss of capacity, loss of coherence, and changes in interference patterns for multiple solutes. These results can reduce product purity and introduce serious errors into parameter estimation. These effects are predictable for any affinity and capacity combination if the dimensionless group approach developed herein is applied. By using a rate model of chromatography, we show how a system with nonequilibrium adsorption/desorption kinetics behaves when the controlling rate changes from kinetic to one or more mass-transfer rates and we give guidelines on scaling up processes efficiently by minimizing the nonequilibrium effects.
Introduction For chromatographic processes one can usually assume
that the rates of adsorption and desorption are fast enough for the solid phase and adjacent solution concentrations to be in equilibrium. Such an assumption is not always valid for high-affinity solutes such as proteins (Horstmann and Chase, 1989; Skidmore et al., 1990; Mao et al., 1991). Some causes for slow adsorption include steric hindrance, low substrate concentration, and low ligand density; causes for slow desorption include strong binding and multiple binding sites. When slow relative to rates of mass transfer, the nonequilibrium adsorption/desorption (NAD) kinetics give rise to unusual nonequilibrium phenomena. As such, NAD is dependent both on the operating conditions of a separation and on the solute/adsorbent system (Kasche et al., 1981; Aptel et aL, 1988; Horstmann and Chase, 1989). The growing dependence on affinity chromatography for extremely specific selectivity and the development and exploitation of perfusible adsorbenta (Afeyan et al., 1990, 1991) require a better understanding of adsorption/de- sorption steps in order to optimize separations.
Significant Prior Work. Experimental systems re- ported in the literature show that NAD can reduce product concentration, lessen resolution, and prevent the devel- opment of displacement trains (Kasche et al., 1981; Muller and Cam, 1984, Anspach et al., 1990). Several groups have developed experimental procedures to measure these rate
* Author to whom correspondence should be addressed. 'Current address: Air Products and Chemicals, Inc., 7201
Hamilton Blvd., Allentown, PA 18195-1501.
~aaa-5aa5/93/2632-oi49~0~.00/~
constants for large molecules: Aptel et al. (1988) obtained parameters which represented lumped mass transfer and adsorption/desorption behavior; Horstmann and Chase (1989) lumped the film and pore mass-transfer resistances together; Liapis et al. (1989) studied nonporous systems and accounted for a separate film mass-transfer resistance; Onyegbado and Susu (1990) were able to determine non- linear, Langmuir isotherm parameters if they neglected axial dispersion and mass-transfer resistances for their system.
Efforts have been made to model this behavior; Wade et al. (1987) and Wade and Carr (1988) used a lumped kinetic rate expression for film mass transfer, pore diffu- sion, and adsorption. That model was able to explain peak splitting associated with NAD. Wade et al. (1987) also observed that band broadening due to NAD could be de- creased by higher column loading for pNp-mannoside on immobilized concanavalin A. Skidmore et al. (1990) found that a model which considered film mass transfer and intraparticle diffusion separately from adsorption kinetics was able to represent slow adsorption in ion exchange chromatography much better than a lumped model. However, their study was limited to frontal analysis, and comparisons between kinetic rates and mass-transfer rates were not quantified. If pore diffusion resistance is neg- ligible, the effects of NAD can be more readily observed. Mao et al. (1991) have reported such effects for affinity chromatography of lysozyme on nonporous particles. While Mao et al. also present a model of such systems, the required approximations for an analytical solution limit them to frontal analysis on an initially clean bed and give only fair agreement as ligand density increases.
0 1993 American Chemical Society