fao / infoods guidelines - home | food and … · fao/infoods guidelines for food matching ......
TRANSCRIPT
FAO / INFOODS Guidelines
Guidelines for Food Matching
Version 1.2

FAO/INFOODS
Guidelines for
Food Matching
Version 1.2
FAO, November 2012
Prepared by: Barbara Stadlmayr, Ramani Wijesinha-Bettoni, David
Haytowitz, Doris Rittenschober, Judy Cunningham, Renee Sobolewski,
Sandra Eisenwagen, Janis Baines, Yasmine Probst, Emily Fitt, U. Ruth
Charrondiere
Please cite as: FAO/INFOODS Guidelines for Food Matching. Version 1.2 (2012). FAO,
Rome.
The designations employed and the presentation of material in this information product do not imply the expression of any opinion whatsoever on the part of the Food and Agriculture Organization of the United Nations (FAO) concerning the legal or development status of any country, territory, city or area or of its authorities, or concerning the delimitation of its frontiers or boundaries. The mention of specific companies or products of manufacturers, whether or not these have been patented, does not imply that these have been endorsed or recommended by FAO in preference to others of a similar nature that are not mentioned.
The views expressed in this information product are those of the author(s) and do not necessarily reflect the views of FAO.
E-ISBN 978-92-5-107377-3 (PDF)
All rights reserved. FAO encourages reproduction and dissemination of material in this information product. Non-commercial uses will be authorized free of charge, upon request. Reproduction for resale or other commercial purposes, including educational purposes, may incur fees. Applications for permission to reproduce or disseminate FAO copyright materials, and all queries concerning rights and licences, should be addressed by e-mail to [email protected] or to the Chief, Publishing Policy and Support Branch, Office of Knowledge Exchange, Research and Extension, FAO, Viale delle Terme di Caracalla, 00153 Rome, Italy.
© FAO 2012

3
Table of Contents
Acknowledgements ............................................................................................................... 4
Objectives .............................................................................................................................. 5
І. General aspects to keep under consideration before matching ........................................... 5
ІІ. Food Matching Criteria .................................................................................................... 9
ІІI. Food Identification .......................................................................................................... 9
ІV. Food component matching ........................................................................................... 13
Annex 1: Selected examples and possible solutions for food matching ............................... 15
Annex 2: Summary description of components and their INFOODS tagnames. ............... 22
References ............................................................................................................................ 26
Additional literature ............................................................................................................ 28

4
Acknowledgements
The authors express their appreciation to Oliver Lindner for his comments on the previous
version of the document.
The authors would like to thank Kristy Ebanks for leading the cover design and Natascia
Alessi for the editing and formatting of the document.
5
Objectives
Food matching links food consumption/supply data with food composition data. As food
matching procedures are critical to obtaining high quality estimations of nutrient intakes
(for nutrition purposes) or of dietary exposure (for food safety purposes), INFOODS
developed these guidelines for a more harmonized approach to food matching while
pointing out critical steps and information in order to achieve the most appropriate food
matching. These guidelines are intended to assist in selecting the most appropriate foods
(for which compositional data are available) to match to foods reported in food
consumption surveys (at individual, household, national or international level) or to food
supply data (e.g. FAOSTAT, EUROSTAT). In addition, food matching is important when
compiling Food Composition Tables/ Databases (FCT/FCDB) including when filling
missing data form other sources. More information on criteria on how to choose
FCT/FCDB is being prepared and will be published separately as the INFOODS
Guidelines on the Selection of Appropriate Food Composition Data (in preparation).
Food matching should aim for the highest quality match possible by identifying the most
appropriate food in the most appropriate source of compositional data. As experience
demonstrates, this is not always possible to achieve. Therefore, it is recommended to use a
stepwise approach, i.e. to search for the highest quality food match. If it cannot be obtained
after extensive efforts, the next lower quality level of food match should be explored,
before finally choosing the lowest quality food match. To properly assess nutrient intake,
there can be no missing food composition values, and therefore, a food match must be
made.
Whatever food match is selected for each food, it should be documented and the overall
quality of food matching should be discussed in the presentation of the final estimations of
nutrient intakes or dietary assessment (see point 4 below).
Throughout the document, the term food component is used to refer to nutrients,
chemicals, additives, contaminants and other components of interest.
The demand for such guidelines was expressed in the past and its realization became
possible with the contribution of Multi Disciplinary Funds through FAO ESS division.
І. General aspects to keep under consideration before matching
1. Identify the food component of interest. Decisions with regard to food matching will
depend on the food component of interest for the survey/study that is conducted, e.g. if
the study does not look at sodium then it does not matter if the salted and unsalted
products are matched. If on the other hand, the complete nutrient profile (macro- and
micronutrients) is considered, the decisions on food matching will have to take all food
components into account. If some food components of interest are not available in the
chosen FCT/FCDB, the missing values will need to be imputed from another
FCT/FCDB, or other sources of food composition data (e.g. scientific articles, theses,
university reports, websites of manufacturers, and information on labels). However, it is
necessary to document this match.

6
Note: Macronutrients are needed to calculate energy intakes (never copy only the energy
values for energy intake estimations). See FAO (2003) for recommended energy conversion
factors. Often, nutrient intakes are calculated for all food components having a
Recommended Daily Intake (RDI) included in the country’s dietary guidelines, or are of
research or public health interest, e.g. iron, vitamin A or trans fatty acids.
2. Identify the amount of foods consumed. The quality of the estimations of nutrient
intakes or dietary exposure is mainly determined by the quality of the food matches of
foods consumed in significant quantities and those with high concentrations of the food
components of interest (even if they are consumed in small amounts). Therefore, special
attention needs to be given to these food matches, while a lower quality food match is
more acceptable for foods consumed infrequently or containing low amounts of the
component of interest. The keyfood approach as proposed by USDA (Haytowitz et al.,
2002 or in Charrondiere et al., 2011a, b-Module 3) might be helpful in identifying the foods
for which the quality of food matching is most important. The key food approach consists
of identifying those foods in the food supply which contribute to 75% of a nutrient intake
(e.g. 75% of iron intake).
3. For foods that are not clearly described
Some food consumption or supply data are unspecific, e.g. from Household Budget
Surveys (HBS), Food Frequency Questionnaires (FFQ) or FAOSTAT, e.g. cheese, milk, or
fish.
3.a Identify the population of interest and their habits
In order to attribute the best food match, the population under consideration needs to be
kept in mind as they might have different eating habits which need to be reflected in the
food matching. In considering populations of interest, this is not just among countries, but
within a country where various population subgroups need to be assessed. These include
different ethnic groups, age groups, and gender. For example, infants and children can have
very different diets than adults; immigrants to a country will eat different foods (often
from their homeland), using different preparation techniques, than the indigenous
population.
Examples:
When the cooking method is not indicated in the food consumption or supply data, it
needs to be estimated by selecting the most common cooking method(s) for the food in the
population. For risk assessment purpose, it would be advisable to choose the cooking
method with the highest associated risk. Other examples are food biodiversity (the most
likely varieties should be matched if they have different compositions of the components
of interest), or the most commonly consumed form of the food (e.g. fortified vs.
unfortified) or recipes (ingredients and their amounts may need to be collected from
cookery books or through focus groups, and then used to calculate the composition of
recipes). Another example would be rural/urban differences or differences owing to
economic status: in some countries milk in rural areas could be matched to whole milk (as it
is the only form available in rural areas) or even milk from a different animal species, while
in urban settings semi-skimmed milk would be a better match, or a mix of whole and semi-
skimmed milk (as these are the two forms of milk sold in urban settings). The availability of

7
enriched/fortified foods is affected by regulation at the national level, and will vary from
country to country. It can also be influenced by the urban/rural paradigm, where
processed foods (more likely to be enriched/fortified) are more available in urban areas,
than in rural areas.
3.b Identify several food matches
If food consumption data are unspecific (e.g. fish), it is recommended that at least 3 food
items from the FCT are matched, especially if it is a food consumed in high amounts
and/or contains high concentrations of the food components of interest. The matches
should reflect the range of different nutrient values available for the food. However, for
broad food categories, e.g. vegetables, many more food matches are needed in order to
obtain a reliable estimate (often 20-30 foods and sometimes even several hundred, especially
for risk assessment). These foods should represent the most consumed foods in the most
popular forms for this unspecified food. The food component values of the unspecified
food would be calculated as the mean of the food component values of the foods matched.
This can be done either through a weighted mean (foods are weighted according to their
market share or consumption pattern — preferred option) or an arithmetic mean (if no
further information is available of the proportion of foods consumed—less recommended).
An exception can be made for infrequently consumed (unimportant) foods, for which only
one food match may be sufficient.
Matching to a specific brand should be avoided (unless the exact brand has been specified in
the food consumption survey, which can be matched exactly with the food in the FCT)
and it is better to choose several brands and to calculate an average.
4. Document food matches by assigning quality criteria. In order to assess the quality of
the food matching and hence of the nutrient intake estimations, it is important to assign
quality codes to the food match. It is also important to identity the source (including
releases or edition information) and specific item number in the FCT/FDB.
Table 1 Quality criteria
A
high
quality
Exact match
Food and all its descriptors from the food consumption survey (=reported food) match exactly
with food and all its descriptors from the FCT/FCDB. This applies to all other sources of food
composition data (e.g. FCT/FCDB from other countries, scientific articles, ...) AND
The definitions of the food components of interest are in accordance with international quality
standards (e.g. not crude fibre but Prosky AOAC fibre. For more information see food
component matching section III and Annex 2 of the current document).
B
medium
quality
If the food and all its descriptors could not be found in a FCT/FCDB and matching was conducted
by one of the following means:
Matching the reported food to several food items from the FCT and calculating the mean food
component values (arithmetic or weighted mean)
○ e.g. for the reported food green salad type, not specified, five kinds of green salads are listed
in the national FCT which are matched to the reported food and the mean food
component values of the five food items is calculated.
○ e.g. in FFQ, fish, not further specified, was reported. The three most consumed were
selected (Tuna, canned, Cod, baked and Salmon, grilled) and through further information
(e.g. from published smaller food consumption studies) a weighted average was calculated

8
of 50% Tuna, canned, 20% Cod, baked and 30% Salmon, grilled).
Recipe calculation. Calculation of recipes is preferable to taking similar cooked foods.
Calculating food component values from cooked foods based on raw foods by using
appropriate nutrient retention and yield factors. See Charrondiere et al. (2011a, b)-Module 8;
○ choosing recipes that are most representative for the population/subgroup of interest. E.g.
from information recorded on food records or through well known and widely used cook
books;
○ calculating the food component values from recipes based on raw foods by using
appropriate nutrient retention and yield factors. It is preferable to use yield and retention
factors based on habitual cooking methods for the region of interest. If this information
cannot be obtained, the yield and nutrient retention factors should be taken from the
published literature; see Charrondiere et al. (2011a, b)-Module 8; Bognar, A. (2002),
McCance and Widdowson`s (2002), EuroFIR (2008).
Matching the food item with a similar food (of a similar botanical origin) e.g. for cassava leaves,
calculate the mean of different entries of dark green leaves (list at least 3 items). Foods which
are well known as source of a particular food component should be avoided (in other words,
exclude extreme values), because a bias could be introduced.
C
low
quality
The food is very different but it is the closest match possible. E.g. camel meat matched with
beef (both are a mammals, and are red meat), while having no other information on camel
meat1.
Recipe calculations without using yield or retention factors
Food component values from raw dishes are applied to cooked dishes, with no adjustment.
Food component definitions are not in accordance with international quality standards (e.g.
only crude fibre instead of dietary fibre) independently of the quality of the food match.
Note
Depending on the circumstances, it may be necessary to have sub-classes for these quality codes
e.g.
○ A: Single, perfect match, no modifications required;
○ A2: Exact match, but multiple selections, need weighting;
○ B: Similar, single match;
○ B2: Similar match, multiple selections, need weighting;
○ C: Poor, single match;
○ C2: Poor match, multiple selections, need weighting;
○ D: Food component values taken from a Default Table.
If food component values are borrowed from a different FCT to the one being matched, a
different quality code should be used to indicate this (e.g. D match above). It is generally
better to take an A-match from another FCT than to put a C-match from the FCT of
interest.
The overall quality of the estimations of nutrient intakes (or dietary exposure) depends
mainly on the food matches of the foods consumed in high amounts and/or contain
concentrations of the food component of interest. If most of these food matches were of
medium quality and only a few were of high or low quality, the overall quality of all food
matches would be medium.
1
When the same food description is found, but from a different species, the quality code depends on food
and nutrients of interest. For example, gross composition of butter from cow milk and butter from buffalo
milk will be similar (B-match), but fatty acid profiles will be different (C-match). If only proximates are
required, the quality code B would be given.
9
ІІ. Food Matching Criteria
The following criteria were developed for food matching. They are explained in detail in
the next sections III. Food Identification and IV. Food Component Matching.
For food identification the following points need to be checked:
food name and food descriptors;
taxonomic/scientific name; and
water and fat content as well as components of interest.
For food components the following points need to be checked:
expression;
definition;
analytical methods;
unit; and
denominator.
ІІI. Food Identification
Food identification includes food names and food descriptors. They should clearly identify
the food its forms and preparation. The food name and descriptors should be
comprehensive enough to allow for an unambiguous identification of the food. However,
this detailed information for food identification is often not available (neither for the food
consumption data nor in FCT/FCDBs).
Food names can vary from country to country (e.g. maize versus corn, eggplant versus
aubergine, rockmelon versus cantaloupe) and the same cuts of meat can have different names
in different countries. Also the composition of the same brand product can be different
among countries and over time. Therefore, care has to be taken with food names to ensure
that the correct food for one’s own country is selected.
Water/Fat
In general, water is the most important nutrient to check the food description and the
concordance between two foods. Therefore, the water contents always have to be
compared when matching foods. In addition, the fat content needs to be compared for
foods in which the fat content varies substantially, e.g. milk, cheese or meat.
Table 2 lists characteristics that influence the nutritional value of the food. Ignoring them
will result in varying interpretation of what the food represents, which will then lead to
different food matching and nutrient intake estimations. When an exact food match cannot
be found, general solutions for food matching include:
calculating data (e.g. mean of different food items, recipe calculation, calculating values
from different forms of the same food, calculating values from other components of the
same food).
estimating/imputing data (e.g. values for peas used from green beans, values for boiled
used for steamed, or assuming a zero value, e.g. no fibre in meat). If any food
10
components have been estimated, details should be provided at component value level.
It is particularly important to estimate any missing values which are needed for
calculating energy. For further information see module 8 of the Food Composition
Study Guide (Charrondiere et al., 2011).
borrowing data from other FCT/FCDBs or other sources of food composition data
(e.g. scientific articles, theses, reports). If any component values have been borrowed
from a different FCT to the one under consideration, details (source, food code) should
be provided. Another option would be to get the information on data from
manufacturers, consulting their websites or referring to the information on labels2
(e.g.
for data on processed foods, specific brands of foods).
Internet search/lexica (e.g. Google or Wikipedia) to identify an unknown food/dish
before matching it to foods in FCT/FCDBs.
When estimating selected nutrients from another food and the difference in the water
content is higher than 10 %, it is recommended to adjust all nutrients accordingly. If
between the two foods the difference in fat content is higher than 10 %, the fat related
components should be adjusted accordingly. The latter is also true for protein, i.e. to
adjust values for amino acids.
More specific examples and possible solutions for food matching are given in Annex 1.
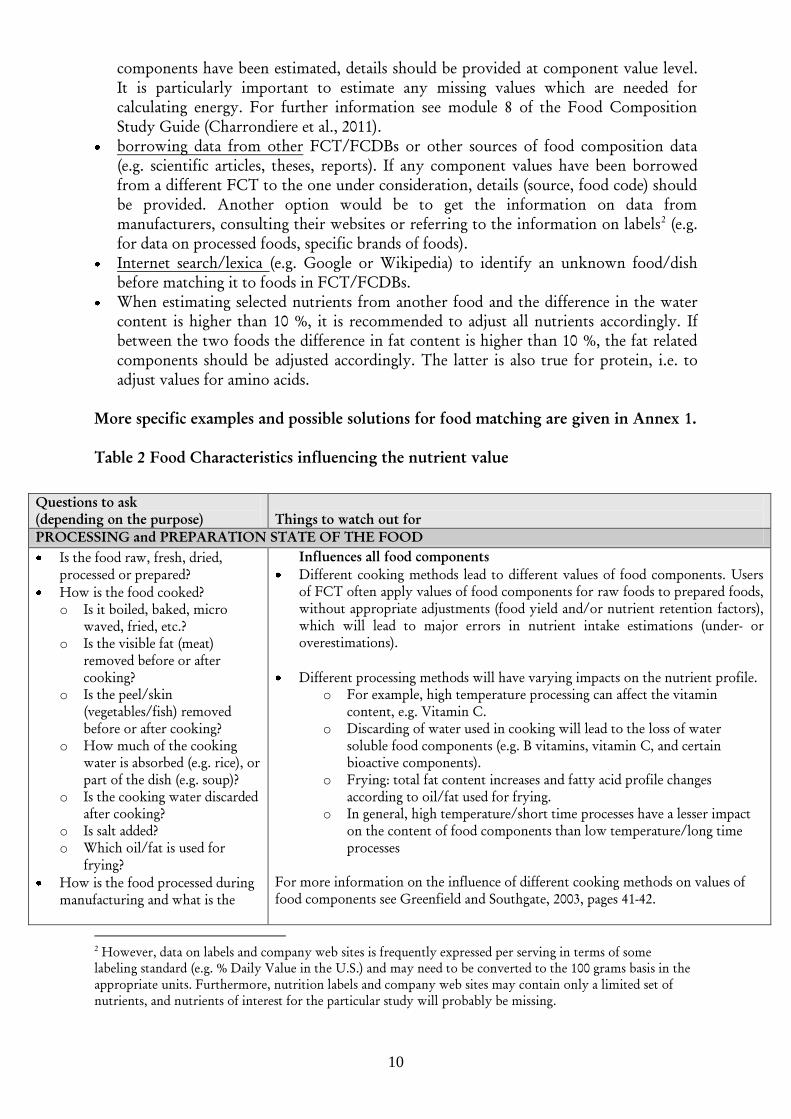
Table 2 Food Characteristics influencing the nutrient value
Questions to ask
(depending on the purpose)
Things to watch out for
PROCESSING and PREPARATION STATE OF THE FOOD
Is the food raw, fresh, dried,
processed or prepared?
How is the food cooked?
o Is it boiled, baked, micro
waved, fried, etc.?
o Is the visible fat (meat)
removed before or after
cooking?
o Is the peel/skin
(vegetables/fish) removed
before or after cooking?
o How much of the cooking
water is absorbed (e.g. rice), or
part of the dish (e.g. soup)?
o Is the cooking water discarded
after cooking?
o Is salt added?
o Which oil/fat is used for
frying?
How is the food processed during
manufacturing and what is the
Influences all food components
Different cooking methods lead to different values of food components. Users
of FCT often apply values of food components for raw foods to prepared foods,
without appropriate adjustments (food yield and/or nutrient retention factors),
which will lead to major errors in nutrient intake estimations (under- or
overestimations).
Different processing methods will have varying impacts on the nutrient profile.
o For example, high temperature processing can affect the vitamin
content, e.g. Vitamin C.
o Discarding of water used in cooking will lead to the loss of water
soluble food components (e.g. B vitamins, vitamin C, and certain
bioactive components).
o Frying: total fat content increases and fatty acid profile changes
according to oil/fat used for frying.
o In general, high temperature/short time processes have a lesser impact
on the content of food components than low temperature/long time
processes
For more information on the influence of different cooking methods on values of
food components see Greenfield and Southgate, 2003, pages 41-42.
2
However, data on labels and company web sites is frequently expressed per serving in terms of some
labeling standard (e.g. % Daily Value in the U.S.) and may need to be converted to the 100 grams basis in the
appropriate units. Furthermore, nutrition labels and company web sites may contain only a limited set of
nutrients, and nutrients of interest for the particular study will probably be missing.
11
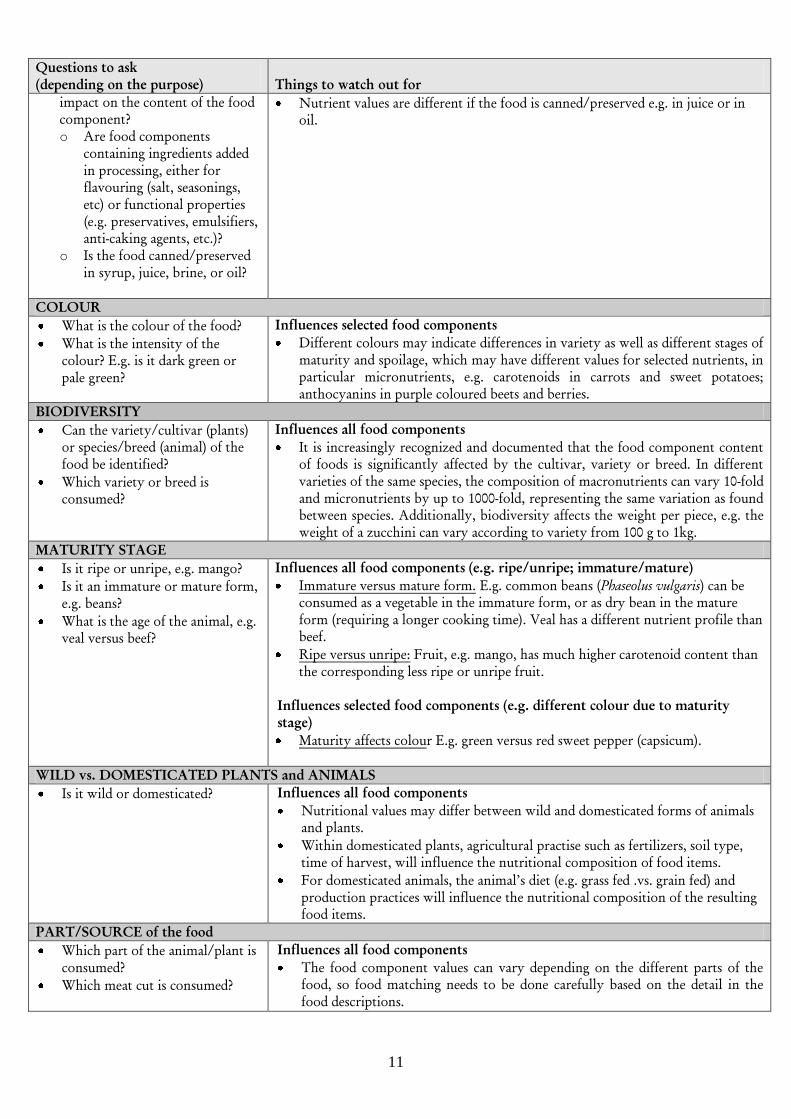
Questions to ask
(depending on the purpose)
Things to watch out for
impact on the content of the food
component?
o Are food components
containing ingredients added
in processing, either for
flavouring (salt, seasonings,
etc) or functional properties
(e.g. preservatives, emulsifiers,
anti-caking agents, etc.)?
o Is the food canned/preserved
in syrup, juice, brine, or oil?
Nutrient values are different if the food is canned/preserved e.g. in juice or in
oil.
COLOUR
What is the colour of the food?
What is the intensity of the
colour? E.g. is it dark green or
pale green?
Influences selected food components
Different colours may indicate differences in variety as well as different stages of
maturity and spoilage, which may have different values for selected nutrients, in
particular micronutrients, e.g. carotenoids in carrots and sweet potatoes;
anthocyanins in purple coloured beets and berries.
BIODIVERSITY
Can the variety/cultivar (plants)
or species/breed (animal) of the
food be identified?
Which variety or breed is
consumed?
Influences all food components
It is increasingly recognized and documented that the food component content
of foods is significantly affected by the cultivar, variety or breed. In different
varieties of the same species, the composition of macronutrients can vary 10-fold
and micronutrients by up to 1000-fold, representing the same variation as found
between species. Additionally, biodiversity affects the weight per piece, e.g. the
weight of a zucchini can vary according to variety from 100 g to 1kg.
MATURITY STAGE
Is it ripe or unripe, e.g. mango?
Is it an immature or mature form,
e.g. beans?
What is the age of the animal, e.g.
veal versus beef?
Influences all food components (e.g. ripe/unripe; immature/mature)
Immature versus mature form. E.g. common beans (Phaseolus vulgaris) can be
consumed as a vegetable in the immature form, or as dry bean in the mature
form (requiring a longer cooking time). Veal has a different nutrient profile than
beef.
Ripe versus unripe: Fruit, e.g. mango, has much higher carotenoid content than
the corresponding less ripe or unripe fruit.
Influences selected food components (e.g. different colour due to maturity
stage)
Maturity affects colour E.g. green versus red sweet pepper (capsicum).
WILD vs. DOMESTICATED PLANTS and ANIMALS
Is it wild or domesticated? Influences all food components
Nutritional values may differ between wild and domesticated forms of animals
and plants.
Within domesticated plants, agricultural practise such as fertilizers, soil type,
time of harvest, will influence the nutritional composition of food items.
For domesticated animals, the animal’s diet (e.g. grass fed .vs. grain fed) and
production practices will influence the nutritional composition of the resulting
food items.
PART/SOURCE of the food
Which part of the animal/plant is
consumed?
Which meat cut is consumed?
Influences all food components
The food component values can vary depending on the different parts of the
food, so food matching needs to be done carefully based on the detail in the
food descriptions.

12
Questions to ask
(depending on the purpose)
Things to watch out for
Examples:
o Chicken can be chicken breast or chicken leg
o Beef has many different “cuts” with varying ratios of fat to lean, which
affect
the nutrient profile
o Cassava can mean either the tuber or the leaves
REFUSE/EDIBLE PORTION
Which parts are edible?
Is the food consumed with or
without the skin? (e.g. apple,
peach)
Influences all food components
Parts of the food considered edible vary around the world (cultural differences)
and among different ethnic, age or gender groups within a country. For
example, children may consider the fuzzy skin of a peach inedible, while adults
may not. Similarly, peaches may be eaten with the skin in some countries, but
not in others. Therefore, it is important to check the food descriptions and the
edible portion carefully when borrowing data from other countries.
Examples:
o Tops and bottoms of beets
o Rind of cheese
o Parts of animals; fish with and without head or skin
o Apple, with or without skin
o Walnuts (can be in shell or shelled)
The unit weight and the variety need to be considered as well— e.g. banana: small
unit weight = higher refuse factor. (big banana – less refuse)
FORTIFICATION/ENRICHMENT 3
of processed food
Fortification and supplementation 4
Is the food fortified/enriched?
With what is the food
fortified/enriched?
Which fortification/enrichment
standards are used in the country?
To which level are food
components added? E.g. 25 % of
the recommended daily value or
exact amount is provided.
Is the food imported from a
country where the food is
generally fortified/enriched?
Does the food/dish contain an
ingredient that maybe
fortified/enriched?
Influences selected food components
Food fortification/enrichment is widely used in developed countries and
increasingly used in developing countries. Food components added include
mostly vitamins and minerals. Foods which are commonly fortified/enriched
include cereals and cereal based products, milk and milk products, fat and oil
items, sugar, tea and other beverages such as fruit juices or sports drinks. The
level of fortification/enrichment is country specific because of different food
standards in each country. Even for the same brand name,
fortification/enrichment can vary among countries.
Some foods e.g. breakfast cereals are voluntarily fortified/enriched foods, while
others are mandatorily fortified/enriched, depending on the country.
Fortified/enriched foods are usually not reported in FCT/FCDBs. In countries
were fortification/enrichment is mandatory, these fortified/enriched foods may
be included in the FCT, but not be necessarily specified as such.
3
Fortification= the addition of one or more essential nutrients to a food, whether or not it is normally
contained in the food. Enrichment = the restoration of vitamins and minerals lost during processing (FAO,
1995).
4
Although food supplements are generally not included in FCTs, it is important to be aware that the
inclusion of supplements considerably increase the nutrient intake estimations
ІV. Food component matching
Before using sources of food composition data, it is necessary to check the food component
identification as well as the units and denominators.
1. Food component identification
The comparability of food components of interest should be checked carefully. There are
many food components that informally have the same name but vary because of
differences in:
expression (e.g. carbohydrates available: expressed in monosaccharide equivalents vs. by
weight),
definition (e.g. vitamin A: retinol activity equivalents vs. retinol equivalents) or
analytical methods resulting in different values (e.g. fibre: AOAC-Prosky vs. crude).
Components for which this is relevant include energy, protein, carbohydrate, fat, fibre,
vitamins A, D, E and C, folate, vitamin B6 and niacin. For more details see Annex 2, the
INFOODS tagnames (INFOODS, 2012) and Charrondiere et al., (2011a, b)- Module 4b.
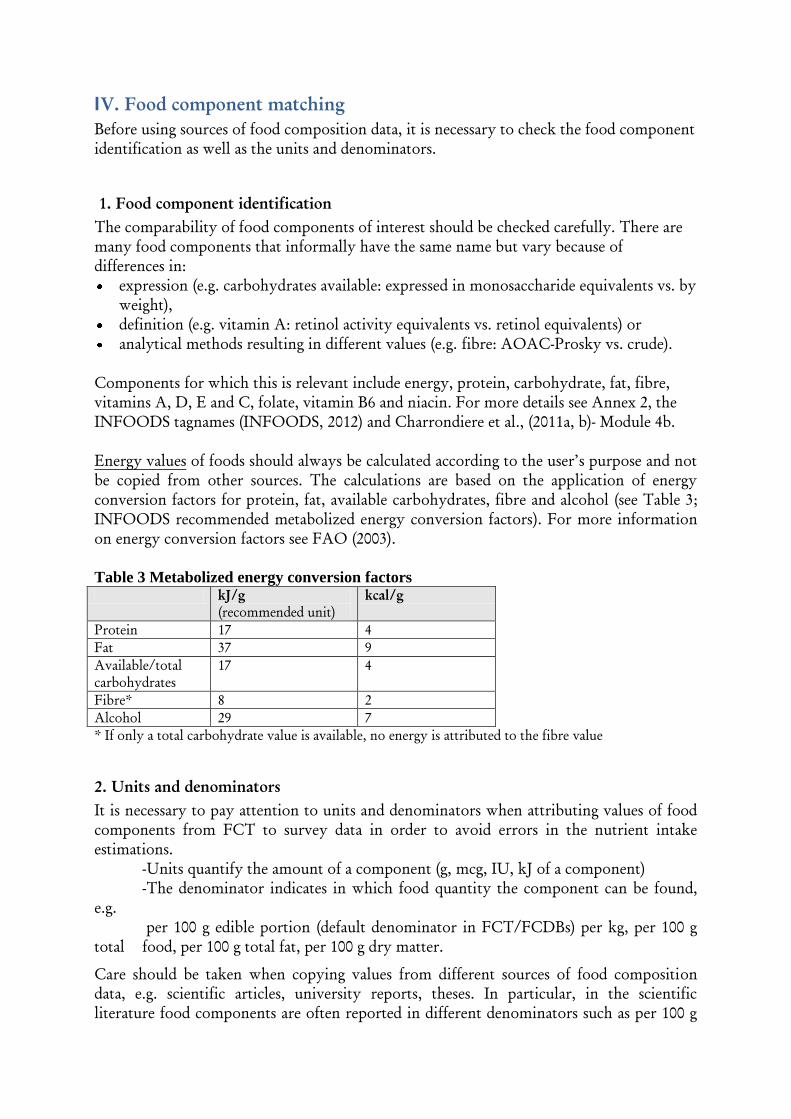
Energy values of foods should always be calculated according to the user’s purpose and not
be copied from other sources. The calculations are based on the application of energy
conversion factors for protein, fat, available carbohydrates, fibre and alcohol (see Table 3;
INFOODS recommended metabolized energy conversion factors). For more information
on energy conversion factors see FAO (2003).
Table 3 Metabolized energy conversion factors kJ/g
(recommended unit)
kcal/g
Protein 17 4
Fat 37 9
Available/total
carbohydrates
17 4
Fibre* 8 2
Alcohol 29 7
* If only a total carbohydrate value is available, no energy is attributed to the fibre value
2. Units and denominators
It is necessary to pay attention to units and denominators when attributing values of food
components from FCT to survey data in order to avoid errors in the nutrient intake
estimations.
-Units quantify the amount of a component (g, mcg, IU, kJ of a component)
-The denominator indicates in which food quantity the component can be found,
e.g.
per 100 g edible portion (default denominator in FCT/FCDBs) per kg, per 100 g
total food, per 100 g total fat, per 100 g dry matter.
Care should be taken when copying values from different sources of food composition
data, e.g. scientific articles, university reports, theses. In particular, in the scientific
literature food components are often reported in different denominators such as per 100 g

14
dry matter, per 100 g fat, per 100 g protein or per 100 g total food. To address these issues,
INFOODS developed Guidelines on Conversion from different units and denominators to
per 100 g edible portion (FAO/INFOODS, 2012a)
Special attention needs to be given to liquids as they have different densities. Many surveys
and scientific literature, as well as a few FCT/FCDB report liquids and some food such as
ice-cream per 100 mL, while in most FCT/FCDBS the units used are per 100 g.
Recalculations from mL to mg may be needed using density factors to convert from one
unit to another. INFOODS developed a density DB to convert volumes into weight and
vice versa (FAO/INFOODS, 2012b)
15
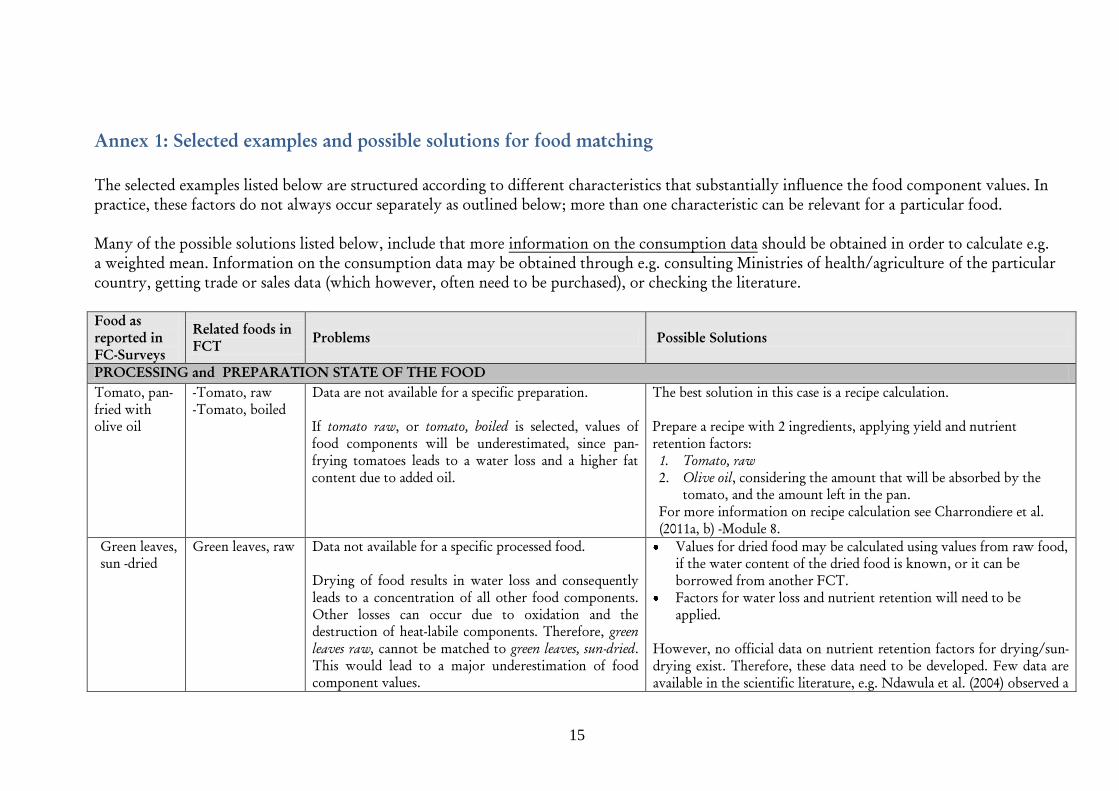
Annex 1: Selected examples and possible solutions for food matching
The selected examples listed below are structured according to different characteristics that substantially influence the food component values. In
practice, these factors do not always occur separately as outlined below; more than one characteristic can be relevant for a particular food.
Many of the possible solutions listed below, include that more information on the consumption data should be obtained in order to calculate e.g.
a weighted mean. Information on the consumption data may be obtained through e.g. consulting Ministries of health/agriculture of the particular
country, getting trade or sales data (which however, often need to be purchased), or checking the literature.
Food as
reported in
FC-Surveys
Related foods in
FCT Problems Possible Solutions
PROCESSING and PREPARATION STATE OF THE FOOD
Tomato, pan-
fried with
olive oil
-Tomato, raw
-Tomato, boiled
Data are not available for a specific preparation.
If tomato raw, or tomato, boiled is selected, values of
food components will be underestimated, since pan-
frying tomatoes leads to a water loss and a higher fat
content due to added oil.
The best solution in this case is a recipe calculation.
Prepare a recipe with 2 ingredients, applying yield and nutrient
retention factors:
1. Tomato, raw
2. Olive oil, considering the amount that will be absorbed by the
tomato, and the amount left in the pan.
For more information on recipe calculation see Charrondiere et al.
(2011a, b) -Module 8.
Green leaves,
sun -dried
Green leaves, raw Data not available for a specific processed food.
Drying of food results in water loss and consequently
leads to a concentration of all other food components.
Other losses can occur due to oxidation and the
destruction of heat-labile components. Therefore, green
leaves raw, cannot be matched to green leaves, sun-dried.
This would lead to a major underestimation of food
component values.
Values for dried food may be calculated using values from raw food,
if the water content of the dried food is known, or it can be
borrowed from another FCT.
Factors for water loss and nutrient retention will need to be
applied.
However, no official data on nutrient retention factors for drying/sun-
drying exist. Therefore, these data need to be developed. Few data are
available in the scientific literature, e.g. Ndawula et al. (2004) observed a
16
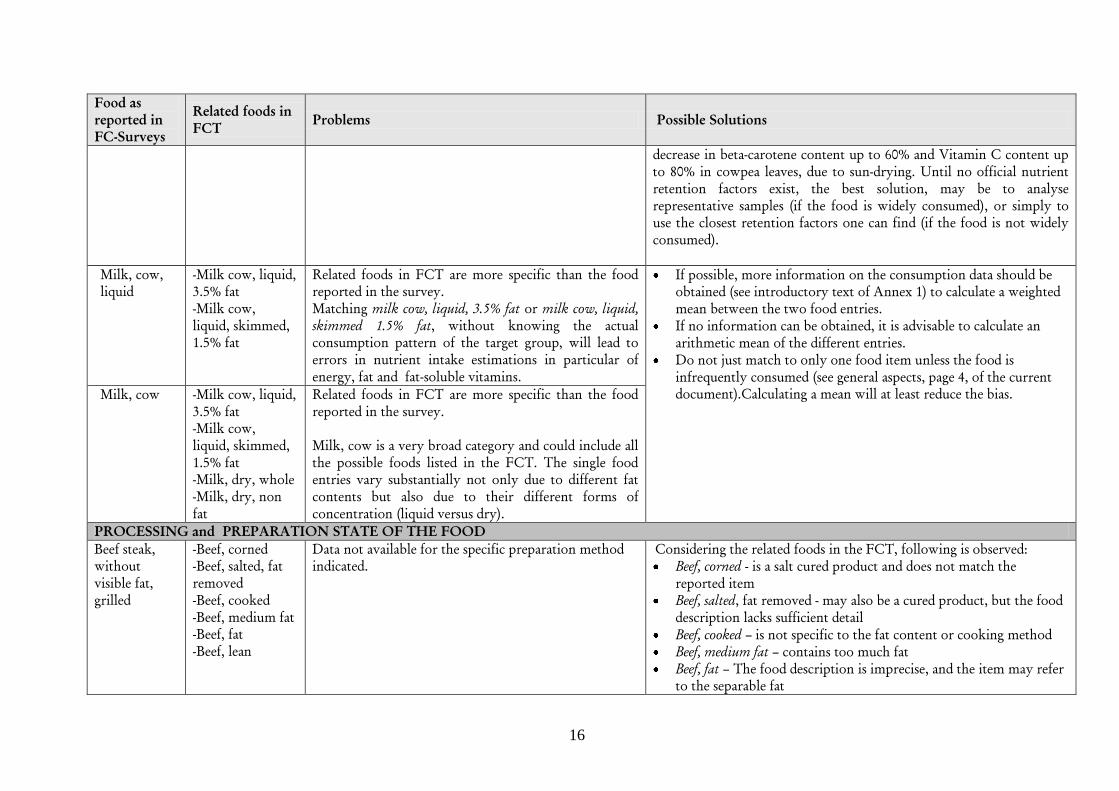
Food as
reported in
FC-Surveys
Related foods in
FCT Problems Possible Solutions
decrease in beta-carotene content up to 60% and Vitamin C content up
to 80% in cowpea leaves, due to sun-drying. Until no official nutrient
retention factors exist, the best solution, may be to analyse
representative samples (if the food is widely consumed), or simply to
use the closest retention factors one can find (if the food is not widely
consumed).
Milk, cow,
liquid
-Milk cow, liquid,
3.5% fat
-Milk cow,
liquid, skimmed,
1.5% fat
Related foods in FCT are more specific than the food
reported in the survey.
Matching milk cow, liquid, 3.5% fat or milk cow, liquid,
skimmed 1.5% fat, without knowing the actual
consumption pattern of the target group, will lead to
errors in nutrient intake estimations in particular of
energy, fat and fat-soluble vitamins.
If possible, more information on the consumption data should be
obtained (see introductory text of Annex 1) to calculate a weighted
mean between the two food entries.
If no information can be obtained, it is advisable to calculate an
arithmetic mean of the different entries.
Do not just match to only one food item unless the food is
infrequently consumed (see general aspects, page 4, of the current
document).Calculating a mean will at least reduce the bias.
Milk, cow -Milk cow, liquid,
3.5% fat
-Milk cow,
liquid, skimmed,
1.5% fat
-Milk, dry, whole
-Milk, dry, non
fat
Related foods in FCT are more specific than the food
reported in the survey.
Milk, cow is a very broad category and could include all
the possible foods listed in the FCT. The single food
entries vary substantially not only due to different fat
contents but also due to their different forms of
concentration (liquid versus dry).
PROCESSING and PREPARATION STATE OF THE FOOD
Beef steak,
without
visible fat,
grilled
-Beef, corned
-Beef, salted, fat
removed
-Beef, cooked
-Beef, medium fat
-Beef, fat
-Beef, lean
Data not available for the specific preparation method
indicated.
Considering the related foods in the FCT, following is observed:
Beef, corned - is a salt cured product and does not match the
reported item
Beef, salted, fat removed - may also be a cured product, but the food
description lacks sufficient detail
Beef, cooked – is not specific to the fat content or cooking method
Beef, medium fat – contains too much fat
Beef, fat – The food description is imprecise, and the item may refer
to the separable fat

17
Food as
reported in
FC-Surveys
Related foods in
FCT Problems Possible Solutions
Beef, lean – is probably the best choice, because once the visible fat is
trimmed (beef steak without visible fat) it is similar to lean meat.
However, the food description in the FCT does not indicate if the beef
is raw or cooked, and if cooked, which cooking method is used.
If the selected food in the FCT is raw, appropriate yield and nutrient
retention factors will need to be applied. For more information on
recipe calculation see Charrondiere et al. (2011a, b)-Module 8.
Frozen
lasagne
(Kraft Foods)
not available This food is not included in the FCT/FCDB.
Generally, data on processed foods are frequently not
reported in a FCT. In addition, specific brands of foods
identified in a survey may not be reported in the
FCT/FCDB.
One solution would be to get the information from manufacturers,
but this can be a major challenge.
Referring to information on the labels or consulting the websites of
the manufacturers would be another option. However, data on
labels and company websites is frequently expressed per serving in
terms of some labelling standard (e.g. % Daily Value in the U.S.)
and may need to be converted to the 100 grams basis in the
appropriate units. In addition only few nutrients are on the label.
If no data can be obtained, get information of a standard recipe
from e.g. national cooking books or websites and conduct a recipe
calculation by applying appropriate yield and nutrient retention
factors. For more information on recipe calculation see
Charrondiere et al. (2011a, b)-Module 8.
COLOUR OF THE FOOD
Mango, dark
orange flesh,
very ripe
-Mango, raw
-Mango, ripe
-Mango, orange
flesh
Different colours and different maturity stages indicate
different nutrient contents, in particular of
micronutrients, e.g. carotenoids
Dark orange mango, very ripe indicates that the food is high in
carotenoidss. Therefore, care must be taken in matching the dark
orange mango, very ripe to the mango with the highest carotenoid
values.

18
Food as
reported in
FC-Surveys
Related foods in
FCT Problems Possible Solutions
Leaves, raw -Leaves, dark
green, raw
-Leaves, green,
raw
Colour of leaves, raw is not indicated in the Food
Consumption Survey.
Different colours indicate different contents of food
components, in particular of micronutrients, e.g.
carotenoids. Leaves, dark green raw, have a much higher
carotenoid content than leaves, green raw.
If possible, more information on the consumption data should be
obtained (see introductory text of Annex 1) to calculate a weighted
mean between the two food entries.
If no information can be obtained, it is advisable to calculate an
arithmetic mean of the different entries.
Do not just match to only one food item unless the food is
infrequently consumed (see general aspects, page 4, of the current
document).Calculating a mean will at least reduce the bias.
BIODIVERSITY
Mango
Badami, dark
orange fleshed
Mango
Food reported in survey is very specific, while FCT has
a generic food item.
It is known that there are large differences in e.g. beta-
carotene among different cultivars.
The beta-carotene content for mango, reported in the
FCT is an average value. Therefore, nutrient intake
estimations in regard to vitamin A will be substantially
underestimated.
It is necessary to search in other FCT/FCBSs, or other sources of
food composition data (scientific articles, theses, reports) for a more
appropriate beta-carotene value for mango, which may allow a
better match and a better vitamin A intake estimation.
Apple -Apple, Granny
Smith
-Apple, own
country
-Apple, imported
Apple, all
varieties
The reported food is not specific in terms of variety If possible, more information on the consumption data should be
obtained (see introductory text of Annex 1) to calculate a weighted
mean between the two food entries.
If no information can be obtained, it is advisable to calculate an
arithmetic mean of the different entries.
Do not just match to only one food item unless the food is
infrequently consumed (see general aspects, page 4, of the current
document).Calculating a mean will at least reduce the bias.
PART/SOURCE of food
Lamb meat -Lamb, loin,
separable lean and
fat
-Lamb, loin,
separable lean
only
It is not stated which part of the lamb is consumed.
Moreover no information is given whether the lamb
meat is raw or cooked and if cooked, how.
If possible, more information on the consumption data should be
obtained for both, the most consumed part of the meat, as well as
the most commonly used cooking method (see introductory text of
Annex1). This information will allow calculating a weighted mean
between the two food entries.
If no information can be obtained, it is advisable to calculate an

19
Food as
reported in
FC-Surveys
Related foods in
FCT Problems Possible Solutions
-Lamb, shoulder,
whole (arm and
blade), without
visible fat
-Lamb rib,
separable lean
only
-Lamb, leg, centre
slice, bone-in or
boneless
arithmetic mean of the different entries.
Do not just match to only one food item unless the food is
infrequently consumed (see general aspects, page 4, of the current
document).Calculating a mean will at least reduce the bias.
If the reported food is cooked, appropriate yield and nutrient
retention factors will need to be applied, after investigating of the
most commonly used cooking method. For more information on
recipe calculation see Charrondiere et al. (2011a, b)-Module 8.
Apple -Apple, peeled
-Apple, whole
with skin
No information is given whether the food is consumed
with or without the skin.
If possible, more information on the consumption data should be
obtained (see introductory text of Annex 1) to calculate a weighted
mean between the two food entries.
If no information can be obtained, it is advisable to calculate an
arithmetic mean of the different entries.
Do not just match to only one food item unless the food is
infrequently consumed (see general aspects, page 4, of the current
document).Calculating a mean will at least reduce the bias.
Milk -Milk, buffalo,
raw
-Milk, cow, 3.5%
fat, raw
-Milk, cow, 1.5%
fat, raw
-Chocolate milk
-Milk, goat, raw
-Milk, rice
-Milk, soy
It is not known which type of milk is consumed.
The term milk is very generic. The difference in all
values of food components can vary substantially e.g.
with different species, fat contents and additions e.g.
chocolate.
If possible, more information on the consumption data should be
obtained (see introductory text of Annex 1) to calculate a weighted
mean between the two food entries.
Consider cultural aspects. For example, in some countries buffalo
and goat milk may be difficult to find in urban areas, or somewhere
else rice and soy milk would not be considered as milk.
If no additional information can be obtained, calculate the mean of
all the entries, after excluding any implausible food items according
to your expert judgement.
EDIBLE PORTION
Sardine -Sardine, fillet,
-Sardine, whole
It is not known if the fish is consumed whole or as fillet.
Values of calcium, vitamin A and fat may vary
substantially depending if sardine, whole or if just the
If possible, more information on the consumption data should be
obtained (see introductory text of Annex 1) to calculate a weighted
mean between the two food entries.
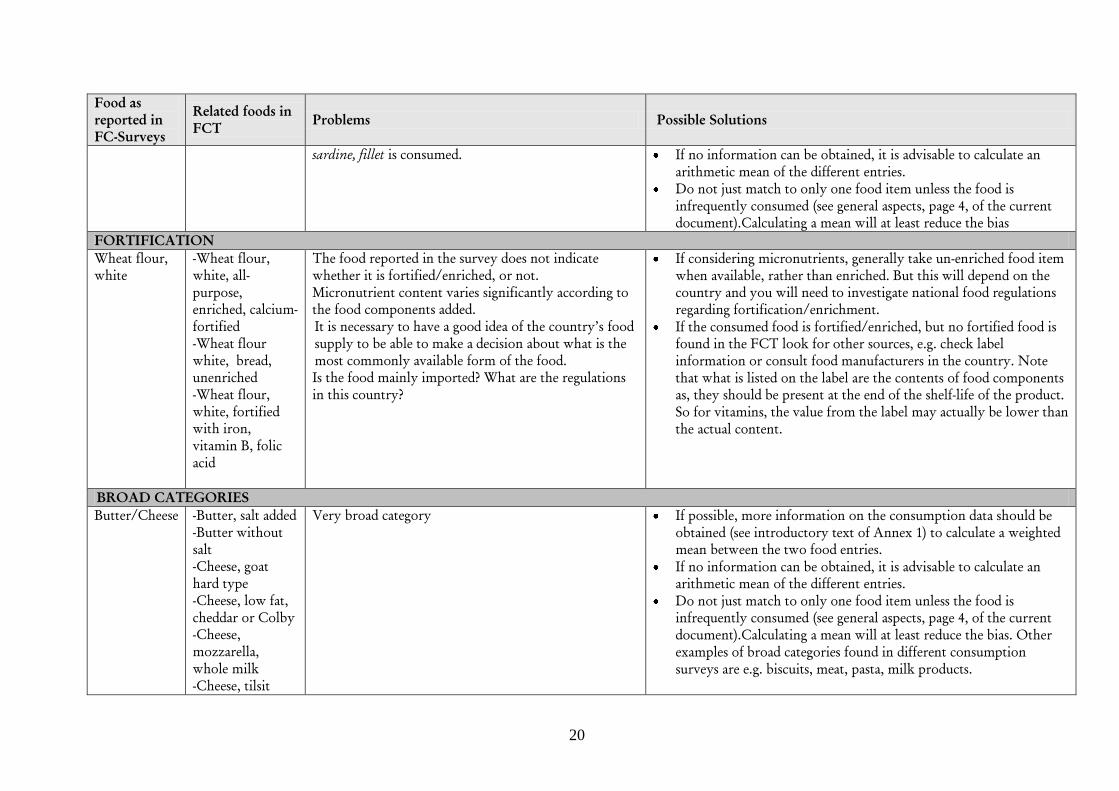
20
Food as
reported in
FC-Surveys
Related foods in
FCT Problems Possible Solutions
sardine, fillet is consumed. If no information can be obtained, it is advisable to calculate an
arithmetic mean of the different entries.
Do not just match to only one food item unless the food is
infrequently consumed (see general aspects, page 4, of the current
document).Calculating a mean will at least reduce the bias
FORTIFICATION
Wheat flour,
white
-Wheat flour,
white, all-
purpose,
enriched, calcium-
fortified
-Wheat flour
white, bread,
unenriched
-Wheat flour,
white, fortified
with iron,
vitamin B, folic
acid
The food reported in the survey does not indicate
whether it is fortified/enriched, or not.
Micronutrient content varies significantly according to
the food components added.
It is necessary to have a good idea of the country’s food
supply to be able to make a decision about what is the
most commonly available form of the food.
Is the food mainly imported? What are the regulations
in this country?
If considering micronutrients, generally take un-enriched food item
when available, rather than enriched. But this will depend on the
country and you will need to investigate national food regulations
regarding fortification/enrichment.
If the consumed food is fortified/enriched, but no fortified food is
found in the FCT look for other sources, e.g. check label
information or consult food manufacturers in the country. Note
that what is listed on the label are the contents of food components
as, they should be present at the end of the shelf-life of the product.
So for vitamins, the value from the label may actually be lower than
the actual content.
BROAD CATEGORIES
Butter/Cheese -Butter, salt added
-Butter without
salt
-Cheese, goat
hard type
-Cheese, low fat,
cheddar or Colby
-Cheese,
mozzarella,
whole milk
-Cheese, tilsit
Very broad category If possible, more information on the consumption data should be
obtained (see introductory text of Annex 1) to calculate a weighted
mean between the two food entries.
If no information can be obtained, it is advisable to calculate an
arithmetic mean of the different entries.
Do not just match to only one food item unless the food is
infrequently consumed (see general aspects, page 4, of the current
document).Calculating a mean will at least reduce the bias. Other
examples of broad categories found in different consumption
surveys are e.g. biscuits, meat, pasta, milk products.

21
Food as
reported in
FC-Surveys
Related foods in
FCT Problems Possible Solutions
-Cheese, ricotta,
-Parmesan
RECIPE UNKNOWN
Muri (Product
of rice)
/Bangladesh
Rice, raw Food form the consumption survey cannot be found in
the FCT. Unknown recipe
Google, Wikipedia search to identify the food. (E.g. Muri =fried
rice. It is a traditional food of Bangladesh and India). Search for a
standardized recipes in the particular country/region. Information
could be retrieved e.g. trough national cooking books, websites.
Recipe calculation. List all the necessary ingredients for Muri and
apply yield and nutrient retention factors appropriately.
For more information on recipe calculation see Charrondiere et al.
(2011a, b)-Module 8.
EXOTIC FOODS
Grasshopper Not available Food form the consumption survey cannot be found in
the FCT.
It is necessary to search in other FCT/FCBSs, or other sources of
food composition data (scientific articles, theses, reports) for the
particular food, e.g. the Chinese FCT contains many different
exotic foods.
Insects Not available Food form the consumption survey cannot be found in
the FCT. Moreover, the requested food item insects is a
broad category.
It is necessary to search in other FCT/FCBSs, or other sources of
food composition data (scientific articles, theses, reports) for the
particular food, e.g. the Chinese FCT contains many different
exotic foods (China Food Composition, 2002).
Match at least 3 foods since insects is a broad category and calculate
a mean of the different entries, unless it is an unimportant food in
which case it can be matched to one food.
FC = Food Consumption
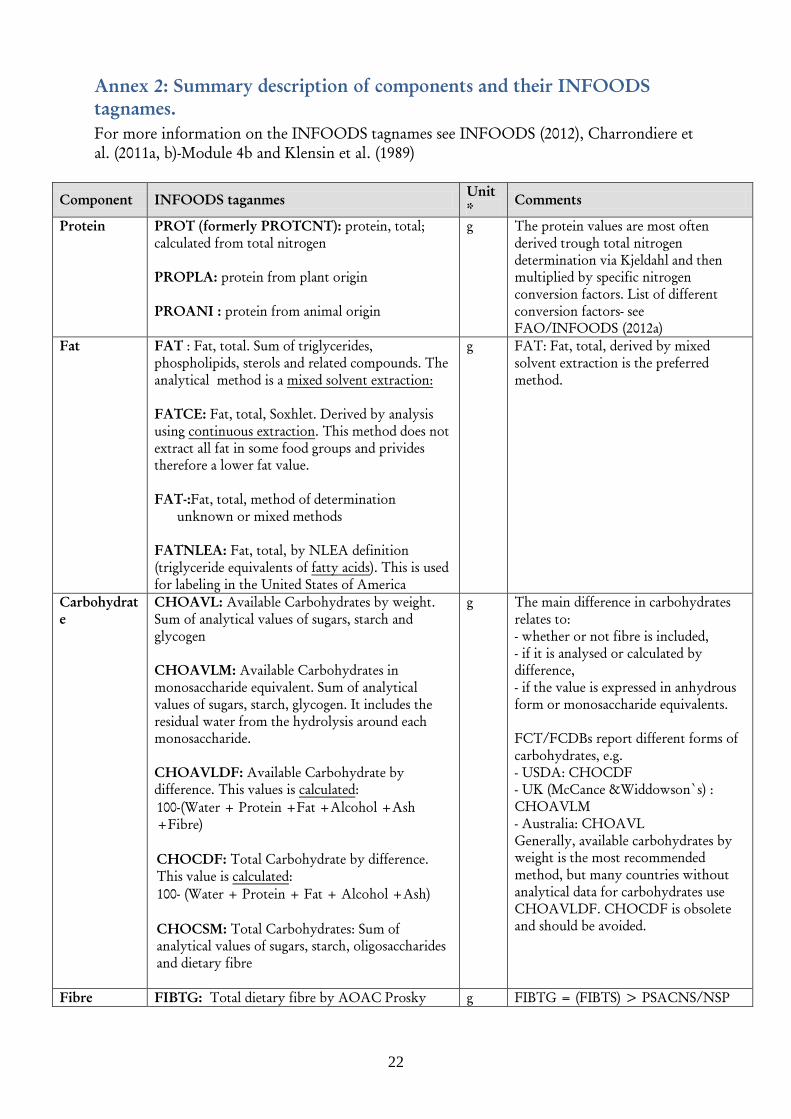
22
Annex 2: Summary description of components and their INFOODS
tagnames.
For more information on the INFOODS tagnames see INFOODS (2012), Charrondiere et
al. (2011a, b)-Module 4b and Klensin et al. (1989)
Component INFOODS taganmes Unit
* Comments
Protein PROT (formerly PROTCNT): protein, total;
calculated from total nitrogen
PROPLA: protein from plant origin
PROANI : protein from animal origin
g The protein values are most often
derived trough total nitrogen
determination via Kjeldahl and then
multiplied by specific nitrogen
conversion factors. List of different
conversion factors- see
FAO/INFOODS (2012a)
Fat FAT : Fat, total. Sum of triglycerides,
phospholipids, sterols and related compounds. The
analytical method is a mixed solvent extraction:
FATCE: Fat, total, Soxhlet. Derived by analysis
using continuous extraction. This method does not
extract all fat in some food groups and privides
therefore a lower fat value.
FAT-:Fat, total, method of determination
unknown or mixed methods
FATNLEA: Fat, total, by NLEA definition
(triglyceride equivalents of fatty acids). This is used
for labeling in the United States of America
g FAT: Fat, total, derived by mixed
solvent extraction is the preferred
method.
Carbohydrat
e
CHOAVL: Available Carbohydrates by weight.
Sum of analytical values of sugars, starch and
glycogen
CHOAVLM: Available Carbohydrates in
monosaccharide equivalent. Sum of analytical
values of sugars, starch, glycogen. It includes the
residual water from the hydrolysis around each
monosaccharide.
CHOAVLDF: Available Carbohydrate by
difference. This values is calculated:
100-(Water + Protein +Fat +Alcohol +Ash
+Fibre)
CHOCDF: Total Carbohydrate by difference.
This value is calculated:
100- (Water + Protein + Fat + Alcohol +Ash)
CHOCSM: Total Carbohydrates: Sum of
analytical values of sugars, starch, oligosaccharides
and dietary fibre
g The main difference in carbohydrates
relates to:
- whether or not fibre is included,
- if it is analysed or calculated by
difference,
- if the value is expressed in anhydrous
form or monosaccharide equivalents.
FCT/FCDBs report different forms of
carbohydrates, e.g.
- USDA: CHOCDF
- UK (McCance &Widdowson`s) :
CHOAVLM
- Australia: CHOAVL
Generally, available carbohydrates by
weight is the most recommended
method, but many countries without
analytical data for carbohydrates use
CHOAVLDF. CHOCDF is obsolete
and should be avoided.
Fibre FIBTG: Total dietary fibre by AOAC Prosky g FIBTG = (FIBTS) > PSACNS/NSP
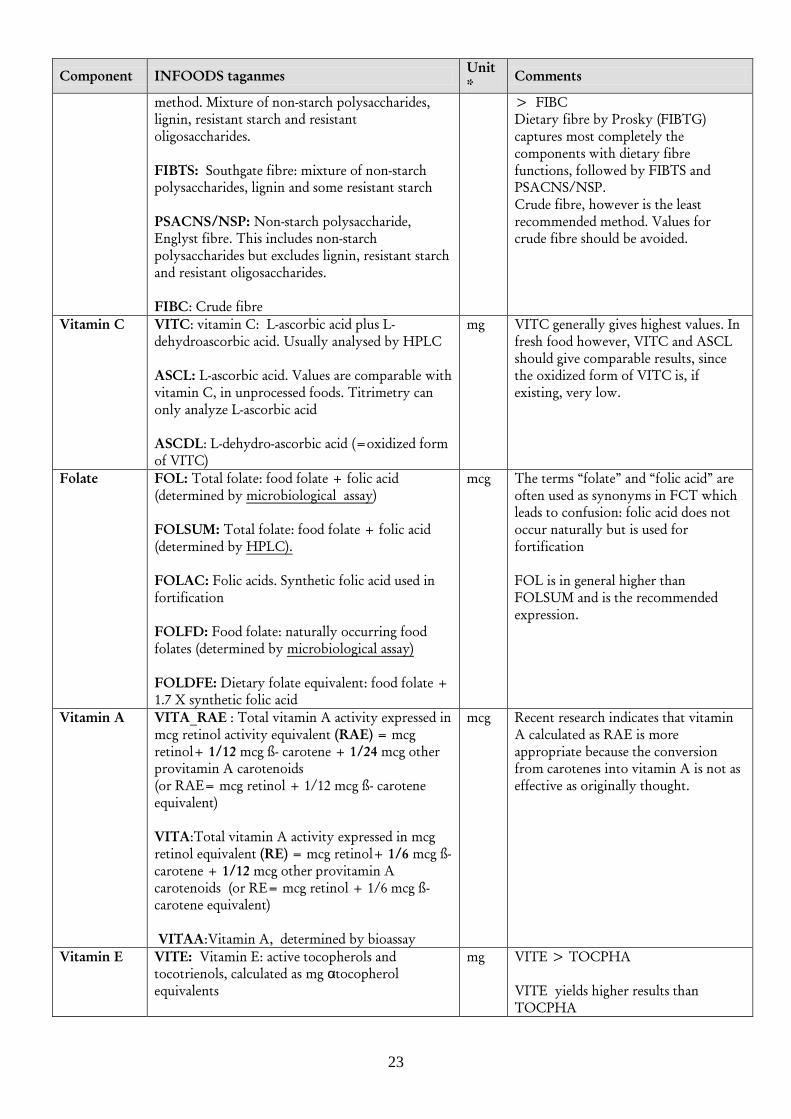
23
Component INFOODS taganmes Unit
* Comments
method. Mixture of non-starch polysaccharides,
lignin, resistant starch and resistant
oligosaccharides.
FIBTS: Southgate fibre: mixture of non-starch
polysaccharides, lignin and some resistant starch
PSACNS/NSP: Non-starch polysaccharide,
Englyst fibre. This includes non-starch
polysaccharides but excludes lignin, resistant starch
and resistant oligosaccharides.
FIBC: Crude fibre
> FIBC
Dietary fibre by Prosky (FIBTG)
captures most completely the
components with dietary fibre
functions, followed by FIBTS and
PSACNS/NSP.
Crude fibre, however is the least
recommended method. Values for
crude fibre should be avoided.
Vitamin C VITC: vitamin C: L-ascorbic acid plus L-
dehydroascorbic acid. Usually analysed by HPLC
ASCL: L-ascorbic acid. Values are comparable with
vitamin C, in unprocessed foods. Titrimetry can
only analyze L-ascorbic acid
ASCDL: L-dehydro-ascorbic acid (=oxidized form
of VITC)
mg VITC generally gives highest values. In
fresh food however, VITC and ASCL
should give comparable results, since
the oxidized form of VITC is, if
existing, very low.
Folate FOL: Total folate: food folate + folic acid
(determined by microbiological assay)
FOLSUM: Total folate: food folate + folic acid
(determined by HPLC).
FOLAC: Folic acids. Synthetic folic acid used in
fortification
FOLFD: Food folate: naturally occurring food
folates (determined by microbiological assay)
FOLDFE: Dietary folate equivalent: food folate +
1.7 X synthetic folic acid
mcg The terms “folate” and “folic acid” are
often used as synonyms in FCT which
leads to confusion: folic acid does not
occur naturally but is used for
fortification
FOL is in general higher than
FOLSUM and is the recommended
expression.
Vitamin A VITA_RAE : Total vitamin A activity expressed in
mcg retinol activity equivalent (RAE) = mcg
retinol+ 1/12 mcg ß- carotene + 1/24 mcg other
provitamin A carotenoids
(or RAE= mcg retinol + 1/12 mcg ß- carotene
equivalent)
VITA:Total vitamin A activity expressed in mcg
retinol equivalent (RE) = mcg retinol+ 1/6 mcg ß-
carotene + 1/12 mcg other provitamin A
carotenoids (or RE= mcg retinol + 1/6 mcg ß-
carotene equivalent)
VITAA:Vitamin A, determined by bioassay
mcg Recent research indicates that vitamin
A calculated as RAE is more
appropriate because the conversion
from carotenes into vitamin A is not as
effective as originally thought.
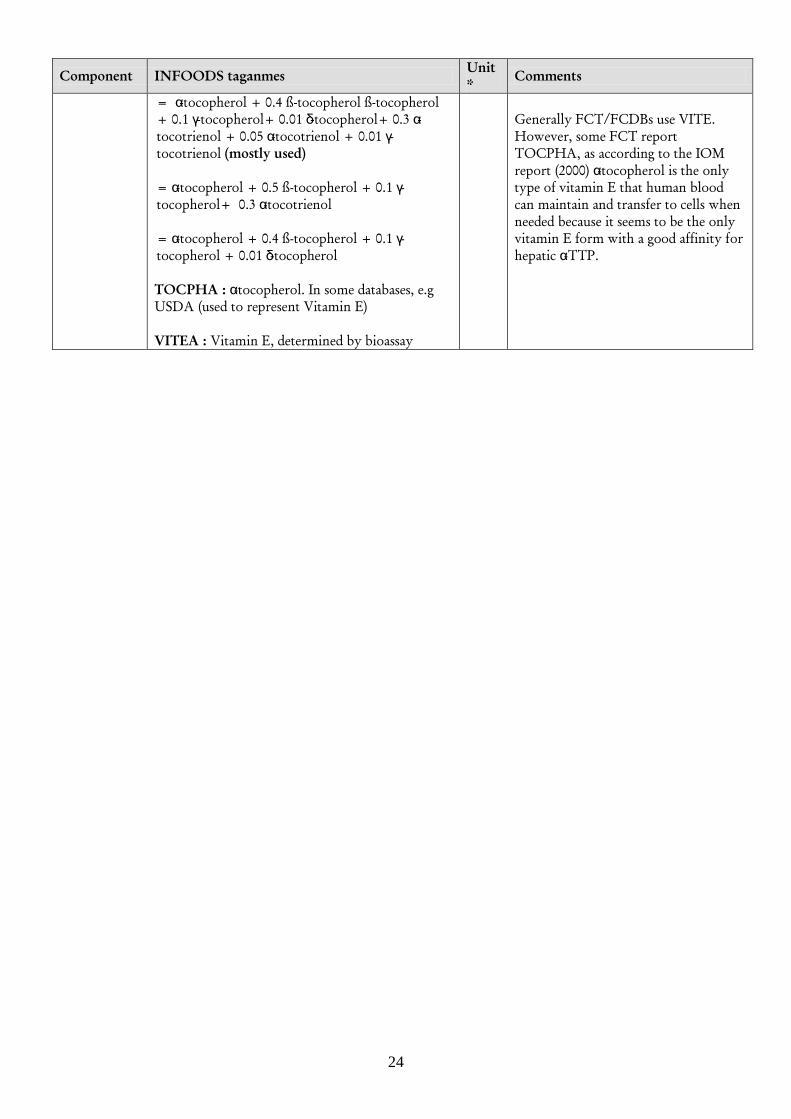
Vitamin E VITE: Vitamin E: active tocopherols and
tocotrienols, calculated as mg α-tocopherol
equivalents
mg VITE > TOCPHA
VITE yields higher results than
TOCPHA
24
Component INFOODS taganmes Unit
* Comments
= α-tocopherol + 0.4 ß-tocopherol ß-tocopherol
+ 0.1 γ-tocopherol+ 0.01 δ-tocopherol+ 0.3 α-
tocotrienol + 0.05 α-tocotrienol + 0.01 γ-
tocotrienol (mostly used)
= α-tocopherol + 0.5 ß-tocopherol + 0.1 γ-
tocopherol+ 0.3 α-tocotrienol
= α-tocopherol + 0.4 ß-tocopherol + 0.1 γ-
tocopherol + 0.01 δ-tocopherol
TOCPHA : α-tocopherol. In some databases, e.g
USDA (used to represent Vitamin E)
VITEA : Vitamin E, determined by bioassay
Generally FCT/FCDBs use VITE.
However, some FCT report
TOCPHA, as according to the IOM
report (2000) α-tocopherol is the only
type of vitamin E that human blood
can maintain and transfer to cells when
needed because it seems to be the only
vitamin E form with a good affinity for
hepatic α-TTP.
25
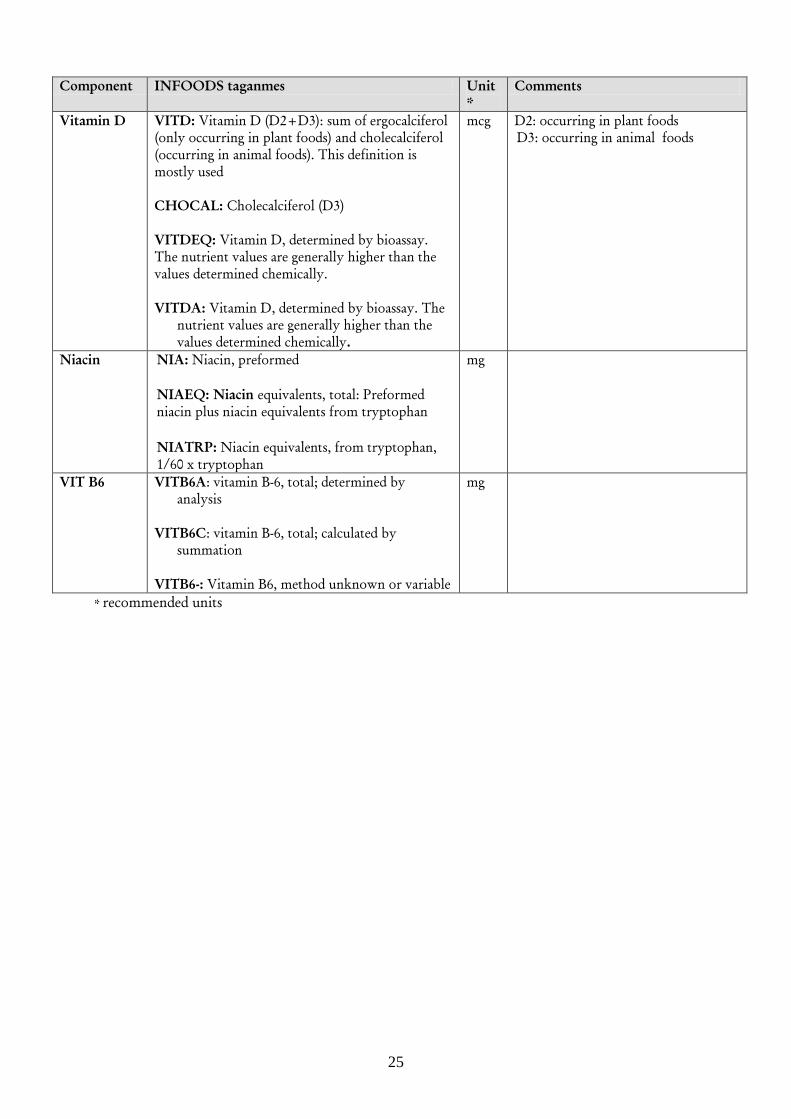
Component INFOODS taganmes Unit
*
Comments
Vitamin D VITD: Vitamin D (D2+D3): sum of ergocalciferol
(only occurring in plant foods) and cholecalciferol
(occurring in animal foods). This definition is
mostly used
CHOCAL: Cholecalciferol (D3)
VITDEQ: Vitamin D, determined by bioassay.
The nutrient values are generally higher than the
values determined chemically.
VITDA: Vitamin D, determined by bioassay. The
nutrient values are generally higher than the
values determined chemically.
mcg D2: occurring in plant foods
D3: occurring in animal foods
Niacin NIA: Niacin, preformed
NIAEQ: Niacin equivalents, total: Preformed
niacin plus niacin equivalents from tryptophan
NIATRP: Niacin equivalents, from tryptophan,
1/60 x tryptophan
mg
VIT B6 VITB6A: vitamin B-6, total; determined by
analysis
VITB6C: vitamin B-6, total; calculated by
summation
VITB6-: Vitamin B6, method unknown or variable
mg
* recommended units

26
References
Bognár, A. (2002) Tables of weight yield of food and retention factors of food constituents
for the calculation of nutrition composition of cooked foods (dishes).
Bundesforschungsanstalt für Ernährung, Karlsruhe. Available at:
http://www.mri.bund.de/fileadmin/Veroeffentlichungen/Archiv/Schriftenreihe_Berichte
/bfe-r-02-03.pdf (Accessed November, 2012).
Charrondiere, U.R., Burlingame, B., Berman, S., Elmadfa, I. (2011a) Food
Composition Study Guide. Questions and exercises (volume 1) – second revised edition.
FAO, Rome.Available at http://www.fao.org/infoods/infoods/publications/en/
(Accessed November, 2012).
Charrondiere, U.R., Burlingame, B., Berman, S., Elmadfa, I. (2011b) Food
Composition Study Guide. Questions, exercises and answers (volume 2) – second revised
edition. FAO, Rome. Available at: http://www.fao.org/infoods/infoods/publications/en/
(Accessed November, 2012).
Charrondiere, U.R. (2011) Use of food composition data including limitations.
PowerPoint. FAO, Rome. Available at:
ftp://ftp.fao.org/ag/agn/infoods/use%20of%20FCD%20including%20limitations.pdf
(Accessed November, 2012).
China Food Composition (2002) Institute of Nutrition and Food Safety China CDC,
Beijing 2002. 393 pp (Chinese & English). Available at:
http://www.fao.org/infoods/infoods/tables-and-databases/en/(Accessed November, 2012).
EuroFIR (2008) Report on collection of rules on use of recipe calculation procedures
including the use of yield and retention factors for imputing nutrient values for composite
foods. Available
at:http://www.eurofir.net/sites/default/files/TechWeb%20Downloads/RecipeCalculation
/EuroFIR%20recipe%20calculation%20procedures%20including%20yield%20and%20re.pd
f (Accessed November, 2012).
FAO (2003) Food energy - methods of analysis and conversion factors. FAO, Rome.
Available at: ftp://ftp.fao.org/docrep/fao/006/y5022e/y5022e00.pdf (Accessed November,
2012).
FAO (1995) Technical Consultation on food fortification: Technology and Quality
control, Rome Italy, 20-23 November 1995. Available at
http://www.fao.org/docrep/W2840E/w2840e0b.htm#1.2%20food%20fortification:%20a%
20definition (Accessed November, 2012).
FAO/INFOODS (2012a) FAO/INFOODS Guidelines on Conversion among different
units, denominators and expressions version 1.0. Soon available at
http://www.fao.org/infoods/infoods/standards-guidelines/en/ (Accessed November,
2012).
27
FAO/INFOODS (2012b) FAO/INFOODS Density Database version 2.0 (2012).
Available at: http://www.fao.org/infoods/infoods/tables-and-databases/en/(Accessed
November, 2012).
Greenfield, H. & Southgate, D.A.T (2003) Food composition data – production,
management and use. FAO, Rome. Available at:
ftp://ftp.fao.org/docrep/fao/008/y4705e/y4705e00.pdf (Accessed November, 2012).
Haytowitz, D.B., Pehrsson, P.R. & Holden, J.M. (2002) The Identification of Key Foods
for Food Composition Research. Journal of Food Composition and Analysis 15 (2): 183-
194. Available at: http://www.nal.usda.gov/fnic/foodcomp/Bulletins/keyfoods.htm
(Accessed November, 2012).
INFOODS (2012) Tagnames for food components. Available at:
http://www.fao.org/infoods/infoods/standards-guidelines/food-component-
identifiers/en/ (Accessed November, 2012).
IOM (2000) Dietary Reference Intakes for Vitamin C, Vitamin E, Selenium and
Carotenoids.
National Academy of Sciences. Institute of Medicine. Food and Nutrition Board. Available
at:
http://fnic.nal.usda.gov/dietary-guidance/dri-reports/vitamin-c-vitamin-e-selenium-and-
carotenoids (Accessed November, 2012).
Klensin, J.C., Feskanich, D., Lin, V., Truswell, S.A. & Southgate, D.A.T (1989)
Identification of Food Components for INFOODS Data Interchange. UNU, Tokyo. In
PDF file: Introduction pp. 5-15 and pp. 72-90 to find tagnames. Available at:
http://www.unu.edu/unupress/unupbooks/80734e/80734E00.htm and as PDF file at
ftp://ftp.fao.org/es/esn/infoods/Klensinetal1989Identificationoffoodcomponents.pdf. (Accessed
November, 2012).
McCance and Widdowson’s (2002) 6th
Summary Edition, The Composition of Foods,
Food Standards Agency and Institute of Food Research, Royal Society of Chemistry,
Cambridge
Ndawula, J., Kabasa, J.D. Byaruhanga, Y.B. (2004) Alterations in fruit and vegetables b-
carotene and vitamin C content caused buy open- sun drying, visqueen-covered and
polyethylene- covered solar-dryers. African Health Sciences 4 (2): 125-130.
Rand, W.M., Pennington, J.A.T., Murphy, S.P., Klensin, J.C. (1991) Compiling Data
for Food Composition Data Bases. United Nations University, Hong Kong.

28
Additional literature
Csizmadi, I., Kahle, L., Ullman, R., Dawe, U., Zimmerman, T.P., Friedenreich, C.M.,
Bryant, H., and Subar, A.F. (2006) Adaptation and evaluation of the National Cancer
Institute's Diet History Questionnaire and nutrient database for Canadian populations.
Public Health Nutrition 10 (1):88-96.
Dixon, B.L., Zimmerman, T.P., Kahle, L.L., Subar, A.F. (2003) Adding carotenoids to
the NCI Diet History Questionnaire Database. Journal of Food Composition and Analysis
16 (3): 269-280.
FAO/INFOODS (2012) FAO/INFOODS Guidelines for Checking Food Composition
Data prior to the Publication of a User Table/Database-Version 1.0. FAO, Rome.
Available at
http://www.fao.org/fileadmin/templates/food_composition/documents/upload/Guidelin
es_data_checking.pdf (Accessed November, 2012).
McNutt, S., Zimmerman, T.P., and Hull, S.G (2008) Development of food composition
databases for food frequency questionnaires (FFQ). Journal of Food Composition and
Analysis 21: S20-S26.
Salvini, S., Gnagnarella, P., Parpinel, M.T., Boyle, P., Decarli, A., Ferraroni, M.,
Giacosa, A., La Vecchia, C., Negri, E., Franceschi, S. (1996) The Food Composition
Database for an Italian Food Frequency Questionnaire. Journal of Food Composition and
Analysis 9 (1): 57-71.
Schakel, S.F., Buzzard, I.M., Gebhardt, S.E. (1997) Procedures for estimating nutrient
values in food composition databases. Journal of Food Composition and Analysis 10:102–
114.
Sharma, S., Murphy, S.P., Wilkens, L.R., Au, D., Shen, L., and Kolonel, L.N. (2003)
Extending a multiethnic food composition table to include standardized food group
servings. Journal of Food Composition and Analysis 16:485-495.
Slimani, N., Deharveng, G., Unwin, I., Vignat, J., Skeie, G., Salvini, S., Moller, A.,
Ireland, J., Becker, W., Southgate, D.A.T. (2007) Standardisation of an European end-
user nutrient database for nutritional epidemiology: what can we learn from the EPIC
Nutrient Database (ENDB) Project?, Trends in Food Science & Technology 8 (8) :407-419.
This list is not exhaustive.