establishing a soybean germplasm core collection ·...
TRANSCRIPT
E
MJa
b
6c
d
a
ARRA
KGGGS
1
GautvteppciaSa(
0d
Field Crops Research 119 (2010) 277–289
Contents lists available at ScienceDirect
Field Crops Research
journa l homepage: www.e lsev ier .com/ locate / fc r
stablishing a soybean germplasm core collection
arcelo F. Oliveiraa,∗, Randall L. Nelsonb, Isaias O. Geraldi c, Cosme D. Cruzd,osé Francisco F. de Toledoa
Embrapa Soybean, P.O. Box 231, Londrina, PR 86001-970, BrazilUSDA-Agricultural Research Service, Soybean/Maize Germplasm, Pathology, and Genetics Research Unit, Dept. of Crop Sciences, 1101 W. Peabody Dr., Univ. of Illinois, Urbana, IL1801, United StatesUniversity of São Paulo-Faculdade de Agronomia-ESALQ, Dept. of Genetics, P.O. Box 83, Piracicaba, SP 13400-970, BrazilFederal University of Vicosa, Faculdade de Agronomia, Avenida Peter Henry Rolfs, s/n Campus Universitário, Vicosa, MG 36570-000, Brazil
r t i c l e i n f o
rticle history:eceived 9 March 2010eceived in revised form 23 July 2010ccepted 25 July 2010
eywords:lycine maxenetic diversity
a b s t r a c t
Core collections are of strategic importance as they allow the use of a small part of a germplasm collectionthat is representative of the total collection. The objective of this study was to develop a soybean corecollection of the USDA Soybean Germplasm Collection by comparing the results of random, proportional,logarithmic, multivariate proportional and multivariate logarithmic sampling strategies. All but the ran-dom sampling strategy used stratification of the entire collection based on passport data and maturitygroup classification. The multivariate proportional and multivariate logarithmic strategies made furtheruse of qualitative and quantitative trait data to select diverse accessions within each stratum. The 18
ermplasm bankampling strategies
quantitative trait data distribution parameters were calculated for each core and for the entire collectionfor pairwise comparison to validate the sampling strategies. All strategies were adequate for assemblinga core collection. The random core collection best represented the entire collection in statistical terms.Proportional and logarithmic strategies did not maximize statistical representation but were better inselecting maximum variability. Multivariate proportional and multivariate logarithmic strategies pro-duced the best core collections as measured by maximum variability conservation. The soybean core
d usin
collection was establishe. Introduction
Access to genetic variability is critical for plant breeding.ermplasm conservation centers were created to preserve thevailable genetic variability before it is lost due to the widespreadse of modern, improved cultivars (Brown, 1989b). In the 1980s,he International Board for Plant Genetic Resources (IBPGR) pro-ided substantial financial support for germplasm preservationhat resulted in an increase in the number of collections. Themphasis placed on conservation led to the establishment andreservation of large collections, which were not totally or evenartially evaluated or characterized. Although large germplasmollections are desirable from the perspective of genetic variabil-ty preservation (Frankel and Bennett, 1970), their usefulness andccessibility can be inversely related to their size (Frankel and
oulé, 1981). The increase in the number of accessions that are notdequately evaluated can diminish the effectiveness of collectionsHolden, 1984; Marshall, 1989).∗ Corresponding author. Tel.: +55 43 3371 6263; fax: +55 43 33716001.E-mail address: [email protected] (M.F. Oliveira).
378-4290/$ – see front matter © 2010 Elsevier B.V. All rights reserved.oi:10.1016/j.fcr.2010.07.021
g the multivariate proportional selection strategy.© 2010 Elsevier B.V. All rights reserved.
China has the largest Glycine collection, with approximately26,000 accessions of Glycine max and 6200 accessions of Glycinesoja, located in the Institute of Crop Germplasm Resources of theChinese Academy of Agricultural Science in Beijing (Chang et al.,1999; Carter et al., 2004) and has developed a core collection of thisaccessions (Zhang et al., 2003). A core collection of the perennialGlycine species has also been established (Brown et al., 1987).
The soybean germplasm collection of the United States Depart-ment of Agriculture (USDA) is the second largest in the worldwith 16,999 accessions of introduced G. max, 1116 accessions ofG. soja and 919 accessions of perennial Glycine species. Detailedorigin data are available for most entries in the USDA SoybeanGermplasm Collection as are data for many descriptive, agronomic,and seed composition traits. For most germplasm collections, thereis a gap between the germplasm availability and its use (Peetersand Galwey, 1988) due to the collection size and financial limi-tations. In general, germplasm conservation programs have beenmore successful in ensuring long-term preservation then in facili-
tating germplasm use.The establishment of core collections, as proposed by Frankeland Brown (1984), is an effective strategy to optimize human, mate-rial, and financial resources by providing greater efficiency in theuse of germplasm collections (Spagnoletti-Zeuli and Qualset, 1993;

2 ps Re
vam(tc(roba1maopTqviumrof
2
2
b1aatwpoutItsaacfeftspgoprfiorso11t
78 M.F. Oliveira et al. / Field Cro
an Hintum et al., 2000). A core collection is formed by selectingsmall percentage of the original collection that will representost of the total genetic variation with a minimum of redundancy
Brown, 1995). Those accessions not retained in the core collec-ion are still maintained to preserve rare and potentially importantombinations of alleles. Core collections are not necessarily staticBrown et al., 1987) and accessions may be added over time to rep-esent new geographical areas or taxons, or to replace accessionsf questionable value. Ideally, changes in the core collection shoulde infrequent as one of the goals of a core collection is to constructn extensive data base on these reference accessions (Brown et al.,987). The general steps to establish a core collection are: (a) deter-ine the size of the core; (b) divide the collection in distinct groups;
nd (c) select entries in each group to form the core. The complexityf establishing a core is a function of the available data and sam-ling procedure used (Brown, 1989a,b; Brown and Spillane, 1999).he established core collection must be validated to ensure its ade-uacy and usefulness by assessing whether the characteristics andariability of the entire collection have been maintained. A compar-son of the entire and core collection properties is accomplishedsing mean, variance, frequency, and distribution data of severalorphological traits or molecular markers. The objective of this
esearch was to develop a core collection of the G. max accessionsf the USDA Soybean Germplasm Collection based on the resultsrom five selection strategies.
. Materials and methods
.1. Data tabulation
The entire introduced G. max sub-collection of the USDA Soy-ean Germplasm Collection consists of 16,999 accessions, but only5,558, the entire collection in this work, have been evaluated forny quantitative traits. A majority of those accessions not evalu-ted (960) are in maturity groups IX and X, which are not adaptedo any location in the continental US Only the evaluated accessionsere subjected to the five sampling strategies. In addition to pass-ort information, evaluation data gathered from 1963 to 2005 inne of four locations where specific accessions are adapted weresed. The 000, 00, 0 and I maturity group accessions were charac-erized and assessed in the State of de Minnesota; the I, II, III andV maturity group accessions were characterized and assessed inhe State of Illinois; the V, VI, VII and VIII maturity group acces-ions were characterized and assessed in the State of Mississipi;nd the IX and X maturity group accessions were characterized andssessed in the territory of Porto Rico. The evaluation data wereollected over two years of testing, assessed in the field plots withour 3.6 m long rows, spaced at 0.76 m and classified in two cat-gories, qualitative and quantitative (one replication in each yearor qualitative traits an two replications in each year for quantita-ive traits). The qualitative data included flower color, pod color,eed coat color, hilum color, pubescence color, pubescence form,ubescence density, seed coat luster, plant growth habit, maturityroup, and origin (Hill et al., 2005). The quantitative data, averagedver the two years, included flowering date recorded as days afterlanting when 50% of the plants have one flower; maturity dateecorded as days after planting when 95% of the pods have reachednal color; plant height recorded at maturity; lodging score ratedn a scale from 1 (erect) to 5 (prostrate); stem termination scoreecorded on a scale from 1 to 5 with 1 representing very abrupt
tem termination and 5 being very viney; shattering score recordedn the date of maturity and 2 weeks after maturity on a scale of–5 with 1 equal no shattering, 2 equal 1–10% open pods, 3 equal0–25% open pods, 4 equal 25–50% open pods and 5 equal greaterhan 50% open pods; seed quality score on a scale of 1–5 consideringsearch 119 (2010) 277–289
wrinkling, defective seed coat, greenish or diseased seeds; mottlingscore on a scale of 1–5 with 1 equal no mottling, 2 equal 1–10% ofseed coat mottled, 3 equal 10–25% of seed coat mottled, 4 equal25–50% of seed coat mottled, and 5 equal greater than 50% of seedcoat mottled; 100 seed weight; seed yield; protein concentration;oil concentration; percentage of palmitic, stearic, oleic, linoleic andlinolenic acid in the oil (Hill et al., 2005). With such a massive eval-uation effort spanning more than forty years, it is not surprisingthat a full complement of data is not available for every accession.Some data points were lost simply because of poor stands or otherfactors that prevented specific data from being collected. Data onsome traits were not collected in some of the first evaluations (e.g.,palmitic, stearic, and oleic acid concentration). Some data were notcollected in some experiments because it would not be meaningful(e.g., shattering scores for accessions that mature very late for theevaluation location) and it is not possible to collect some data (e.g.,mottling scores on seeds with brown or black seed coats).
2.2. Choice of sample size and representativeness
The portion of the core collection derived from the evaluatedaccessions was defined as containing 1600 accessions. This sizerepresents a sample of approximately 10% of the 15,558 evaluatedaccessions and complies with Brown’s (1989b) report on variabilitypreservation in core collections based on neutral allele theory. Twomain sampling strategies were initially used to establish the corecollections: (a) random selection of accessions; and (b) stratifiedsampling selection (Brown, 1989b; Spagnoletti-Zeuli and Qualset,1993; Hu et al., 2000). In the first procedure, the 15,558 accessionswere kept in a single group from which 1600 accessions were ran-domly sampled. In the stratified sampling strategy, the accessionswere classified in groups based on geographic origin and subgroupsbased on maturity groups to form non-overlapping strata.
2.3. Accessions clustering or stratification
There were four large groups based on geographical origin: (a)China (primary diversity center); (b) Korea and Japan (secondarydiversity center); (c) other Asian countries including Russia (ter-tiary diversity center); (d) other regions (the Americas, Africa,Europe and accessions from unknown regions). These groupingswere based on several studies that examined the relationshipbetween geographic origin and genetic relatedness among soybeanaccessions (Hymowitz and Kaizuma, 1981; Perry and McIntosh,1991; Griffin and Palmer, 1995; Li and Nelson, 2001). Griffin andPalmer (1995), using variation in isozymes, reported that acces-sions from Japan and Korea were more closely related to each otherthan to accessions from China and that accessions from southeastand south central Asia formed distinct groups. Analyzing morpho-logical data, Perry and McIntosh (1991) found differences betweennorth and central China, and accessions from other Asian countrieswere distinct from China, Japan, and Korea. Based on random ampli-fied polymorphic DNA (RAPD) data, Li and Nelson (2001) foundthat the genetic diversity within China was related to provincialorigin but this was not true for Japan and South Korea. Diversitywithin China was also much greater than within either Japan orSouth Korea. Subdividing by each Chinese province would have cre-ated too many strata so China was divided into four subgroups: thenortheastern region of China; the Huanghe-Huaihe-Haihe region ofcentral China; southern China, and accessions of unknown provin-cial origin (Table 1). Li and Nelson (2001) also showed that Japan
and South Korea were similar in genetic diversity but distinct fromChina so those countries were place together in a separate group.There are not adequate data available to examine genetic diver-sity patterns among and within other Asian countries but theywere designated as a single tertiary source based their proximity to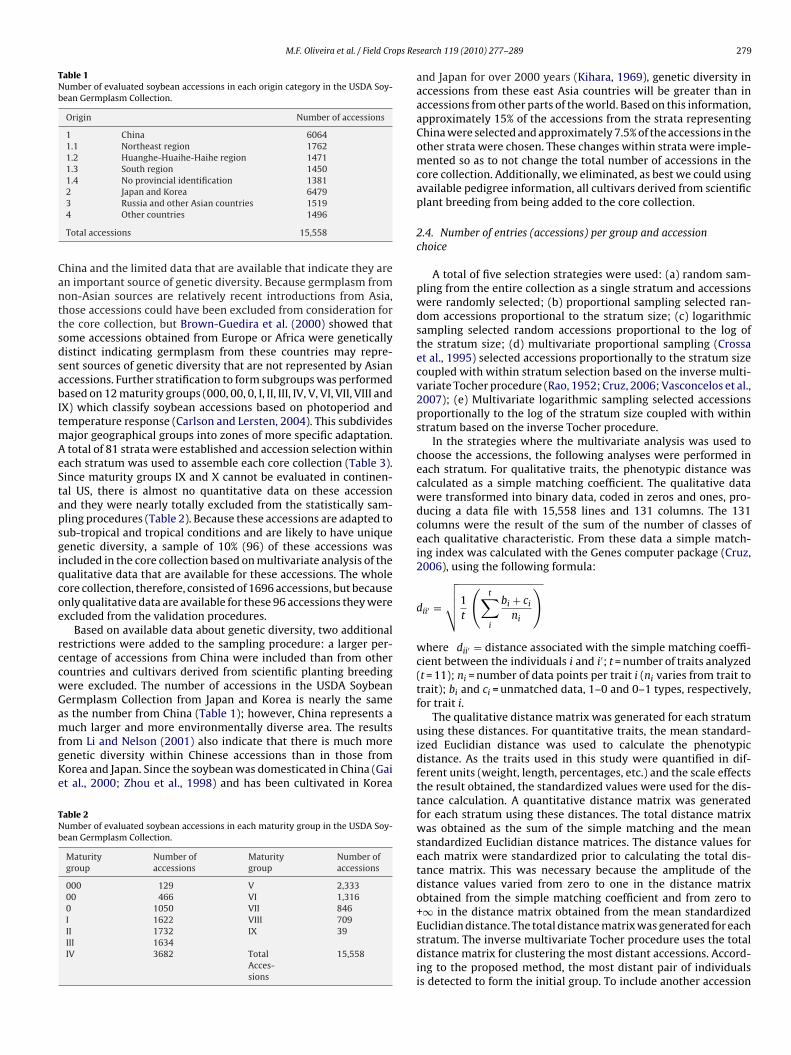
M.F. Oliveira et al. / Field Crops Re
Table 1Number of evaluated soybean accessions in each origin category in the USDA Soy-bean Germplasm Collection.
Origin Number of accessions
1 China 60641.1 Northeast region 17621.2 Huanghe-Huaihe-Haihe region 14711.3 South region 14501.4 No provincial identification 13812 Japan and Korea 6479
CanttsdsabItmAeStapsgiqcoe
rccwGamfgKe
TNb
3 Russia and other Asian countries 15194 Other countries 1496
Total accessions 15,558
hina and the limited data that are available that indicate they aren important source of genetic diversity. Because germplasm fromon-Asian sources are relatively recent introductions from Asia,hose accessions could have been excluded from consideration forhe core collection, but Brown-Guedira et al. (2000) showed thatome accessions obtained from Europe or Africa were geneticallyistinct indicating germplasm from these countries may repre-ent sources of genetic diversity that are not represented by Asianccessions. Further stratification to form subgroups was performedased on 12 maturity groups (000, 00, 0, I, II, III, IV, V, VI, VII, VIII and
X) which classify soybean accessions based on photoperiod andemperature response (Carlson and Lersten, 2004). This subdivides
ajor geographical groups into zones of more specific adaptation.total of 81 strata were established and accession selection within
ach stratum was used to assemble each core collection (Table 3).ince maturity groups IX and X cannot be evaluated in continen-al US, there is almost no quantitative data on these accessionnd they were nearly totally excluded from the statistically sam-ling procedures (Table 2). Because these accessions are adapted toub-tropical and tropical conditions and are likely to have uniqueenetic diversity, a sample of 10% (96) of these accessions wasncluded in the core collection based on multivariate analysis of theualitative data that are available for these accessions. The wholeore collection, therefore, consisted of 1696 accessions, but becausenly qualitative data are available for these 96 accessions they werexcluded from the validation procedures.
Based on available data about genetic diversity, two additionalestrictions were added to the sampling procedure: a larger per-entage of accessions from China were included than from otherountries and cultivars derived from scientific planting breedingere excluded. The number of accessions in the USDA Soybeanermplasm Collection from Japan and Korea is nearly the sames the number from China (Table 1); however, China represents a
uch larger and more environmentally diverse area. The resultsrom Li and Nelson (2001) also indicate that there is much moreenetic diversity within Chinese accessions than in those fromorea and Japan. Since the soybean was domesticated in China (Gait al., 2000; Zhou et al., 1998) and has been cultivated in Korea
able 2umber of evaluated soybean accessions in each maturity group in the USDA Soy-ean Germplasm Collection.
Maturitygroup
Number ofaccessions
Maturitygroup
Number ofaccessions
000 129 V 2,33300 466 VI 1,3160 1050 VII 846I 1622 VIII 709II 1732 IX 39III 1634IV 3682 Total
Acces-sions
15,558
search 119 (2010) 277–289 279
and Japan for over 2000 years (Kihara, 1969), genetic diversity inaccessions from these east Asia countries will be greater than inaccessions from other parts of the world. Based on this information,approximately 15% of the accessions from the strata representingChina were selected and approximately 7.5% of the accessions in theother strata were chosen. These changes within strata were imple-mented so as to not change the total number of accessions in thecore collection. Additionally, we eliminated, as best we could usingavailable pedigree information, all cultivars derived from scientificplant breeding from being added to the core collection.
2.4. Number of entries (accessions) per group and accessionchoice
A total of five selection strategies were used: (a) random sam-pling from the entire collection as a single stratum and accessionswere randomly selected; (b) proportional sampling selected ran-dom accessions proportional to the stratum size; (c) logarithmicsampling selected random accessions proportional to the log ofthe stratum size; (d) multivariate proportional sampling (Crossaet al., 1995) selected accessions proportionally to the stratum sizecoupled with within stratum selection based on the inverse multi-variate Tocher procedure (Rao, 1952; Cruz, 2006; Vasconcelos et al.,2007); (e) Multivariate logarithmic sampling selected accessionsproportionally to the log of the stratum size coupled with withinstratum based on the inverse Tocher procedure.
In the strategies where the multivariate analysis was used tochoose the accessions, the following analyses were performed ineach stratum. For qualitative traits, the phenotypic distance wascalculated as a simple matching coefficient. The qualitative datawere transformed into binary data, coded in zeros and ones, pro-ducing a data file with 15,558 lines and 131 columns. The 131columns were the result of the sum of the number of classes ofeach qualitative characteristic. From these data a simple match-ing index was calculated with the Genes computer package (Cruz,2006), using the following formula:
dii′ =
√√√√1t
(t∑i
bi + ci
ni
)
where dii′ = distance associated with the simple matching coeffi-cient between the individuals i and i′; t = number of traits analyzed(t = 11); ni = number of data points per trait i (ni varies from trait totrait); bi and ci = unmatched data, 1–0 and 0–1 types, respectively,for trait i.
The qualitative distance matrix was generated for each stratumusing these distances. For quantitative traits, the mean standard-ized Euclidian distance was used to calculate the phenotypicdistance. As the traits used in this study were quantified in dif-ferent units (weight, length, percentages, etc.) and the scale effectsthe result obtained, the standardized values were used for the dis-tance calculation. A quantitative distance matrix was generatedfor each stratum using these distances. The total distance matrixwas obtained as the sum of the simple matching and the meanstandardized Euclidian distance matrices. The distance values foreach matrix were standardized prior to calculating the total dis-tance matrix. This was necessary because the amplitude of thedistance values varied from zero to one in the distance matrixobtained from the simple matching coefficient and from zero to+∞ in the distance matrix obtained from the mean standardized
Euclidian distance. The total distance matrix was generated for eachstratum. The inverse multivariate Tocher procedure uses the totaldistance matrix for clustering the most distant accessions. Accord-ing to the proposed method, the most distant pair of individualsis detected to form the initial group. To include another accession
2 ps Re
isins
2
tforcteaaishtttsef1q1tFdracbtivTtwctsbtZacioraPctato1D
R
80 M.F. Oliveira et al. / Field Cro
n this group the distances between the group and the other acces-ions are calculated and the most distant accession is then includedn the initial group. The procedure is repeated until the requiredumber of accessions is included in each group, which forms theampled stratum.
.5. Validation of the core collection
The five cores developed were compared to the entire collec-ion, using the quantitative data for 18 traits for alterations in therequency distribution of the accessions, for means and variancesf the measured traits, for among traits correlations, and for theange retention index. This validation process used the statisti-al parameters to assess how accurately each core represented theotal variability in the entire collection. The distributions betweenach core and entire collection for each of the 11 qualitative traitsnd 18 quantitative traits were analyzed using the �2 test (Snedecornd Cochran, 1980) to verify whether the frequency of the traitsn the accessions in each stratum of the core collection remainedimilar to the frequency in the entire collection and to verify theomogeneity in the frequency distribution of the traits betweenhe entire collection and each core collection. The classes of eachrait were determined by dividing the range in the entire collec-ion by 20, which was empirically considered adequate for thetudied traits (Sturges, 1926). These ranges were also used withinach core collection. If the class in the core collections containedewer than five accessions, the Yates correction was used (Yates,934; Sokal and Rohlf, 1981). Homogeneity of variances of the 18uantitative traits was compared by F-tests (Snedecor and Cochran,980) to determine any differences in variance between each ofhe cores and the entire collection. The one-tail table was used for> 1 as reported by Snedecor and Cochran (1980). For this proce-ure, consider two populations (X and Y), where s2
x and s2y are the
espective variances for the same trait. The greater variance wasssigned s2
x and the smaller variance was assigned s2y , so that the
alculated F value obtained was always greater than 1. The proba-ility expressed by the F value was multiplied by two and comparedo the one-tail table value. This procedure was necessary becauset is a one-tail test determined by choosing the numerator as theariance of greater value (Snedecor and Cochran, 1980; Cruz, 1997).he 18 quantitative trait means were compared by the Student t-ests (Snedecor and Cochran, 1980). The phenotypic correlationsere independently calculated between each core and the entire
ollection for the 18 quantitative traits to investigate whetherhese associations, which may be under genetic control, were con-erved in the core collections. Pearson’s correlation coefficientsetween quantitative traits were calculated. Equality of correla-ion coefficients in the two collections was tested with Fisher’s
transformation (Snedecor and Cochran, 1980) and the associ-ted test of significance. Because 18 traits were evaluated, 153omparisons were possible [n = 18 traits, n(n − 1)/2 = 153 compar-sons]. Since these comparisons represent sequential comparisonsn the same data set, it was advisable to apply Bonferroni’s cor-ection to the significance level of the statistical tests (Snedecornd Cochran, 1980). Therefore, a significance probability level of≤ 0.0003 (P ≤ 0.05/153) was required for an individual correlationoefficient to be considered significant. To determine the propor-ion of the entire collection range retained by each core collection,range retention index was calculated for each of the 18 quantita-
ive traits. The range retention index is the proportion of the rangef the entire collection maintained in a core collection (Diwan et al.,
995). The mean range retention index was calculated according toiwan et al. (1995), using the following equation:R =∑t
i=1AiCN/AiCB
t,
search 119 (2010) 277–289
where RR = mean range retention index; AiCN = amplitude of traiti in the core collection; AiCB = amplitude of trait i in the entire col-lection; t = number of traits.
A core collection was considered to be representative of theentire collection and, therefore acceptable, if 30% or fewer (Diwanet al., 1995; Skinner et al., 1999; Hu et al., 2000) of the trait meansand ranges were significantly different (P ≤ 0.05) from those ofthe entire collection. A core collection was taken as representa-tive of the entire collection as a resource for plant breeders whenmeans, ranges and phenotypic correlations between the trait weremaintained and when variances and kurtosis were unequal, thatis the variance of core > variance of entire collection and the kur-tosis of the core < kurtosis of entire collection (Holbrook et al.,1993; Radovic and Jelovac, 1994; Charmet and Balfourier, 1995;Skinner et al., 1999; van Hintum et al., 2000). Therefore, the coredistribution properties would also differ. The assumption, whichwas verified by computer simulation, was that to maintain thegenetic variability of a larger population in smaller populations itwas necessary to increase the proportion of extreme phenotypes(Spagnoletti-Zeuli and Qualset, 1993; van Hintum et al., 2000).
The sample size of 1600 accessions (10.28%) was large enoughto ensure that the all core collections maintained most of the statis-tical properties of the entire collection and all sampling strategiesused to assemble core collections met the requirements presentedin the literature to preserve the entire collection accession variabil-ity.
3. Results
3.1. Size of the core collection and strata
The random core collection was developed using random sam-pling to select 1600 (10.3%) accessions from the 15,558 evaluatedaccessions in the collection. The proportional, multivariate propor-tional, logarithmic and multivariate logarithmic core collectionswere each assembled by selecting 1600 accessions from within the81 strata in which these accessions had been partitioned. Acces-sion number per stratum ranged from 1 to 2407 (Table 3 ). Theproportional and logarithmic sampling strategies were applied todetermine the number of accessions to sample by either randomor multivariate (trait diversity) driven selection within each stra-tum. In the proportional strategy cases, there were eight strata withtwo or fewer accessions and all accessions from those strata wereincluded in the core (Table 3). There were also five strata with 3–10accessions and more than 10% of the accessions were selected. Inthe logarithmic strategy cases, all accessions in strata with 11 orfewer accessions were included in the cores (Table 3). These alter-ations in the sampling strategies were done to ensure that the stratawith very few accessions were adequately represented in the finalcore.
3.2. Validation of the representativeness of the strategies to formthe core collection/Comparison between the entire collection andthe core collection
3.2.1. Comparison of frequency distributionValidation of the cores using the distribution parameters of the
11 qualitative traits and 18 quantitative traits showed that the ran-dom selection strategy provided the core with the best statisticalrepresentation of each of the 81 strata based on origin and matu-
rity group. The random strategy also most accurately representedthe distribution of values of the 11 qualitative traits and 18 quanti-tative traits, with no trait distribution being significantly differentfrom the corresponding trait of the entire collection (Table 4). Inthe proportional strategy, the distribution of only plant growth
M.F. Oliveira et al. / Field Crops Research 119 (2010) 277–289 281
Table 3Stratum definition, number of evaluated accessions in each stratum in the USDA Soybean Germplasm Collection, and number of accessions in each stratum chosen in eachof the selection strategies.
Stratum Stratum code Evaluated collection Random Proportional Logarithmic
Origina Maturity group Number of accession % Number of accession % Number of accession % Number of accession %
1 2 I 180 1.16 17 1.06 18 1.13 25 1.562 2 II 338 2.17 39 2.44 34 2.13 28 1.753 2 III 736 4.73 77 4.81 74 4.63 32 2.004 2 IV 2407 15.47 245 15.31 241 15.06 37 2.315 2 V 1577 10.14 165 10.31 158 9.88 35 2.196 2 VI 737 4.74 71 4.44 74 4.63 32 2.007 2 VII 227 1.46 26 1.63 23 1.44 26 1.638 2 VIII 152 0.98 14 0.88 16 1.00 24 1.509 2 IX 3 0.02 1 0.06 2 0.13 3 0.1910 2 0 75 0.48 12 0.75 8 0.50 21 1.3111 2 00 23 0.15 0 0.00 3 0.19 15 0.9412 2 000 24 0.15 2 0.13 3 0.19 15 0.9413 3 I 226 1.45 22 1.38 23 1.44 26 1.6314 3 II 172 1.11 17 1.06 18 1.13 25 1.5615 3 III 61 0.39 8 0.50 6 0.38 20 1.2516 3 IV 93 0.60 6 0.38 10 0.63 22 1.3817 3 V 148 0.95 16 1.00 15 0.94 24 1.5018 3 VI 110 0.71 7 0.44 11 0.69 23 1.4419 3 VII 164 1.05 21 1.31 17 1.06 25 1.5620 3 VIII 313 2.01 34 2.13 32 2.00 28 1.7521 3 IX 4 0.03 2 0.13 2 0.13 4 0.2522 3 0 130 0.84 11 0.69 13 0.81 23 1.4423 3 00 82 0.53 7 0.44 9 0.56 21 1.3124 3 000 16 0.10 2 0.13 2 0.13 12 0.7525 4 I 234 1.50 23 1.44 24 1.50 26 1.6326 4 II 79 0.51 9 0.56 8 0.50 21 1.3127 4 III 68 0.44 5 0.31 7 0.44 20 1.2528 4 IV 54 0.35 8 0.50 6 0.38 19 1.1929 4 V 62 0.40 7 0.44 7 0.44 20 1.2530 4 VI 57 0.37 6 0.38 6 0.38 19 1.1931 4 VII 63 0.40 3 0.19 7 0.44 20 1.2532 4 VIII 67 0.43 6 0.38 7 0.44 20 1.2533 4 IX 2 0.01 1 0.06 2 0.13 2 0.1334 4 0 459 2.95 52 3.25 46 2.88 29 1.8135 4 00 281 1.81 31 1.94 28 1.75 27 1.6936 4 000 70 0.45 6 0.38 7 0.44 20 1.2537 1.1 I 439 2.82 44 2.75 44 2.75 29 1.8138 1.1 II 618 3.97 72 4.50 62 3.88 31 1.9439 1.1 III 327 2.10 35 2.19 33 2.06 28 1.7540 1.1 IV 126 0.81 6 0.38 13 0.81 23 1.4441 1.1 V 21 0.13 4 0.25 3 0.19 15 0.9442 1.1 VI 11 0.07 3 0.19 2 0.13 11 0.6943 1.1 VII 1 0.01 0 0.00 1 0.06 1 0.0644 1.1 0 166 1.07 16 1.00 17 1.06 25 1.5645 1.1 00 46 0.30 6 0.38 5 0.31 18 1.1346 1.1 000 7 0.04 0 0.00 4 0.25 7 0.4447 1.2 I 40 0.26 2 0.13 4 0.25 18 1.1348 1.2 II 109 0.70 17 1.06 11 0.69 23 1.4449 1.2 III 220 1.41 23 1.44 22 1.38 26 1.6350 1.2 IV 560 3.60 52 3.25 56 3.50 30 1.8851 1.2 V 233 1.50 27 1.69 24 1.50 26 1.6352 1.2 VI 139 0.89 14 0.88 14 0.88 24 1.5053 1.2 VII 129 0.83 14 0.88 13 0.81 23 1.4454 1.2 VIII 25 0.16 3 0.19 3 0.19 15 0.9455 1.2 IX 2 0.01 0 0.00 2 0.13 2 0.1356 1.2 0 12 0.08 2 0.13 2 0.13 11 0.6957 1.2 00 1 0.01 0 0.00 1 0.06 1 0.0658 1.2 000 1 0.01 0 0.00 1 0.06 1 0.0659 1.3 I 26 0.17 1 0.06 3 0.19 16 1.0060 1.3 II 72 0.46 6 0.38 8 0.50 21 1.3161 1.3 III 103 0.66 10 0.63 11 0.69 22 1.3862 1.3 IV 327 2.10 30 1.88 33 2.06 28 1.7563 1.3 V 261 1.68 25 1.56 26 1.63 27 1.6964 1.3 VI 235 1.51 26 1.63 24 1.50 26 1.6365 1.3 VII 251 1.61 25 1.56 25 1.56 27 1.6966 1.3 VIII 142 0.91 10 0.63 15 0.94 24 1.5067 1.3 IX 28 0.18 3 0.19 3 0.19 16 1.0068 1.3 0 2 0.01 1 0.06 2 0.13 2 0.1369 1.3 00 2 0.01 0 0.00 2 0.13 2 0.1370 1.3 000 1 0.01 0 0.00 1 0.06 1 0.0671 1.4 I 477 3.07 53 3.31 48 3.00 30 1.88
282 M.F. Oliveira et al. / Field Crops Research 119 (2010) 277–289
Table 3 (Continued )
Stratum Stratum code Evaluated collection Random Proportional Logarithmic
Origina Maturity group Number of accession % Number of accession % Number of accession % Number of accession %
72 1.4 II 344 2.21 34 2.13 35 2.19 28 1.7573 1.4 III 119 0.76 12 0.75 12 0.75 23 1.4474 1.4 IV 115 0.74 9 0.56 12 0.75 23 1.4475 1.4 V 31 0.20 2 0.13 3 0.19 17 1.0676 1.4 VI 27 0.17 5 0.31 3 0.19 16 1.0077 1.4 VII 11 0.07 1 0.06 2 0.13 11 0.6978 1.4 VIII 10 0.06 2 0.13 2 0.13 10 0.6379 1.4 0 206 1.32 20 1.25 21 1.31 26 1.6380 1.4 00 31 0.20 6 0.38 3 0.19 17 1.0681 1.4 000 10 0.06 0 0.00 2 0.13 10 0.63Total 15558 1600 1600 1600�2b 36.94ns 68.88ns 1969.77c
ihe-HK
hb(mmoc(scafrt
TCmt
n
a Number is the origin code 1.1 – China – Northeast; 1.2 – China – Huanghe-Huaorea; 3 – Russia and other Asian countries; 4 – other countries.b ns—not significant.c Significant at 1% probability by the “�2” test.
abit was significantly different from the corresponding distri-ution in the entire collection. On the other hand, all but onematurity group) distributions were significantly different in the
ultivariate proportional strategy and all multivariate logarith-ic trait distributions were significantly different at the 1% level
f probability from the respective trait distributions of the entireollection. In the logarithmic strategy, the distribution of 10 traitsflower color, pod color, seed coat color, shattering score-early,eed mottling score, palmitic acid concentration, stearic acid con-
entration, oleic acid concentration, linoleic acid concentration,nd linolenic acid concentration) was not significantly differentrom the corresponding distribution in the entire collection. Theseesults were expected since we modified both the proportional andhe logarithmic strategies to over sample the smallest strata, theable 4hi-square (�2) test results comparing the distributions within the five core collectionsultivariate logarithmic selection strategies to the distributions in the entire evaluated
raits.
Traits Random Proportional Mul
Flower color 5.7ns 0.7ns
Pod color 1.0ns 1.0ns 2Seed coat color 8.0ns 19.0ns 2Hilum color 9.5ns 18.2ns
Pubescence color 0.6ns 7.6ns 1Pubescence form 4.1ns 3.9ns 1Pubescence density 0.8ns 3.2ns 1Seed coat luster 4.6ns 9.4ns 2Plant growth habit 4.2ns 6.3*
Maturity group 6.9ns 16.2ns
Origin 24.6ns 22.7ns 1Flowering date 13.4ns 8.4ns
Maturity date 15.9ns 28.0ns
Plant height 18.7ns 18.7ns 3Lodging score 8.2ns 11.3ns 4Stem termination score 10.8ns 10.5ns 4Shattering score, early 11.5ns 12.0ns 3Shattering score, late 18.0ns 11.0ns 1Seed quality score 12.1ns 17.8ns 2Seed mottling score 3.3ns 8.5ns 1100 seed weight 17.1ns 6.7ns 5Seed yield 15.6ns 13.8ns 3Protein concentration 16.5ns 9.6ns 9Oil concentration 20.2ns 12.2ns 1,4Palmitic acid concentration 17.5ns 12.6ns 2Stearic acid concentration 15.2ns 11.7ns 1Oleic acid concentration 14.8ns 15.0ns 8Linoleic acid concentration 11.8ns 27.5ns 1,7Linolenic acid concentration 13.7ns 10.0ns 7
s = no-significant test at P ≥ 0.05 probability levels by �2 test.* Significant at the P ≤ 0.05 by �2 test.
** Significant at the P ≤ 0.01 by �2 test.
aihe; 1.3 – China – South; 1.4 – China – no provincial identification; 2 – Japan and
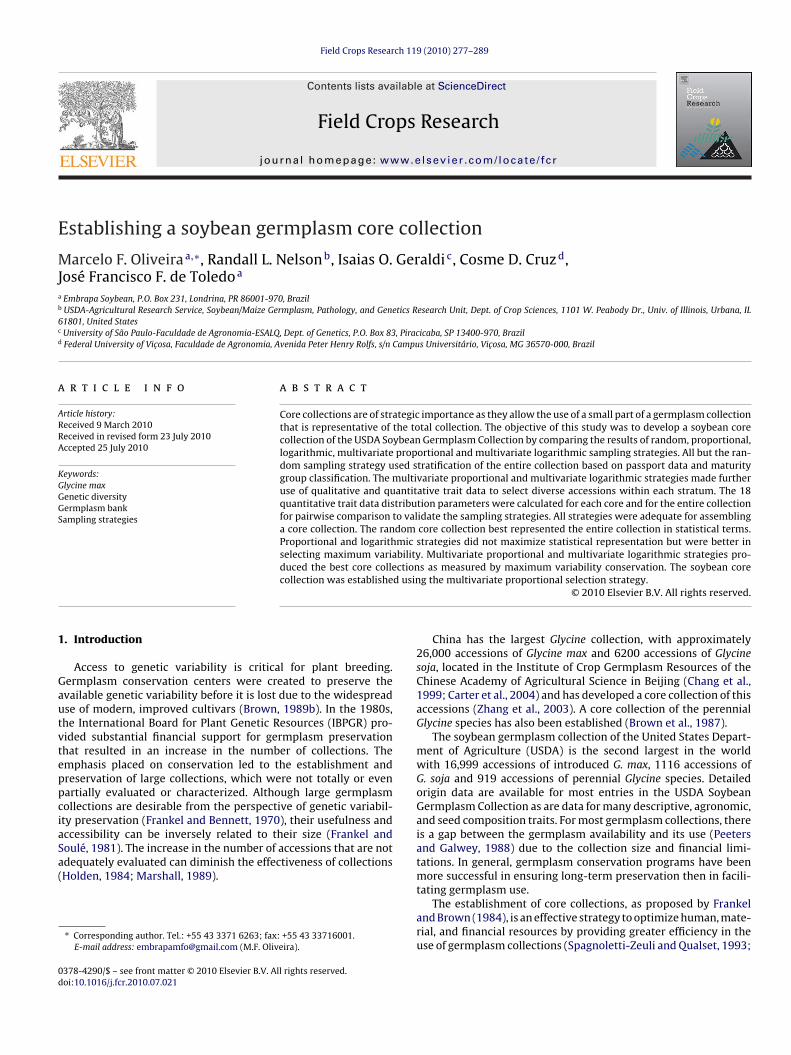
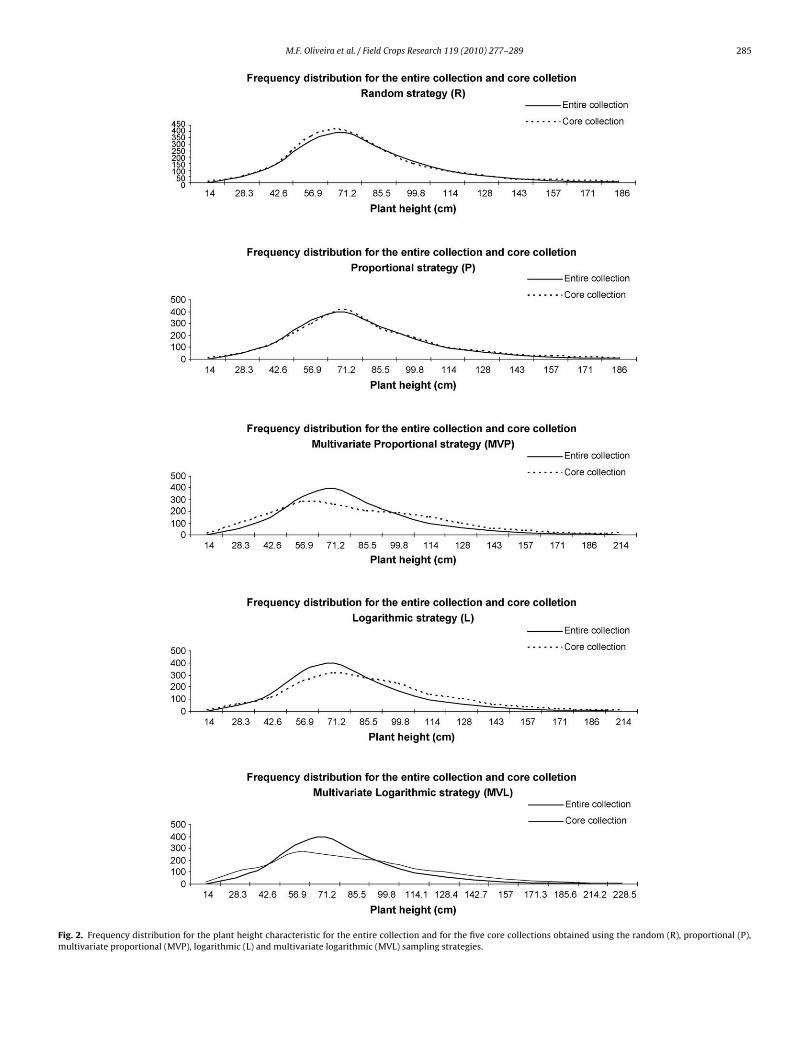
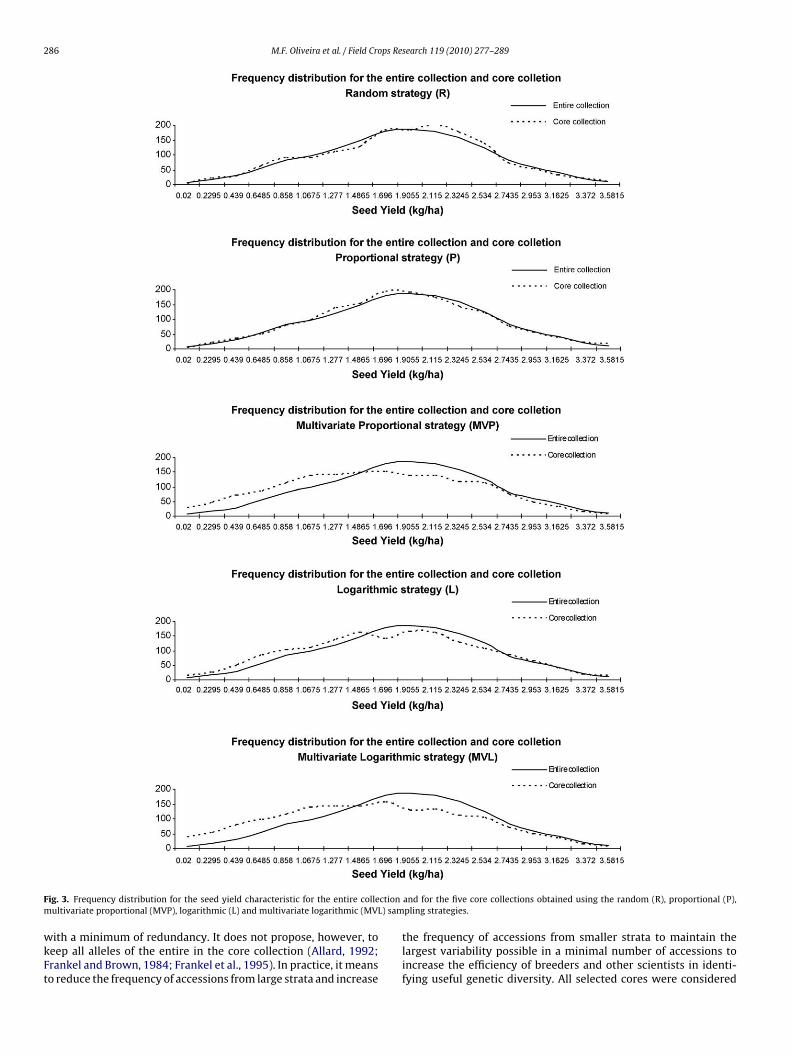
logarithmic strategy is already designed to sample more equallyfrom each strata regardless of the size (Brown, 1989b) and themultivariate strategies favored differences between accessions tosample within stratum for assembling the cores. The multivari-ate proportional and multivariate logarithmic strategies increasedthe frequency of the less represented classes, mainly the extremesof the distributions of each characteristic (some examples can beseen in Figs. 1–4). These results can be confirmed by the higher�2 values for the multivariate proportional and multivariate loga-
rithmic strategies shown in Table 4, supporting the idea that thesestrategies increased the frequency of the less represented classesfor most of the characteristics. A decrease in the trait distribu-tions kurtosis in the cores comparatively to those observed in therespective entire collections (data not shown) indicated that theobtained by the random, proportional, logarithmic, multivariate proportional andUSDA Soybean Germplasm Collection for 11 qualitative traits and 18 quantitative
tivariate proportional Logarithmic Multivariate logarithmic
44.5** 7.8ns 33.2**
04.6** 3.9ns 136.9**
10.2** 25.3ns 137.8**
88.8** 46.0** 99.6**
52.3** 15.0** 122.8**
33.5** 20.7** 55.4**
50.3** 94.4** 101.0**
82.8** 38.5** 269.8**
60.8** 93.5** 127.6**
16.2ns 592.1** 592.1**
47.9** 579.4** 791.7**
70.4** 114.7** 134.7**
81.4** 213.4** 392.4**
23.4** 167.0** 381.4**
34.6** 78.2** 459.0**
00.0** 128.7** 475.5**
65.7** 27.3ns 328.5**
54.0** 47.7** 152.5**
30.5** 35.2** 242.2**
35.8** 21.1ns 87.2**
04.8** 62.6** 676.6**
20.1** 69.6** 422.2**
96.6** 41.3** 300.0**
43.3** 43.1** 501.7**
18.3** 24.8ns 186.9**
01.6** 21.4ns 75.2**
24.2** 23.8ns 757.7**
57.4** 29.4ns 315.7**
00.3** 22.7ns 572.5**

ps Research 119 (2010) 277–289 283
ls
3
trHwtasawotpt(smleae
3
cTtcsticpsells
4
tqst(fr(A1vsaeAeat
m
ssio
ns,
mea
ns
and
vari
ance
sof
the
18qu
anti
tati
vetr
aits
inth
efi
veco
reco
llec
tion
san
dth
eev
alu
ated
USD
ASo
ybea
nG
erm
pla
smC
olle
ctio
n.
Enti
reco
llec
tion
Ran
dom
Prop
orti
onal
Mu
ltiv
aria
tep
rop
orti
onal
Loga
rith
mic
Mu
ltiv
aria
telo
gari
thm
ic
Acc
essi
ons
Mea
nV
aria
nce
Acc
essi
ons
Mea
nV
aria
nce
Acc
essi
onM
ean
Var
ian
ceA
cces
sion
sM
ean
Var
ian
ceA
cces
sion
sM
ean
Var
ian
ceA
cces
sion
sM
ean
Var
ian
ce
e15
558
102.
624
7.4
1600
102.
5n
s24
9.1n
s16
0010
2.8n
s24
7.7n
s16
0010
2.7n
s27
2.6**
1600
103.
6*27
2.3**
1600
103.
1ns
298.
3**
1555
617
5.4
282.
915
9917
5.2
ns
282.
9ns
1600
175.
4ns
303.
0ns
1599
175.
1ns
335.
4**16
0017
4.6n
s39
8.7**
1600
173.
7**43
0.3**
1555
885
.583
8.3
1600
84.7
ns
814.
0ns
1600
86.4
ns
872.
1ns
1600
90.9
**14
16.3
**16
0093
.0**
1123
.5**
1600
92.5
**15
62.8
**
1455
52.
90.
914
992.
9n
s1.
0ns
1519
2.9n
s1.
0ns
1543
3.1**
1.4**
1542
3.0**
1.0**
1563
3.1**
1.4**
tion
scor
e13
573
2.3
1.4
1384
2.3
ns
1.4n
s14
082.
4ns
1.3n
s14
052.
7**1.
9**13
952.
7**1.
5*14
362.
8**1.
9**
re,e
arly
1429
41.
50.
514
521.
5n
s0.
5ns
1459
1.5n
s0.
5ns
1486
1.7**
1.1**
1378
1.5n
s0.
6**14
071.
7**1.
1**
re,l
ate
1107
22.
21.
311
242.
2n
s1.
2ns
1124
2.2n
s1.
3ns
1090
2.5**
1.7**
1084
2.2n
s1.
3ns
1091
2.5**
1.7**
core
1451
32.
50.
314
912.
5n
s0.
3ns
1501
2.5n
s0.
3ns
1480
2.6**
0.5**
1534
2.5n
s0.
3ns
1540
2.5*
0.4**
scor
e11
800
2.0
0.9
1196
2.0
ns
0.9n
s12
492.
0ns
0.9n
s10
382.
2**1.
3**12
552.
1ns
0.9n
s11
072.
1*1.
2**
ht
1555
415
.628
.516
0015
.5n
s29
.1n
s15
9915
.5n
s28
.3n
s15
9913
.9**
39.4
**16
0014
.7**
24.8
**15
9813
.9**
36.5
**
1553
01.
960.
5015
971.
95n
s0.
50n
s15
941.
94n
s0.
51n
s15
921.
7**0.
6**15
981.
86**
0.6**
1594
1.7**
0.6**
ntr
atio
n15
523
44.3
7.7
1596
44.1
ns
8.1n
s15
9244
.3n
s7.
6ns
1592
44.3
ns
12.8
**15
9244
.4*
9.0**
1591
44.5
**12
.5**
ion
1552
317
.84.
015
9617
.9n
s4.
3ns
1592
17.8
ns
4.1n
s15
9217
.3**
7.1**
1592
17.7
**4.
7**15
9117
.3**
7.1**
con
cen
trat
ion
1455
111
.91.
014
9212
.0n
s1.
0ns
1499
12.0
ns
1.0n
s14
6212
.1**
1.7**
1499
11.9
ns
1.1**
1479
12.0
**1.
6**
nce
ntr
atio
n14
551
3.4
0.4
1492
3.4
ns
0.4n
s14
993.
4ns
0.4n
s14
623.
4**0.
6**14
993.
4*0.
4n
s14
793.
4**0.
5**
cen
trat
ion
1455
122
.413
.614
9222
.4n
s13
.1n
s14
9922
.6n
s13
.8n
s14
6222
.5n
s32
.4**
1499
22.7
**14
.8*
1479
22.7
ns
31.7
**
once
ntr
atio
n15
541
53.6
13.2
1598
53.6
ns
12.5
ns
1595
53.5
ns
12.6
ns
1592
52.9
**23
.8**
1595
53.3
**13
.3n
s15
9352
.9**
23.6
**
con
cen
trat
ion
1554
18.
02.
215
988.
0n
s2.
2ns
1595
8.0n
s2.
2ns
1592
8.3**
4.6**
1595
8.0n
s2.
4*15
938.
3**4.
6**
nt
test
atP
≥0.
05p
roba
bili
tyle
vels
byt-
test
betw
een
sele
cted
sam
ple
and
the
enti
reco
llec
tion
.t
the
P≤
0.05
byt-
test
betw
een
sele
cted
sam
ple
and
the
enti
reco
llec
tion
.t
the
P≤
0.01
byt-
test
betw
een
sele
cted
sam
ple
and
the
enti
reco
llec
tion
.
M.F. Oliveira et al. / Field Cro
ess frequent categories were favored by the logarithmic samplingtrategies.
.2.2. Comparison of means and variancesThe 18 trait means and variances of the cores derived by
he random and proportional strategies did not differ from theespective means and variances of the entire collection (Table 5).owever, the logarithmic core collection trait means and variancesere predominantly dissimilar from those of the entire collec-
ion with only five and seven traits showing variance homogeneitynd non-significant mean differences, respectively (Table 5). Dis-imilar trait means and variances between the core collectionsnd the corresponding entire collection were also predominanthenever the selection of accessions within strata was diversity
riented based on multivariate analyses of the 18 quantitativeraits. The means of 14 and 16 traits differed for the multivariateroportional and multivariate logarithmic core collections, respec-ively, from their corresponding means in the entire collectionTable 5), but in most cases the actual differences could be con-idered small for practical purposes. The trait variances in theultivariate proportional and multivariate logarithmic core col-
ections were invariably larger than the respective values of thentire collections, which indicated that these strategies were prob-bly effective in preserving the original genetic variability of thentire collection.
.2.3. Comparison of phenotypic correlationCorrelations among all 18 quantitative traits in each of the five
ores and in the entire collections were obtained (data not shown).he degree of similarity between the correlation coefficients inhe core collections and their corresponding values in the entireollection was very high. The random and proportional samplingtrategies generated core collection with all correlations betweenraits not significantly different (P ≤ 0.05) from those correspond-ng values in the entire collection. Similarly 78%, 78% and 73% of theorrelations between traits in the logarithmic, multivariate pro-ortional, and multivariate logarithmic core collections were notignificantly different (P ≤ 0.05) from the corresponding ones in thentire collection. These results indicated that the phenotypic corre-ations between traits observed in the entire collection were mostikely preserved in the core collections regardless of the samplingtrategy.
. Discussion
Although random and proportional sampling were very effec-ive in maintaining data distributions, means and variances ofuantitative traits; random, proportional and logarithmic samplingtrategies retained the smallest percentages of the original dis-ribution ranges with averages of 84%, 89% and 89%, respectivelyTable 6). The smallest retention percentage values were observedor stearic acid concentration in the core collection obtained by theandom strategy (49%) and for flowering date in random strategy65%), proportional strategy (66%) and logarithmic strategy (69%).ll strategies included 100% of the ranges for the traits scored–5, which would be expected. Core collections obtained by multi-ariate proportional and multivariate logarithmic strategies wereuperior in maintaining the largest range of variation. The largestverage retention index was for multivariate logarithmic strat-gy (99%) with individual trait indexes ranging from 93% to 100%.ccording to Frankel and Brown (1984), the sampling strategy is
fficient when the constructed core collection retains, in average,t least 80% of the original trait range. All five sampling strategiesested exceeded that threshold.Core collection construction is a sampling strategy that aims ataximizing retention of alleles available in the entire collection Ta
ble
5N
um
ber
ofac
ce
Trai
ts
Flow
erin
gd
atM
atu
rity
dat
ePl
ant
hei
ght
Lod
gin
gsc
ore
Stem
term
ina
Shat
teri
ng
sco
Shat
teri
ng
sco
Seed
qual
ity
sSe
edm
ottl
ing
100
seed
wei
gSe
edyi
eld
Prot
ein
con
ceO
ilco
nce
ntr
atPa
lmit
icac
idSt
eari
cac
idco
Ole
icac
idco
nLi
nol
eic
acid
cLi
nol
enic
acid
ns
=n
o-si
gnifi
ca*
Sign
ifica
nt
a**
Sign
ifica
nt
a
284 M.F. Oliveira et al. / Field Crops Research 119 (2010) 277–289
Fig. 1. Frequency distribution for the days to flowering characteristic for the entire collection and for the five core collections obtained using the random (R), proportional(P), multivariate proportional (MVP), logarithmic (L) and multivariate logarithmic (MVL) sampling strategies.
M.F. Oliveira et al. / Field Crops Research 119 (2010) 277–289 285
Fig. 2. Frequency distribution for the plant height characteristic for the entire collection and for the five core collections obtained using the random (R), proportional (P),multivariate proportional (MVP), logarithmic (L) and multivariate logarithmic (MVL) sampling strategies.
286 M.F. Oliveira et al. / Field Crops Research 119 (2010) 277–289
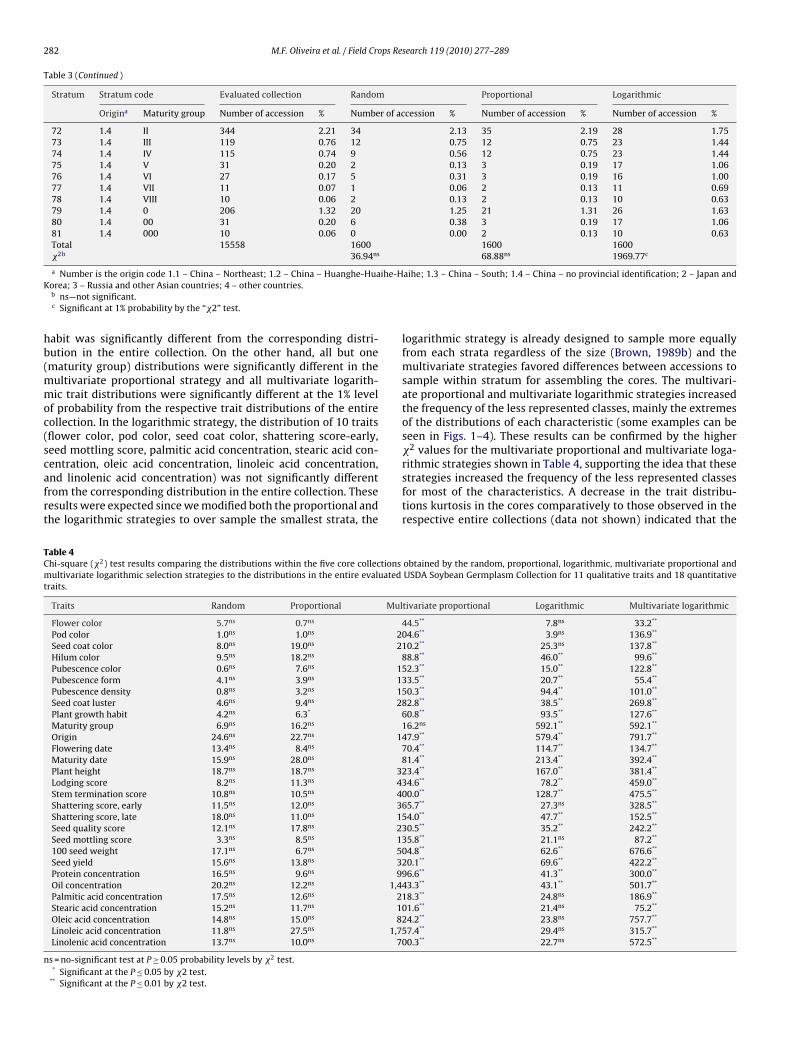
F ctionm L) sam
wkFt
ig. 3. Frequency distribution for the seed yield characteristic for the entire colleultivariate proportional (MVP), logarithmic (L) and multivariate logarithmic (MV
ith a minimum of redundancy. It does not propose, however, toeep all alleles of the entire in the core collection (Allard, 1992;rankel and Brown, 1984; Frankel et al., 1995). In practice, it meanso reduce the frequency of accessions from large strata and increase
and for the five core collections obtained using the random (R), proportional (P),pling strategies.
the frequency of accessions from smaller strata to maintain thelargest variability possible in a minimal number of accessions toincrease the efficiency of breeders and other scientists in identi-fying useful genetic diversity. All selected cores were considered

M.F. Oliveira et al. / Field Crops Research 119 (2010) 277–289 287
F llectiom ) sam
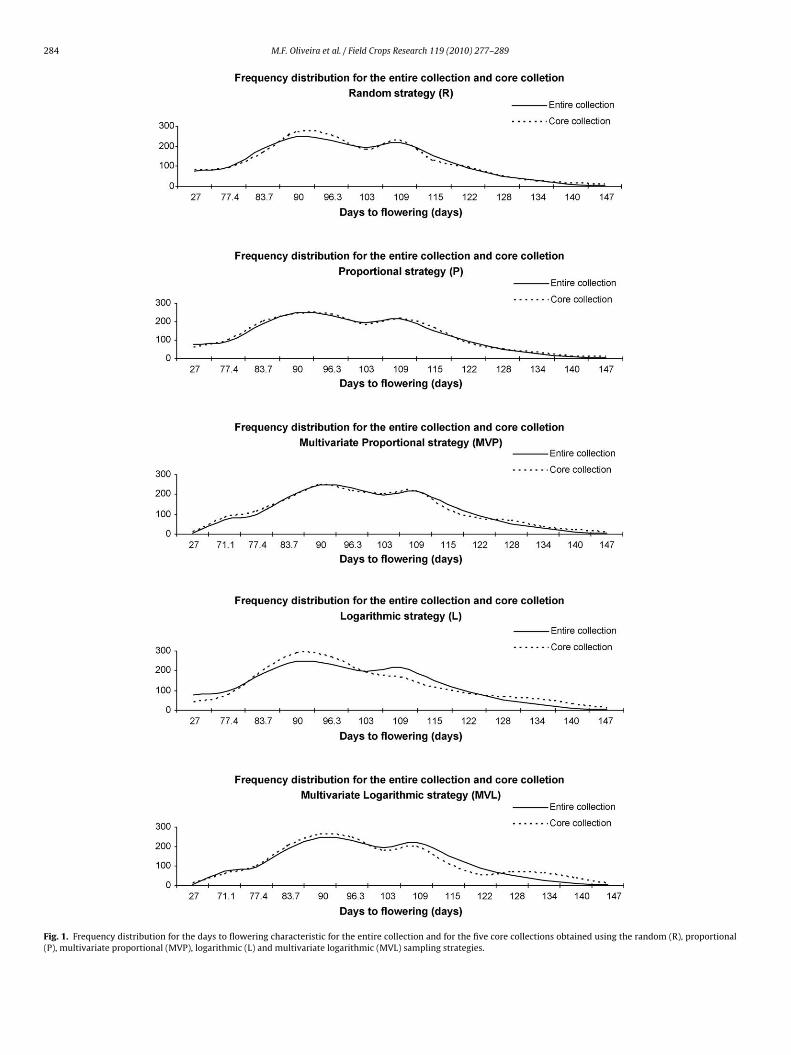
ancMo
ig. 4. Frequency distribution for the oil percentage characteristic for the entire coultivariate proportional (MVP), logarithmic (L) and multivariate logarithmic (MVL
cceptable because more than 70% of the means and ranges didot differ significantly from the corresponding values in the entireollection (Diwan et al., 1995; Skinner et al., 1999; Hu et al., 2000;alosetti and Abadie, 2001), but not all cores may be considered
ptimal.
n and for the five core collections obtained using the random (R), proportional (P),pling strategies.
As already mentioned, the purely statistical concept of pop-ulation sampling may not apply to describe the core collectionquality, since it may simply imply similarity of population distri-bution, but not of total variability. Random sampling generated acore collection which best represented the entire collection when

288 M.F. Oliveira et al. / Field Crops ReTa
ble
6R
ange
,ran
gere
ten
tion
ind
ex(R
R)
and
aver
age
ran
gere
ten
tion
ind
ex(R
R)
ofth
eba
sean
dfi
veco
reco
llec
tion
sas
sem
bled
byra
nd
om,p
rop
orti
onal
,log
arit
hm
ic,m
ult
ivar
iate
pro
por
tion
al,a
nd
mu
ltiv
aria
telo
gari
thm
icsa
mp
lin
gst
rate
gies
for
the
USD
ASo
ybea
nG
erm
pla
smC
olle
ctio
n.
Trai
tsEn
tire
coll
ecti
onR
and
omPr
opor
tion
alM
ult
ivar
iate
pro
por
tion
alLo
gari
thm
icM
ult
ivar
iate
loga
rith
mic
Ran
geR
ange
RR
(%)
Ran
geR
R(%
)R
ange
RR
(%)
Ran
geR
R(%
)R
ange
RR
(%)
Flow
erin
gd
ate
126
8265
.183
65.9
125
99.2
8769
.012
599
.2M
atu
rity
dat
e11
192
82.9
9282
.911
110
0.0
110
99.1
111
100.
0Pl
ant
hei
ght
286
210.
573
.620
7.5
72.6
286
100.
028
610
0.0
286
100.
0Lo
dgi
ng
scor
e4
410
0.0
410
0.0
410
0.0
410
0.0
410
0.0
Stem
term
inat
ion
scor
e4
410
0.0
410
0.0
410
0.0
410
0.0
410
0.0
Shat
teri
ng
scor
e,ea
rly
44
100.
04
100.
04
100.
04
100.
04
100.
0Sh
atte
rin
gsc
ore,
late
44
100.
04
100.
04
100.
04
100.
04
100.
0Se
edqu
alit
ysc
ore
44
100.
04
100.
04
100.
04
100.
04
100.
0Se
edm
ottl
ing
scor
e4
410
0.0
410
0.0
410
0.0
410
0.0
410
0.0
100
seed
wei
ght
37.6
35.2
93.7
35.0
93.1
36.2
96.3
31.5
83.8
35.9
95.5
Seed
yiel
d4.
23.
991
.93.
994
.03.
789
.34
95.5
3.9
93.1
Prot
ein
con
cen
trat
ion
26.2
18.8
71.8
20.0
76.4
24.6
94.0
24.3
92.8
26.2
100.
0O
ilco
nce
ntr
atio
n17
.315
.489
.015
.086
.715
.891
.313
.377
.117
.310
0.0
Palm
itic
acid
con
cen
trat
ion
10.4
8.1
78.0
8.7
83.7
10.4
100.
08.
178
.010
.096
.4St
eari
cac
idco
nce
ntr
atio
n9.
54.
749
.39.
196
.09.
510
0.0
6.8
71.7
9.5
100.
0O
leic
acid
con
cen
trat
ion
39.2
27.4
69.9
29.3
74.7
39.2
100.
031
.680
.639
.210
0.0
Lin
olei
cac
idco
nce
ntr
atio
n34
.727
.278
.434
.710
0.0
32.9
94.9
25.6
73.8
34.1
98.3
Lin
olen
icac
idco
nce
ntr
atio
n14
.710
.168
.712
.182
.214
.710
0.0
11.5
78.2
14.5
98.6
RR
84.0
89.4
98.1
88.9
99.0
search 119 (2010) 277–289
only statistical parameters (means, variances, symmetry and kurto-sis) were considered. Accessions with small representations in theentire collection, however, were likely excluded in the samplingprocedure, resulting in narrower trait ranges and loss of geneticdiversity comparatively to the entire collection. Accession redun-dancy in the most populated strata may have also occurred.
Brown (1989a), Diwan et al. (1995), Erskine and Muehlbauer(1991), and Schoen and Brown (1995) concluded that effectivestratified sampling of the entire collection will most likely improvethe core collection traits, diminish accession redundancy and retainlarger proportions of the original variability. In our study, themultivariate proportional and multivariate logarithmic samplingprocedures were superior to the others because they selected themost divergent accessions within each entire collection stratum.The variance increase was most likely the result of the preferen-tial selection of the least frequent accessions, which also helpedto diminish the distributions kurtosis in the cores compared tothose of the entire collection (graphs not shown). The multivariateselection strategy should be favored as a within stratum sam-pling strategy independent of whether the strata are large or small,whenever quantitative data are available. It is most effective whenthe variability changes with the strata (Brown, 1989b). Accord-ing to Brown (1989a), logarithmic selection would be preferredwhen the between and within strata quantitative variation areunknown.
Based on the validation data, the multivariate proportional sam-pling strategy was selected as the best procedure for producing asoybean core collection. This is consistent with the recommenda-tion of Brown (1989a) when the entire collection can be effectivelydivided into strata. The list of soybean accessions included in thecore collection is available from the corresponding author and canbe accessed through the Germplasm Resources Information Net-work website at http://www.ars-grin.gov/npgs/.
5. Conclusion
Four core collections assembled based on stratified samplingstrategies conserved more accession variability comparatively tothe random sampling derived core, and the sampling strategiesusing multivariate analysis (inverted Tocher) technique maximizedthe accession variability in the cores comparatively to the otherstrategies.
Acknowledgments
The authors thank The United States Department of Agriculture(USDA) and staff for accepting me as a visiting researcher duringthe doctorate course. Special thanks to Dr. Randall L. Nelson for hiscollaboration, support and availability at every moment.
References
Allard, R.W., 1992. Predictive methods for germplasm identification. In: Stalker, H.T.,Murphy, J.P. (Eds.), Plant Breeding in the 1990s. Oxon, Wallingford, pp. 119–146.
Brown, A.H.D., 1989a. Core collection: a practical approach to genetic resourcesmanagement. Genome 31, 818–824.
Brown, A.H.D., 1989b. The case for core collections. In: Brown, A.H.D., Frankel, O.H.,Marshall, D.R., Williams, J.T. (Eds.), The Use of Plant Genetic Resources. Univer-sity Press Cambridge, Cambridge, pp. 136–156.
Brown, A.H.D., 1995. The core collection at the crossroads. In: Hodgkin, T., Brown,A.H.D., van Hintum, T.J.L., Morales, E.A.V. (Eds.), Core Collections of Plant GeneticResources. International Plant Genetic Resources Institute (IPGRI). John Wiley &Sons, New York, pp. 3–20.
Brown, A.H.D., Grace, J.P., Speer, S.S., 1987. Designation of a core collection of peren-nial Glycine. Soybean Genet. Newsl. 14, 59–70.
Brown, A.H.D., Spillane, C., 1999. Implementing core collections—principles, pro-cedures, progress, problems and promise. In: Johnson, R.C., Hodgkin, T. (Eds.),Core Collections for Today and Tomorrow. International Plant Genetic ResourcesInstitute, Rome, pp. 1–9.
ps Re
B
C
C
C
C
C
C
C
D
E
F
F
F
F
G
G
H
v
H
H
M.F. Oliveira et al. / Field Cro
rown-Guedira, G.L., Thompson, J.A., Nelson, R.L., Warburton, M.L., 2000. Evalua-tion of genetic diversity of soybean introductions and North American ancestorsusing RAPD and SSR markers. Crop Sci. 40, 815–823.
arlson, J.B., Lersten, N.R., 2004. Reproductive morphology. In: Boerma, H.R., Specht,J.E. (Eds.), Soybeans: Improvement, Production and Uses, vol. 16, 3rd ed. Amer-ican Society of Agronomy, Madison, pp. 59–95.
arter, T.E., Nelson, R.L., Sneller, C.H., Cui, Z., 2004. Genetic diversity in soybean. In:Boerma, H.R., Specht, J.E. (Eds.), Soybeans: Improvement, Production and Uses,vol. 16, 3rd ed. American Society of Agronomy, Madison, pp. 303–416.
hang, R.Z., Qiu, J., Sun, J., Chen, Y., Li, X., Xu, Z., 1999. Collection and conservationof soybean germplasm in China. In: Proc. World Soybean Research ConferenceVI, Chicago, IL, 4–7 August 1999. National Soybean Research Lab, Urbana, pp.172–176.
harmet, G., Balfourier, F., 1995. The use of geostatistics for sampling a core collec-tion of perennial ryegrass populations. Genet. Resour. Crop Evol. 42, 303–309.
rossa, J., Basford, K., Taba, S., DeLacy, I., Silva, E., 1995. Three-mode analyses of maizeusing morphological and agronomic attributes measured in multilocational tri-als. Crop Sci. 35, 1483–1491.
ruz, C.D., 1997. Programa Genes: Aplicativo Computacional em Genética e Estatís-tica. Editora UFV, Vicosa.
ruz, C.D., 2006. Programa Genes: Análise Multivariada e Simulacão. Editora UFV,Vicosa.
iwan, N., McIntosh, M.S., Bauchan, G.R., 1995. Methods of developing a core col-lection of annual Medicago species. Theor. Appl. Genet. 90, 755–761.
rskine, W., Muehlbauer, F.J., 1991. Allozyme and morphological variability, out-crossing rate and core collection formation in lentil germplasm. Theor. Appl.Genet. 83, 119–125.
rankel, O.H., Bennett, E., 1970. Genetic Resources in Plants: Their Exploration andConservation. Blackwell Scientific Publications, Oxford.
rankel, O.H., Brown, A.H.D., 1984. Plant genetic resources today: a critical appraisal.In: Holden, J.H.W., Williams, J.T. (Eds.), Crop Genetic Resources: Conservationand Evaluation. Allen and Unwin, Winchester, pp. 249–257.
rankel, O.H., Brown, A.H.D., Burdon, J.J., 1995. The Conservation of Plant Biodiver-sity. Cambrigde University Press, Cambrigde.
rankel, O.H., Soulé, M.E., 1981. Conservation and Evolution. Cambridge UniversityPress, Cambridge.
ai, J.Y., Xu, D.H., Gao, Z., Shimamoto, Y., Abe, J., Fukushi, H., Kitajima, S., 2000. Studieson the evolutionary relationship among eco-types of G. max and G. soja in China.Acta Agron. Sin. 26, 513–520.
riffin, J.D., Palmer, R.G., 1995. Variability of thirteen isozyme loci in the USDAsoybean germplasm collections. Crop Sci. 35, 897–904.
ill, J.H., Peregrine, E.K., Sprau, G.L., Cremeens, C.R., Nelson, R.L., Kenty, M.M., Kilen,T.C., Thomas, D.A., 2005. Evaluation of the USDA Soybean Germplasm Collec-tion: Maturity Groups 000 to IV (PI 507670 to PI 574486). US Department ofAgriculture Technical Bulletin No. 1914.
an Hintum, T.J.L., Brown, A.H.D., Spillane, C., Hodgkin, T., 2000. Core Collection ofPlant Genetic Resources. International Plant Genetic Resources Institute (IPGRI),
Rome.olden, J.H.W., 1984. The second ten years. In: Holden, J.H.W., Williams, J.T. (Eds.),Crop Genetic Resources: Conservation and Evaluation. Allen and Unwin, Winch-ester, pp. 277–285.
olbrook, C.C., Anderson, W.F., Pittman, R.N., 1993. Selection of a core collectionfrom the US germplasm collection of peanut. Crop Sci. 33, 859–861.
search 119 (2010) 277–289 289
Hu, J., Zhu, J., Xu, H.M., 2000. Methods of constructing core collections by stepwiseclustering with three sampling strategies based on the genotypic values of crops.Theor. Appl. Genet. 101, 264–268.
Hymowitz, T., Kaizuma, N., 1981. Soybean seed protein electrophoresis profiles from15 Asian countries or regions: hypotheses on paths of dissemination of soybeansfrom China. Econ. Bot. 35, 10–23.
Kihara, H., 1969. History of biology and other sciences in Japan in retrospect. In:Oshima, C. (Ed.), Proc. XII Int. Congr. Genetics, Tokyo, 19–28 August 1968, vol. 3.Science Council of Japan, Tokyo, pp. 49–70.
Li, Z., Nelson, R.L., 2001. Genetic diversity among soybean accessions from threecountries measured by RAPDs. Crop Sci. 41, 1337–1347.
Malosetti, M., Abadie, T., 2001. Sampling strategy to develop a core collection ofUruguayan maize landraces based on morphological traits. Genet. Resour. CropEvol. 48, 381–390.
Marshall, D.R., 1989. Limitations to the use of germplasm collections. In: Brown,A.H.D., Frankel, O.H., Marshall, D.R., Williams, J.T. (Eds.), The Use of Plant GeneticResources. University Press Cambridge, Cambridge, pp. 105–120.
Peeters, J.P., Galwey, N.W., 1988. Germplasm collections and breeding needs inEurope. Econ. Bot. 42, 503–521.
Perry, M.C., McIntosh, M.S., 1991. Geographical patterns of variation in USDA soy-bean germplasm collection. I. Morphological traits. Crop Sci. 31, 1350–1355.
Radovic, G., Jelovac, D., 1994. The possible approach in maize core collection devel-opment, in. Genetic Resources section meeting of Eucarpia. In: Evaluation andExploitation of Genetic Resources: Pre-breeding. Proceedings—Versailles. Insti-tut National de la Recherche Agronomique, France, pp. 109–115.
Rao, R.C., 1952. Advanced Statistical Methods in Biometric Research. John Wiley &Sons, New York.
Schoen, D.J., Brown, A.H.D., 1995. Maximising genetic diversity in core collections ofwild relatives of crop species. In: Hodgkin, T., Brown, A.H.D., van Hintum, T.J.L.,Morales, E.A.V. (Eds.), Core Collections of Plant Genetic Resources. InternationalPlant Genetic Resources Institute (IPGRI). John Wiley & Sons, New York, pp.55–76.
Skinner, D.Z., Bauchan, G., Auricht, G., Hughes, S., 1999. Developing a core collectionfrom a large annual Medicago germplasm collection. In: Johnson, R.C., Hodgkin,T. (Eds.), Core Collections for Today and Tomorrow. International Plant GeneticResources Institute, Rome, pp. 61–67.
Snedecor, G.W., Cochran, W.G., 1980. Statistical Methods, 7th ed. Iowa State Univer-sity Press, Ames.
Sokal, R.R., Rohlf, F.J., 1981. Biometry: The Principles and Practice of Statistics inBiological Research. WH Freeman, Oxford.
Spagnoletti-Zeuli, P.L., Qualset, C.O., 1993. Evaluation of five strategies for obtaininga core subset from a large genetic resource collection of durum wheat. Theor.Appl. Genet. 87, 295–304.
Sturges, H.A., 1926. The choice of a class interval. J. Am. Stat. Assoc. 21, 65–66.Vasconcelos, E.S., Cruz, C.D., Bhering, L.L., Ferreira, A., 2007. Estratégias de
amostragem e estabelecimento de colecões nucleares. Pesq. Agropec. Bras. 42,507–514.
Yates, F., 1934. Contigency table involving small numbers and the �2 test. J. Roy.Stat. Soc. Suppl. 1, 217–235.
Zhang, B., Qiu, L., Chang, R., 2003. Advance on genetic diversity and core collectionestablishment for soybean. Cult. Crops 3, 46–48.
Zhou, X.A., Peng, Y.H., Wang, G.X., Chang, R.Z., 1998. The study of sort searches ofcultivated cultivars in China. China Seed Ind. 1, 1–4 (in Chinese).