epoxy nanocomposites with octa(propylglycidyl ether) polyhedral oligomeric silsesquioxane
TRANSCRIPT
Epoxy nanocomposites with octa(propylglycidyl ether)
polyhedral oligomeric silsesquioxane
Yonghong Liu a, Sixun Zheng a,*, Kangming Nie b
a Department of Polymer Science and Engineering, Shanghai Jiao Tong University, 800 Dongchuan Road, Shanghai 200240, Chinab Department of Materials Science and Engineering, Anhui University, Hefei 230039, People’s Republic of China
Received 25 May 2005; received in revised form 9 September 2005; accepted 13 September 2005
Available online 6 October 2005
Abstract
The POSS-containing nanocomposites of epoxy resin were prepared via the co-curing reaction between octa(propylglycidyl ether) polyhedral
oligomeric silsesquioxane (OpePOSS) and the precursors of epoxy resin. The curing reactions were started from the initially homogeneous ternary
solution of diglycidyl ether of bisphenol A (DGEBA), 4,4 0-Diaminodiphenylmethane (DDM) and OpePOSS. The nanocomposites containing up
to 40 wt% of POSS were obtained. The homogeneous dispersion of POSS cages in the epoxy matrices was evidenced by scanning electronic
microscopy (SEM), transmission electronic microscopy (TEM) and atomic force microscopy (AFM). Differential scanning calorimetry (DSC)
and dynamic mechanical analysis (DMA) showed that at the lower POSS concentrations (!30 wt%) the glass transition temperatures (Tgs) of the
nanocomposites almost remained invariant whereas the nanocomposites containing POSS more than 40 wt% displayed the lower Tgs than the
control epoxy. The DMA results show that the moduli of the nanocomposites in glass and rubbery states are significantly higher than those of the
control epoxy, indicating the nanoreinforcement effect of POSS cages. Thermogravimetric analysis (TGA) indicates that the thermal stability of
the polymer matrix was not sacrificed by introducing a small amount of POSS, whereas the properties of oxidation resistance of the materials were
significantly enhanced. The improved thermal stability could be ascribed to the nanoscaled dispersion of POSS cages and the formation of tether
structure of POSS cages with epoxy matrix.
q 2005 Elsevier Ltd. All rights reserved.
Keywords: Epoxy resin; Polyhedral oligomeric silsesquioxane; Nanocomposites
1. Introduction
Incorporating well-defined inorganic or organometallic
building blocks into organic polymers to afford a variety of
new and improved properties continues to be a driven force for
the development of new polymeric materials [1–7]. Polyhedral
oligomeric silsesquioxanes (POSS) are a class of important
inorganic–organic hybrid compounds, which can be the
precursors to organic–inorganic nanocomposites [8,9]. The
cage-like structures of POSS can allow the construction of the
materials with precise control of the nanoarchitecture. POSS
reagents, monomers and polymers are emerging as a new
chemical technology for the nano-reinforced organic–inor-
ganic hybrids [10–19] and the polymers incorporating POSS
are becoming the focus of many studies due to the simplicity in
0032-3861/$ - see front matter q 2005 Elsevier Ltd. All rights reserved.
doi:10.1016/j.polymer.2005.09.056
* Corresponding author. Tel.: C86 21 54743278; fax: C86 21 54741297.
E-mail address: [email protected] (S. Zheng).
processing and the excellent comprehensive properties of this
class of hybrid materials. The typical POSS monomers possess
the structure of cube-octameric frameworks with eight organic
vertex groups, one or more of which is reactive or
polymerizable (Scheme 1). The monofunctionalized POSS
monomers [20] can be grafted onto macromolecular chains by
co-polymerization or reactive blending [21] whereas the
bifunctional POSS monomers will allow one to introduce
silsesquioxanes building blocks into macromolecular back-
bones although it is still a challenge to synthesize scaled
quantities of bifunctional POSS monomers efficiently
[12,15,22,23]. The higher functionalities of POSS monomers
can be used to prepare POSS-containing thermosetting
nanocomposites [24–29].
Epoxy resins are a class of important thermosetting
polymers, which have been widely used as high performance
materials, adhesives, matrices of composite materials and
electronic encapsulating materials due to their high modulus
and strength, excellent chemical resistance and simplicity in
processing. The modification of epoxy resin via POSS could
endow the materials with some superior properties such as
Polymer 46 (2005) 12016–12025
www.elsevier.com/locate/polymer
Si O Si
O O
SiSi O
O O
O O
Si Si
Si
O
O
O O
Si
R
R
R
R
R
R
R R
Scheme 1. Structure of polyhedral oligomeric silsesquioxanes.
Y. Liu et al. / Polymer 46 (2005) 12016–12025 12017
increased thermomechanical properties, thermal and oxidative
stability and dielectric properties (e.g. low dielectric constant)
[24,25,27,30–41]. Lee and Lichtenhan [30] reported that the
molecular level reinforcement provided by the POSS cages
could significantly retard the physical aging process of epoxy
resin in the glassy state. Laine et al. [24,25,37–40]
investigated the modifications of epoxy resin by a series of
octasilsesquioxanes with a variety of R groups such as
aminophenyl, dimethylsiloxypropylglycidyl ether groups and
found that the dynamic mechanical properties, fracture
toughness and thermal stability of the epoxy hybrids were
closely dependent on the types of R groups, tether structures
between epoxy matrices and POSS cages and the defects in
silsesquioxane cages etc. Williams et al. [33] reported that a
primary liquid–liquid phase separation occurred at the time of
adding the POSS-diamine precursors to epoxy due to the
incompatibility between epoxy and isobutyl POSS glycidyl.
Matejka et al. [34,35] investigated the structure and properties
of epoxy networks reinforced with POSS and the effects of
POSS–POSS interactions on the thermal properties were
addressed. More recently, we [27] reported that the different
morphological structures could be formed in the POSS-
containing hybrid composites depending on the types of R
groups; moreover, the phase-separated composites and
Si
S
O
SO
OO
HSiCl3
Si
O
Si
Si
O
Si
S
O
SO
OH
H
H
O
OO
O
H
O
O
O
O
O
O
OO
O
Si
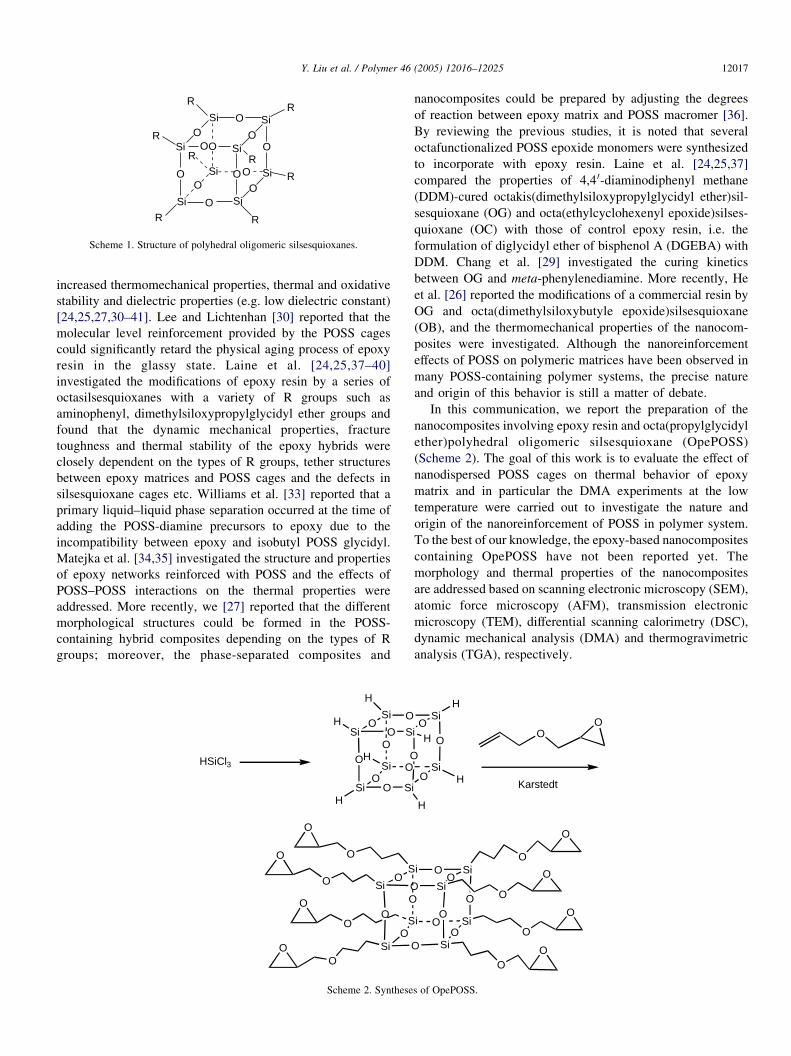
Scheme 2. Synthese
nanocomposites could be prepared by adjusting the degrees
of reaction between epoxy matrix and POSS macromer [36].
By reviewing the previous studies, it is noted that several
octafunctionalized POSS epoxide monomers were synthesized
to incorporate with epoxy resin. Laine et al. [24,25,37]
compared the properties of 4,4 0-diaminodiphenyl methane
(DDM)-cured octakis(dimethylsiloxypropylglycidyl ether)sil-
sesquioxane (OG) and octa(ethylcyclohexenyl epoxide)silses-
quioxane (OC) with those of control epoxy resin, i.e. the
formulation of diglycidyl ether of bisphenol A (DGEBA) with
DDM. Chang et al. [29] investigated the curing kinetics
between OG and meta-phenylenediamine. More recently, He
et al. [26] reported the modifications of a commercial resin by
OG and octa(dimethylsiloxybutyle epoxide)silsesquioxane
(OB), and the thermomechanical properties of the nanocom-
posites were investigated. Although the nanoreinforcement
effects of POSS on polymeric matrices have been observed in
many POSS-containing polymer systems, the precise nature
and origin of this behavior is still a matter of debate.
In this communication, we report the preparation of the
nanocomposites involving epoxy resin and octa(propylglycidyl
ether)polyhedral oligomeric silsesquioxane (OpePOSS)
(Scheme 2). The goal of this work is to evaluate the effect of
nanodispersed POSS cages on thermal behavior of epoxy
matrix and in particular the DMA experiments at the low
temperature were carried out to investigate the nature and
origin of the nanoreinforcement of POSS in polymer system.
To the best of our knowledge, the epoxy-based nanocomposites
containing OpePOSS have not been reported yet. The
morphology and thermal properties of the nanocomposites
are addressed based on scanning electronic microscopy (SEM),
atomic force microscopy (AFM), transmission electronic
microscopy (TEM), differential scanning calorimetry (DSC),
dynamic mechanical analysis (DMA) and thermogravimetric
analysis (TGA), respectively.
i
i
Si
O
Si
Si
O
Si
OO
O
OO
i
i
Si
O
SiO
H
H
H
H
O
O
O
O
O
O
O
OO
Karstedt
OO
s of OpePOSS.
Y. Liu et al. / Polymer 46 (2005) 12016–1202512018
2. Experimental
2.1. Materials
Trichlorosilane (HSiCl3, 98%) was kindly supplied by
Shanghai Lingguang Chemical Co., Ltd, China and was used as
received. The other chemical reagents, such as ferric chloride
(FeCl3), anhydrous NaHCO3, concentrated hydrochloric acid,
anhydrous K2CO3, CaCl2, allyl glycidyl ether (AGE) and
phenol are of chemically pure grade and were purchased from
Shanghai Reagent Co., China. Epoxy monomer used,
diglycidyl ether of bisphenol A (DGEBA) with a quoted
epoxide equivalent weight of 185–210, was purchased from
Shanghai Resin Co., China. 4,4 0-Diaminodiphenylmethane
(DDM) was used as the curing agent, obtained from Shanghai
Reagent Co., China.
2.2. Synthesis of octahydrosilsesquioxane (H8Si8O12)
H8Si8O12 was synthesized by a modification of the methods
described Agaska et al. [43] (Scheme 2). Typically, ferric
chloride (FeCl3) (140 g) is dissolved in methanol (200 ml) and
the solution was charged to a 5000 ml three-neck round-
bottomed flask equipped with a mechanical stirrer. Concen-
trated HCl (100 ml), petroleum aether (1750 ml) and toluene
(250 ml) were added to the system in succession. With
vigorously stirring, the mixture of HSiCl3 (100 ml) and
petroleum aether (750 ml) was added dropwise by a pressure-
equalizing dropping funnel over a period of about 9 h. With an
additional 30 min of vigorously stirring, the upper organic
layer was transferred to another round-bottom flask. The
powder of anhydrous K2CO3 (70 g) and anhydrous CaCl2(50 g) were added with continuously stirring for another 12 h to
afford white solids. The solid was filtered out and the solution
was concentrated to 50 ml via rotary evaporation. The white
crystals (10.3 g) were collected to give a yield of 19.6%.
Fourier transform infrared spectroscopy (FTIR) (cmK1, KBr
window): 2275 (Si–H); 1121 (Si–O–Si,), 860 (S–H). 1H NMR
(chloroform-d, ppm): 4.23.
2.3. Synthesis of OpePOSS
The OpePOSS was synthesized via the hydrosilylation
reaction between octahydrosilsesquioxane (H8Si8O12) and allyl
glycidyl ether (AGE). In a typical experiment, a 25 ml round-
bottom flask pre-filled with 1.0 g H8Si8O12 and a magnetic bar
was dried by the repeated exhausting-refilling process using
highly pure nitrogen. Toluene (10 ml) and AGE (3 ml) were
charged to the flask and 5 drops of Karstedt catalyst [42] was
added with a syringe at ambient temperature. After vigorously
stirring for 30 min, the reactive system was heated up to 95 8C
and the reaction was allowed to carry out for 36 h to insure the
hydrosilylation to completion. The solvent and the excessive
AGE were removed under decreased pressure to obtain a
viscous liquid. FTIR (cmK1, KBr window): 3056, 2995, 2934,
2873 cmK1 (alky C–H); 1255 (C–O–C of epoxide); 1103
(Si–O–Si); 906 (epoxide). 1H NMR (chloroform-d, ppm):
3.72–3.42 (m,CH2O(CH2)3Si–); 3.50–3.35, (m, SiCH2CH2-
CH2O). All the resonance between 3.72 and 3.35 are integrated
to be 4.3H). 3.16, (OCH2CH, epoxide, 1.0H); 2.79 and 2.60,
(CH2 epoxide, 2.1H); 1.64, (SiCH2CH2CH2O, 2.5H); 0.62,
(SiCH2CH2CH2O, 2.0H); 13C NMR (chloroform-d, ppm): 73.6
(SiCH2CH2CH2O); 71.6 (CH2O(CH2)3Si); 51.0 (OCH2-
CH(epoxide); 44.4 (CH2 (epoxide)); 23.1 (SiCH2CH2CH2O);
8.2 (SiCH2CH2CH2O). 29Si NMR (chloroform-d, ppm): K65.2
(a addition); K67.6 (b addition small). MALD-TOF-MS
spectroscopy (productCNaC): 1359.1 Da.
2.4. Preparation of nanocomposites
The desired amount of DGEBA and OpePOSS was mixed at
70 8C with continuously stirring for sufficiently long time until
the homogeneous solutions were obtained. The curing agent,
DDM was then added into the mixture with vigorously stirring
until the systems became transparent and homogeneous. The
mixtures were poured into Teflon moulds, which were highly
polished. The samples were cured at 80 8C for 2 h and 150 8C
for 2 h together with a post cure at 180 8C for 2 h to attain the
complete curing reaction, which was evidenced by the
disappearance of the infrared band at 915 and 835 cmK1 that
were characteristic of epoxy compounds.
2.5. Measurement and techniques
2.5.1. Fourier transform infrared spectroscopy (FTIR)
The FTIR measurements were conducted on a Perkin–
Elmer Paragon 1000 Fourier transform spectrometer at room
temperature (25 8C). The samples of the nanocomposites were
granulated and the powder was mixed with KBr pellets to press
into the small flakes. The specimens were sufficiently thin to be
within a range where the Beer–Lambert law is obeyed. In all
cases 64 scans at a resolution of 2 cmK1 were used to record
the spectra.
2.5.2. Matrix-assisted ultraviolet laser desorption/inonization
time-of-flight mass spectroscopy (UV-MALDI-TOF-MS)
Gentisic acid (2,5-dihydroxybenzoic acid, DHB) was used
as the matrix with tetrahydrofuran as the solvent. The MALDI-
TOF-MS experiment was carried out on an IonSpec HiR-
esMALDI mass spectrometer equipped with a pulsed nitrogen
laser (lZ337 nm; pulse withZ3 ns). This instrument operated
at an accelerating potential of 20 kV in reflector mode. Sodium
is used as the cationizing agent and all the data are shown for
positive ions.
2.5.3. Nuclear magnetic resonance spectroscopy (NMR)
The NMR measurement was carried out on a Varian
Mercury Plus 400 MHz NMR spectrometer at 27 8C. The
samples were dissolved with deuteronated chloroform. The 1H,13C and 29Si spectra were obtained with tetramethylsilane
(TMS) as the reference.
Y. Liu et al. / Polymer 46 (2005) 12016–12025 12019
2.5.4. Scanning electronic microscopy (SEM)
To investigate the morphology of POSS-containing epoxy
hybrids, the samples were fractured under cryogenic condition
using liquid nitrogen. The fractured surfaces were immersed in
chloroform at room temperature for 30 min. If the POSS-rich
phase were separated out during the in situ polymerization, it
could be preferentially etched by the solvent while epoxy
matrix phase remains unaffected. The etched specimens were
dried to remove the solvents. The fracture surfaces were coated
with thin layers of gold of about 100 A. All specimens were
examined with a Hitachi S210 scanning electron microscope
(SEM) at an activation voltage of 15 kV.
2.5.5. Atomic force microscopy (AFM)
The AFM experiments were carried out in both height and
phase contrast modes using a Digital Instruments Dimension
3000 scanning force microscope in a taping mode. Etched
silicon tips on a cantilever (Nanoprobe) with spring constants
ranging between 40.0 and 66.0 N/m were used. To investigate
the morphology of POSS-containing epoxy hybrids, the
samples were fractured under cryogenic condition using liquid
nitrogen and the smooth fractured surfaces so obtained were
used for morphological observation.
2.5.6. Transmission electronic microscopy (TEM)
The transmission electron microscopy (TEM) was per-
formed on a JEM 2010 high-resolution transmission electron
microscope at the accelerating voltage of 120 kV. The samples
were trimmed using an ultramicrotome and the specimen
sections (c.a. 70 nm in thickness) were placed in 200 mesh
copper grids for observation.
2.5.7. Differential scanning calorimetry (DSC)
The calorimetric measurement was performed on a Perkin–
Elmer Pyris-1 differential scanning calorimeter in a dry
nitrogen atmosphere. The instrument was calibrated with
standard Indium. All the samples (about 10 mg in weight) were
heated from 20 to 250 8C and the DSC curves were recorded at
a heating rate of 20 8C/min. The glass transition temperature
was taken as the midpoint of the capacity change.
2.5.8. Dynamic mechanical analysis (DMA)
The dynamic mechanical tests were carried out on a
Dynamic Mechanical Thermal Analyzer (DMTA) (MKIII,
Rheometric Scientific, Ltd Co., UK) with the temperature
range from K130 to 250 8C. The frequency used is 1.0 Hz at
the heating rate 5.0 8C/min. The specimen dimension was
1.2!2!0.1 cm3.
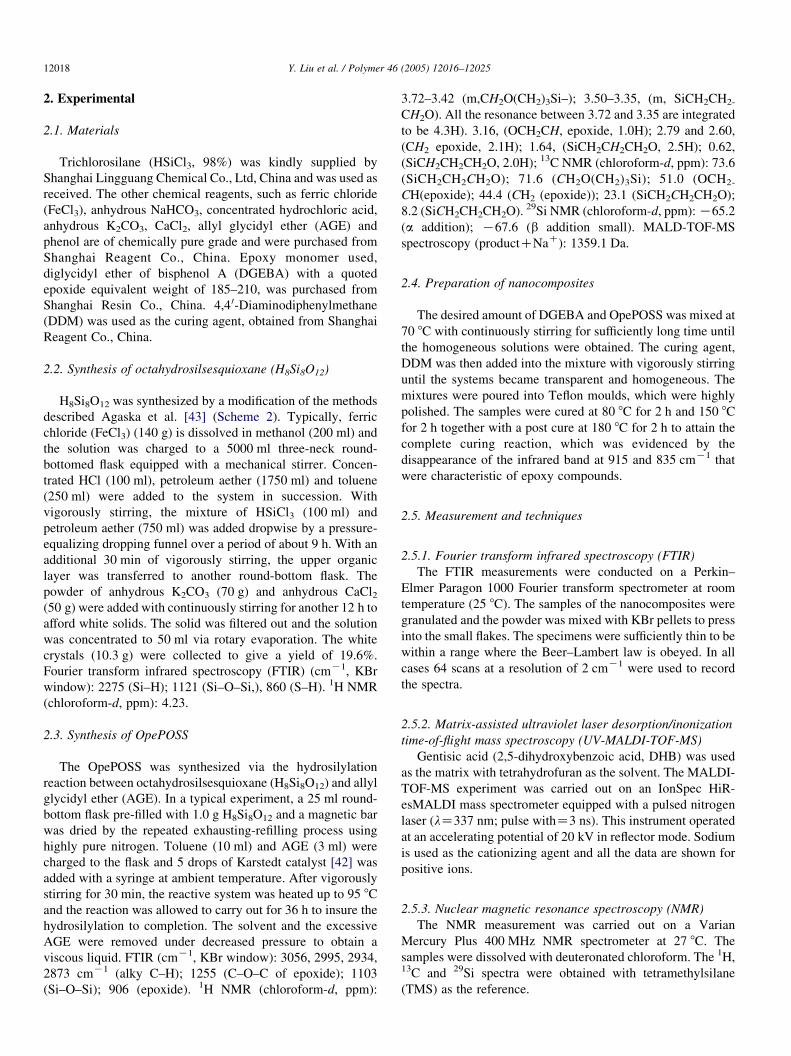
Fig. 1. SEM micrographs: (A) the control epoxy; (B) the unetched
nanocomposites containing 40 wt% of POSS; (C) the nanocomposites
containing 40 wt% of POSS etched with chloroform for 30 min.
2.5.9. Thermogravimetric analysis (TGA)
A Perkin–Elmer thermal gravimetric analyzer (TGA-7) was
used to investigate the thermal stability of the nanocomposites.
The samples (about 10 mg) were heated in air atmosphere from
ambient temperature to 800 8C at a heating rate of 20 8C/min.
The thermal degradation temperature was taken as the onset
temperature at which 5 wt% of weight loss occurs.
3. Results and discussion
3.1. Formation of POSS-containing nanocomposites
The hydrosilylation between H8Si8O12 and allyl glycidyl
ether (AGE) was employed to synthesize the target product,
octa(propylglycidyl ether)polyhedral oligomeric silsesquiox-
ane (OpePOSS), which was depicted in Scheme 2. The results
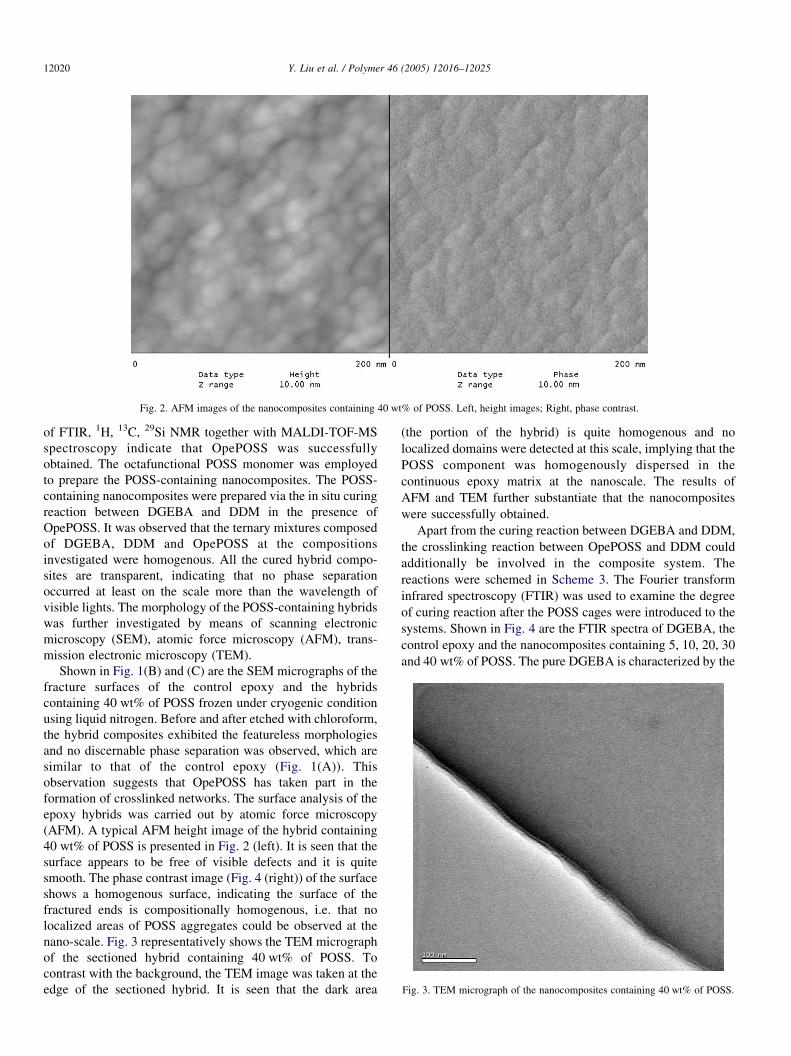
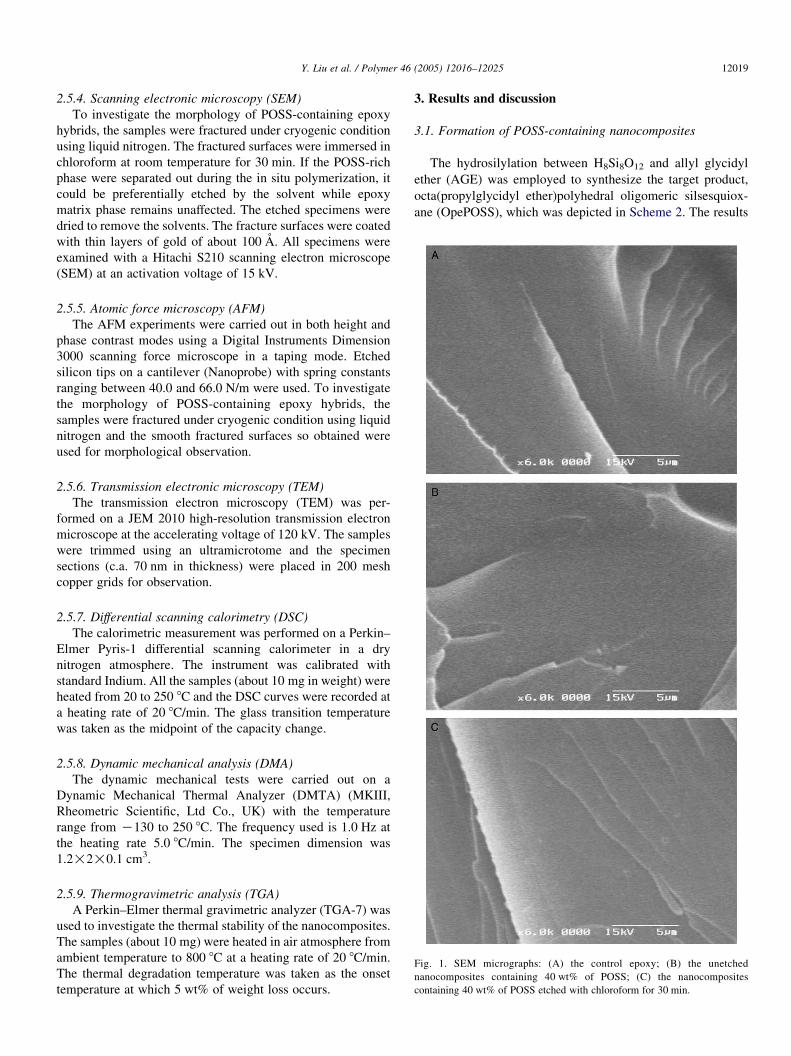
Fig. 2. AFM images of the nanocomposites containing 40 wt% of POSS. Left, height images; Right, phase contrast.
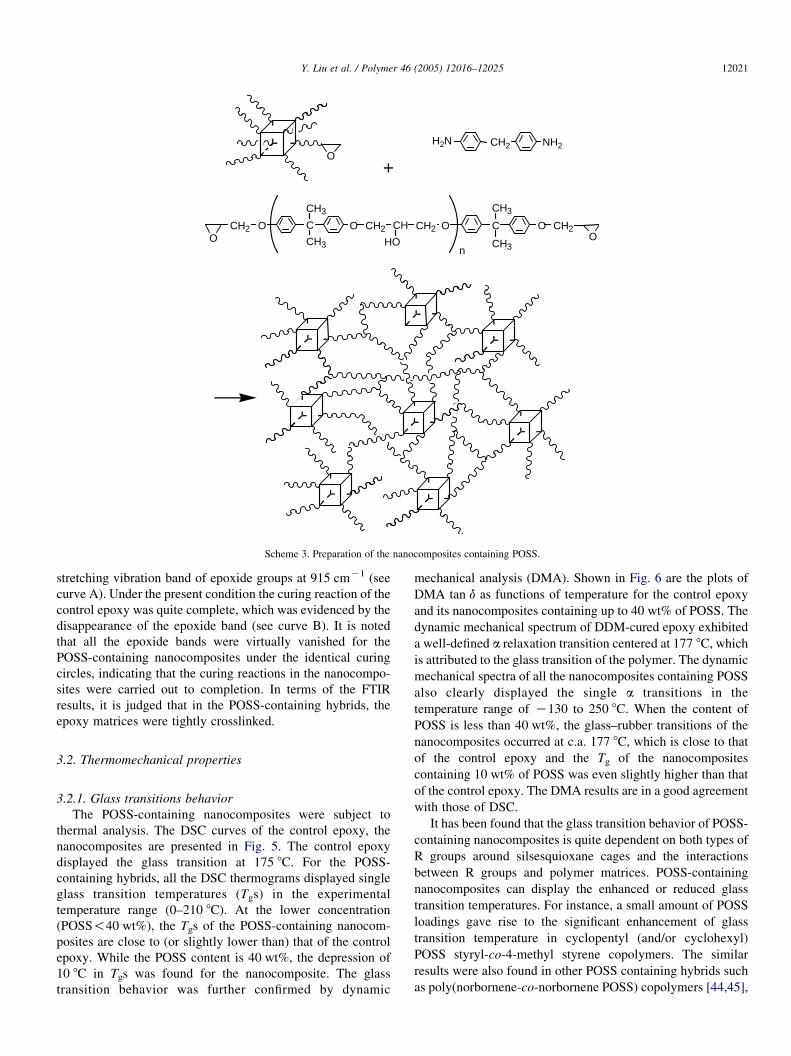
Fig. 3. TEM micrograph of the nanocomposites containing 40 wt% of POSS.
Y. Liu et al. / Polymer 46 (2005) 12016–1202512020
of FTIR, 1H, 13C, 29Si NMR together with MALDI-TOF-MS
spectroscopy indicate that OpePOSS was successfully
obtained. The octafunctional POSS monomer was employed
to prepare the POSS-containing nanocomposites. The POSS-
containing nanocomposites were prepared via the in situ curing
reaction between DGEBA and DDM in the presence of
OpePOSS. It was observed that the ternary mixtures composed
of DGEBA, DDM and OpePOSS at the compositions
investigated were homogenous. All the cured hybrid compo-
sites are transparent, indicating that no phase separation
occurred at least on the scale more than the wavelength of
visible lights. The morphology of the POSS-containing hybrids
was further investigated by means of scanning electronic
microscopy (SEM), atomic force microscopy (AFM), trans-
mission electronic microscopy (TEM).
Shown in Fig. 1(B) and (C) are the SEM micrographs of the
fracture surfaces of the control epoxy and the hybrids
containing 40 wt% of POSS frozen under cryogenic condition
using liquid nitrogen. Before and after etched with chloroform,
the hybrid composites exhibited the featureless morphologies
and no discernable phase separation was observed, which are
similar to that of the control epoxy (Fig. 1(A)). This
observation suggests that OpePOSS has taken part in the
formation of crosslinked networks. The surface analysis of the
epoxy hybrids was carried out by atomic force microscopy
(AFM). A typical AFM height image of the hybrid containing
40 wt% of POSS is presented in Fig. 2 (left). It is seen that the
surface appears to be free of visible defects and it is quite
smooth. The phase contrast image (Fig. 4 (right)) of the surface
shows a homogenous surface, indicating the surface of the
fractured ends is compositionally homogenous, i.e. that no
localized areas of POSS aggregates could be observed at the
nano-scale. Fig. 3 representatively shows the TEM micrograph
of the sectioned hybrid containing 40 wt% of POSS. To
contrast with the background, the TEM image was taken at the
edge of the sectioned hybrid. It is seen that the dark area
(the portion of the hybrid) is quite homogenous and no
localized domains were detected at this scale, implying that the
POSS component was homogenously dispersed in the
continuous epoxy matrix at the nanoscale. The results of
AFM and TEM further substantiate that the nanocomposites
were successfully obtained.
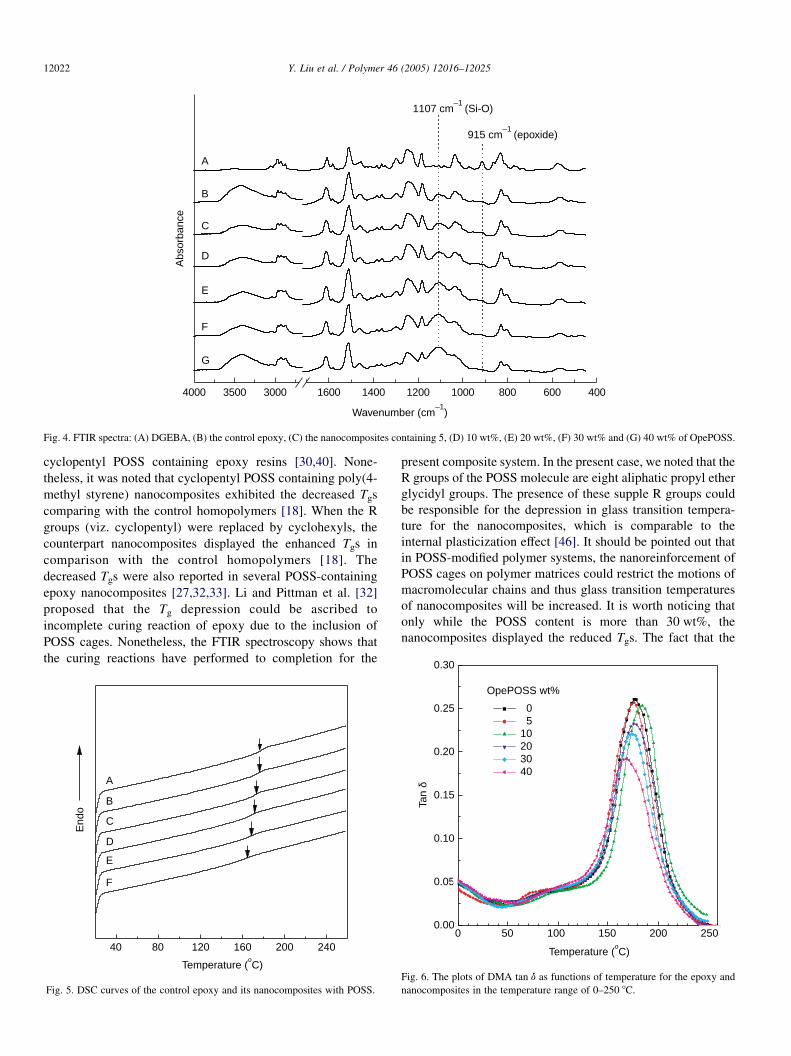
Apart from the curing reaction between DGEBA and DDM,
the crosslinking reaction between OpePOSS and DDM could
additionally be involved in the composite system. The
reactions were schemed in Scheme 3. The Fourier transform
infrared spectroscopy (FTIR) was used to examine the degree
of curing reaction after the POSS cages were introduced to the
systems. Shown in Fig. 4 are the FTIR spectra of DGEBA, the
control epoxy and the nanocomposites containing 5, 10, 20, 30
and 40 wt% of POSS. The pure DGEBA is characterized by the
OCH2H2N NH2
O O CH2 CH CH2
HO
CH2O
C
CH3
CH3
O CH2O
C
CH3
CH3
O
n
Scheme 3. Preparation of the nanocomposites containing POSS.
Y. Liu et al. / Polymer 46 (2005) 12016–12025 12021
stretching vibration band of epoxide groups at 915 cmK1 (see
curve A). Under the present condition the curing reaction of the
control epoxy was quite complete, which was evidenced by the
disappearance of the epoxide band (see curve B). It is noted
that all the epoxide bands were virtually vanished for the
POSS-containing nanocomposites under the identical curing
circles, indicating that the curing reactions in the nanocompo-
sites were carried out to completion. In terms of the FTIR
results, it is judged that in the POSS-containing hybrids, the
epoxy matrices were tightly crosslinked.
3.2. Thermomechanical properties
3.2.1. Glass transitions behavior
The POSS-containing nanocomposites were subject to
thermal analysis. The DSC curves of the control epoxy, the
nanocomposites are presented in Fig. 5. The control epoxy
displayed the glass transition at 175 8C. For the POSS-
containing hybrids, all the DSC thermograms displayed single
glass transition temperatures (Tgs) in the experimental
temperature range (0–210 8C). At the lower concentration
(POSS!40 wt%), the Tgs of the POSS-containing nanocom-
posites are close to (or slightly lower than) that of the control
epoxy. While the POSS content is 40 wt%, the depression of
10 8C in Tgs was found for the nanocomposite. The glass
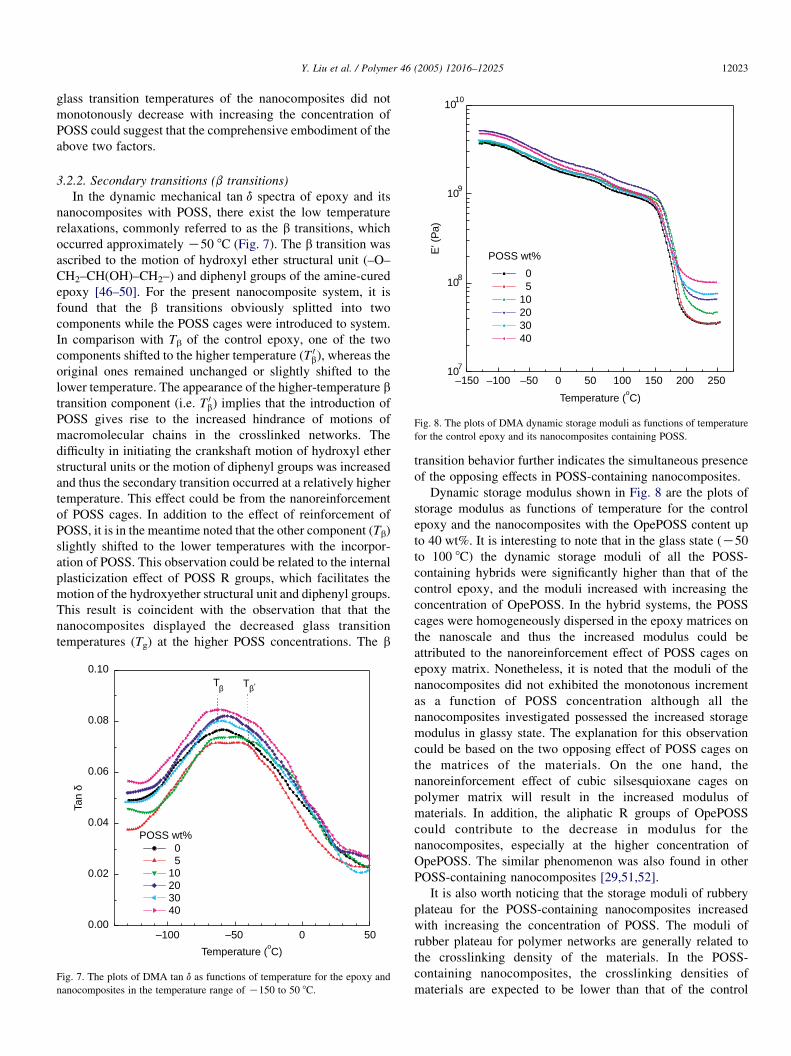
transition behavior was further confirmed by dynamic
mechanical analysis (DMA). Shown in Fig. 6 are the plots of
DMA tan d as functions of temperature for the control epoxy
and its nanocomposites containing up to 40 wt% of POSS. The
dynamic mechanical spectrum of DDM-cured epoxy exhibited
a well-defined a relaxation transition centered at 177 8C, which
is attributed to the glass transition of the polymer. The dynamic
mechanical spectra of all the nanocomposites containing POSS
also clearly displayed the single a transitions in the
temperature range of K130 to 250 8C. When the content of
POSS is less than 40 wt%, the glass–rubber transitions of the
nanocomposites occurred at c.a. 177 8C, which is close to that
of the control epoxy and the Tg of the nanocomposites
containing 10 wt% of POSS was even slightly higher than that
of the control epoxy. The DMA results are in a good agreement
with those of DSC.
It has been found that the glass transition behavior of POSS-
containing nanocomposites is quite dependent on both types of
R groups around silsesquioxane cages and the interactions
between R groups and polymer matrices. POSS-containing
nanocomposites can display the enhanced or reduced glass
transition temperatures. For instance, a small amount of POSS
loadings gave rise to the significant enhancement of glass
transition temperature in cyclopentyl (and/or cyclohexyl)
POSS styryl-co-4-methyl styrene copolymers. The similar
results were also found in other POSS containing hybrids such
as poly(norbornene-co-norbornene POSS) copolymers [44,45],
0.30
4000 3500 3000 1600 1400 1200 1000 800 600 400
Abs
orba
nce
Wavenumber (cm–1
)
A
B
C
D
E
F
G
915 cm–1
(epoxide)
1107 cm–1
(Si-O)
Fig. 4. FTIR spectra: (A) DGEBA, (B) the control epoxy, (C) the nanocomposites containing 5, (D) 10 wt%, (E) 20 wt%, (F) 30 wt% and (G) 40 wt% of OpePOSS.
Y. Liu et al. / Polymer 46 (2005) 12016–1202512022
cyclopentyl POSS containing epoxy resins [30,40]. None-
theless, it was noted that cyclopentyl POSS containing poly(4-
methyl styrene) nanocomposites exhibited the decreased Tgs
comparing with the control homopolymers [18]. When the R
groups (viz. cyclopentyl) were replaced by cyclohexyls, the
counterpart nanocomposites displayed the enhanced Tgs in
comparison with the control homopolymers [18]. The
decreased Tgs were also reported in several POSS-containing
epoxy nanocomposites [27,32,33]. Li and Pittman et al. [32]
proposed that the Tg depression could be ascribed to
incomplete curing reaction of epoxy due to the inclusion of
POSS cages. Nonetheless, the FTIR spectroscopy shows that
the curing reactions have performed to completion for the
40 80 120 160 200 240
Temperature (oC)
End
o
D
A
B
C
E
F
Fig. 5. DSC curves of the control epoxy and its nanocomposites with POSS.
present composite system. In the present case, we noted that the
R groups of the POSS molecule are eight aliphatic propyl ether
glycidyl groups. The presence of these supple R groups could
be responsible for the depression in glass transition tempera-
ture for the nanocomposites, which is comparable to the
internal plasticization effect [46]. It should be pointed out that
in POSS-modified polymer systems, the nanoreinforcement of
POSS cages on polymer matrices could restrict the motions of
macromolecular chains and thus glass transition temperatures
of nanocomposites will be increased. It is worth noticing that
only while the POSS content is more than 30 wt%, the
nanocomposites displayed the reduced Tgs. The fact that the
0 50 100 150 200 2500.00
0.05
0.10
0.15
0.20
0.25
Temperature (oC)
Tan
δ
0 5
10 20 30 40
OpePOSS wt%
Fig. 6. The plots of DMA tan d as functions of temperature for the epoxy and
nanocomposites in the temperature range of 0–250 8C.
–150 –100 –50 0 50 100 150 200 250107
108
109
1010
E' (
Pa)
Temperature (oC)
0 5
10 20 30 40
POSS wt%
Fig. 8. The plots of DMA dynamic storage moduli as functions of temperature
for the control epoxy and its nanocomposites containing POSS.
Y. Liu et al. / Polymer 46 (2005) 12016–12025 12023
glass transition temperatures of the nanocomposites did not
monotonously decrease with increasing the concentration of
POSS could suggest that the comprehensive embodiment of the
above two factors.
3.2.2. Secondary transitions (b transitions)
In the dynamic mechanical tan d spectra of epoxy and its
nanocomposites with POSS, there exist the low temperature
relaxations, commonly referred to as the b transitions, which
occurred approximately K50 8C (Fig. 7). The b transition was
ascribed to the motion of hydroxyl ether structural unit (–O–
CH2–CH(OH)–CH2–) and diphenyl groups of the amine-cured
epoxy [46–50]. For the present nanocomposite system, it is
found that the b transitions obviously splitted into two
components while the POSS cages were introduced to system.
In comparison with Tb of the control epoxy, one of the two
components shifted to the higher temperature (T 0b), whereas the
original ones remained unchanged or slightly shifted to the
lower temperature. The appearance of the higher-temperature btransition component (i.e. T 0
b) implies that the introduction of
POSS gives rise to the increased hindrance of motions of
macromolecular chains in the crosslinked networks. The
difficulty in initiating the crankshaft motion of hydroxyl ether
structural units or the motion of diphenyl groups was increased
and thus the secondary transition occurred at a relatively higher
temperature. This effect could be from the nanoreinforcement
of POSS cages. In addition to the effect of reinforcement of
POSS, it is in the meantime noted that the other component (Tb)
slightly shifted to the lower temperatures with the incorpor-
ation of POSS. This observation could be related to the internal
plasticization effect of POSS R groups, which facilitates the
motion of the hydroxyether structural unit and diphenyl groups.
This result is coincident with the observation that that the
nanocomposites displayed the decreased glass transition
temperatures (Tg) at the higher POSS concentrations. The b
–100 –50 0 500.00
0.02
0.04
0.06
0.08
0.10T
Tan
δ
Temperature (oC)
0 5 10 20 30 40
POSS wt%
Tβ β,
Fig. 7. The plots of DMA tan d as functions of temperature for the epoxy and
nanocomposites in the temperature range of K150 to 50 8C.
transition behavior further indicates the simultaneous presence
of the opposing effects in POSS-containing nanocomposites.
Dynamic storage modulus shown in Fig. 8 are the plots of
storage modulus as functions of temperature for the control
epoxy and the nanocomposites with the OpePOSS content up
to 40 wt%. It is interesting to note that in the glass state (K50
to 100 8C) the dynamic storage moduli of all the POSS-
containing hybrids were significantly higher than that of the
control epoxy, and the moduli increased with increasing the
concentration of OpePOSS. In the hybrid systems, the POSS
cages were homogeneously dispersed in the epoxy matrices on
the nanoscale and thus the increased modulus could be
attributed to the nanoreinforcement effect of POSS cages on
epoxy matrix. Nonetheless, it is noted that the moduli of the
nanocomposites did not exhibited the monotonous increment
as a function of POSS concentration although all the
nanocomposites investigated possessed the increased storage
modulus in glassy state. The explanation for this observation
could be based on the two opposing effect of POSS cages on
the matrices of the materials. On the one hand, the
nanoreinforcement effect of cubic silsesquioxane cages on
polymer matrix will result in the increased modulus of
materials. In addition, the aliphatic R groups of OpePOSS
could contribute to the decrease in modulus for the
nanocomposites, especially at the higher concentration of
OpePOSS. The similar phenomenon was also found in other
POSS-containing nanocomposites [29,51,52].
It is also worth noticing that the storage moduli of rubbery
plateau for the POSS-containing nanocomposites increased
with increasing the concentration of POSS. The moduli of
rubber plateau for polymer networks are generally related to
the crosslinking density of the materials. In the POSS-
containing nanocomposites, the crosslinking densities of
materials are expected to be lower than that of the control
Y. Liu et al. / Polymer 46 (2005) 12016–1202512024
epoxy since the massive and bulky POSS cages could take up
the crosslinking nodules instead of DGEBA, which will reduce
the crosslinking density of the networks. The crosslinking
densities will decrease with increasing the concentration of
POSS in the nanocomposites. However, it is seen that the
storage moduli of the nanocomposites containing POSS are
significantly higher than that of the plain epoxy, implying the
significant nanoreinforcement of POSS cages, which were
covalently bonded with the crosslinking networks of the epoxy
resin. In the present case, the nanoreinforcement of POSS
cages could be the dominant factor to affect the moduli of the
nanocomposites.
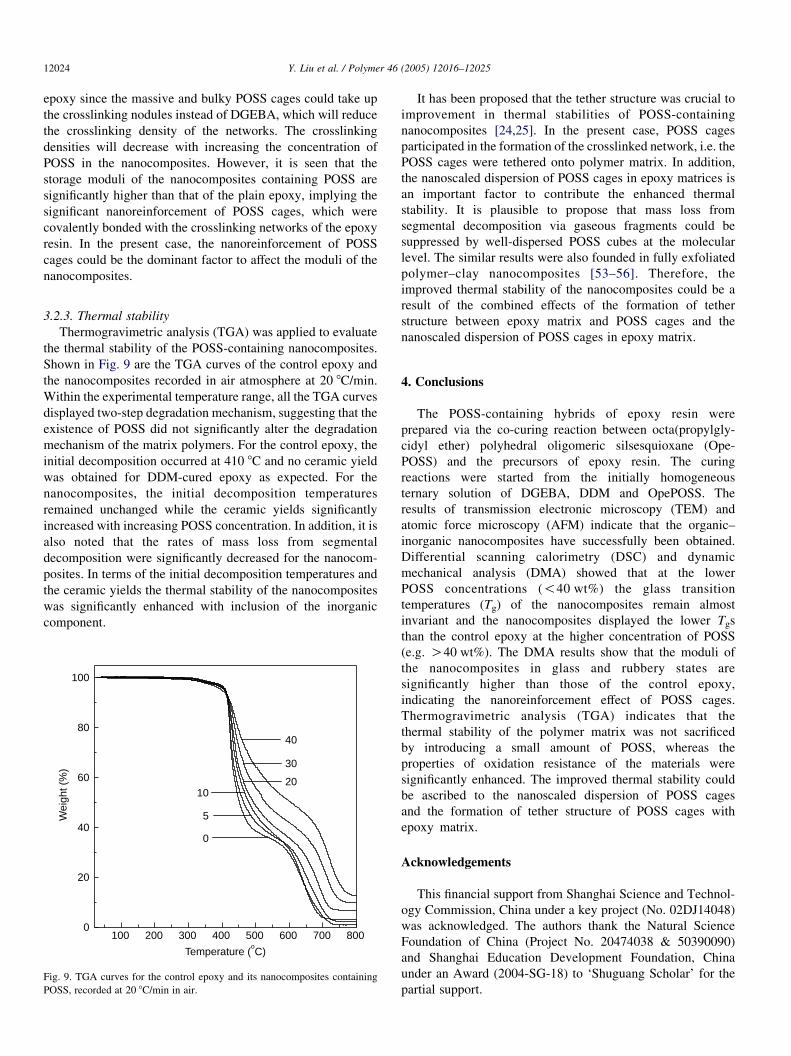
3.2.3. Thermal stability
Thermogravimetric analysis (TGA) was applied to evaluate
the thermal stability of the POSS-containing nanocomposites.
Shown in Fig. 9 are the TGA curves of the control epoxy and
the nanocomposites recorded in air atmosphere at 20 8C/min.
Within the experimental temperature range, all the TGA curves
displayed two-step degradation mechanism, suggesting that the
existence of POSS did not significantly alter the degradation
mechanism of the matrix polymers. For the control epoxy, the
initial decomposition occurred at 410 8C and no ceramic yield
was obtained for DDM-cured epoxy as expected. For the
nanocomposites, the initial decomposition temperatures
remained unchanged while the ceramic yields significantly
increased with increasing POSS concentration. In addition, it is
also noted that the rates of mass loss from segmental
decomposition were significantly decreased for the nanocom-
posites. In terms of the initial decomposition temperatures and
the ceramic yields the thermal stability of the nanocomposites
was significantly enhanced with inclusion of the inorganic
component.
100 200 300 400 500 600 700 8000
20
40
60
80
100
Temperature (oC)
Wei
ght (
%)
0
5
1020
30
40
Fig. 9. TGA curves for the control epoxy and its nanocomposites containing
POSS, recorded at 20 8C/min in air.
It has been proposed that the tether structure was crucial to
improvement in thermal stabilities of POSS-containing
nanocomposites [24,25]. In the present case, POSS cages
participated in the formation of the crosslinked network, i.e. the
POSS cages were tethered onto polymer matrix. In addition,
the nanoscaled dispersion of POSS cages in epoxy matrices is
an important factor to contribute the enhanced thermal
stability. It is plausible to propose that mass loss from
segmental decomposition via gaseous fragments could be
suppressed by well-dispersed POSS cubes at the molecular
level. The similar results were also founded in fully exfoliated
polymer–clay nanocomposites [53–56]. Therefore, the
improved thermal stability of the nanocomposites could be a
result of the combined effects of the formation of tether
structure between epoxy matrix and POSS cages and the
nanoscaled dispersion of POSS cages in epoxy matrix.
4. Conclusions
The POSS-containing hybrids of epoxy resin were
prepared via the co-curing reaction between octa(propylgly-
cidyl ether) polyhedral oligomeric silsesquioxane (Ope-
POSS) and the precursors of epoxy resin. The curing
reactions were started from the initially homogeneous
ternary solution of DGEBA, DDM and OpePOSS. The
results of transmission electronic microscopy (TEM) and
atomic force microscopy (AFM) indicate that the organic–
inorganic nanocomposites have successfully been obtained.
Differential scanning calorimetry (DSC) and dynamic
mechanical analysis (DMA) showed that at the lower
POSS concentrations (!40 wt%) the glass transition
temperatures (Tg) of the nanocomposites remain almost
invariant and the nanocomposites displayed the lower Tgs
than the control epoxy at the higher concentration of POSS
(e.g. O40 wt%). The DMA results show that the moduli of
the nanocomposites in glass and rubbery states are
significantly higher than those of the control epoxy,
indicating the nanoreinforcement effect of POSS cages.
Thermogravimetric analysis (TGA) indicates that the
thermal stability of the polymer matrix was not sacrificed
by introducing a small amount of POSS, whereas the
properties of oxidation resistance of the materials were
significantly enhanced. The improved thermal stability could
be ascribed to the nanoscaled dispersion of POSS cages
and the formation of tether structure of POSS cages with
epoxy matrix.
Acknowledgements
This financial support from Shanghai Science and Technol-
ogy Commission, China under a key project (No. 02DJ14048)
was acknowledged. The authors thank the Natural Science
Foundation of China (Project No. 20474038 & 50390090)
and Shanghai Education Development Foundation, China
under an Award (2004-SG-18) to ‘Shuguang Scholar’ for the
partial support.
Y. Liu et al. / Polymer 46 (2005) 12016–12025 12025
References
[1] Whitesides GM, Mathias JP, Seto CT. Science 1991;254:1312.
[2] Brinker C, Scherer G. Sol–gel science: the physics and chemistry of sol–
gel processing. New York: Academic Press; 1990.
[3] Theng BKG. Developments in soil science. Formation and properties of
clay–polymer complexes. vol. 9. Amsterdam: Elsevier; 1979.
[4] Lan T, Kaviratna PD, Pinnavaia TJ. Chem Mater 1995;7:2144.
[5] Giannelis EP. JOM 1992;44:28.
[6] Giannelis EP, Krishnamoorti R, Manias E. Adv Polym Sci 1999;138:107.
[7] Schwab JJ, Lichtenhan JD. Appl Organomet Chem 1998;12:707.
[8] Li G, Wang L, Ni H, Pittman CU. J Inorg Organomet Polym 2001;11:123.
[9] Abe Y, Gunji T. Prog Polym Sci 2004;29:149.
[10] Feher FJ, Wyndham KD, Baldwin RK, Soulivong D, Lichtenhan JD,
Ziller JW. Chem Commun 1999;1289.
[11] Feher FJ, Wyndham KD, Soulivong D, Nguyen F. J Chem Soc, Dalton
Trans 1999;1491.
[12] Lichtenhan JD, Vu NQ, Carter JA, Gilman JW, Feher FJ. Macromolecules
1993;26:2141.
[13] Lichtenhan JD, Otonari YA, Carr MJ. Macromolecules 1995;28:8435.
[14] Haddad TS, Lichtenhan JD. J Inorg Organomet Polym 1995;5:237.
[15] Mantz RA, Jones PF, Chaffee KP, Lichtenhan JD, Gilman JW,
Ismail IMK, et al. Chem Mater 1996;8:1250.
[16] Haddad TS, Lichtenhan JD. Macromolecules 1996;29:7302.
[17] Gilman JW, Schlitzer DS, Lichtenhan JD. J Appl Polym Sci 1996;60:591.
[18] Romo-Uribe A, Mather PT, Haddad TS, Lichtenhan JD. J Polym Sci, Part
B: Polym Phys 1998;36:1857.
[19] Zhang C, Laine RM. J Organomet Chem 1996;521:199.
[20] Marcolli C, Calzaferri G. Appl Organomet Chem 1999;13:213.
[21] Zheng S, Feher FJ, Xiao J, Jin R-Z. Polymer nanocomposites, symposium
proceeding series, Materials Research Society. vol. 733E 2002.
[22] Lichtenhan JD, Hadddad TS, Schwab JJ, Carr MJ, Chaffee KP,
Mather PT. Polym Prepr 1998;39:489.
[23] Wright ME, Schorzman DA, Feher FJ, Jin R-Z. Chem Mater 2003;15:264.
[24] Choi J, Harcup J, Yee AF, Zhu Q, Laine RM. J Am Chem Sci 2001;123:
11420.
[25] Choi J, Kim SG, Laine RM. Macromolecules 2004;37:99.
[26] Mya KY, He C, Huang J, Xiao Y, Dai Y, Siow Y-P. J Polym Sci, Part A:
Polym Chem 2004;42:3490.
[27] Ni Y, Zheng S. Polymer 2004;45:5557.
[28] Ni Y, Zheng S. Chem Mater 2004;16:5141.
[29] Chen W-Y, Wang Y-Z, Kuo S-W, Huang C-F, Tung P-H, Chang F-C; in
press.
[30] Lee A, Lichtenhan JD. Macromolecules 1998;31:4970.
[31] Fu BX, Hsiao BS, White H, Rafailovich M, Mather PT, Jeon HG. Polym
Int 2000;49:437.
[32] Li GZ, Wang L, Toghiani H, Daulton TL, Koyama K, Pittman Jr CU.
Macromolecules 2001;34:8686.
[33] Abad MJ, Barral L, Fasce DF, Williams RJJ. Macromolecules 2003;36:
3128.
[34] Matejka L, Strachota A, Plestil J, Whelan P, Steinhart M, Slaof M.
Macromolecules 2004;37:9449.
[35[ Strachota A, Kroutilova I, Kovarova J, Matejka L. Macromolecules 2004;
38:9457.
[36] Liu H, Zheng S, Nie K. Macromolecules 2005;38:5088.
[37] Laine RM, Choi J, Lee I. Adv Mater 2001;13:800.
[38] Choi J, Yee AF, Laine RM. Macromolecules 2003;36:5666.
[39] Choi J, Tamaki R, Kim SG, Laine RM. Chem Mater 2003;15:3365.
[40] Choi J, Yee AF, Laine RM. Macromolecules 2004;37:3267.
[41] Fu BX, Namani M, Lee A. Polymer 2003;44:7739.
[42] Steffanut P, Osban JA, DeCian A, Fisher J. Chem Eur J 1998;10:2008.
[43] Agaska PA. Inorg Chem 1991;30:2707.
[44] Mather PT, Jeon HG, Romo-Uribe A, Haddad TS, Lichtenhan JD.
Macromolecules 1999;32:1194.
[45] Bharadwaj RK, Berry RJ, Farmer BL. Polymer 2000;41:7209.
[46] Ochi M, Okasaki M, Shimbo M. J Polym Sci, Part B: Polym Phys 1982;
20:89.
[47] Shiraishi T, Motobe H, Ochi M, Nakanishi Y, Konishi I. Polymer 1992;
33:2975.
[48] Sanja ZN, Kupehela L. Polym Eng Sci 1976;28:1149.
[49] Mijovic J, Tsay L. Polymer 1981;22:903.
[50] Shibanov YD, Godovsky YK. Prog Colloid Polym Sci 1989;80:110.
[51] Leu C-M, Reddy M, Wei K-H, Shu C-F. Chem Mater 2004;15:2261.
[52] Leu C-M, Chang Y-T, Wei K-H. Chem Mater 2004;15:3271.
[53] Pebaron PC, Wang Z, Pinnavaia TJ. Appl Clay Sci 1999;15:1.
[54] Ray SS, Okamoto M. Prog Polym Sci 2003;28:1539.
[55] Hergenrother PM, Thompson CM, Smith JG, Connell JW, Hinkley JA,
Lyon RE, et al. Polymer 2005;46:5012.
[56] Liu H, Zhang W, Zheng S. Polymer 2005;46:157.