enhancing anaerobic digestion of pulp and paper mill ... · ii enhancing anaerobic digestion of...
TRANSCRIPT

Enhancing Anaerobic Digestion of Pulp and Paper Mill Biosludge Using Thermal Treatment in a Bench-Scale System
By
Xian Meng Huang
A thesis submitted in conformity with the requirements for the degree of Masters of Applied Science (M.A.Sc.)
Graduate Department of Chemical Engineering & Applied Chemistry
University of Toronto
© Copyright by Xian Meng Huang 2015
ii
Enhancing Anaerobic Digestion of Pulp and Paper Mill Biosludge Using Thermal Treatment in a Bench-Scale System
Masters of Applied Science
2015
Xian Meng Huang
Department of Chemical Engineering and Applied Chemistry, University of Toronto
Abstract
This study examines the feasibility of using a bench-scale anaerobic digestion (AD) system
to treat pulp and paper mill biosludge. Three thermal treatment methods were studied: pre-
treatment, intermediate treatment and post treatment. Thermal pre-treatment of biosludge
resulted in overloading of the bench-scale reactor, causing the pH to drop significantly; this
in turn caused reactor acidification. Intermediate thermal treatment of digestate had a
positive impact on the digestibility of the biosludge; the specific methane yield increased by
76% and 29% in two separate bench-scale experiments. Post-treatment of digestate followed
by further digestion was studied in BMP tests, and it was determined that the final specific
methane yield increased by 43%. Overall, anaerobic digestion of pulp and paper mill
biosludge has been proven to be successful at the bench-scale level, and thermal post-
treatment methods have been shown to be effective at enhancing the digestibility of the
biosludge.

iii
Acknowledgments
I would like to thank my supervisors Prof. D. Grant Allen and Prof. Elizabeth Edwards for
their guidance and support throughout this project. I would also like to thank Dr. Torsten
Meyer, Mr. Nigel Guilford, Mr. Paul Jowlabar, Mrs. Sofia Bonilla Tobar, and other members
of the Allen and Edwards Lab for their help and support.
I greatly appreciated the funding received from the Ontario Government as well as the
Natural Sciences and Engineering Research Council of Canada (NSERC).
iv
Table of Contents Abstract ..................................................................................................................................... ii
Acknowledgments ................................................................................................................... iii
List of Figures ......................................................................................................................... vii
List of Tables ........................................................................................................................... ix
Nomenclature ........................................................................................................................... xi
1. Introduction ....................................................................................................................... 1
1.1 Background ................................................................................................................ 1
1.2 Hypothesis and Objectives ......................................................................................... 4
1.3 Thesis Organization ................................................................................................... 4
2. Literature Review .............................................................................................................. 6
2.1 Anaerobic Digestion of Pulp and Paper Mill Biosludge ............................................ 6
2.1.1 Biochemical Methane Potential (BMP) Test .................................................... 10
2.1.2 Co-digestion of Pulp and Paper Mill Biosludge with Other Substrates ........... 12
2.2 Pre-treatment Methods to Enhance the Anaerobic Digestion of Pulp and Paper Mill Biosludge ............................................................................................................................ 14
2.2.1 Chemical ........................................................................................................... 15
2.2.2 Mechanical ........................................................................................................ 16
2.2.3 Microwave and ultrasound ............................................................................... 18
2.2.4 Thermal ............................................................................................................. 20
2.2.5 Pre-treatments Summary .................................................................................. 22
2.3 Significance of Current Research ............................................................................ 23
3. Materials and Methods .................................................................................................... 24
3.1 Bench-Scale Anaerobic Digestion System .............................................................. 24
3.2 Medium Formulation and Reactor Start-up ............................................................. 27
3.3 Thermal Treatment of Biosludge ............................................................................. 28
3.4 Measurement of Physical and Chemical Properties ................................................. 30
3.4.1 Chemical Oxygen Demand ............................................................................... 30
3.4.2 Solids Analysis ................................................................................................. 32
3.4.3 Biogas Composition ......................................................................................... 33
3.5 Biochemical Methane Potential Tests (BMP Tests) ................................................ 33
v
3.6 Experimental Design ................................................................................................ 35
4. Bench-Scale Reactor Set-Up and Troubleshooting ......................................................... 37
4.1 Walk-in Fume Hood and Bench............................................................................... 37
4.2 Bench Scale Reactor Troubleshooting ..................................................................... 38
4.2.1 Biogas Production Measurements .................................................................... 38
4.2.2 Scum Formation................................................................................................ 40
4.2.3 Reactor Sampling.............................................................................................. 42
4.3 Summary of Bench-Scale Reactor Set-up ................................................................ 44
5. Experimental Results ....................................................................................................... 45
5.1 Thermal Treatment of Biosludge / Digestate ........................................................... 45
5.2 Bench-Scale Reactor Runs with Biosludge ............................................................. 46
5.2.1 Baseline Runs ................................................................................................... 47
5.2.2 Initial Thermal Treatment ................................................................................. 48
5.2.3 Intermediate Thermal Treatment ...................................................................... 50
5.2.4 Post Digestion Thermal Treatment Followed by Further Digestion ................ 53
5.2.5 Bench-Scale Reactor Runs Summary ............................................................... 56
5.3 Biochemical Methane Potential (BMP) Tests .......................................................... 59
5.3.1 Effect of thermal treatment, microbial acclimation, sludge thickening............ 59
5.3.2 Feasibility of thermally treating the solid portion of digestate ......................... 62
6. Discussion ....................................................................................................................... 65
6.1 Reactor set up and operation .................................................................................... 65
6.2 Baseline Runs ........................................................................................................... 66
6.3 Thermal pre-treatment run ....................................................................................... 66
6.4 Intermediate and post thermal treatment runs .......................................................... 68
6.5 Effect of scale........................................................................................................... 70
6.6 BMP tests ................................................................................................................. 71
6.7 Operating strategy and summary ............................................................................. 72
7. Engineering Significance ................................................................................................ 73
8. Conclusion ....................................................................................................................... 74
9. Recommendations ........................................................................................................... 75
10. References.................................................................................................................... 76
vi
Appendix A. Raw Experimental Data ................................................................................ 81
Appendix B. Sample calculations .................................................................................... 105
Appendix C. BMP biogas production graphs ................................................................... 109
Appendix D. Heavy Hydrocarbon Contaminated Soil Bioremediation ........................... 110

vii
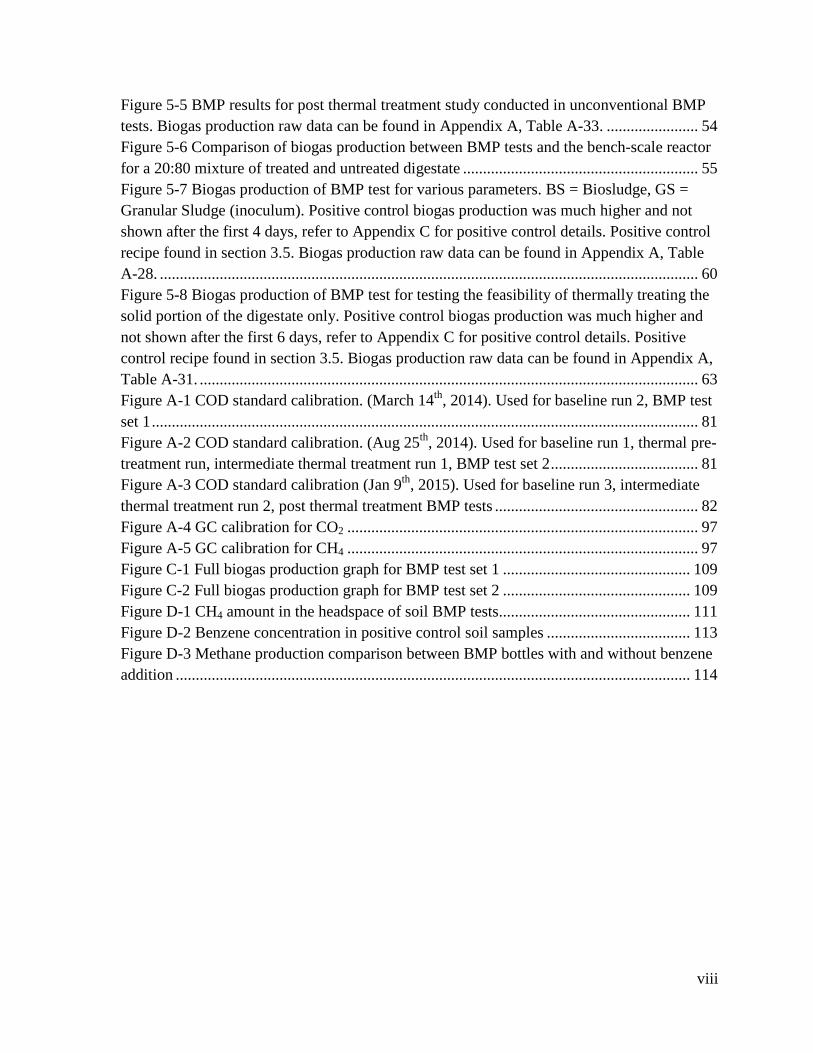
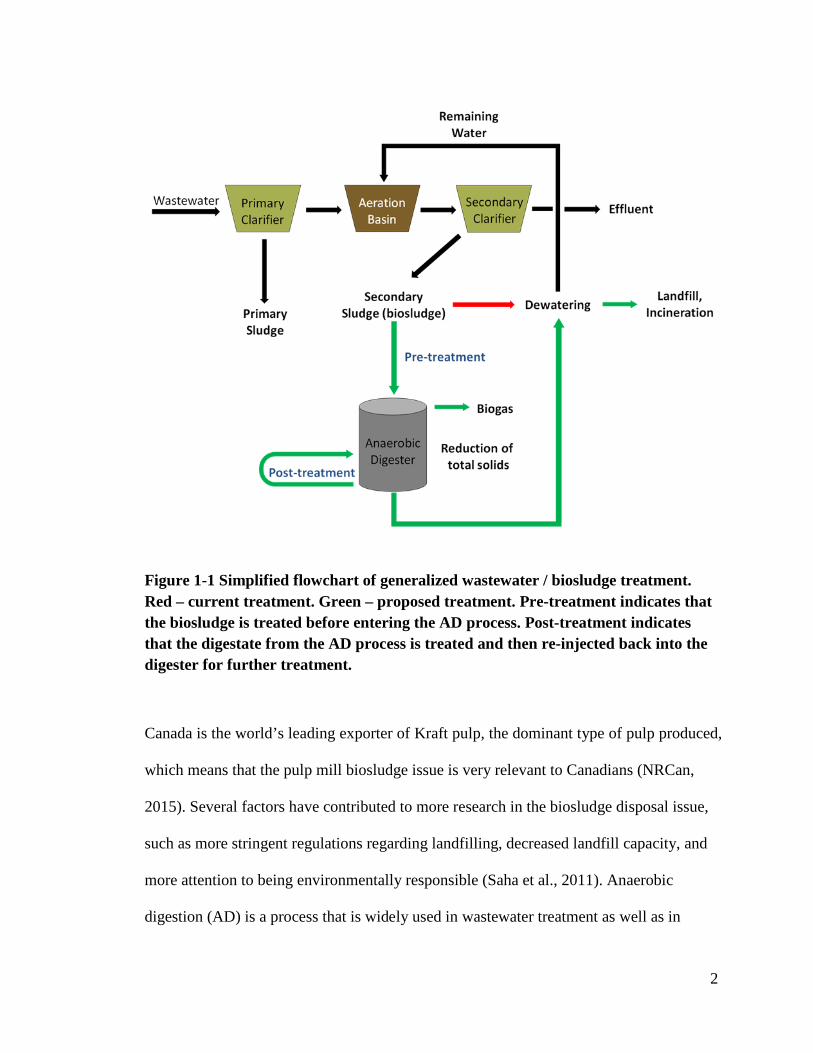
List of Figures Figure 1-1 Simplified flowchart of generalized wastewater / biosludge treatment. Red – current treatment. Green – proposed treatment. Pre-treatment indicates that the biosludge is treated before entering the AD process. Post-treatment indicates that the digestate from the AD process is treated and then re-injected back into the digester for further treatment. ......... 2Figure 2-1 Anaerobic conversion process schematic (adapted from Amaya et al., 2013) ....... 7Figure 2-2 160mL serum bottle used for BMP tests .............................................................. 11Figure 3-1 Bench-scale reactor and key parts ......................................................................... 25Figure 3-2 Bench scale AD system ........................................................................................ 26Figure 3-3 Left – thickened biosludge. Right – granular sludge from Tembec Inc.’s anaerobic wastewater treatment reactors ................................................................................................. 27Figure 3-4 500mL Parr reactor used for thermal treatment of biosludge / digestate. Left – disassembled reactor. Right – assembled reactor. .................................................................. 29Figure 3-5 Thermal treatment reactor cap showing the tube for the temperature probe ........ 30Figure 4-1 Full bench-scale system view. Spill containment tray at the bottom, custom built bench, and bench-scale AD system. ....................................................................................... 37Figure 4-2 CES Bubble flowmeter (FLO-200) ....................................................................... 38Figure 4-3 Wet tip gas meter components .............................................................................. 39Figure 4-4 Pictures taken through the sight-glass on the bench-scale reactor 2 days apart during an experimental run. Left – the reactor at the beginning of an experimental run. Right – the reactor 2 days into the experimental run. The red line shows the approximate location of the top of the liquid within the reactor. .............................................................................. 40Figure 4-5 Scum formation within the reactor after a 61 day experimental run. The red circle shows the location of the impeller and the absence of scum. ................................................. 41Figure 4-6 Larger 6” diameter impeller used at the surface of the reactor contents .............. 42Figure 4-7 Tube sampler used for reactor content sampling. ................................................. 43Figure 4-8 Gas sampling port on the bench-scale reactor ...................................................... 44Figure 5-1 Specific biogas yield of baseline runs in the bench-scale reactor. Three separate runs are shown, each with a gCODsubstrate / gVSSinoculum ratio. Biogas production raw data can be found in Appendix A, Table A-2, Table A-6, Table A-10. ............................................... 47Figure 5-2 Specific biogas yield of initial thermal treatment and baseline run with the same gCODsubstrate / gVSSinoculum ratio of 3.7 in the bench-scale reactor. Biogas production raw data can be found in Appendix A, Table A-14. .............................................................................. 49Figure 5-3 Specific biogas production of intermediate thermal treatment runs in the bench-scale reactor. Biogas production raw data can be found in Appendix A, Table A-18, Table A-22. ....................................................................................................................................... 51Figure 5-4 Biogas production rate and sCOD for the intermediate thermal treatment run that was started on Jan 27th, 2015 .................................................................................................. 52
viii
Figure 5-5 BMP results for post thermal treatment study conducted in unconventional BMP tests. Biogas production raw data can be found in Appendix A, Table A-33. ....................... 54Figure 5-6 Comparison of biogas production between BMP tests and the bench-scale reactor for a 20:80 mixture of treated and untreated digestate ........................................................... 55Figure 5-7 Biogas production of BMP test for various parameters. BS = Biosludge, GS = Granular Sludge (inoculum). Positive control biogas production was much higher and not shown after the first 4 days, refer to Appendix C for positive control details. Positive control recipe found in section 3.5. Biogas production raw data can be found in Appendix A, Table A-28. ....................................................................................................................................... 60Figure 5-8 Biogas production of BMP test for testing the feasibility of thermally treating the solid portion of the digestate only. Positive control biogas production was much higher and not shown after the first 6 days, refer to Appendix C for positive control details. Positive control recipe found in section 3.5. Biogas production raw data can be found in Appendix A, Table A-31. ............................................................................................................................. 63Figure A-1 COD standard calibration. (March 14th, 2014). Used for baseline run 2, BMP test set 1 ......................................................................................................................................... 81Figure A-2 COD standard calibration. (Aug 25th, 2014). Used for baseline run 1, thermal pre-treatment run, intermediate thermal treatment run 1, BMP test set 2 ..................................... 81Figure A-3 COD standard calibration (Jan 9th, 2015). Used for baseline run 3, intermediate thermal treatment run 2, post thermal treatment BMP tests ................................................... 82Figure A-4 GC calibration for CO2 ........................................................................................ 97Figure A-5 GC calibration for CH4 ........................................................................................ 97Figure C-1 Full biogas production graph for BMP test set 1 ............................................... 109Figure C-2 Full biogas production graph for BMP test set 2 ............................................... 109Figure D-1 CH4 amount in the headspace of soil BMP tests ................................................ 111Figure D-2 Benzene concentration in positive control soil samples .................................... 113Figure D-3 Methane production comparison between BMP bottles with and without benzene addition ................................................................................................................................. 114

ix
List of Tables Table 2-1 Comparison of municipal and pulp and paper activated sludge (from Xu and Lancaster, 2012) ....................................................................................................................... 8Table 2-2 Summary of co-digestion of pulp and paper mill biosludge with other substrates 13Table 2-3 Summary of mechanical pre-treatment studies ...................................................... 17Table 2-4 Summary of microwave and ultrasonic pre-treatment studies ............................... 18Table 2-5 Summary of thermal pre-treatment studies ............................................................ 21Table 3-1 Media components details (Edwards and Garbic-Galic, 1994) .............................. 27Table 3-2 Trace metal solution components (Edwards and Garbic-Galic, 1994) .................. 28Table 3-3 List of all bench-scale reactor runs ........................................................................ 36Table 5-1 Thermal treatment (190°C, 30min) effects on biosludge ....................................... 45Table 5-2 COD and solids reduction in baseline runs ............................................................ 48Table 5-3 Mass bass of all bench-scale reactor experiments. Detailed calculations can be found in Appendix B. ............................................................................................................. 57Table 5-4 Summary of all bench-scale reactor experiments. Detailed calculations can be found in Appendix B. ............................................................................................................. 58Table 5-5 BMP tests set 1- specific methane yield ................................................................. 61Table 6-1 Summary of enhancements in specific methane yields from thermal treatment runs
................................................................................................................................................ 70Table A-1 Baseline run 1 properties ....................................................................................... 82Table A-2 Baseline run 1 biogas production .......................................................................... 83Table A-3 Baseline run 1 COD measurements ....................................................................... 84Table A-4 Baseline run 1 solids measurements ...................................................................... 84Table A-5 Baseline run 2 properties ....................................................................................... 84Table A-6 Baseline run 2 biogas production .......................................................................... 85Table A-7 Baseline run 2 COD measurements ....................................................................... 86Table A-8 Baseline run 2 solids measurements ...................................................................... 86Table A-9 Baseline run 3 properties ....................................................................................... 87Table A-10 Baseline run 3 biogas production ........................................................................ 87Table A-11 Baseline run 3 COD measurements ..................................................................... 89Table A-12 Baseline run 3 solids measurements .................................................................... 89Table A-13 Thermal pre-treatment run properties .................................................................. 89Table A-14 Thermal pre-treatment run biogas production ..................................................... 90Table A-15 Thermal pre-treatment run COD measurements ................................................. 91Table A-16 Thermal pre-treatment run solids measurements ................................................ 91Table A-17 Intermediate thermal treatment run 1 properties ................................................. 91Table A-18 Intermediate thermal treatment run 1 biogas production .................................... 92Table A-19 Intermediate thermal treatment run 1 COD measurements ................................. 93Table A-20 Intermediate thermal treatment run 1 solids measurements ................................ 94Table A-21 Intermediate thermal treatment run 2 properties ................................................. 94
x
Table A-22 Intermediate thermal treatment run 2 biogas production .................................... 95Table A-23 Intermediate thermal treatment run 2 COD measurements ................................. 96Table A-24 Intermediate thermal treatment run 2 solids measurements ................................ 96Table A-25 GC measurements for bench-scale experiments ................................................. 98Table A-26 Set up for BMP set 1 ......................................................................................... 100Table A-27 BMP set 1 biogas production measurements .................................................... 101Table A-28 BMP set 1 cumulative biogas production ......................................................... 102Table A-29 Set up for BMP set 2 ......................................................................................... 102Table A-30 BMP set 2 biogas production measurements .................................................... 103Table A-31 BMP set 2 cumulative biogas production ......................................................... 103Table A-32 BMP for post thermal treatment biogas production measurements .................. 104Table A-33 BMP for post thermal treatment cumulative biogas production ....................... 104Table D-1 Heavy hydrocarbon contaminated soil type and TPH concentrations ................ 110Table D-2 Soil sample BMP set up summary ...................................................................... 111Table D-3 Methane production vs. Benzene degradation in soil BMP tests ........................ 115
xi
Nomenclature
AD – Anaerobic digestion
BMP – Biochemical Methane Potential
COD – Chemical Oxygen Demand
sCOD – Soluble Chemical Oxygen Demand
GC – Gas Chromatography
TCD - Thermal Conductivity Detector
TS – Total Solids
TSS – Total Suspended Solids
VS – Volatile Solids
VFA – Volatile Fatty Acids
VSS – Volatile Suspended Solids
WAS – Waste Activated Sludge (Biosludge)

1
1. Introduction
1.1 Background
The pulp and paper industry is a major producer of wastewater. The activated sludge
process, used in wastewater treatment, produces a large quantity of waste activated
sludge (WAS) or biosludge, which has a dry solids content of approximately 0.5-2%.
Sludge management can account for roughly 60% of the total waste handling costs in a
pulp mill (Kyllonen et al., 1988). A typical Canadian pulp mill will produce
approximately 40 dry tonnes (~4000 wet tonnes) of sludge each day (Saha et al., 2011).
Due to its low dry solids content, the sludge needs to be dewatered before it is disposed
of, and the most common disposal methods currently are incineration and landfilling;
both are costly and not environmentally friendly (Mahmood and Elliott, 2006).
Figure 1-1 shows a simplified flow chart of a typical wastewater treatment process. The
wastewater first enters a primary clarifier, where the solids are settled and taken out; this
is referred to as primary sludge. In a pulp and paper mill, the primary sludge consists
mainly of wood fibres and chips and is sometimes called fibre sludge. The wastewater
then moves on to an aerobic treatment process, also called activate sludge process, where
aerobic microorganisms digest components of the wastewater and produce large amounts
of biomass in the process, referred to as waste activated sludge (WAS) or biosludge.
2
Figure 1-1 Simplified flowchart of generalized wastewater / biosludge treatment. Red – current treatment. Green – proposed treatment. Pre-treatment indicates that the biosludge is treated before entering the AD process. Post-treatment indicates that the digestate from the AD process is treated and then re-injected back into the digester for further treatment.
Canada is the world’s leading exporter of Kraft pulp, the dominant type of pulp produced,
which means that the pulp mill biosludge issue is very relevant to Canadians (NRCan,
2015). Several factors have contributed to more research in the biosludge disposal issue,
such as more stringent regulations regarding landfilling, decreased landfill capacity, and
more attention to being environmentally responsible (Saha et al., 2011). Anaerobic
digestion (AD) is a process that is widely used in wastewater treatment as well as in
3
various types of biosolids treatment. However, due to the sheer volume of biosludge that
has to be treated, along with the inherent slow reaction rates, the anaerobic digester
would have to be very large, and therefore, the payback on the investment may be very
poor, which has made AD of pulp and paper mill biosludge unpopular (Elliott and
Mahmood, 2012).
There are however several advantages to AD of biosludge. Firstly, a mixture consisting
of mainly methane and carbon dioxide is produced, referred to as biogas, and it can be
burnt to produce energy to support other operations. Secondly, the total amount of solids
will be reduced, resulting in a decreased amount of sludge requiring disposal. Various
sludge treatment methods have also been studied to enhance the AD of biosludge. All
pre- and post-treatment methods are focused on attempting to break open the biosludge
flocs to improve the AD process by increasing the rate of degradation as well as the
digestion yield.
Many studies looking at AD have focused on using serum bottles or small bioreactors,
the volumes of these vessels range anywhere from 100mL to 2L. These tests are referred
to as biochemical methane potential (BMP) tests. However, these vessels do not mimic
real-life scenarios and many operational conditions cannot be studied. BMP results must
be interpreted with caution, because they may not be replicable on a larger scale.
Therefore, it is important to perform AD experiments at a scale that more closely mimic
real-life applications in order to gain a more complete understanding of this process.
4
1.2 Hypothesis and Objectives
The major hypothesis of this study is that post-thermal treatment methods can more
effectively utilize the treatment energy to enhance the anaerobic digestibility of pulp and
paper mill biosludge compared to pre-thermal treatment. Several objectives were
proposed to investigate AD of biosolids and test this hypothesis:
1. Establish operating parameters for a new bench-scale AD system.
2. Evaluate effect of thermal treatment on the AD process both using BMP tests as well
as a larger bench scale system, and determine how to best utilize thermal treatment of
the biosludge/digestate to enhance AD.
3. Compare BMP tests and bench scale system to see how scale affects the AD process
Since only one bench-scale reactor was available, simultaneous replication of the
experiments was impossible. Therefore, the current study was designed to provide
knowledge on the operation of the bench-scale reactor as well as to carry out preliminary
experiments to examine the effects of thermal treatment on AD.
1.3 Thesis Organization
The first three chapters of this thesis are introduction, literature review, and materials
and methods, which are very similar to most thesis documents. The results section for
this thesis is divided into two chapters due to the uniqueness of this project. Chapter 4
focuses on the setting up and operational aspects of the bench-scale system, while
Chapter 5 contains experimental results for the bench-scale system as well as BMP tests.
Chapter 6 (discussion) summarizes the results from both results chapters and makes
comparisons with literature. Chapter 7 is entitled “Engineering Significance” which
5
provides a “high-level” summary of the findings in this study. Chapters 8 and 9 are
conclusions and recommendations. Appendix A contains all of the raw data from this
study. Appendix B contains sample calculations used throughout this document.
Appendix C contains complete BMP test biogas production graphs.
A side project was completed during this study and was focused on anaerobic digestion
of heavy hydrocarbon contaminated soil. This project was a collaborative project with
Arizona State University and Chevron. The details regarding this project can be found in
Appendix D.
6
2. Literature Review
2.1 Anaerobic Digestion of Pulp and Paper Mill Biosludge
Large amounts of wastewater are produced in the pulp and paper industry and the
resulting sludge (both primary and secondary) is a huge problem for the mills. Currently,
the sludge is dewatered and then landfilled or incinerated (Wood et al., 2009). The sludge
is typically dewatered mechanically to a solids content of 20-35% (Kyllonen et al., 1988).
It is very difficult to increase the solids content further, unless more costly dewatering
methods are used. The main drawback of incinerating the dewatered sludge is a low net
energy yield of 2-6 MJ/kg (Stoica et al., 2009), whereas burning wood yields roughly 17-
21 MJ/kg (Smil, 2008).
The dewatered sludge may also be land-applied as a fertilizer. However, there are many
hurdles to be overcome. Firstly, the sludge may contain heavy metals and other
contaminants that are above the regulatory limits. Secondly, there is a general negative
perception around the sludge from farmers as well as the odour of the sludge and its
impact on neighbours (Meyer and Edwards, 2014).
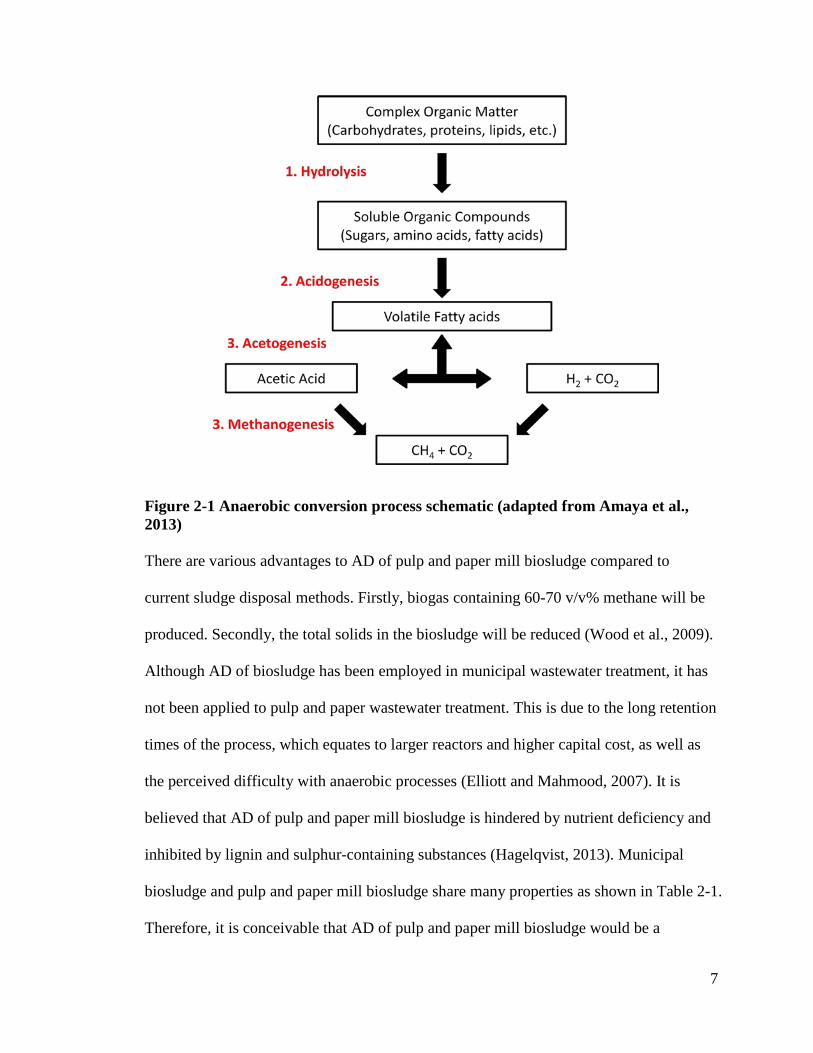
Anaerobic digestion has been recognized, in simplified terms, to consist of 4 major steps:
hydrolysis, acidogenesis, acetogenesis, and methanogenesis (Figure 2-1). The key
microorganisms performing different steps of the AD process have different
characteristics and different optimal pH levels, which means that the overall process is
sensitive to system shocks or sudden changes in operating condition.
7
Figure 2-1 Anaerobic conversion process schematic (adapted from Amaya et al., 2013) There are various advantages to AD of pulp and paper mill biosludge compared to
current sludge disposal methods. Firstly, biogas containing 60-70 v/v% methane will be
produced. Secondly, the total solids in the biosludge will be reduced (Wood et al., 2009).
Although AD of biosludge has been employed in municipal wastewater treatment, it has
not been applied to pulp and paper wastewater treatment. This is due to the long retention
times of the process, which equates to larger reactors and higher capital cost, as well as
the perceived difficulty with anaerobic processes (Elliott and Mahmood, 2007). It is
believed that AD of pulp and paper mill biosludge is hindered by nutrient deficiency and
inhibited by lignin and sulphur-containing substances (Hagelqvist, 2013). Municipal
biosludge and pulp and paper mill biosludge share many properties as shown in Table 2-1.
Therefore, it is conceivable that AD of pulp and paper mill biosludge would be a
8
successful process. A detailed compositional analysis of pulp and paper mill biosludge
could not be found, but it can be assumed that there would be a much higher lignin
concentration in the pulp mill biosludge compared with municipal biosludge. Lignin is a
known complex polymer that is difficult to biodegrade, and it is speculated that it is one
of the main factors that may cause pulp mill biosludge to be not as suitable for AD as
municipal biosludge (Richard, 1996).
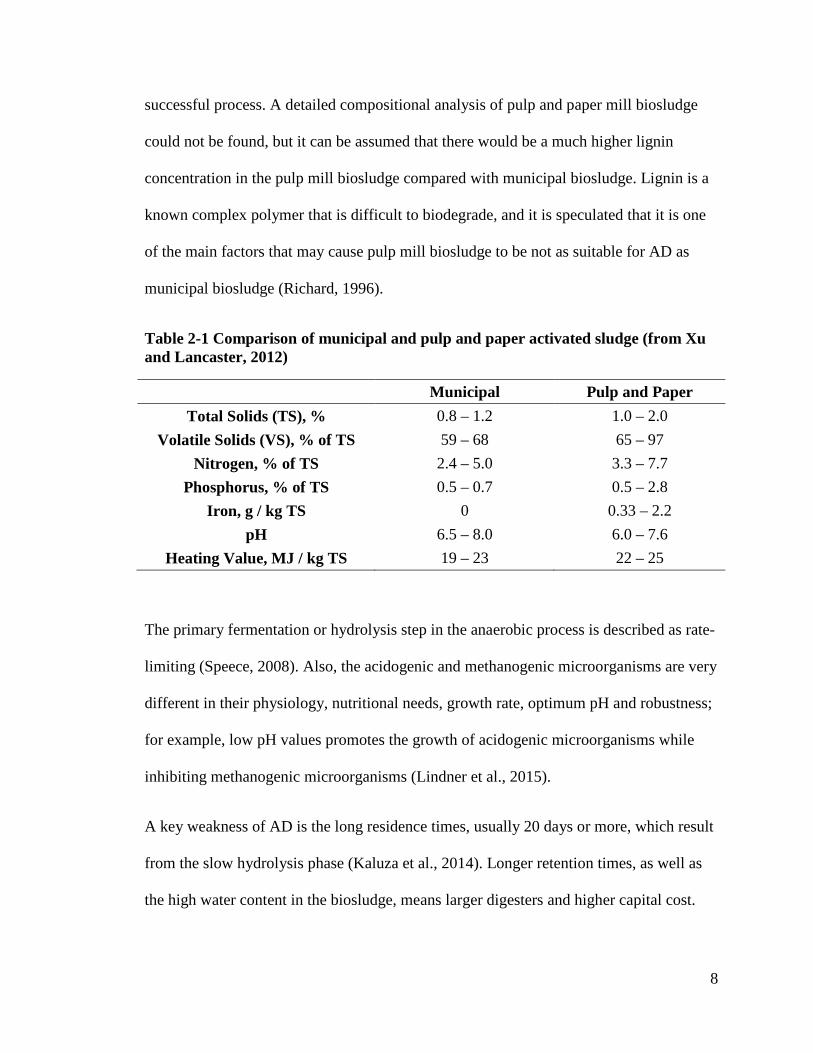
Table 2-1 Comparison of municipal and pulp and paper activated sludge (from Xu and Lancaster, 2012)
Municipal Pulp and Paper Total Solids (TS), % 0.8 – 1.2 1.0 – 2.0
Volatile Solids (VS), % of TS 59 – 68 65 – 97 Nitrogen, % of TS 2.4 – 5.0 3.3 – 7.7
Phosphorus, % of TS 0.5 – 0.7 0.5 – 2.8 Iron, g / kg TS 0 0.33 – 2.2
pH 6.5 – 8.0 6.0 – 7.6 Heating Value, MJ / kg TS 19 – 23 22 – 25
The primary fermentation or hydrolysis step in the anaerobic process is described as rate-
limiting (Speece, 2008). Also, the acidogenic and methanogenic microorganisms are very
different in their physiology, nutritional needs, growth rate, optimum pH and robustness;
for example, low pH values promotes the growth of acidogenic microorganisms while
inhibiting methanogenic microorganisms (Lindner et al., 2015).
A key weakness of AD is the long residence times, usually 20 days or more, which result
from the slow hydrolysis phase (Kaluza et al., 2014). Longer retention times, as well as
the high water content in the biosludge, means larger digesters and higher capital cost.
9
This is another reason that AD of pulp and paper mill biosludge is still in its infancy
(Meyer and Edwards, 2014).
Previous studies have shown that the AD of pulp and paper mill biosludge has low biogas
yield compared to that of other sludges. The methane yield of biosludge in a municipal
wastewater treatment plant is between 325 and 380 mL CH4/g VSadded, whereas the
reported methane yield of pulp and paper mill biosludge peaks at 199 mL CH4/g VSadded
and can be as low as 50 mL CH4/g VSadded (Huiliñir et al., 2014).
It is sometimes difficult to compare the methane yield from different studies, since the
biosludge composition and activity varies. Biosludge is also a very complex material, and
none of the studies so far has examined the exact composition of biosludge; therefore, the
influence of biosludge composition on AD performance is unknown. This significantly
contributes to the fairly wide variation in the reported methane yield values. However,
analytical errors can also cause some discrepancies between different studies.
Comparisons can be made within the same study when the initial substrate came from the
same source, but comparisons between different studies must be made carefully. Other
differences between studies are the operating conditions, such as reactor volume, reactor
configuration, substrate to inoculum ratio, type of inoculum, solids content, and mixing
type/speed.
As stated previously, AD processes do not respond well to system shocks. Differences in
growth rate among the microorganisms found in anaerobic communities may cause
problems when too much “food” is fed to the reactor, a condition referred to as reactor
overload. When this occurs, volatile fatty acid (VFA) production often spikes , because
10
the acidogens grow considerably more quickly than the methanogens, and they rapidly
produce VFAs causing the pH in the reactor to drop to a level at which the methanogens
stop growing. An optimal pH of an anaerobic digester is between 6.4-7.6, and a very
important parameter to monitor during AD is the ratio of VFA to alkalinity in order to
anticipate adverse conditions and prevent the reactor from going “sour” (Anderson and
Yang, 1992).
2.1.1 Biochemical Methane Potential (BMP) Test
BMP tests are commonly used to assess anaerobic digestibility of various substrates.
BMP tests are carried out in serum bottles or small bioreactors that are typically 100ml –
2L in volume (Angelidaki et al., 2009).
The objective of any BMP test is to determine the total amount of biogas that could be
generated from a certain substrate. In order to do this, the standard protocol requires that
the substrate be diluted with water or medium in order to prevent overload or potential
inhibition (Angelidaki et al., 2009). The knowledge gained from BMP tests are valuable
because it shows the theoretical feasibility of using AD to digest a certain substrate;
however, these tests do not mimic actual full-scale operations and therefore they will
overlook various operational and other potential issues when using the same substrates in
a bench-, pilot-, or full-scale application. The major difference between full scale AD of
biosludge and BMP tests is that the substrate is not diluted with water or medium, and
this means that the solids content is much greater in a full scale application compared to
BMP tests.
11
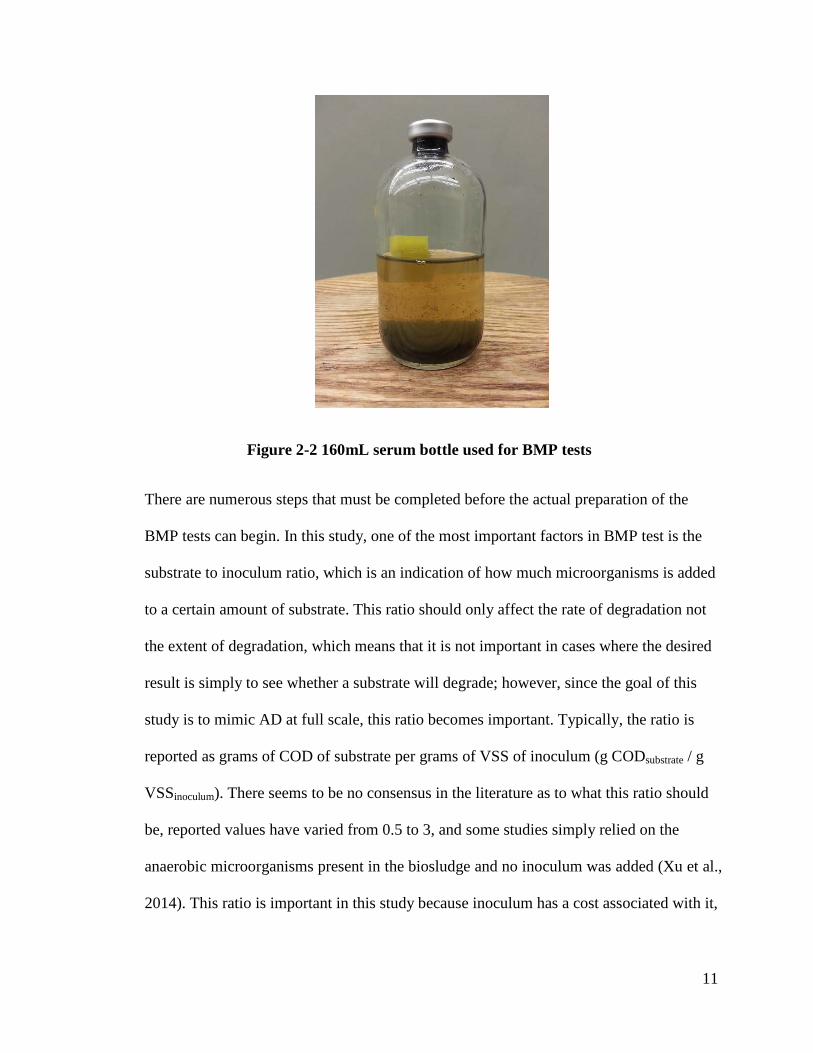
Figure 2-2 160mL serum bottle used for BMP tests
There are numerous steps that must be completed before the actual preparation of the
BMP tests can begin. In this study, one of the most important factors in BMP test is the
substrate to inoculum ratio, which is an indication of how much microorganisms is added
to a certain amount of substrate. This ratio should only affect the rate of degradation not
the extent of degradation, which means that it is not important in cases where the desired
result is simply to see whether a substrate will degrade; however, since the goal of this
study is to mimic AD at full scale, this ratio becomes important. Typically, the ratio is
reported as grams of COD of substrate per grams of VSS of inoculum (g CODsubstrate / g
VSSinoculum). There seems to be no consensus in the literature as to what this ratio should
be, reported values have varied from 0.5 to 3, and some studies simply relied on the
anaerobic microorganisms present in the biosludge and no inoculum was added (Xu et al.,
2014). This ratio is important in this study because inoculum has a cost associated with it,
12
and it is unrealistic to be adding equal parts of inoculum and substrate into the digester in
a full scale application.
Since pulp and paper mill biosludge is more difficult to digest than municipal biosludge,
many studies have focused on using different methods to enhance the AD process instead
of simply digesting the raw biosludge. In the following section, co-digestion and different
pre-treatments will be discussed as ways to improve the bio-degradation of pulp and
paper mill biosludge. It is important to note that all of the studies mentioned are done
using BMP test unless otherwise stated.
2.1.2 Co-digestion of Pulp and Paper Mill Biosludge with Other Substrates
Co-digestion refers to combining multiple substrates in order to enhance the AD process.
Typically, a readily degradable substrate will be mixed with a difficult to digest substrate,
and the result often shows a synergistic effect in terms of biogas production. Co-digestion
conditions can vary widely from the ratio of the different substrates to the type of
substrates. Currently, the feasibility of full-scale applications of each co-digestion study
has to be evaluated individually, because the substrate availability and transportation
costs are very important factors. Ideally, locations where multiple substrates are readily
available would be the most fitting for this type of AD processes (Meyer and Edwards,
2014).
There is a wide range of substrates used in co-digestion experiments, such as municipal
sludge, food waste, dairy farm waste, rice straw, pig slaughterhouse waste, grease trap
waste, grass silage, and pulp mill biosludge. Synergetic effects are often observed when
combining two different substrates (Borowski and Kubacki, 2015; Hagelqvist, 2013;
13
Mussoline et al., 2013; Trulli and Torretta, 2015; Yalcinkaya and Malina, 2015).
Although the exact reason behind the enhancement in biogas production through co-
digestion is not fully understood, it is fairly well established that co-digestion can allow
the process to be more operationally robust as well as improve biogas production
synergistically. The studies listed in Table 2-2 have pulp and paper mill biosludge as one
of the co-digestion substrates, other studies focusing on co-digestion of other substrates
are not discussed.
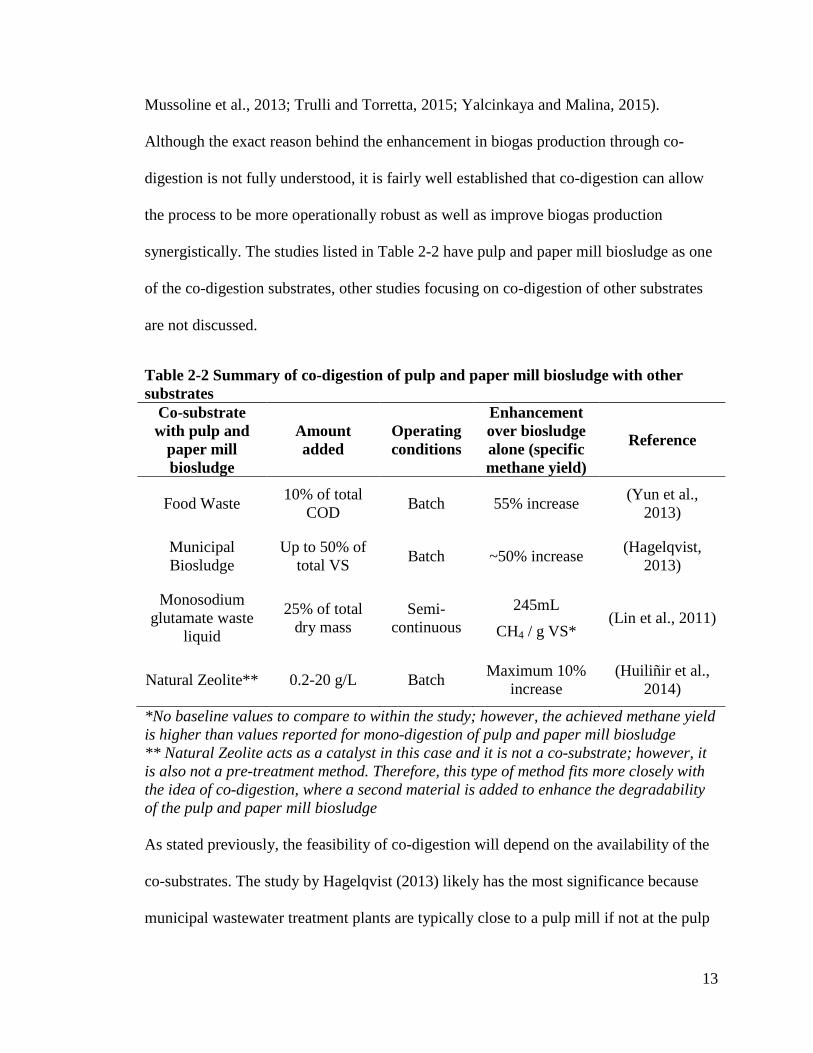
Table 2-2 Summary of co-digestion of pulp and paper mill biosludge with other substrates
Co-substrate with pulp and
paper mill biosludge
Amount added
Operating conditions
Enhancement over biosludge alone (specific methane yield)
Reference
Food Waste 10% of total COD Batch 55% increase (Yun et al.,
2013)
Municipal Biosludge
Up to 50% of total VS Batch ~50% increase (Hagelqvist,
2013)
Monosodium glutamate waste
liquid
25% of total dry mass
Semi-continuous
245mL
CH4 / g VS* (Lin et al., 2011)
Natural Zeolite** 0.2-20 g/L Batch Maximum 10% increase
(Huiliñir et al., 2014)
*No baseline values to compare to within the study; however, the achieved methane yield is higher than values reported for mono-digestion of pulp and paper mill biosludge ** Natural Zeolite acts as a catalyst in this case and it is not a co-substrate; however, it is also not a pre-treatment method. Therefore, this type of method fits more closely with the idea of co-digestion, where a second material is added to enhance the degradability of the pulp and paper mill biosludge As stated previously, the feasibility of co-digestion will depend on the availability of the
co-substrates. The study by Hagelqvist (2013) likely has the most significance because
municipal wastewater treatment plants are typically close to a pulp mill if not at the pulp
14
mill; therefore, it would be very easy to mix the two sludges and perform co-digestion.
The study on food waste, conducted by Yun et al. (2013) is interesting because the
addition of a very small amount of food waste caused a significant improvement in the
biogas production. This seems to align with the idea that a limiting factor in pulp and
paper mill biosludge digestion is limited nutrients and the food waste is able to
supplement missing nutrients to the microorganisms. In the study by Huilinir et al. (2014),
natural zeolite was used as a catalyst and although this is not co-digestion of two
substrates, it aligns with the idea of adding a different material to the biosludge to
enhance its AD.
In general, co-digestion of pulp and paper mill biosludge seems to offer many benefits
compared to digesting the biosludge on its own; therefore, this is an area that should be
further examined with different substrates readily available to most pulp mills.
2.2 Pre-treatment Methods to Enhance the Anaerobic Digestion of Pulp and Paper Mill Biosludge
It has been determined that only 30-50% of the COD within the biosludge is
biodegradable; various pre-treatment techniques have been studied to accelerate the AD
process (Kaluza et al., 2014). This is different from the co-digestion studies mention
previously, as these experiments focus on breaking open the biosludge in various ways to
increase bioavailability of the COD to become available for biodegradation. All of the
pre-treatment methods focus on the hydrolysis step of the AD process (refer to Figure
2-1). Generally, soluble COD is easier to degrade than non-soluble COD; therefore, pre-
treatments that can significantly increase the soluble COD are typically seen as having
potential to enhance AD. Biosludge contains extracellular polymeric substances and
15
microbial cells that are resistant to AD. The different treatment methods are all aimed at
disrupting the floc structure of the biosludge (Saha et al., 2011). A wide range of
treatment methods has been studied, varying from chemical treatments to
mechanical/physical treatments.
2.2.1 Chemical
Chemical pre-treatment methods involve either alkaline or acidic conditions. Most of the
studies have focused on alkali addition to the sludge; some studies have shown that this
can cause sludge solubilisation, which also typically implies that a high biogas yield can
be achieved. However, there are conflicting results from literature. Bayr et al. (2013)
found that the methane yield after alkaline treatment decreased by 84%, while Woods et
al. (2009), found that the methane yield increased by 20 and 270% in two different type
of pulp mill biosludges respectively (Meyer and Edwards, 2014; Saha et al., 2011; Wood
et al., 2009).
Although an increase in soluble COD is usually seen as a positive in terms of AD, this
may not always be the case. Some soluble COD is attributed to recalcitrant compounds
that may inhibit AD. For example, furfural and hydroxymethylfurfural are degradation
products from pentoses and hexoses. The main toxic compounds are furans, organic acids,
and aromatic compounds from lignin in the form of acids, aldehydes and ketones. These
compounds are more easily formed under acidic conditions (Bayr et al., 2013; Galbe and
Zacchi, 2012). This corresponds with the result found by Bayr et al. (2013) that acid pre-
treatment (HNO3 at pH 3) had a negative impact on AD and decreased the methane yield
by 99%.
16
Although the results of chemical treatment alone on biosludge appears to have negative
or conflicting impacts on AD, there are also various other studies that have coupled this
treatment with other methods. Raising the alkalinity is effective in weakening bacterial
cell walls, which will then allow the other pre-treatment methods to be more effective
(Stephenson and Dhaliwal, 2000). Coupled pre-treatments are discussed in the following
sections.
2.2.2 Mechanical
Various types of mechanical treatment have been used in an attempt to enhance the AD
of pulp and paper mill biosludge. Mechanical treatments are methods that aim to
physically rupture flocs within the biosludge to allow more of the COD to be accessible
for biodegradation by the microorganisms. The common mechanical treatment methods
are ball milling, sonication, shearing, and high-pressure homogenization. It should be
noted that several studies used NaOH along with the mechanical pre-treatment to
enhance the effect of the pre-treatment.
17
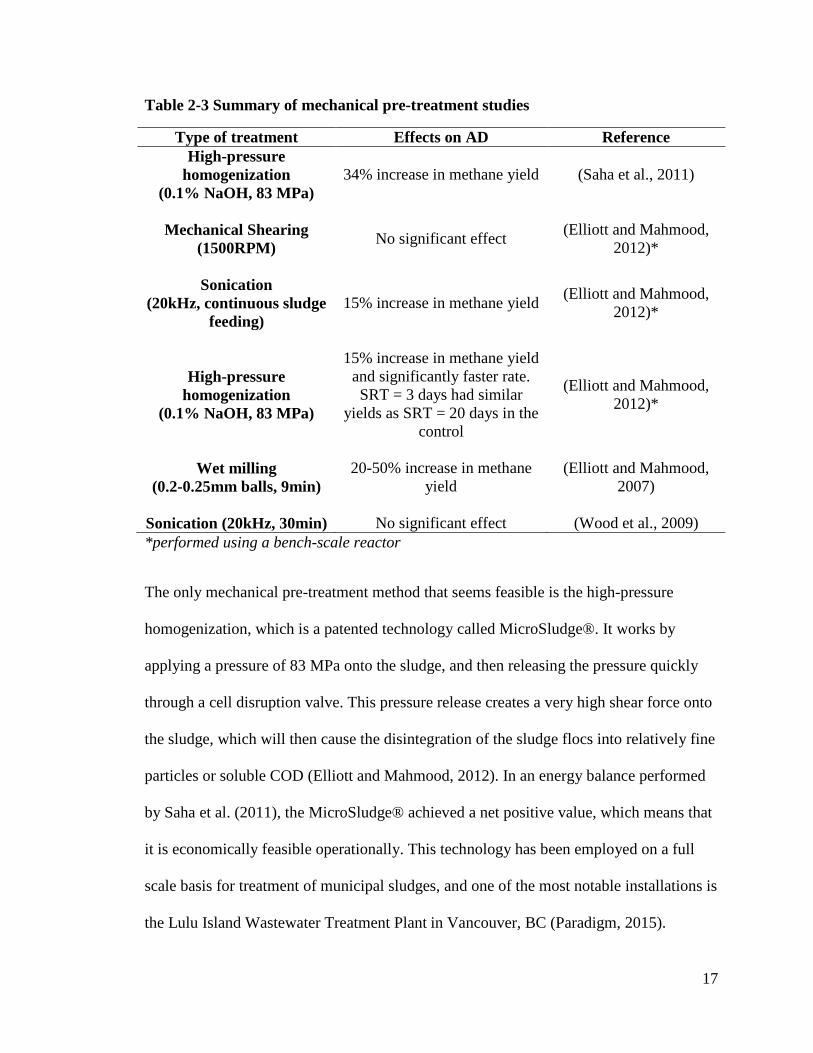
Table 2-3 Summary of mechanical pre-treatment studies
Type of treatment Effects on AD Reference High-pressure
homogenization (0.1% NaOH, 83 MPa)
34% increase in methane yield (Saha et al., 2011)
Mechanical Shearing
(1500RPM) No significant effect (Elliott and Mahmood, 2012)*
Sonication
(20kHz, continuous sludge feeding)
15% increase in methane yield (Elliott and Mahmood, 2012)*
High-pressure homogenization
(0.1% NaOH, 83 MPa)
15% increase in methane yield and significantly faster rate. SRT = 3 days had similar
yields as SRT = 20 days in the control
(Elliott and Mahmood, 2012)*
Wet milling
(0.2-0.25mm balls, 9min) 20-50% increase in methane
yield (Elliott and Mahmood,
2007)
Sonication (20kHz, 30min) No significant effect (Wood et al., 2009) *performed using a bench-scale reactor
The only mechanical pre-treatment method that seems feasible is the high-pressure
homogenization, which is a patented technology called MicroSludge®. It works by
applying a pressure of 83 MPa onto the sludge, and then releasing the pressure quickly
through a cell disruption valve. This pressure release creates a very high shear force onto
the sludge, which will then cause the disintegration of the sludge flocs into relatively fine
particles or soluble COD (Elliott and Mahmood, 2012). In an energy balance performed
by Saha et al. (2011), the MicroSludge® achieved a net positive value, which means that
it is economically feasible operationally. This technology has been employed on a full
scale basis for treatment of municipal sludges, and one of the most notable installations is
the Lulu Island Wastewater Treatment Plant in Vancouver, BC (Paradigm, 2015).

18
2.2.3 Microwave and ultrasound
High-frequency waves can be used to achieve sludge disintegration. Microwaves are
electromagnetic waves and ultrasound uses acoustic waves. Waves cause the formation
of small gas bubbles, and as they form and collapse, they create strong temperature and
pressure gradients. This action ruptures cell walls and releases intercellular matter that
can be then more easily degraded by microorganisms during AD (Meyer and Edwards,
2014).
Table 2-4 Summary of microwave and ultrasonic pre-treatment studies
Type of treatment Reported effect on methane/biogas yield Reference
Ultrasonic (16.8 – 39.6 MJ/kg TS,
80min, 10s on, 5s off cycles) + Alkaline
(0.206-0.261 g/g TS)
0% (Park et al., 2012)
Microwave
(150°C) +16% (Tyagi et al., 2014)
Ultrasonic
(110.2 MJ/kg TS, 60min) +23% (Tyagi et al., 2014)
Combined alkali (pH = 12)
and ultrasonic (110.2 MJ/kg TS, 60min)
+47% (Tyagi et al., 2014)
Ultrasonic
(45kHz, 45min) +6% (Bayr et al., 2013)
Ultrasonic
(45kHz, 45min) + alkali (5M NaOH)
+6% (Bayr et al., 2013)
Microwave
(175°C) +63% (Saha et al., 2011)
Ultrasonic
(117.7MJ/kg TS, 90min) +51% (Saha et al., 2011)
Note: only the best results from each of the reported studies are shown. All of the above studies were conducted under mesophilic conditions
19
Between the microwave and ultrasonic treatments, it appears that microwave treatment is
more effective. However, it must be noted that the microwave treatment is a temperature-
based treatment just like thermal treatment (to be discussed in the next section).
Therefore, the resulting increase in AD performance may be caused by the heat instead of
the action of the waves, or there may be a synergistic effect of the microwaves and the
heat. Ultrasonic treatment is only based on the action of the waves, and it can be seen that
a lot of energy is required to achieve a significant difference in AD performance. In the
study by Park et al. (2012), which saw no positive effect from ultrasonic pre-treatment,
the amount of energy put into the ultrasonic treatment was not as high as the other studies
(refer to Table 2-4).
In the study conducted by Saha et al. (2011), an energy balance was performed on the
microwave and ultrasonic treatments. It was shown that microwave treatments at any
temperature and ultrasonic treatments that are longer than 15min will all have a negative
energy balance, which means that more energy was expended in pre-treatment than what
can be gained from the increased biogas production. However, the energy gained from
biogas is not the only upside to AD; the reduction of the total solids also needs to be
considered and is typically more important than the enhanced biogas production.
Unfortunately, the reported maximum TS reductions of only 9%, which is not very
significant and unlikely to make this type of pre-treatment feasible (Saha et al., 2011).
Therefore, microwave and ultrasonic treatment do not seem to be a viable alternative
because of their high energy costs.
20
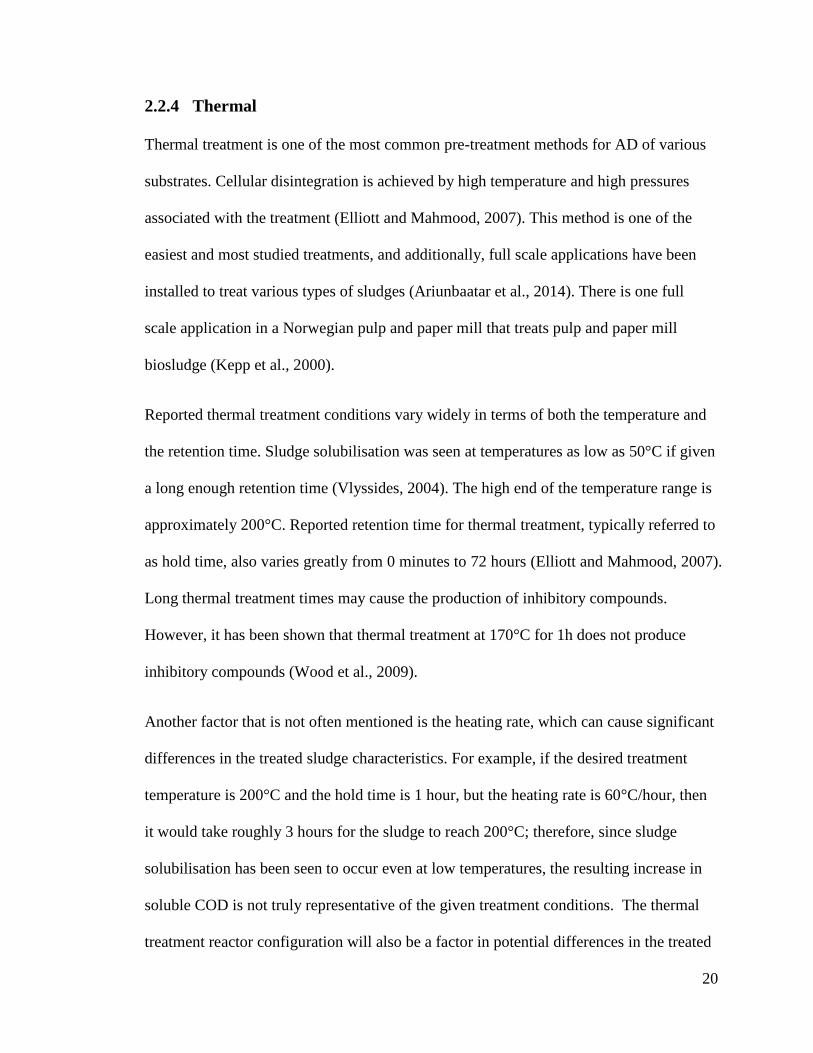
2.2.4 Thermal
Thermal treatment is one of the most common pre-treatment methods for AD of various
substrates. Cellular disintegration is achieved by high temperature and high pressures
associated with the treatment (Elliott and Mahmood, 2007). This method is one of the
easiest and most studied treatments, and additionally, full scale applications have been
installed to treat various types of sludges (Ariunbaatar et al., 2014). There is one full
scale application in a Norwegian pulp and paper mill that treats pulp and paper mill
biosludge (Kepp et al., 2000).
Reported thermal treatment conditions vary widely in terms of both the temperature and
the retention time. Sludge solubilisation was seen at temperatures as low as 50°C if given
a long enough retention time (Vlyssides, 2004). The high end of the temperature range is
approximately 200°C. Reported retention time for thermal treatment, typically referred to
as hold time, also varies greatly from 0 minutes to 72 hours (Elliott and Mahmood, 2007).
Long thermal treatment times may cause the production of inhibitory compounds.
However, it has been shown that thermal treatment at 170°C for 1h does not produce
inhibitory compounds (Wood et al., 2009).
Another factor that is not often mentioned is the heating rate, which can cause significant
differences in the treated sludge characteristics. For example, if the desired treatment
temperature is 200°C and the hold time is 1 hour, but the heating rate is 60°C/hour, then
it would take roughly 3 hours for the sludge to reach 200°C; therefore, since sludge
solubilisation has been seen to occur even at low temperatures, the resulting increase in
soluble COD is not truly representative of the given treatment conditions. The thermal
treatment reactor configuration will also be a factor in potential differences in the treated

21
sludge even if the temperature and hold times were identical. Since instantaneous heating
is not easily achieved, and not all studies are using the same thermal treatment reactor, it
is difficult to simply look at the treatment temperature and hold time as the only variables
when comparing the effects of thermal treatment in the various studies.
Despite the many variables in thermal treatment studies, an enhancement of AD has been
seen in all studies looking at all types of substrates. This indicates that thermal treatment
is an effective pre-treatment method to increase the soluble COD content as well as to
improve AD. Therefore, thermal treatment was focused on during the course of this study.
Since there are only two studies that looked at thermal pre-treatment of pulp and paper
mill biosludge, results from studies on other types of sludges are also reported in the
summary table below.
Table 2-5 Summary of thermal pre-treatment studies
Thermal treatment conditions
Type of biosludge
Reported effect on methane yield Reference
70°C, 40min Pulp and paper mill +7% (Bayr et al., 2013)
150°C, 10min Pulp and paper mill +45% (Bayr et al., 2013)
170°C, 1h Sulfite pulp mill +54% (Wood et al., 2009)
170°C, 1h Kraft pulp mill +467% (Wood et al., 2009)
70°C, 9h Municipal +30% (Xu et al., 2014)
170°C (25min) Municipal +32% (Jolis, 2008)
170°C (30min) Municipal +61% (Valo et al., 2004)
22
Some studies on thermal treatment simply focused on COD solubilization, since typically
an increase in soluble COD would equal an increase in biogas production (Paul et al.,
2006; Vlyssides, 2004). Valo et al. (2004) also found that the soluble COD increases as
the treatment temperature increases. However, the idea that more soluble COD means an
improvement in AD may not be true in all cases, since not all soluble COD is
biodegradable.
2.2.5 Pre-treatments Summary
Solubilizing recalcitrant and/or toxic compounds is not the goal of pre-treatment. This
may explain why some pre-treatment methods showed no improvements on AD
performance, and in some cases had a detrimental effect even though the soluble COD
content had increased. It is important to characterize these recalcitrant compounds so that
a better understanding of the effects of pre-treatments can be gained. There are no reports
in literature characterizing the biosludge on a molecular basis before and after any type of
pre-treatment, making it difficult to truly compare the impact of different pre-treatments.
Of course, this is an extremely difficult task due to the complexity of biosludge.
The soluble COD that is released by the various treatment methods contains VFAs (Xu et
al., 2014). This is theoretically good for AD since VFAs are the product of the
acidogenesis step (Figure 2-1) and can therefore increase the rate of methanogenesis.
However, a high concentration of VFAs can cause a drop in pH, which can cause the
reactor to fail if there is not enough buffering capacity to maintain a fairly neutral pH to
allow the methanogens to function normally (Kerri, 1999).

23
There are other methods for pre-treatment, such as enzyme and ozonation, which appear
less frequently in literature and are not discussed. All treatment methods have a cost
associated with them; in order to make any of these methods economically feasible, the
increase in biogas production and solids reduction must make up for all of the capital and
operating costs for the treatment. Therefore, even though a treatment may have positive
impacts on AD, it may not be economically feasible in full-scale operation.
2.3 Significance of Current Research
A few key findings from the literature review should be highlighted. Firstly, all but two
of the aforementioned studies were based on BMP tests; of the other two, one used a 5L
bench-scale reactor (Elliott and Mahmood, 2012), and the other used a 2L bench-scale
reactor (Lin et al., 2011). Secondly, thermal pre-treatment has been shown to have the
greatest positive impact on AD. Finally, there is only one industrial full scale anaerobic
digester for pulp and paper mill biosludge in the world, and it uses thermal pre-treatment
in the process (Kepp et al., 2000). Therefore, there are significant knowledge gaps for
bench-scale AD of pulp and paper mill biosludge and the effect of thermal treatment in a
bench-scale system has not been studied.
This study was carried out to gain insight into the operation of a bench-scale anaerobic
digester. Moreover, different thermal treatment methods were examined to determine the
best way to utilize this thermal energy to improve the AD process.
24
3. Materials and Methods
This chapter describes all of the experimental procedures used through the course of this
study. The details regarding the bench-scale system and each piece of equipment
associated with the system are listed. The bench-scale system experimental set-up
protocol, as well as the information and operation of the thermal treatment reactor, are
described in detail. It is important to note that the protocol related to the bench-scale
system is probably not optimized, and further improvements in operating practices are
achievable.
Protocols for measurement of physical and chemical properties, such as COD, TS, VS,
are listed in this chapter as well. Finally, the procedures related to the BMP test set up are
described, and a summary of all of the bench-scale experiments that were done is shown.
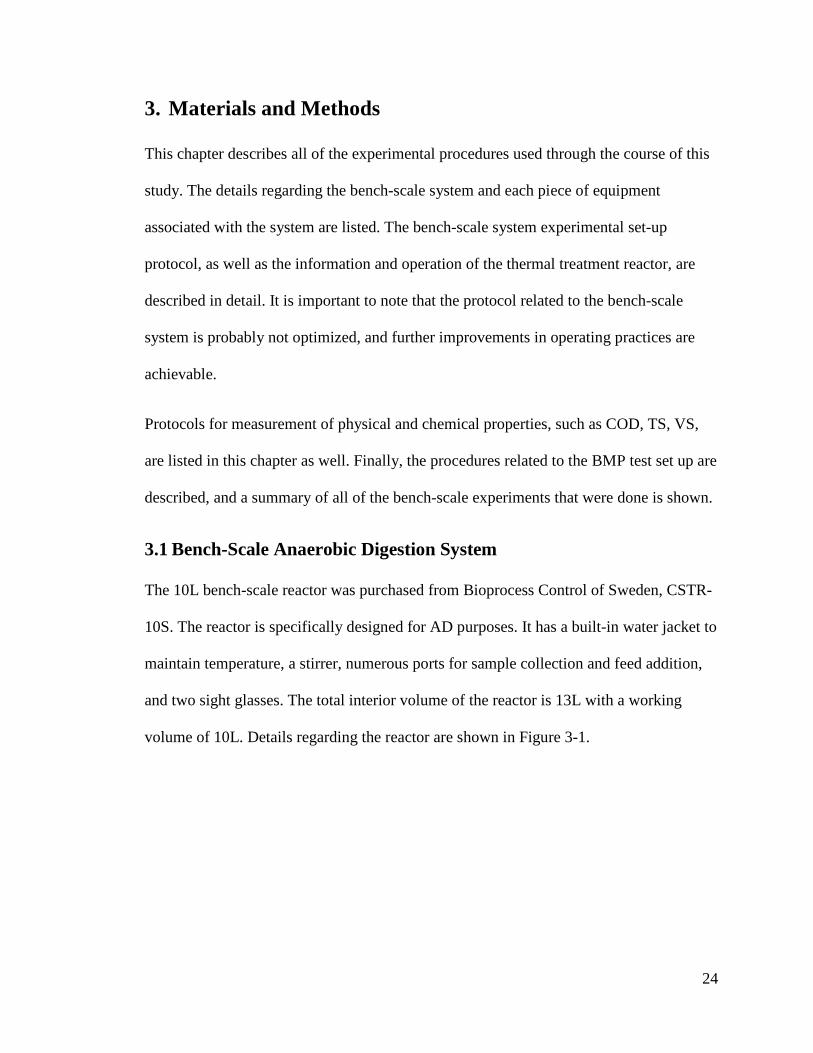
3.1 Bench-Scale Anaerobic Digestion System
The 10L bench-scale reactor was purchased from Bioprocess Control of Sweden, CSTR-
10S. The reactor is specifically designed for AD purposes. It has a built-in water jacket to
maintain temperature, a stirrer, numerous ports for sample collection and feed addition,
and two sight glasses. The total interior volume of the reactor is 13L with a working
volume of 10L. Details regarding the reactor are shown in Figure 3-1.

25
Figure 3-1 Bench-scale reactor and key parts
The stirrer is connected to a variable DC power supply to control the speed of the stirrer
from 10 rpm to about 200 rpm. The mixing speed was set to 50 rpm for all experiments;
it has been found that high mixing rates within anaerobic digesters can have detrimental
effects on biogas production (Kaparaju et al., 2008; Karim et al., 2005; Stroot et al.,
2001). High mixing rates can cause disturbances in the microbial community floc
structures that will break interactions between mutually beneficial bacteria (Elliott and
Mahmood, 2012).
Biogas production is measured by a wet tip gas meter designed and produced by Dr.
Richard Speece (Speece, 2015). Plastic tubing is connected from the gas outlet of the
reactor to the gas meter. The water level in the gas meter must be topped up from time-
to-time during operation, and periodic calibrations should be performed using a syringe.
A recirculating heating pump (Polyscience Model 1127) was used in a water bath to
26
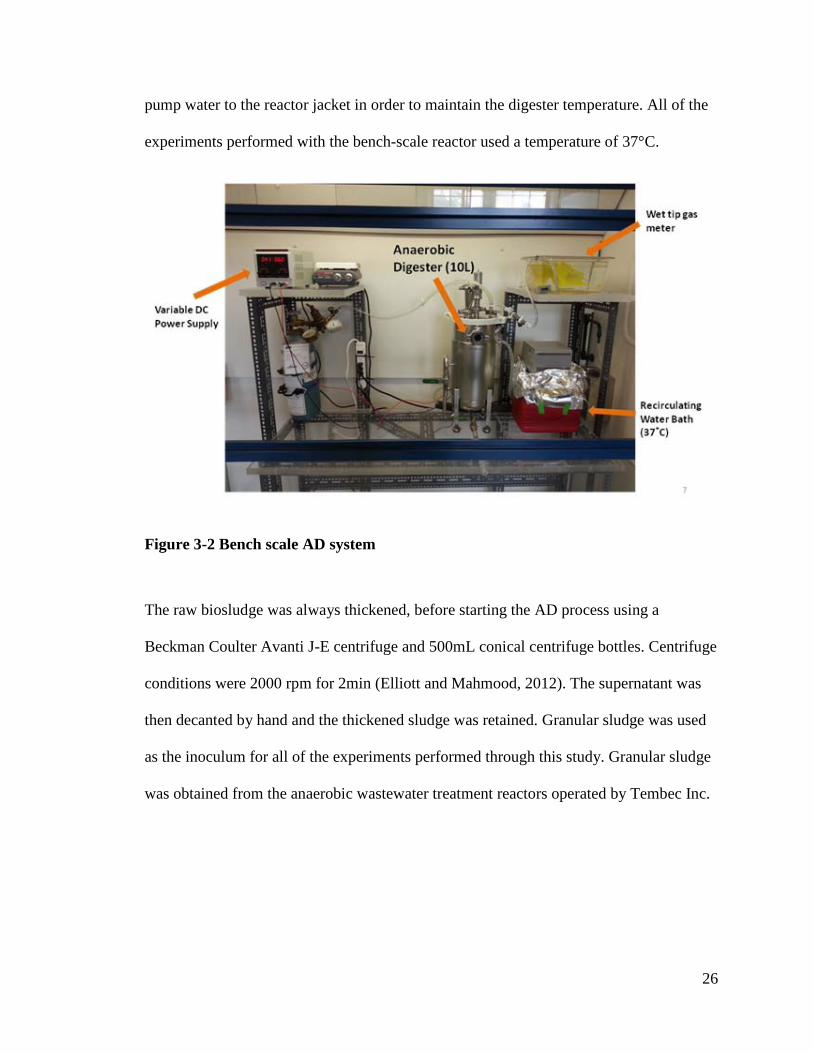
pump water to the reactor jacket in order to maintain the digester temperature. All of the
experiments performed with the bench-scale reactor used a temperature of 37°C.
Figure 3-2 Bench scale AD system
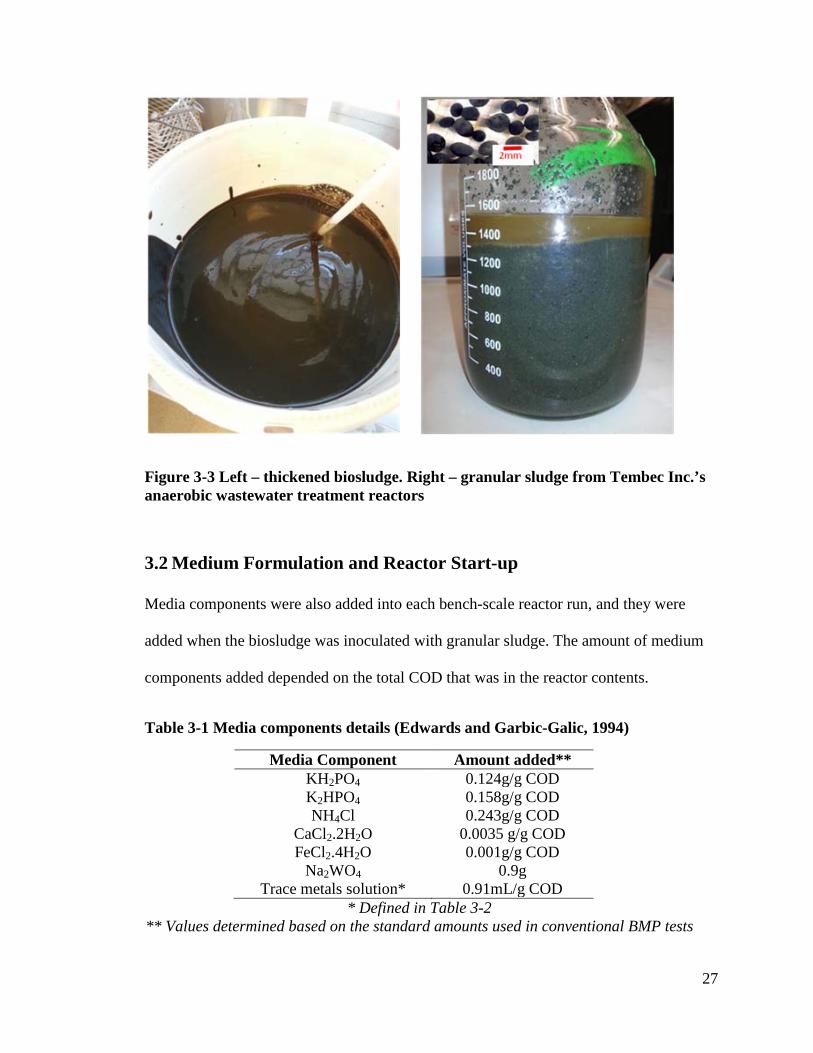
The raw biosludge was always thickened, before starting the AD process using a
Beckman Coulter Avanti J-E centrifuge and 500mL conical centrifuge bottles. Centrifuge
conditions were 2000 rpm for 2min (Elliott and Mahmood, 2012). The supernatant was
then decanted by hand and the thickened sludge was retained. Granular sludge was used
as the inoculum for all of the experiments performed through this study. Granular sludge
was obtained from the anaerobic wastewater treatment reactors operated by Tembec Inc.
27
Figure 3-3 Left – thickened biosludge. Right – granular sludge from Tembec Inc.’s anaerobic wastewater treatment reactors
3.2 Medium Formulation and Reactor Start-up
Media components were also added into each bench-scale reactor run, and they were
added when the biosludge was inoculated with granular sludge. The amount of medium
components added depended on the total COD that was in the reactor contents.
Table 3-1 Media components details (Edwards and Garbic-Galic, 1994)
Media Component Amount added** KH2PO4 0.124g/g COD K2HPO4 0.158g/g COD NH4Cl 0.243g/g COD
CaCl2.2H2O 0.0035 g/g COD FeCl2.4H2O 0.001g/g COD
Na2WO4 0.9g Trace metals solution* 0.91mL/g COD
* Defined in Table 3-2 ** Values determined based on the standard amounts used in conventional BMP tests

28
Table 3-2 Trace metal solution components (Edwards and Garbic-Galic, 1994)
Trace metal Concentration H3BO3 0.3 g\L ZnCl2 0.1 g\L
NiCl2.6H20 0.75 g\L MnCl2.4H20 1.0 g\L CuCl2.2H20 0.1 g\L CoCl2.6H20 1.5 g\L
Na2SeO3 0.02 g\L A12(SO4)3.16H20 0.1 g\L
H2SO4 1mL/L
All of the reactor contents, biosludge, inoculum, and medium components, were mixed
together in a pail to ensure that all of the medium components dissolved. A sample was
taken for analysis, before introducing the mixture into the bench scale reactor
Once the reactor was closed and the gas outlet was connected to the wet tip gas meter, the
headspace is flushed with purge mix (20% CO2, 80% N2) three times, through the gas
mixture inlet (see Figure 3-1), to ensure anaerobic conditions in the reactor. It was
important to keep the gas flow rate fairly low so that the wet tip gas meter could
accurately be used to measure the volume purged. Once three times the reactor headspace
volume had been purged, the gas cylinder was turned off and the wet tip gas meter was
reset to start the experiment.
3.3 Thermal Treatment of Biosludge
Thermal treatments were performed using a 500mL Parr reactor shown in Figure 3-4.
This reactor is constructed from stainless steel and designed to withstand high
temperature and pressure. High-temperature heating tape was used to heat the reactor and
it was controlled by a temperature controller made by Hanyoung Nu (producer).

29
Figure 3-4 500mL Parr reactor used for thermal treatment of biosludge / digestate. Left – disassembled reactor. Right – assembled reactor.
The material to be treated was poured directly into the reactor which was then capped;
two heavy-duty clamps held the cap in place, and a stainless steel sleeve covered the
body of the reactor. The cap was equipped with a tube that reached into the reactor body
for temperature measurement (refer to Figure 3-5).The heating tape was then wrapped
around the sleeve. Once the reactor was assembled, the heating tape could be turned on.
The treatment condition used throughout this study was 190°C with a hold time of 30min.

30
Figure 3-5 Thermal treatment reactor cap showing the tube for the temperature probe
After the thermal treatment was completed, a 10L pail was filled with ice and the reactor
removed from the sleeve and placed into the ice to cool down. This procedure must be
performed very carefully to avoid potential injury; the reactor is very hot and heavy; it is
also pressurized from the heating of the sludge;
3.4 Measurement of Physical and Chemical Properties
proper protective equipment must be
worn.
3.4.1 Chemical Oxygen Demand
The chemical oxygen demand (COD) is a measure of the amount of organic matter
within a sample. COD is the amount of oxygen needed to completely oxidize the sample
and it was measured using protocols based on the American Public Health Association
(APHA) Standard Methods for the Examination of Water and Wastewater (APHA, 1998).
31
The method is colourimetric, with the eventual formation of Cr3+, which absorbs light at
610nm. The digestion solution is made in 1L batches, each of which contains of 10.2g of
potassium dichromate (K2Cr2O7), 168mL of concentrated sulfuric acid (H2SO4) and
33.4g of mercuric sulfate (HgSO4); the HgSO4 prevents any chlorides from reacting with
the dichromate. A catalyst solution consisting of 10.185g of silver sulfate (Ag2SO4) in 1L
of sulfuric acid is also required.
Total COD of the sludge samples was measured by diluting samples 50-100 times since
the COD of the raw sludge is much higher than the calibrated range. Soluble COD
samples were obtained by filtering the sludge samples through a 0.45μm syringe filter,
and then diluting 10 times. Glass vials (10mL) were used to perform COD tests, with
each vial containing 2.5mL of sample, 1.5mL of digestion solution, and 3.5mL of catalyst
solution. Triplicates were performed for all samples and once all the reagents were added,
the vials were vortexed and then incubated at 150°C for 2 hours. Calibration curves were
performed for each new batch of reagent made. The standard chemical used was
potassium hydrogen phthalate (KHP), and the calibration concentrations covered the
range 0-1000mg/L. For samples with unknown COD, various dilutions may have to be
made in order to make sure that the COD concentration of the sample falls within the
calibrated range.
The incubator used was the Hach DRB 200, and the spectrometer used was the Hach DR
3900 at 610nm. The waste generated is stored in a designated waste container and
disposed of as chemical waste. The glass tubes are washed and reused.

32
3.4.2 Solids Analysis
Various types of solid analysis were carried out during this study; Total Solids (TS),
Volatile Solids (VS), Total Suspended Solids (TSS), and Volatile Suspended solids
(VSS). The protocols followed are based on the APHA Standard Methods for the
Examination of Water and Wastewater (APHA, 1998).
For TS and VS, aluminum dishes were first weighed, and then a known volume of
sample was added to each dish. For TSS and VSS, aluminum dishes with a 47mm
Whatman™ 934-AH™ filter were weighed, the filter was placed onto a vacuum filtration
system, and a known volume of sample was added and filtered. After the samples were
prepared, they were dried overnight at 105°C in a Fisher Isotemp ® Oven. The dried
samples were then weighed to calculate the TS or TSS of the samples. For VS and VSS,
the samples were placed into a Lindberg furnace at 550°C for 30min, and then cooled
and weighed.
𝑻𝑺 𝒂𝒏𝒅 𝑻𝑺𝑺 = (𝒘𝒆𝒊𝒈𝒉𝒕 𝒐𝒇 𝒅𝒓𝒊𝒆𝒅 𝒔𝒂𝒎𝒑𝒍𝒆 𝒂𝒕 𝟏𝟎𝟓°𝑪)−(𝒘𝒆𝒊𝒈𝒉𝒕 𝒐𝒇 𝒅𝒊𝒔𝒉)𝒗𝒐𝒍𝒖𝒎𝒆 𝒐𝒇 𝒔𝒂𝒎𝒑𝒍𝒆
(1)
𝑽𝑺 𝒂𝒏𝒅 𝑽𝑺𝑺 = (𝒘𝒆𝒊𝒈𝒉𝒕 𝒐𝒇 𝒅𝒓𝒊𝒆𝒅 𝒔𝒂𝒎𝒑𝒍𝒆 𝒂𝒕 𝟏𝟎𝟓°𝑪)−(𝒘𝒆𝒊𝒈𝒉𝒕 𝒐𝒇 𝒊𝒏𝒄𝒊𝒏𝒆𝒓𝒂𝒕𝒆𝒅 𝒔𝒂𝒎𝒑𝒍𝒆 𝒂𝒕 𝟓𝟓𝟎°𝑪)𝒗𝒐𝒍𝒖𝒎𝒆 𝒐𝒇 𝒔𝒂𝒎𝒑𝒍𝒆
(2)
For TSS and VSS, the viscosity and solids content of the sample may cause difficulties
during filtration. Some samples take an extremely long time to filter or simply do not
filter at all. In such cases, the samples were diluted before filtration.
33
3.4.3 Biogas Composition
The biogas composition was measured using a thermal conductivity detector (TCD) on a
Hewlett Packard 5890 gas chromatograph (GC). Methane and carbon dioxide standards
were made to calibrate the GC, and 200μL samples were injected into the GC for each
measurement. The method AD_TCD is used on the GC, and the resulting area
underneath each of the peaks is integrated automatically by the computer program.
Calibration curves were made by plotting the areas versus the known concentration and
used to determine the composition of the biogas samples.
3.5 Biochemical Methane Potential Tests (BMP Tests)
The BMP tests method is based on the article published by Angelidaki et al. (2009). The
BMP tests were conducted using 160mL serum bottles. All BMP tests had a total liquid
volume of 80mL. The serum bottles were first washed in a 10% nitric acid bath for a
minimum of 24 hours to destroy any residual organics present in the bottles.
The COD, TS, VS, TSS, and VSS of the substrate and inoculum were determined, and
the g CODsubstrate / g VSSinoculum ratio was decided. A sample preparation table was made
outlining the volumes of each of the materials to be added to each bottle. Each condition
was always performed in triplicate. A synthetic feed (positive control) was made by
adding 830mg glucose, 800mg sodium acetate, 280g sodium propionate, and 0.8mL of 95%
ethanol into 100mL of deionized water. Negative controls were also performed on all of
the substrates and inocula. All of the substrates and inoculum were transferred into serum
bottles and purged to ensure that they were anaerobic. Anaerobic medium and water was
prepared 2 days prior to the BMP test set-up day, to make sure that they were completely
anaerobic.
34
A glove bag was used to perform the BMP test set up. All of the materials required were
transferred into the glove bag (i.e. pipettes, septum, bottles, etc.), which were then sealed
and connected to a N2 gas cylinder and an 80% N2, 20% CO2 (purge mix) gas cylinder.
An outlet line was connected to a gas pump. The glove bag was filled and purged four
times with N2 and twice with purge mix. The gas was held in the glove bag for 15min for
each fill / purge cycle.
In this study, two types of BMP set-ups were used and will be referred to as conventional
and unconventional BMP tests. For conventional BMP tests, 110mg of COD was added
from the substrate and the gCODsubstrate / gVSSinoculum ratio was set at 1.6. Anaerobic
medium as defined previously was also added to provide buffer and trace nutrients to
each of the bottles, and this also diluted all of the contents within the bottles. The total
volume of each bottle was made up to 80mL.
For unconventional BMP tests, the contents were similar to the bench-scale reactor and
no dilution was done. These tests were used to see if there was a significant difference
between the bench-scale reactor and small scale bottles, when the contents are similar in
nature. All BMP bottles were stored in an incubator at 37°C.
The biogas production in each bottle was measured using a 20mL glass syringe and 21
gauge stainless steel needles. The measured biogas was purged after each measurement
and not re-injected back into the bottles. To maintain the precision of the gas volume
measurements as gas production declined, the frequency of measurements decreased with
time.

35
3.6 Experimental Design
Since the bench-scale reactor was brand new, the first objective was to learn how to
operate the reactor. An initial experiment was carried out to see what were the potential
challenges and difficulties with operating this reactor. Thermal treatment became the
treatment of choice as a result of previous studies conducted by Nicolas Wood and Lei
Chen within the department of Chemical Engineering and Applied Chemistry at the
University of Toronto. The main challenge with the bench-scale reactor is that only one
condition may be run at one time; therefore, BMP tests were set up to complement the
bench-scale reactor results, which were used to test various thermal treatment conditions
as well as microbial acclimation through the AD process. Three different thermal
treatment conditions were tested with the bench-scale reactor: pre-treatment of biosludge,
intermediate treatment of digestate, and post-treatment of digestate. Baseline runs (no
thermal treatment) were also conducted to establish a control for comparison.
Unconventional BMP tests were set up as smaller versions of the bench-scale reactor and
mimicked the reactor contents found in the bench-scale reactor. These BMP tests were
performed for two reasons. Firstly, it is important to determine whether the biogas
production from the smaller scale bottles is scalable when compared with the bench-scale
reactor. Secondly, these BMP tests allowed for replicates and controls to be performed.
Since this study focused on using a newly built system, more expertise was accumulated
in the latter parts of the study; accordingly, the experiments performed during the early
stages of the study also involved troubleshooting the system. The following table shows
all of the experiments that were performed in the bench-scale reactor.

36
Table 3-3 List of all bench-scale reactor runs
Run Starting Date Condition Substrate / Inoculum
Ratio Notes
1 Mar 6th, 2014 Baseline 1.6
Gas meter malfunction caused incomplete
data collection (data not shown in results)
2 Jun 11th, 2014 Baseline 4.9
3 Jul 24th, 2014 Intermediate Thermal Treatment of digestate 3.7
4 Oct 6th, 2014 Pre-thermal treatment of biosludge 3.7
5 Nov 20th, 2014 Baseline 3.7
6 Jan 27th, 2015 Intermediate Thermal Treatment of digestate 3.7
7 Mar 11th, 2015
Baseline + Post-thermal treatment of
digestate in BMP bottles
8.9
Very low inoculum compared to conventional
experiments, digestate used for post-thermal treatment experiments
in unconventional BMP tests
37
4. Bench-Scale Reactor Set-Up and Troubleshooting
Objective 1 of this study was to set up the bench-scale system and gain insight into the
operation of the system. This chapter describes the details related to the bench-scale
system and procedures related to sample collection. This chapter discusses the various
challenges encountered with this system and their solutions.
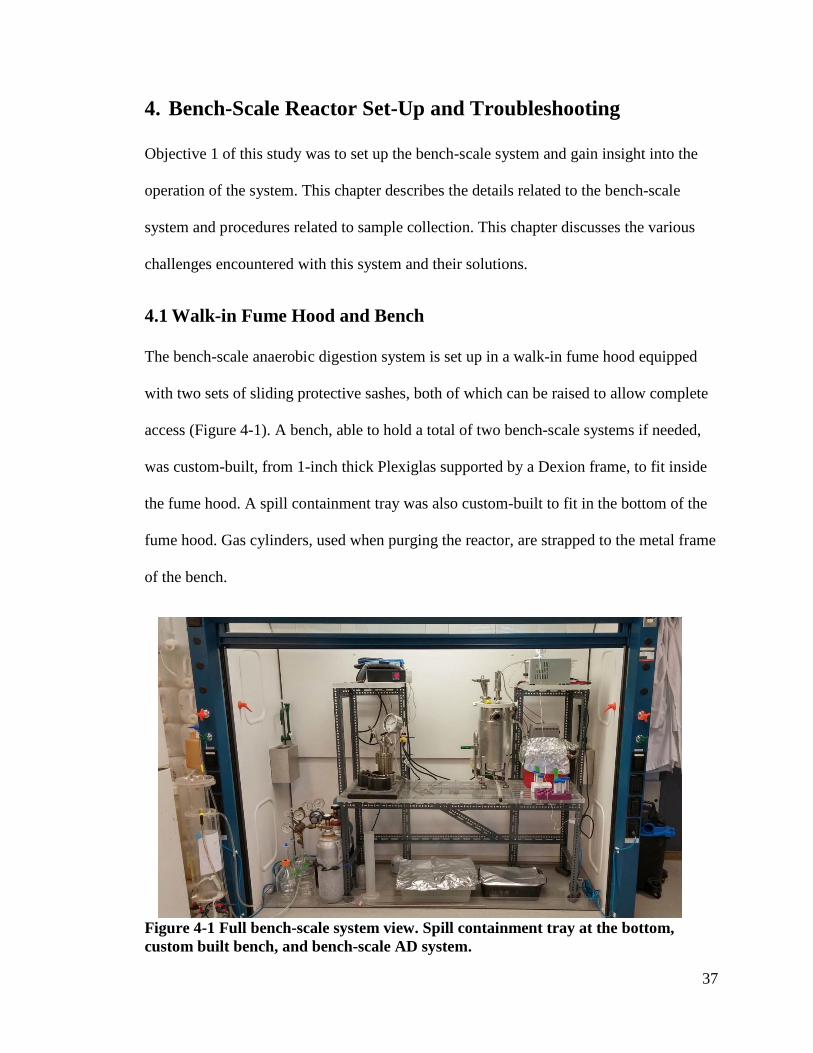
4.1 Walk-in Fume Hood and Bench
The bench-scale anaerobic digestion system is set up in a walk-in fume hood equipped
with two sets of sliding protective sashes, both of which can be raised to allow complete
access (Figure 4-1). A bench, able to hold a total of two bench-scale systems if needed,
was custom-built, from 1-inch thick Plexiglas supported by a Dexion frame, to fit inside
the fume hood. A spill containment tray was also custom-built to fit in the bottom of the
fume hood. Gas cylinders, used when purging the reactor, are strapped to the metal frame
of the bench.
Figure 4-1 Full bench-scale system view. Spill containment tray at the bottom, custom built bench, and bench-scale AD system.

38
4.2 Bench Scale Reactor Troubleshooting
After the bench-scale system was set up, a preliminary experiment was performed to
learn how to operate the system as well as to find and correct any issues that arose.
4.2.1 Biogas Production Measurements
Initially, a Challenge Environmental Systems, Inc. (CES) bubble flow meter (FLO-200)
was used for the biogas production measurements from the reactor. The bubble
flowmeter works by directing the gas to go through a specifically designed “V” shaped
oil-filled channel, where only bubbles of the same volume will be created. The machine
is able to count the number of bubbles that go through the channel. Therefore, the
flowmeter can be calibrated and the volume of each bubble may be determined. Once the
bubble volume is known, then the flowmeter outputs the number of bubbles that have
gone through the channel, thus providing the gas production rate.
Figure 4-2 CES Bubble flowmeter (FLO-200)

39
Although the theory behind the bubble flowmeter is sound, it did not seem to work well
for this reactor. The rate of biogas production from the reactor was perhaps too low for
the bubble flow meter, and the bubbles were coming out in bursts. As a result, it was not
able to accurately read the number of bubbles; this caused the measured biogas
production to be significantly different from the actual production.
A wet tip gas meter was purchased from Dr. Richard Speece (www.wettipgasmeter.com)
and installed to replace the bubble flowmeter. The wet tip gas meter has a tipper inside
and is filled with water. The biogas is directed by a tube which goes underneath the
tipper, and the outlet gas is trapped under the tipper providing buoyancy (Figure 4-3).
Once 100mL of gas is produced, the buoyancy causes the tipper to tip, and a magnet
closes a circuit which in turn increases the counter by 1. Therefore, each tip is equivalent
to 100mL of biogas produced. The wet tip gas meter was calibrated and functions
reliably.
Figure 4-3 Wet tip gas meter components
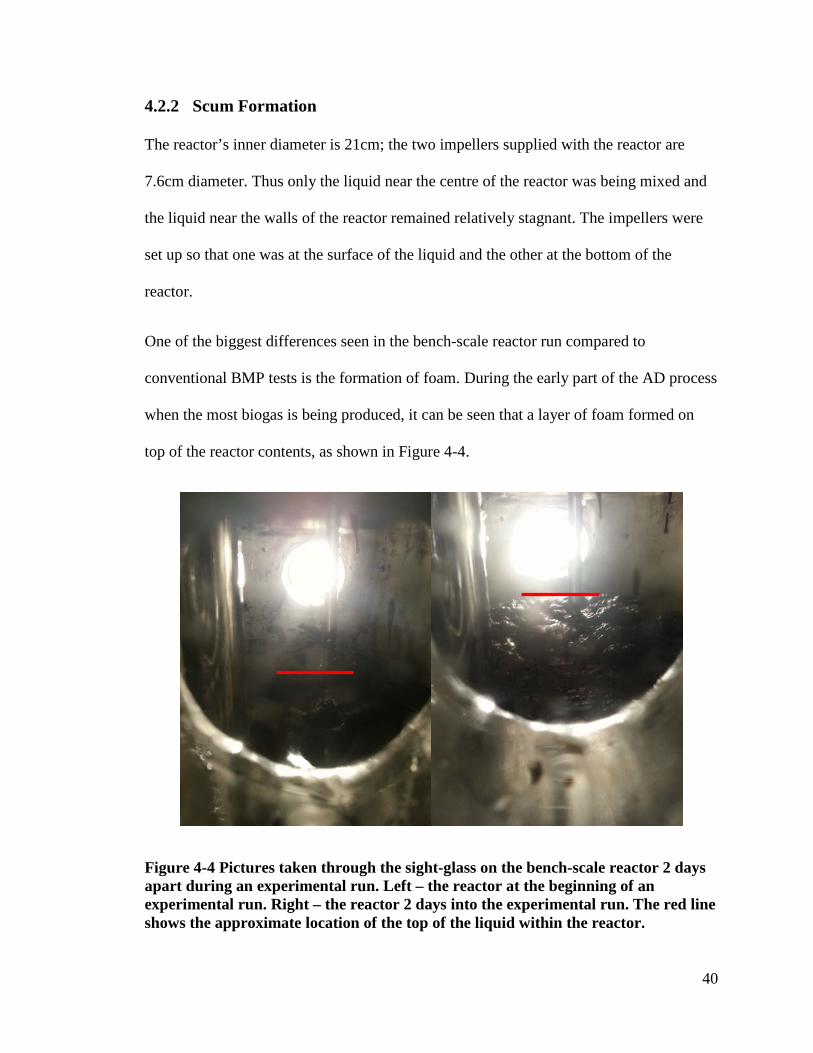
40
4.2.2 Scum Formation
The reactor’s inner diameter is 21cm; the two impellers supplied with the reactor are
7.6cm diameter. Thus only the liquid near the centre of the reactor was being mixed and
the liquid near the walls of the reactor remained relatively stagnant. The impellers were
set up so that one was at the surface of the liquid and the other at the bottom of the
reactor.
One of the biggest differences seen in the bench-scale reactor run compared to
conventional BMP tests is the formation of foam. During the early part of the AD process
when the most biogas is being produced, it can be seen that a layer of foam formed on
top of the reactor contents, as shown in Figure 4-4.
Figure 4-4 Pictures taken through the sight-glass on the bench-scale reactor 2 days apart during an experimental run. Left – the reactor at the beginning of an experimental run. Right – the reactor 2 days into the experimental run. The red line shows the approximate location of the top of the liquid within the reactor.
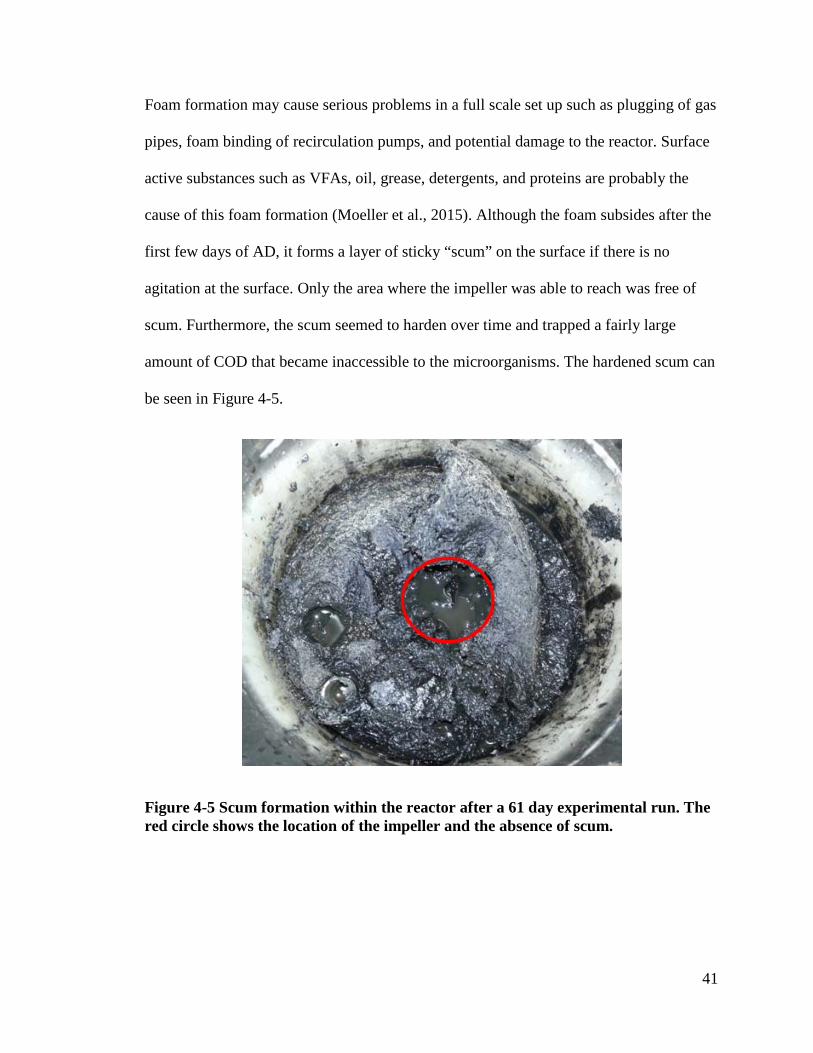
41
Foam formation may cause serious problems in a full scale set up such as plugging of gas
pipes, foam binding of recirculation pumps, and potential damage to the reactor. Surface
active substances such as VFAs, oil, grease, detergents, and proteins are probably the
cause of this foam formation (Moeller et al., 2015). Although the foam subsides after the
first few days of AD, it forms a layer of sticky “scum” on the surface if there is no
agitation at the surface. Only the area where the impeller was able to reach was free of
scum. Furthermore, the scum seemed to harden over time and trapped a fairly large
amount of COD that became inaccessible to the microorganisms. The hardened scum can
be seen in Figure 4-5.
Figure 4-5 Scum formation within the reactor after a 61 day experimental run. The red circle shows the location of the impeller and the absence of scum.

42
A larger impeller (15cm diameter) was purchased and installed near the surface of the
reactor contents (see Figure 4-6). This impeller worked very well as a scum breaker, and
the formation of the scum became almost non-existent.
Figure 4-6 Larger 6” diameter impeller used at the surface of the reactor contents
4.2.3 Reactor Sampling
Sampling is one of the main challenges with AD experiments; it is very difficult to obtain
a representative sample from the reactor. Since there are solids in the reactor contents,
they tend to settle near the bottle of the reactor, and it is unlikely that the 50rpm stirring
speed will homogenise the reactor contents. Typical sampling techniques such as
pipetting can only sample at a certain height within the reactor; therefore, a tube sampler
was developed in an attempt to obtain a vertical cross section of the reactor representative
of the entire depth of the reactor. The tube was inserted through the feed port opening on
the reactor until it reached the bottom, and then the string is pulled to close the plug at the
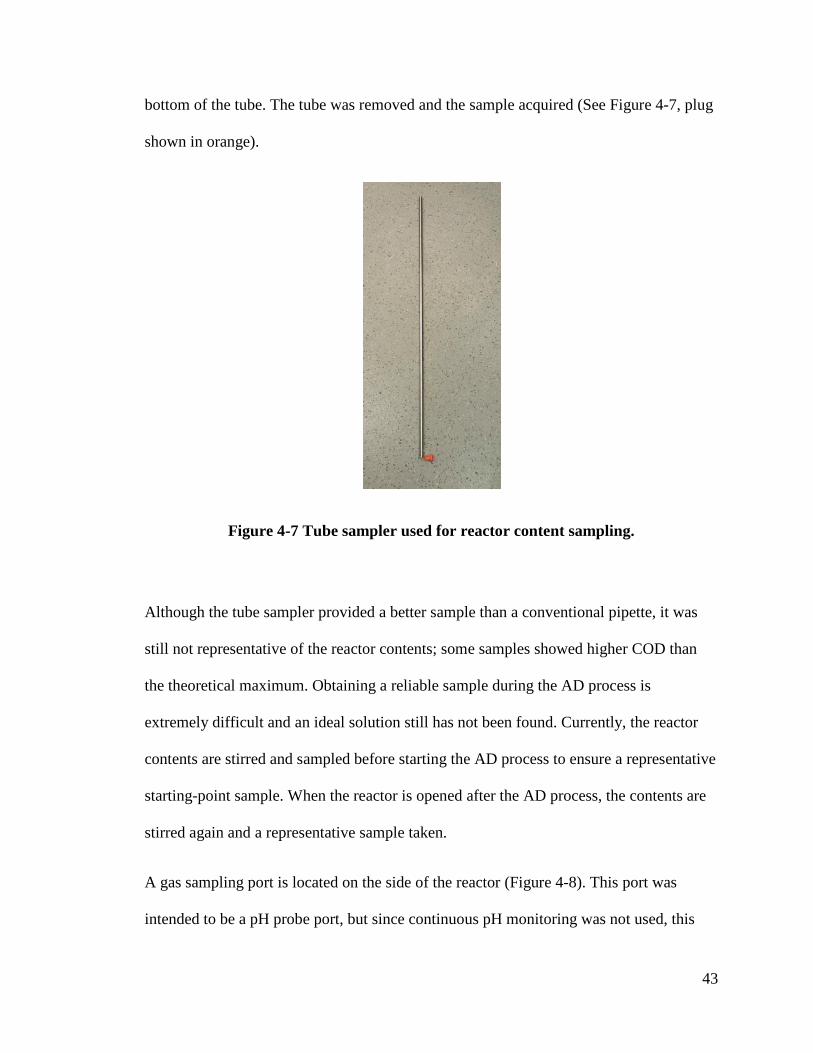
43
bottom of the tube. The tube was removed and the sample acquired (See Figure 4-7, plug
shown in orange).
Figure 4-7 Tube sampler used for reactor content sampling.
Although the tube sampler provided a better sample than a conventional pipette, it was
still not representative of the reactor contents; some samples showed higher COD than
the theoretical maximum. Obtaining a reliable sample during the AD process is
extremely difficult and an ideal solution still has not been found. Currently, the reactor
contents are stirred and sampled before starting the AD process to ensure a representative
starting-point sample. When the reactor is opened after the AD process, the contents are
stirred again and a representative sample taken.
A gas sampling port is located on the side of the reactor (Figure 4-8). This port was
intended to be a pH probe port, but since continuous pH monitoring was not used, this

44
port was fitted with a septum and converted to a gas sampling port; samples were
withdrawn using a hypodermic syringe.
Figure 4-8 Gas sampling port on the bench-scale reactor
4.3 Summary of Bench-Scale Reactor Set-up
The bench-scale reactor was successfully set-up along with all the necessary accessory
equipment. The AD system was fully functioning and various challenges were resolved.
Although there was still foam formation during the early stages of each experiment, the
hard layer of scum did not remain after the installation of the larger impeller. Further
modifications may be needed to run the system continuously. Liquid sampling during
experimental runs is still an issue with the system and there may simply not be an ideal
solution.
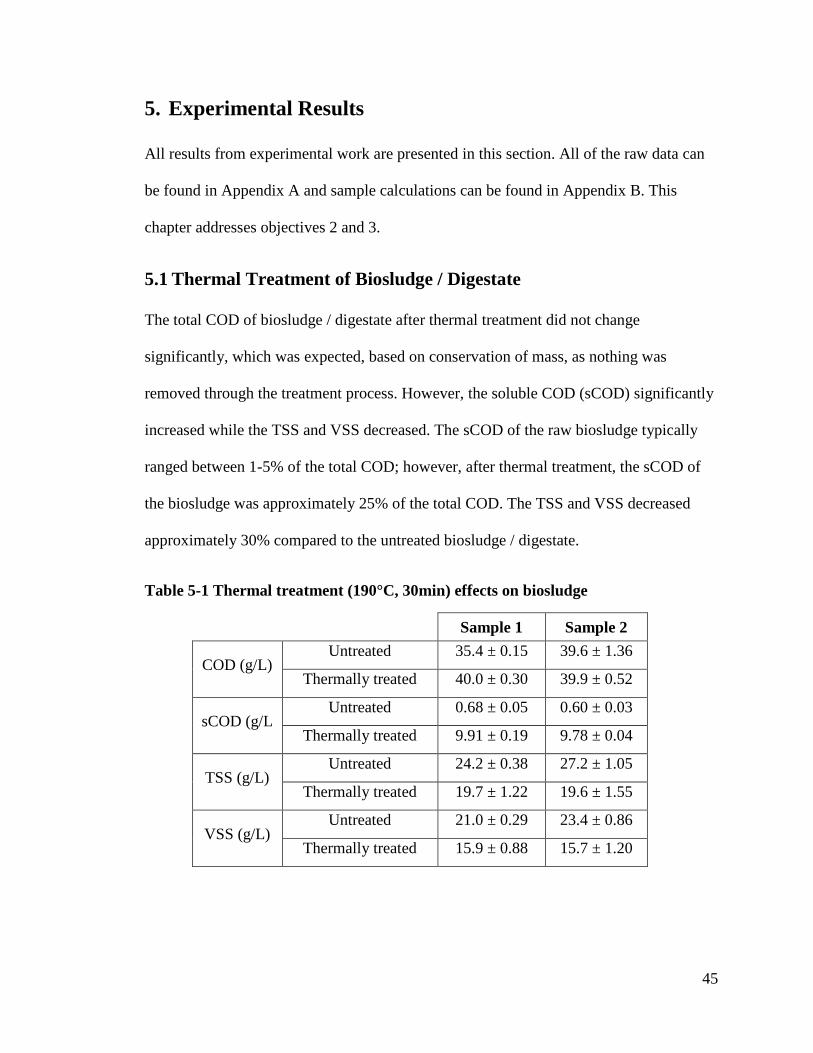
45
5. Experimental Results
All results from experimental work are presented in this section. All of the raw data can
be found in Appendix A and sample calculations can be found in Appendix B. This
chapter addresses objectives 2 and 3.
5.1 Thermal Treatment of Biosludge / Digestate
The total COD of biosludge / digestate after thermal treatment did not change
significantly, which was expected, based on conservation of mass, as nothing was
removed through the treatment process. However, the soluble COD (sCOD) significantly
increased while the TSS and VSS decreased. The sCOD of the raw biosludge typically
ranged between 1-5% of the total COD; however, after thermal treatment, the sCOD of
the biosludge was approximately 25% of the total COD. The TSS and VSS decreased
approximately 30% compared to the untreated biosludge / digestate.
Table 5-1 Thermal treatment (190°C, 30min) effects on biosludge
Sample 1 Sample 2
COD (g/L) Untreated 35.4 ± 0.15 39.6 ± 1.36
Thermally treated 40.0 ± 0.30 39.9 ± 0.52
sCOD (g/L Untreated 0.68 ± 0.05 0.60 ± 0.03
Thermally treated 9.91 ± 0.19 9.78 ± 0.04
TSS (g/L) Untreated 24.2 ± 0.38 27.2 ± 1.05
Thermally treated 19.7 ± 1.22 19.6 ± 1.55
VSS (g/L) Untreated 21.0 ± 0.29 23.4 ± 0.86
Thermally treated 15.9 ± 0.88 15.7 ± 1.20
46
The increase in sCOD and decrease in TSS and VSS were expected as the thermal
treatment solubilizes the solids. The physical appearance of the sludge was also
noticeably different after thermal treatment, as it was much more fluid. The consistency
of the thickened biosludge was similar to that of pudding, whereas the treated sludge was
very close to that of water.
5.2 Bench-Scale Reactor Runs with Biosludge
A total of seven runs were completed with the bench-scale reactor during this study.
They consisted of 4 baseline runs, 1 thermal pre-treatment run, and 2 intermediate
thermal treatment runs. The g CODsubstrate / g VSSinoculum ratio, or substrate to inoculum
ratio, in these reactor runs varied between 3.7 – 8.9, which is much higher than the ratio
of 1.6 used in most BMP tests. A higher ratio means that there is more substrate for every
gram of inoculum. The theoretical methane yield from 1 gram of COD is 350mL at STP,
which means that it will be 382mL at 25°C and 1atm (Angenent and Dague, 1996);
however, since the biogas volume was measured, and the composition of the biogas was
determined to be approximately 60% CH4 and 40% CO2 (refer to Appendix A, Table
A-25), the theoretical biogas yield is 637mL / g COD, obtained by dividing 0.6 into
382mL/g COD. All of the biogas production graphs presented in this section have
specific biogas yield (mL/g COD) on the y-axis; biogas production was normalized to the
total amount of COD in the reactor. The x-axis is time in days. It is also important to note
that each run used a different shipment of biosludge. The biosludge produced at an
industrial pulp and paper mill is variable from day-to-day, because of feedstock
composition and type of products being produced; therefore, there may be inherent
differences in the biosludge that may impact the AD process. The differences between
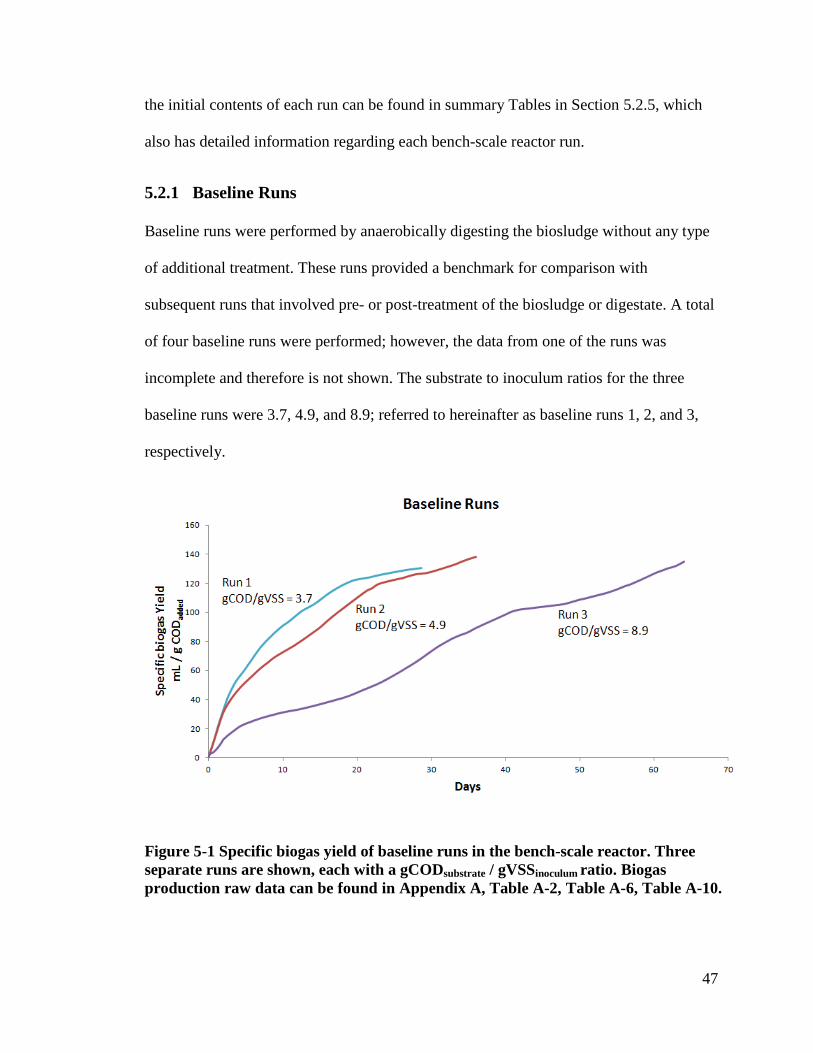
47
the initial contents of each run can be found in summary Tables in Section 5.2.5, which
also has detailed information regarding each bench-scale reactor run.
5.2.1 Baseline Runs
Baseline runs were performed by anaerobically digesting the biosludge without any type
of additional treatment. These runs provided a benchmark for comparison with
subsequent runs that involved pre- or post-treatment of the biosludge or digestate. A total
of four baseline runs were performed; however, the data from one of the runs was
incomplete and therefore is not shown. The substrate to inoculum ratios for the three
baseline runs were 3.7, 4.9, and 8.9; referred to hereinafter as baseline runs 1, 2, and 3,
respectively.
Figure 5-1 Specific biogas yield of baseline runs in the bench-scale reactor. Three separate runs are shown, each with a gCODsubstrate / gVSSinoculum ratio. Biogas production raw data can be found in Appendix A, Table A-2, Table A-6, Table A-10.
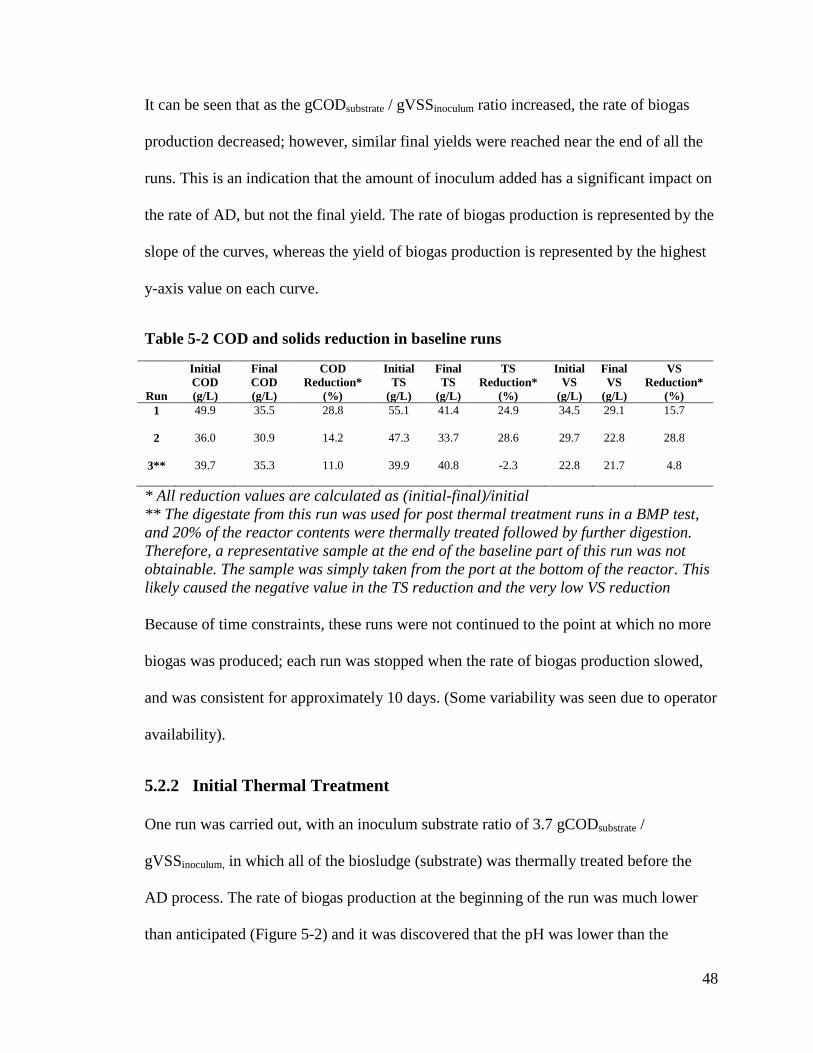
48
It can be seen that as the gCODsubstrate / gVSSinoculum ratio increased, the rate of biogas
production decreased; however, similar final yields were reached near the end of all the
runs. This is an indication that the amount of inoculum added has a significant impact on
the rate of AD, but not the final yield. The rate of biogas production is represented by the
slope of the curves, whereas the yield of biogas production is represented by the highest
y-axis value on each curve.
Table 5-2 COD and solids reduction in baseline runs
Run
Initial COD (g/L)
Final COD (g/L)
COD Reduction*
(%)
Initial TS
(g/L)
Final TS
(g/L)
TS Reduction*
(%)
Initial VS
(g/L)
Final VS
(g/L)
VS Reduction*
(%) 1 49.9 35.5 28.8 55.1 41.4 24.9 34.5 29.1 15.7
2 36.0 30.9 14.2 47.3 33.7 28.6 29.7 22.8 28.8
3** 39.7 35.3 11.0 39.9 40.8 -2.3 22.8 21.7 4.8
* All reduction values are calculated as (initial-final)/initial ** The digestate from this run was used for post thermal treatment runs in a BMP test, and 20% of the reactor contents were thermally treated followed by further digestion. Therefore, a representative sample at the end of the baseline part of this run was not obtainable. The sample was simply taken from the port at the bottom of the reactor. This likely caused the negative value in the TS reduction and the very low VS reduction
Because of time constraints, these runs were not continued to the point at which no more
biogas was produced; each run was stopped when the rate of biogas production slowed,
and was consistent for approximately 10 days. (Some variability was seen due to operator
availability).
5.2.2 Initial Thermal Treatment
One run was carried out, with an inoculum substrate ratio of 3.7 gCODsubstrate /
gVSSinoculum, in which all of the biosludge (substrate) was thermally treated before the
AD process. The rate of biogas production at the beginning of the run was much lower
than anticipated (Figure 5-2) and it was discovered that the pH was lower than the
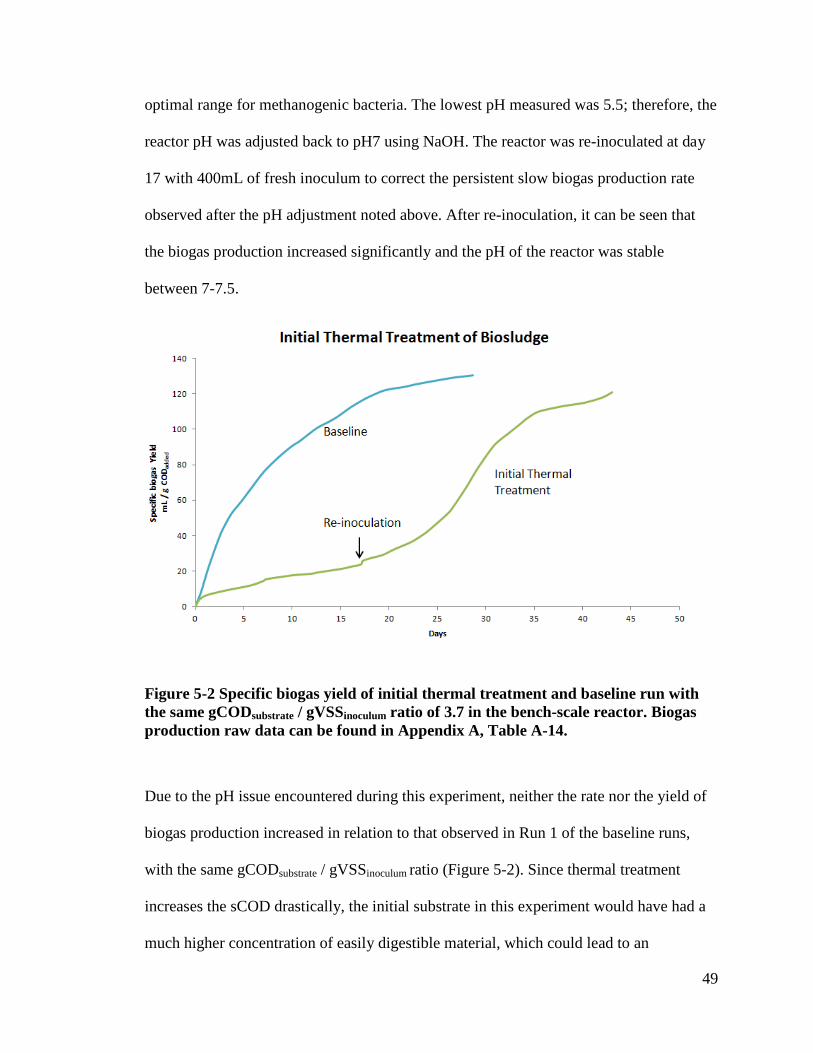
49
optimal range for methanogenic bacteria. The lowest pH measured was 5.5; therefore, the
reactor pH was adjusted back to pH7 using NaOH. The reactor was re-inoculated at day
17 with 400mL of fresh inoculum to correct the persistent slow biogas production rate
observed after the pH adjustment noted above. After re-inoculation, it can be seen that
the biogas production increased significantly and the pH of the reactor was stable
between 7-7.5.
Figure 5-2 Specific biogas yield of initial thermal treatment and baseline run with the same gCODsubstrate / gVSSinoculum ratio of 3.7 in the bench-scale reactor. Biogas production raw data can be found in Appendix A, Table A-14.
Due to the pH issue encountered during this experiment, neither the rate nor the yield of
biogas production increased in relation to that observed in Run 1 of the baseline runs,
with the same gCODsubstrate / gVSSinoculum ratio (Figure 5-2). Since thermal treatment
increases the sCOD drastically, the initial substrate in this experiment would have had a
much higher concentration of easily digestible material, which could lead to an
50
accumulation of volatile fatty acids (VFA). If the methanogens were not able to degrade
the VFAs fast enough, then the VFAs would have accumulated and caused a drop in the
pH of the reactor. This mechanism is believed to have been the cause of the pH issue
seen in this experiment.
5.2.3 Intermediate Thermal Treatment
Intermediate thermal treatment means that the biosludge was not thermally treated
initially, and the AD process was started as a baseline run. Thermal treatments of 20% of
the reactor volume were performed throughout the run at different times. As can be seen
from the baseline run data (Figure 5-1), the biogas production is not a linear relationship;
the biogas production rate generally decreases with time. Therefore, the purpose of
intermediate thermal treatment was to thermally treat a portion of the digestate when the
biogas production started to slow down. A total of 2 intermediate thermal treatment runs
were carried out where each run had 4 treatments, each time treating 20% of the reactor
volume.
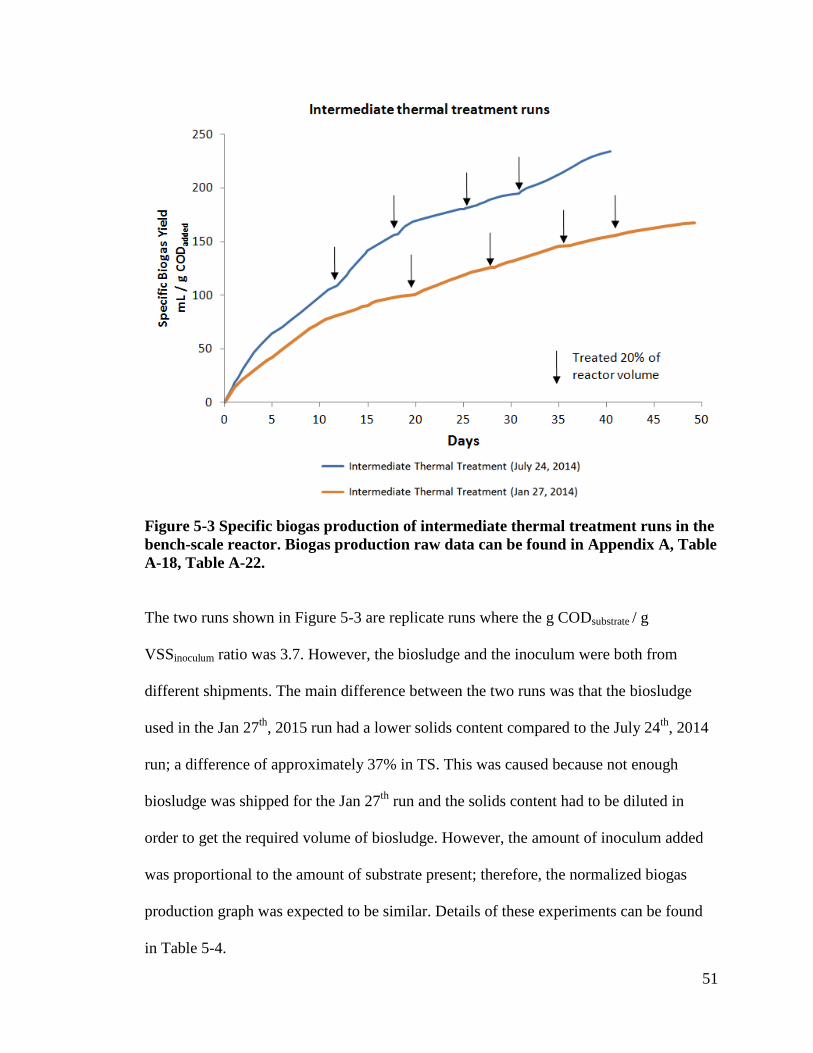
51
Figure 5-3 Specific biogas production of intermediate thermal treatment runs in the bench-scale reactor. Biogas production raw data can be found in Appendix A, Table A-18, Table A-22. The two runs shown in Figure 5-3 are replicate runs where the g CODsubstrate / g
VSSinoculum ratio was 3.7. However, the biosludge and the inoculum were both from
different shipments. The main difference between the two runs was that the biosludge
used in the Jan 27th, 2015 run had a lower solids content compared to the July 24th, 2014
run; a difference of approximately 37% in TS. This was caused because not enough
biosludge was shipped for the Jan 27th run and the solids content had to be diluted in
order to get the required volume of biosludge. However, the amount of inoculum added
was proportional to the amount of substrate present; therefore, the normalized biogas
production graph was expected to be similar. Details of these experiments can be found
in Table 5-4.

52
The soluble COD was monitored closely in the Jan 27th, 2015 run. Samples were taken
from the reactor throughout the run as well as right before and after performing
intermediate thermal treatment.
Figure 5-4 Biogas production rate and sCOD for the intermediate thermal treatment run that was started on Jan 27th, 2015
As expected, each time a thermal treatment was performed, the sCOD concentration
increased significantly. It can also be seen that the biogas production rate rose after each
thermal treatment. The decrease in sCOD between each thermal treatment roughly
correlates with the amount of biogas produced during that time; this is an indication that
the biogas produced comes mainly from the digestion of soluble organics. An interesting
result is that the sCOD concentration does not appear to return to the same value after
each thermal treatment, and there seems to be a steady accumulation of un-digestible
sCOD.
53
5.2.4 Post Digestion Thermal Treatment Followed by Further Digestion
One of the major challenges with this study was the lack of replication and controls in the
bench-scale reactor. The experimental design of this post thermal treatment experiment
was different from the other runs; it was decided that BMP bottles would be used for the
post thermal treatment portion of this experiment in order to gain some insight into the
effect of scale on AD, as well as having replicates and controls. Since treating all of the
digestate would mean that there would be no more microorganisms left to perform
further AD, it was decided that 80% of the digestate would be treated, with 20% left to
act as the inoculum.
Three sets of BMP bottles were set up (a total of 9 bottles). One set contained untreated
digestate as the control and extension of the baseline run. Another set contained an 80:20
mixture of treated to untreated digestate, in order to simulate a post thermal treatment
process. An 80:20 mixture was used because it is not possible to post-treat 100% of the
digestate without re-inoculation. The last set of BMP bottles contained a 20:80 mixture of
treated to untreated digestate, and 20% of the rest of the bench scale reactor volume was
also thermally treated and re-injected into the reactor for further digestion. Therefore, the
last set of BMP tests had the same conditions as the bench-scale reactor, to provide
insight into how reactor size may affect AD.
Figure 5-5 shows that an increase in biogas yield is seen for both the 80:20 and the 20:80
mixtures compared with the untreated control. It also can be seen that the 80:20 mixture’s
biogas production was lower than the other runs at the beginning and then increased
drastically around day 17. This make sense because the 80:20 mixture contains the least
amount of active microorganisms, but it had the greatest amount of easily digestible COD;
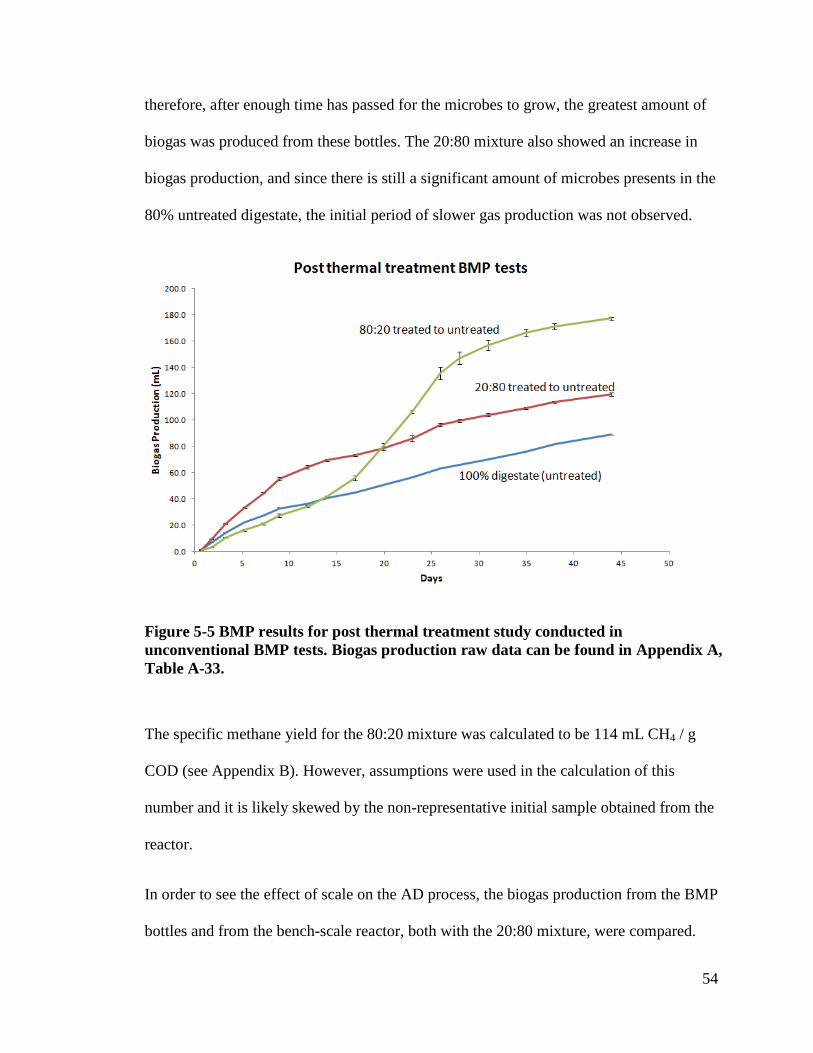
54
therefore, after enough time has passed for the microbes to grow, the greatest amount of
biogas was produced from these bottles. The 20:80 mixture also showed an increase in
biogas production, and since there is still a significant amount of microbes presents in the
80% untreated digestate, the initial period of slower gas production was not observed.
Figure 5-5 BMP results for post thermal treatment study conducted in unconventional BMP tests. Biogas production raw data can be found in Appendix A, Table A-33.
The specific methane yield for the 80:20 mixture was calculated to be 114 mL CH4 / g
COD (see Appendix B). However, assumptions were used in the calculation of this
number and it is likely skewed by the non-representative initial sample obtained from the
reactor.
In order to see the effect of scale on the AD process, the biogas production from the BMP
bottles and from the bench-scale reactor, both with the 20:80 mixture, were compared.
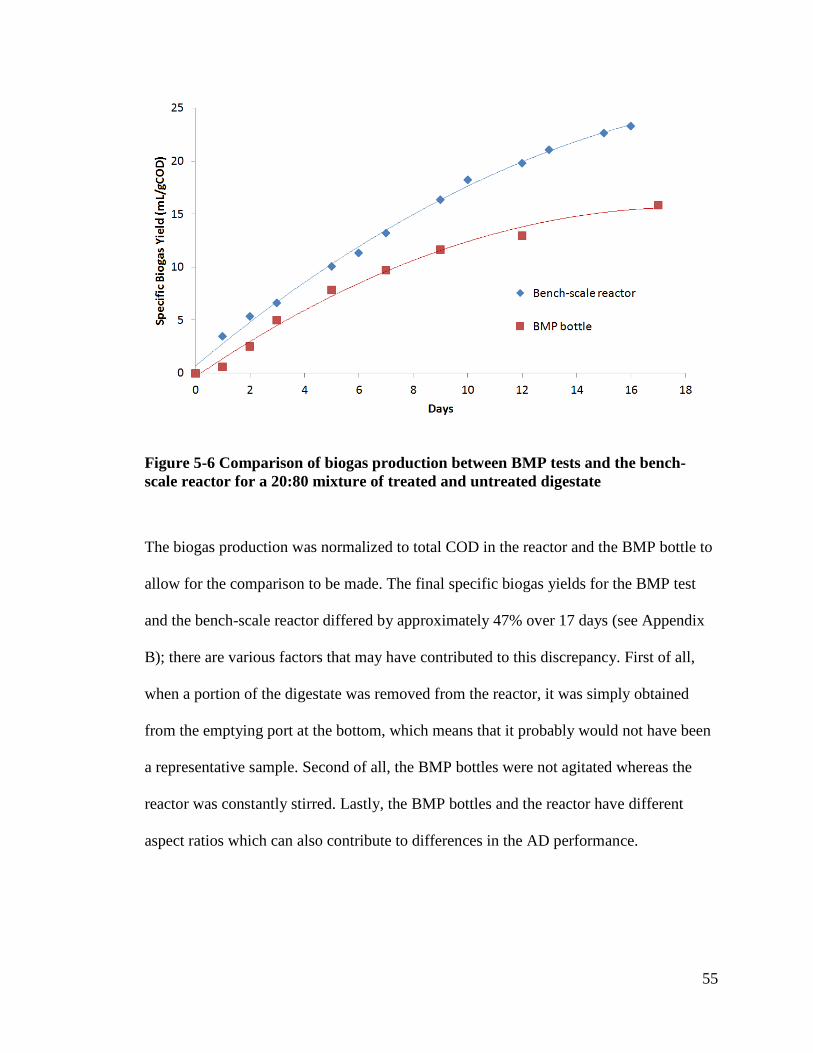
55
Figure 5-6 Comparison of biogas production between BMP tests and the bench-scale reactor for a 20:80 mixture of treated and untreated digestate
The biogas production was normalized to total COD in the reactor and the BMP bottle to
allow for the comparison to be made. The final specific biogas yields for the BMP test
and the bench-scale reactor differed by approximately 47% over 17 days (see Appendix
B); there are various factors that may have contributed to this discrepancy. First of all,
when a portion of the digestate was removed from the reactor, it was simply obtained
from the emptying port at the bottom, which means that it probably would not have been
a representative sample. Second of all, the BMP bottles were not agitated whereas the
reactor was constantly stirred. Lastly, the BMP bottles and the reactor have different
aspect ratios which can also contribute to differences in the AD performance.
56
5.2.5 Bench-Scale Reactor Runs Summary
Mass balance calculations were performed for all the bench-scale reactor runs to examine the overall performance of the system.
From Table 5-3, it can be seen that the mass balances for the bench-scale reactor runs varied from 89.8 – 107.9%. However, when
the biogas produced is compared to the change in COD (i.e. overall COD degraded), the recovery of COD in biogas varied from as
low as 62% to as high as 170%. Numbers below 100% may indicate inaccuracy (losses) in gas measurement, or presence of other
electron acceptors that also result in COD removal. Numbers above 100% suggest that more gas was produced that can be
accounted for by the loss of total COD. This is not actually possible and could mean that there are inaccuracies in the theoretical
conversion factor of 637mL biogas / gCOD, perhaps as a result of solubilization of CO2. It should be noted that these calculations
do not consider that new biomass (with its own contribution to COD) will have been formed during the digestion process, possibly
masking the true stoichiometry.

57
Table 5-3 Mass bass of all bench-scale reactor experiments. Detailed calculations can be found in Appendix B.
Condition
C1 Initial COD
(total IN) (g)
C2 Final COD Remained
(OUT) (g)
C3 Total
Biogas Produced
(L)
C4: C3 / 0.637L/gCOD COD equivalent of
biogas (OUT)
(g COD)
C5: C4/C1
% of total COD converted to
biogas (%)
C6: C2+C4 Amount of
COD accounted
for (total OUT)
(g)
C7: C6/C1 Mass
Balance (total OUT
/ IN) (%)
C8: C5/(C2-C1) % error in biogas
accountability (%)
Baseline 1 391.7 286.0 42.0 65.9 16.8 351.9 89.8 62
Baseline 2 377.9 282.0 52.2 81.9 21.7 363.9 96.3 85
Baseline 3 396.8 353.2 47.8 75.0 18.9 428.2 107.9 170
Total initial thermal
treatment of substrate
443.7 391.2 52.1 81.8 18.4 473.0 106.6 155
Intermediate Thermal
Treatment of digestate 1
466.4 309.6 86.8 136.3 29.2 445.9 95.6 87
Intermediate Thermal
Treatment of digestate 2
276.0 203.5 43.6 68.4 24.8 271.9 98.5 94
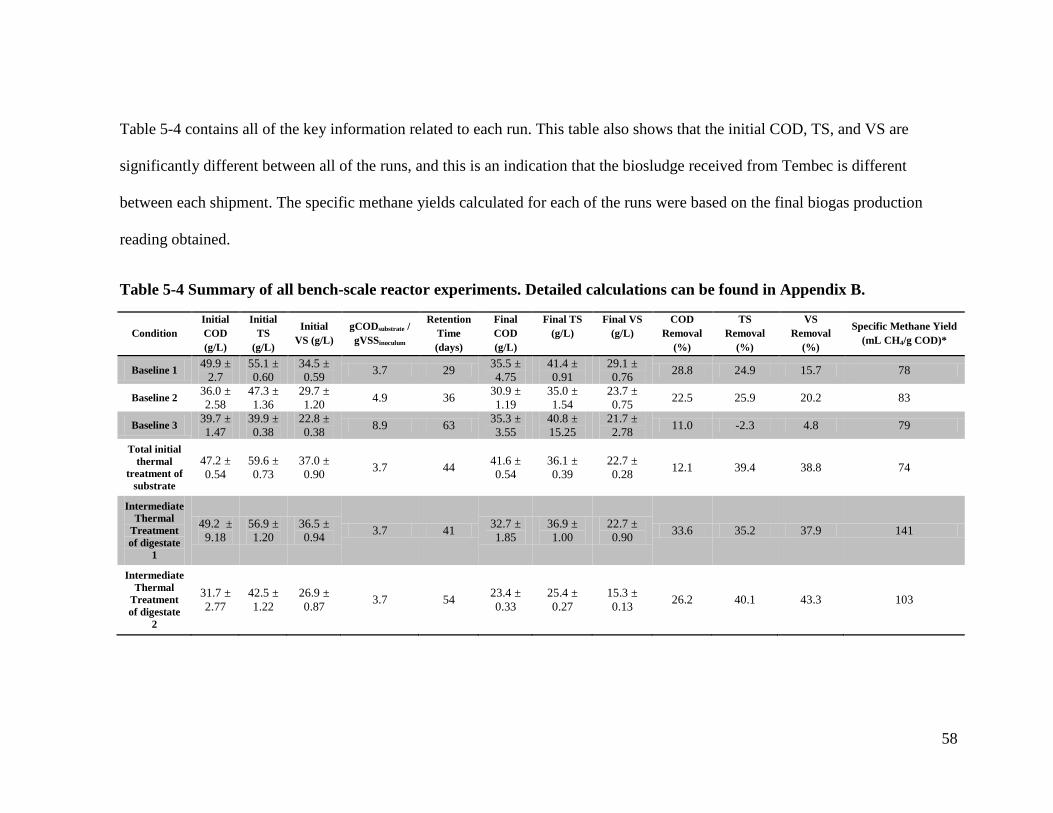
58
Table 5-4 contains all of the key information related to each run. This table also shows that the initial COD, TS, and VS are
significantly different between all of the runs, and this is an indication that the biosludge received from Tembec is different
between each shipment. The specific methane yields calculated for each of the runs were based on the final biogas production
reading obtained.
Table 5-4 Summary of all bench-scale reactor experiments. Detailed calculations can be found in Appendix B.
Condition Initial COD (g/L)
Initial TS
(g/L)
Initial VS (g/L)
gCODsubstrate / gVSSinoculum
Retention Time (days)
Final COD (g/L)
Final TS (g/L)
Final VS (g/L)
COD Removal
(%)
TS Removal
(%)
VS Removal
(%)
Specific Methane Yield (mL CH4/g COD)*
Baseline 1 49.9 ± 2.7
55.1 ± 0.60
34.5 ± 0.59 3.7 29 35.5 ±
4.75 41.4 ± 0.91
29.1 ± 0.76 28.8 24.9 15.7 78
Baseline 2 36.0 ± 2.58
47.3 ± 1.36
29.7 ± 1.20 4.9 36 30.9 ±
1.19 35.0 ± 1.54
23.7 ± 0.75 22.5 25.9 20.2 83
Baseline 3 39.7 ± 1.47
39.9 ± 0.38
22.8 ± 0.38 8.9 63 35.3 ±
3.55 40.8 ± 15.25
21.7 ± 2.78 11.0 -2.3 4.8 79
Total initial thermal
treatment of substrate
47.2 ± 0.54
59.6 ± 0.73
37.0 ± 0.90 3.7 44 41.6 ±
0.54 36.1 ± 0.39
22.7 ± 0.28 12.1 39.4 38.8 74
Intermediate Thermal
Treatment of digestate
1
49.2 ± 9.18
56.9 ± 1.20
36.5 ± 0.94 3.7 41 32.7 ±
1.85 36.9 ± 1.00
22.7 ± 0.90 33.6 35.2 37.9 141
Intermediate Thermal
Treatment of digestate
2
31.7 ± 2.77
42.5 ± 1.22
26.9 ± 0.87 3.7 54 23.4 ±
0.33 25.4 ± 0.27
15.3 ± 0.13 26.2 40.1 43.3 103

59
5.3 Biochemical Methane Potential (BMP) Tests
Two sets of BMP tests were performed throughout this study, testing various parameters.
BMP tests were very important to this study as they allowed for the testing of various
conditions simultaneously using the same substrate and inoculum. These results
supplemented the bench-scale reactor experiments and provided insight into potential
bench-scale experimental conditions. The set up procedure is described in detail in
section 3.5. Each BMP test was set up with three replicates.
5.3.1 Effect of thermal treatment, microbial acclimation, sludge thickening
Although the main focus of the current work is on the bench-scale AD system, BMP tests
still needed to be performed in order to test the feasibility of some conditions and
whether it is worth spending the time and effort to repeat certain conditions in the bench-
scale reactor.
The first set of BMP tests attempted to test various parameters. Microbial acclimation
was a topic of interest, and the theory was that the microbes that have been feeding on the
biosludge for some period of time will be better at degrading biosludge because they are
acclimated to the substrate; therefore, the digestate produced from the bench-scale reactor
will contain microbes that are theoretically acclimated to the biosludge to some extent.
Thermally treating the digestate from the bench-scale reactor followed by further
digestion was also of interest to see the benefits of thermal treatment. The difference
between thickening the biosludge and using the raw biosludge was also tested. The
effects of the anaerobic medium are not clearly known, since it has always been added to
all BMP tests; however, various studies do not mention the addition of medium and they

60
simply mix the biosludge and granular sludge together. Thus, a set of BMP tests were
performed in which the medium was replaced with water to see if there were any
significant differences.
Figure 5-7 Biogas production of BMP test for various parameters. BS = Biosludge, GS = Granular Sludge (inoculum). Positive control biogas production was much higher and not shown after the first 4 days, refer to Appendix C for positive control details. Positive control recipe found in section 3.5. Biogas production raw data can be found in Appendix A, Table A-28.
The theoretical biogas yield at 25°C and 1atm for adding 0.11g of COD is 70mL
(637mL/gCOD × 0.11g COD); however, the total COD in each BMP bottle was 0.22g as
the addition of inoculum increased the total COD. In Figure 5-7, it can be seen that the
granular sludge (inoculum) alone produced very little biogas, 8.5mL, indicating that the
COD from the inoculum is not very degradable. The positive control produced 77.9mL of
biogas (refer to Table A-28 and Figure C-1), which means that the substrate can account
for 69.4mL of biogas production. The positive control essentially achieved 100%
0.0
5.0
10.0
15.0
20.0
25.0
30.0
35.0
40.0
45.0
0 10 20 30 40 50
Biog
as P
rodu
ctio
n (m
L)
Days
Positive Control
BS + digestate
Thickened BS + GS
Treated digestate + GS
BS + GS
BS Ctrl
Digestate Ctrl
GS Ctrl
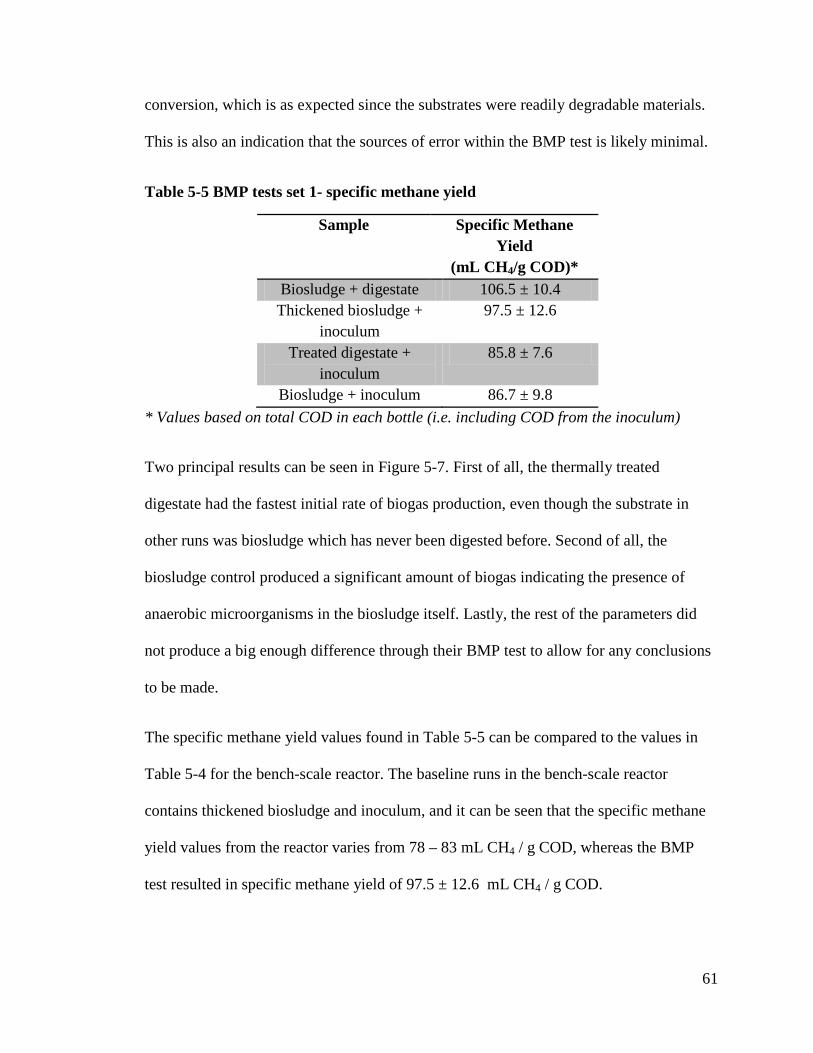
61
conversion, which is as expected since the substrates were readily degradable materials.
This is also an indication that the sources of error within the BMP test is likely minimal.
Table 5-5 BMP tests set 1- specific methane yield
Sample Specific Methane Yield
(mL CH4/g COD)* Biosludge + digestate 106.5 ± 10.4 Thickened biosludge +
inoculum 97.5 ± 12.6
Treated digestate + inoculum
85.8 ± 7.6
Biosludge + inoculum 86.7 ± 9.8 * Values based on total COD in each bottle (i.e. including COD from the inoculum)
Two principal results can be seen in Figure 5-7. First of all, the thermally treated
digestate had the fastest initial rate of biogas production, even though the substrate in
other runs was biosludge which has never been digested before. Second of all, the
biosludge control produced a significant amount of biogas indicating the presence of
anaerobic microorganisms in the biosludge itself. Lastly, the rest of the parameters did
not produce a big enough difference through their BMP test to allow for any conclusions
to be made.
The specific methane yield values found in Table 5-5 can be compared to the values in
Table 5-4 for the bench-scale reactor. The baseline runs in the bench-scale reactor
contains thickened biosludge and inoculum, and it can be seen that the specific methane
yield values from the reactor varies from 78 – 83 mL CH4 / g COD, whereas the BMP
test resulted in specific methane yield of 97.5 ± 12.6 mL CH4 / g COD.

62
5.3.2 Feasibility of thermally treating the solid portion of digestate
Another potential method to incorporate thermal treatment into the AD process is to treat
only the solid portion of the digestate, which means that the digestate is taken out of the
reactor, and then centrifuged. The remaining solids would be thermally treated, while the
supernatant may be put back into the reactor or fresh feed may be added to make the
process semi-continuous. The theory behind this method is that the treatment of the solid
portion should solubilize much more COD that was not sCOD, whereas the supernatant
would already contain mainly sCOD.
A set of BMP tests were performed to test the anaerobic digestibility of the digestate,
solid digestate, and liquid digestate. This test was used to determine whether it is feasible
to use intermediate thermal treatment of only the solid digestate portion. The solid
digestate was obtained by centrifuging the digestate at 2000RPM for 2min and then
decanting off the supernatant.
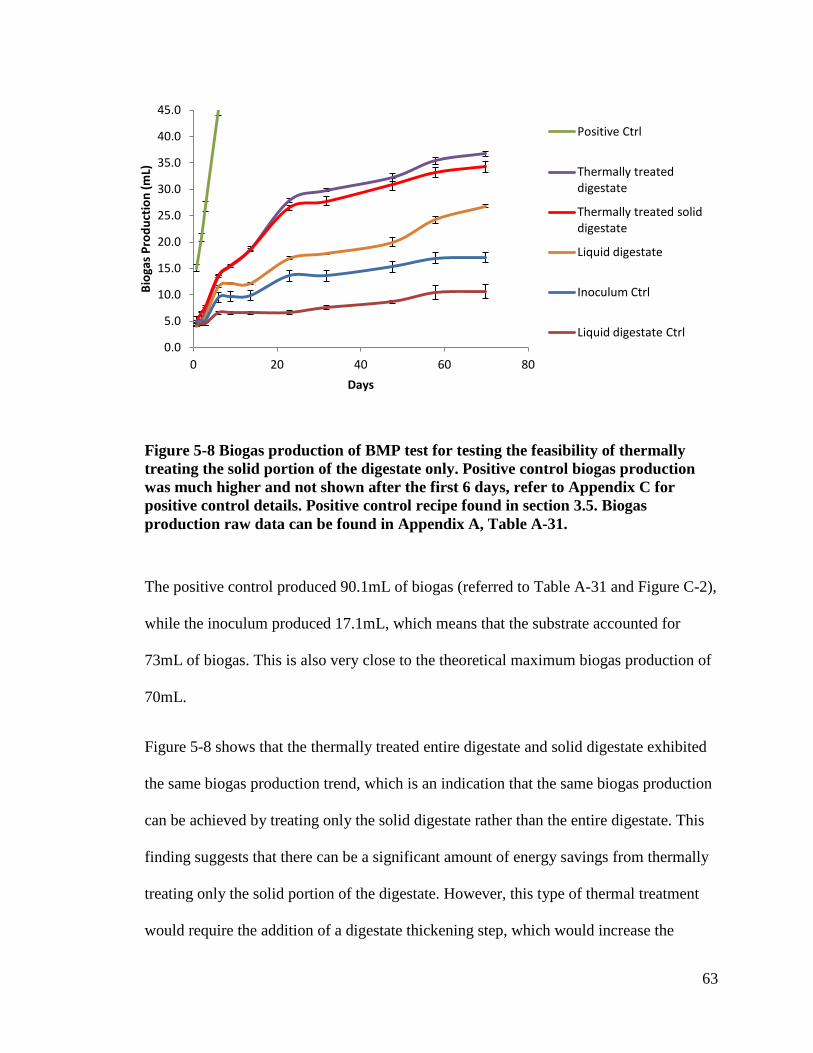
63
Figure 5-8 Biogas production of BMP test for testing the feasibility of thermally treating the solid portion of the digestate only. Positive control biogas production was much higher and not shown after the first 6 days, refer to Appendix C for positive control details. Positive control recipe found in section 3.5. Biogas production raw data can be found in Appendix A, Table A-31.
The positive control produced 90.1mL of biogas (referred to Table A-31 and Figure C-2),
while the inoculum produced 17.1mL, which means that the substrate accounted for
73mL of biogas. This is also very close to the theoretical maximum biogas production of
70mL.
Figure 5-8 shows that the thermally treated entire digestate and solid digestate exhibited
the same biogas production trend, which is an indication that the same biogas production
can be achieved by treating only the solid digestate rather than the entire digestate. This
finding suggests that there can be a significant amount of energy savings from thermally
treating only the solid portion of the digestate. However, this type of thermal treatment
would require the addition of a digestate thickening step, which would increase the
0.0
5.0
10.0
15.0
20.0
25.0
30.0
35.0
40.0
45.0
0 20 40 60 80
Biog
as P
rodu
ctio
n (m
L)
Days
Positive Ctrl
Thermally treated digestate
Thermally treated solid digestate
Liquid digestate
Inoculum Ctrl
Liquid digestate Ctrl

64
capital and the operational costs. The supernatant (liquid digestate) had a lower biogas
production, which is an interesting result as it clearly indicates that there remains a lot of
sCOD that is not digestible. This result shows that the sCOD in the digestate likely
contains recalcitrant material that is difficult to digest.

65
6. Discussion
Through the literature review, it was seen that most of the AD studies for pulp and paper
mill biosludge were conducted using small scale BMP tests, and there was a significant
knowledge gap in this process at a larger scale. The current study showed that AD of
pulp and paper mill biosludge is a potentially feasible process.
6.1 Reactor set up and operation
The bench-scale AD system was set up and various challenges were resolved through the
course of this study. Although some problems persist, and more ideal solutions are still
being sought, normal AD operation can be performed and studied. One of the main
adjustments that were made to the bench-scale reactor was the addition of a larger 15cm
diameter impeller at the surface of the reactor contents. The impellers that were included
with the purchase of the reactor were not sufficient in size and caused scum to be formed
at the surface of the reactor contents. Although the scum issue did not cause catastrophic
operational problems, it may be more significant if the process is turned into a continuous
process at a larger scale.
The protocol for the operation of the bench-scale system was developed throughout this
study, as more operational knowledge was gained with every new experiment performed.
The mass balance shown in Table 5-3 varied from 89.8 – 107.9%, which indicates that
the operational protocol is sound and reliable data can be obtained.
In Table 5-3, it can be seen that the percent error on the biogas accountability has a large
range of variation. This is an indication that the current methods may not be accurately
accounting for the reduction in COD to the production of biogas. The apparently good

66
mass balance values must be interpreted carefully, as the large amount of COD present in
the sludge may mask the biogas accountability error to a certain extent.
6.2 Baseline Runs
Baseline runs that were conducted showed that the rate of biogas production is dependent
on the amount of inoculum added to the reactor; however, the final biogas yield seems to
be similar in all of the runs. From Figure 5-1, it can be seen that as the substrate to
inoculum ratio increased, the rate of biogas production decreased, and it took more time
for the biogas production to reach a similar final yield for all three runs. Therefore, in a
full scale application, the amount of microorganisms in the reactor should be kept high to
achieve the highest rate of digestion and minimize the retention time and reactor size.
In order to compare to literature results, the specific methane yield needed to be
calculated from the specific biogas yield. It is assumed that the biogas composition
consisted of ~60% methane (see Appendix A, Table A-25 for GC measurements);
therefore, the specific biogas yield values were simply multiplied by 0.6 to obtain the
specific methane yields. The specific methane yield of the baseline runs ranged from 78 –
83 mL CH4 / g COD, which is within the range of values found in literature. In the
literature review conducted by Meyer and Edwards (2014), the specific methane yield
ranged from 30 – 155 mL CH4 / g COD. The large variations in reported values are
probably due to the different sources of biosludge used and the operating conditions.
6.3 Thermal pre-treatment run
Thermal treatment is an effective treatment as seen from Table 5-1, because it is able to
solubilize a significant amount of COD and make the COD more accessible to the
67
microorganisms for degradation. However, a significant reactor acidification problem
was seen in the initial thermal treatment of substrate run (Figure 5-2). The biogas
production stayed uncharacteristically low at the beginning of the experiment, which
indicates some type of upset with the experiment. The pH was measured to be 5.5, which
is too acidic for the methanogens to be functioning. It is believed that there was an
overproduction of VFAs due to the high concentration of easily digestible COD from the
initial thermal treatment.
Reactor overloading may happen when too much digestible material is added to the
reactor (Moletta, 2011). In the case of this experiment, it is speculated that thermally
treating all of the substrate released a large amount of soluble COD that could be easily
digested by the microbes; the methanogens were unable to keep up with the production of
VFAs, which caused the pH to drop and the entire AD process came to a stop. This result
illustrates the importance of monitoring pH in the reactor and having sufficient buffering
capacity.
The reactor overload also shows that thermally treating all of the substrate initially may
not be beneficial to the process, and a mixture of treated and untreated substrate may be a
better option. The issue of reactor overload was not discussed in any of the literature
relating to AD of pulp and paper mill biosludge, which is probably because BMP tests
are less prone to overloading since the contents are much more dilute. However, in a
larger scale application, this is a very crucial aspect of the overall process. This result
also suggests that there may be an optimal concentration for the amount of easily
digestible material present in the reactor that will allow for high rate degradation without
overloading the reactor.

68
6.4 Intermediate and post thermal treatment runs
From Figure 5-1, it can be seen that the rate of biogas production was initially high and
then the rate starts to slow down. The reason for this is believed to be that there is more
easily digestible material in the substrate at the beginning of the run and, as that easily-
digestible material is depleted, the microorganisms have to start digesting more
recalcitrant material. Intermediate thermal treatment attempts to boost the amount of
easily digestible material when it is almost depleted, which means that, when the rate of
biogas production starts to slow down, a portion of the digestate was removed, thermally
treated, and re-injected into the reactor for further digestion. Figure 5-3 shows that after
each thermal treatment, there appears to be a boost in the biogas production rate, and a
total of 4 intermediate thermal treatments were done for each run.
The average specific methane yield for the three baseline runs was 80 mL CH4 / g COD,
whereas the specific methane yield for the two intermediate thermal treatment runs were
141 and 103 mL CH4 / g COD, a difference of 76% and 29% respectively. The highest
specific methane yield achieved in this study was 141 mL CH4 / g COD. The highest
specific methane yield for mesophilic digestion of biosludge with pre-treatment was
reported as 185 mL CH4 / g COD in the review conducted by Meyer and Edwards (2014).
However, most of the reported values are below 120 mL CH4 / g COD. Therefore, the
specific methane yield achieved through this study is very comparable to the literature,
and it has been shown that intermediate thermal treatment appears to be able to
significantly enhance the AD process.
The post-treatment of digestate followed by further digestion showed an enhancement in
the biogas yield as well, compared with the untreated control. One of the issues with the
69
experimental design was that all of the microorganisms in the digestate will be dead after
thermal treatment, which means that it is not feasible to thermally treat 100% of the
digestate unless fresh inoculum is added. This also means that, although thermally
treating more digestate is beneficial for biogas yield, the rate of biogas production will be
lower if a large portion of the digestate is treated. Figure 5-5 shows that thermally
treating 80% of the digestate eventually resulted in a much higher yield compared to the
control. A specific methane yield of 114 mL CH4 / g COD was calculated for this post-
treatment experiment which is an increase of 43% from the baseline run. In a full-scale
application, the rate and yield are both extremely important, which means that it may not
be desirable to perform post treatment of a large portion of the digestate.
With the intermediate and post thermal treatment experiments, an increase in the biogas
yield was observed, which indicates that more of the COD within the biosludge was
accessible to the microorganisms. This finding is important as it shows that thermal
treatment has a positive impact on AD of pulp and paper mill biosludge, and it also
shows that post-treating the digestate is feasible and probably preferable to pre-treating
the biosludge.

70
Table 6-1 Summary of enhancements in specific methane yields from thermal treatment runs
Runs Specific Methane
Yield (mL CH4/g COD)
% increase from baseline
Baseline runs average 78-83 -- Intermediate thermal
treatment 1 141 76
Intermediate thermal treatment 2 103 29
Post-thermal treatment 114 43
6.5 Effect of scale
The results from BMP tests and the bench-scale system were different even when the
conditions were identical as seen in Figure 5-6. However, only one set of these
experiments were performed through this study and this topic should be more closely
examined. Unrepresentative sample collection, variations in reactor configuration and
operating conditions likely played a major role in the discrepancies. Additionally,
different biogas measurement methods in the two reactors may have also contributed to
the differences. The bench-scale reactor’s biogas measurement was done continuously
under the same pressure whereas the BMP bottles were measured discretely at certain
time points. The different biogas measurement methods would have caused differences in
the headspace pressure, which could result in biogas production measurement
discrepancies. It is still a good idea to run simultaneous BMP tests and bench-scale tests
using identical conditions in order to have replicates even though there may be known
discrepancies.
71
6.6 BMP tests
Two sets of conventional BMP tests were carried out through this study. The first set was
done to test various parameters. Key findings were that thermal treatment definitely
showed significant enhancement in both the rate and yield of biogas production, and the
biosludge itself appeared to have anaerobic activity without the addition of any inoculum.
The experiment with biosludge as the substrate and reactor digestate as the inoculum
showed the highest specific methane yield of 106.5 mL CH4 / g COD, which may
indicate that there was microbial acclimation; however, this is a topic that needs to be
further examined as this study does not provide enough proof for this conclusion. The
experiment of thickened biosludge and inoculum is the same type of experiment as the
baseline runs, and in this case, a specific methane yield of 97.5 mL CH4 / g COD, which
is slightly higher than the values achieved in the bench-scale reactor runs; however, this
might be caused by the relatively larger amount of inoculum added in the BMP tests.
The second set of BMP tests performed was to examine whether it was feasible to
perform thermal treatment of only the solid portion of the digestate. The liquid digestate
was seen to not be very digestible, which means that there are recalcitrant sCOD present.
It also showed that the same amount of biogas production can be achieved from
thermally treating the digestate as-is and the solid portion of the digestate (Figure 5-8).
This result indicates that the sCOD remaining in the digestate is not going to be digested
much further and the increase in the yield of digestion must come from the non-soluble
COD remaining, which explains the effectiveness of thermal treatment as it can
solubilize a significant portion of the non-soluble COD (Table 5-1).
72
6.7 Operating strategy and summary
A semi-continuous operating strategy that can be thought of based on the intermediate
thermal treatment idea. It is ideal to thermally treat a sludge that has higher solids content
since that will allow for more COD solubilization. Therefore, when a certain portion of
the digestate is removed from the reactor, it can be thickened first and then only the
solids portion gets thermally treated and re-injected back into the reactor for further
digestion. In order to turn this into a semi-continuous process, the supernatant after
thickening can be discarded, since it does not contain much more digestible COD, and
the same volume of fresh biosludge can be added to maintain the volume within the
reactor.
Throughout this study, insight has been gained into the operation of AD of pulp and
paper mill biosludge in a bench-scale reactor. A total of 7 bench-scale reactor
experiments were completed, and the effects of various thermal treatment conditions
have also been tested. The bench-scale system was assembled, and BMP tests were used
as well to supplement the bench-scale experiments. Thermal pre-treatment may cause
reactor overloading, whereas thermal intermediate treatment and post treatment appear to
be potentially feasible methods to enhance the AD of pulp and paper mill biosludge.
Further studies are needed at the bench-scale level to optimize the process and examine
other operating parameters.
73
7. Engineering Significance
Anaerobic digestion is a method that’s widely used to treat various types of organic waste.
This study focused on applying AD to the pulp and paper industry in terms of treating the
biosludge from the wastewater treatment process. AD has numerous benefits including
the production of biogas which can be used to generate green energy, and it also reduces
the amount of greenhouse gases released. Methane is a significantly worse greenhouse
gas than CO2, but since all of the methane would be captured and turned into CO2
through electricity generation, the overall greenhouse gas emissions would be reduced.
This study has shown that AD of biosludge is feasible not only in small scale BMP tests,
but also in a bench-scale system. Various phenomena were observed in the bench-scale
systems that were not seen before through BMP tests, such as foaming, surface scum
formation, and reactor overloading. Extensive experience has been gained in the AD
process in terms of operation and theoretical knowledge. This study will act as a
precursor for future studies to further the knowledge in AD of pulp and paper mill
biosludge.

74
8. Conclusion
This study examined numerous aspects related to AD of pulp and paper mill biosludge.
Compared to AD of municipal biosludge, the key challenges relate to the presence of
fibres and lignin. The following conclusions can be drawn:
- The bench-scale AD system has been set up to perform batch experiments and is
operationally stable.
- Biosludge can be successfully digested anaerobically both in small scale BMP tests
and in a 10L bench-scale system. Although there are difficulties when comparing the
results from the bench-scale reactor due to inability to perform simultaneous runs and
having to work with different shipments of raw materials.
- Thermal pre-treatment has shown to potentially be an ineffective method to enhance
AD as it may cause reactor overload and acidification in the system. However, more
tests are needed to examine this issue further.
- Intermediate thermal treatment and post thermal treatment has significant impact on
the final biogas yield and have been shown to be effective methods to enhance AD.
Increases of 76% and 29% in specific methane yield were seen for intermediate
thermal treatment runs, and an increase of 43% in specific methane yield was seen for
the post thermal treatment run.
- The AD process appears to be affected by the reactor scale as BMP tests and bench-
scale experiment produce similar but not identical results in this study. However,
more tests are needed to examine this issue further.

75
9. Recommendations
- It is important to understand what is happening at a molecular level during AD, as
well as during thermal treatment. A better understanding of the characteristics of the
biosludge through the AD process will allow for better process optimization as well
as the development of pre- and post-treatment methods that may be even more
suitable. Therefore, development of a series of methods to better characterize the
biosludge and digestate would be beneficial.
- A synthetic biosludge material could be developed and used as the substrate in AD
experiments. This will allow for a consistent feedstock for each experiment as well as
better characterization of the feed and digestate.
- A more standardized set of protocol should be developed that describes all of the
measurements to be done on every biosludge and digestate sample. This will allow
for better communication of results and enhance collaborative efforts.
- Numerous experiments should be replicated in the bench scale system to confirm
findings, such as an additional initial thermal treatment run to examine the
overloading issue, as well as a post thermal treatment run in the bench-scale system.
- Semi-continuous operation should be pursued based on the operating strategy
outlined in section 6.7.
- An identical bench-scale reactor should be acquired as this would allow for the
simultaneous operation of two systems using identical feed materials, leading to
better comparison of results as well as controls.
76
10. References
Amaya, O.M., Baragan, M.T.C., and Tapia, F.J.A. (2013). Biomass Now - Sustainable Growth and Use (InTech).
Anderson, G.K., and Yang, G. (1992). Determination of bicarbonate and total volatile acid concentration in anaerobic digesters using a simple titration. Water Environment Research 64, 53-59.
Angelidaki, I., Alves, M., Bolzonella, D., Borzacconi, L., Campos, J.L., Guwy, A.J., Kalyuzhnyi, S., Jenicek, P., and van Lier, J.B. (2009). Defining the biomethane potential (BMP) of solid organic wastes and energy crops: a proposed protocol for batch assays. Water Sci Technol 59, 927-934.
Angenent, L.T., and Dague, R.R. (1996). Initial studies on the anaerobic migrating blanket reactor. Paper presented at: 51st Purdue Industrial Waste Conference (Purdue University, West Lafayette, Indiana: Ann Arbor Press, Inc.).
APHA (1998). Standard methods for the examination of ater and wastewater.
Ariunbaatar, J., Panico, A., Frunzo, L., Esposito, G., Lens, P.N., and Pirozzi, F. (2014). Enhanced anaerobic digestion of food waste by thermal and ozonation pretreatment methods. J Environ Manage 146, 142-149.
Bayr, S., Kaparaju, P., and Rintala, J. (2013). Screening pretreatment methods to enhance thermophilic anaerobic digestion of pulp and paper mill wastewater treatment secondary sludge. Chemical Engineering Journal 223, 479-486.
Bilgili, M.S., Demir, A., and Varank, G. (2009). Evaluation and modeling of biochemical methane potential (BMP) of landfilled solid waste: a pilot scale study. Bioresour Technol 100, 4976-4980.
Borowski, S., and Kubacki, P. (2015). Co-digestion of pig slaughterhouse waste with sewage sludge. Waste Manag 40, 119-126.
Brule, M., Oechsner, H., and Jungbluth, T. (2014). Exponential model describing methane production kinetics in batch anaerobic digestion: a tool for evaluation of biochemical methane potential assays. Bioprocess Biosystem Engineering 37, 1759-1770.
Edwards, E.A., and Garbic-Galic, D. (1994). Anaerobi Degradation of Toluene and o-Xylene by a Methanogenic Consortium. Applied and Environmental Microbiology 60, 313-322.
77
Elliott, A., and Mahmood, T. (2007). Pretreatment technologies for advancing anaerobic digestion of pulp and paper biotreatment residues. Water Res 41, 4273-4286.
Elliott, A., and Mahmood, T. (2012). Comparison of Mechanical Pretreatment Methods for the Enhancement of Anaerobic Digestion of Pulp and Paper Waste Activated Sludge. Water Environment Research 84, 497-505.
Galbe, M., and Zacchi, G. (2012). Pretreatment: The key to efficient utilization of lignocellulosic materials. Biomass and Bioenergy 46, 70-78.
Hagelqvist, A. (2013). Batchwise mesophilic anaerobic co-digestion of secondary sludge from pulp and paper industry and municipal sewage sludge. Waste Manag 33, 820-824.
Huiliñir, C., Quintriqueo, A., Antileo, C., and Montalvo, S. (2014). Methane production from secondary paper and pulp sludge: Effect of natural zeolite and modeling. Chemical Engineering Journal 257, 131-137.
Jolis, D. (2008). High-Solids Anaerobic Digestion of Municipal Sludge Pretreated by Thermal Hydrolysis. Water Environment Research 80, 654 - 662.
Kaluza, L., Sustarsic, M., Rutar, V., and Zupancic, G.D. (2014). The re-use of Waste-Activated Sludge as part of a "zero-sludge" strategy for wastewater treatments in the pulp and paper industry. Bioresour Technol 151, 137-143.
Kaparaju, P., Buendia, I., Ellegaard, L., and Angelidakia, I. (2008). Effects of mixing on methane production during thermophilic anaerobic digestion of manure: lab-scale and pilot-scale studies. Bioresour Technol 99, 4919-4928.
Karim, K., Hoffmann, R., Klasson, T., and Al-Dahhan, M.H. (2005). Anaerobic digestion of animal waste: waste strength versus impact of mixing. Bioresour Technol 96, 1771-1781.
Kepp, U., Machenbach, I., Weisz, N., and Solheim, O.E. (2000). Enhanced stabilisation of sewage sludge through thermal hydrolysis - three years of experience with full scale plant. Water Science and Technology 42, 89-96.
Kerri, K. (1999). Operation of Wastewater Treatment Plants, Vol 2, 4 edn (California State University).
Kyllonen, H.L., Lappi, M.K., Thun, R.T., and Mustranta, A.H. (1988). Treatment and Characterialization of Biological Sludges From Pulp and Paper Industry. Water Science Technology 20, 183-192.
78
Lin, Y., Wang, D., Li, Q., and Huang, L. (2011). Kinetic study of mesophilic anaerobic digestion of pulp & paper sludge. Biomass and Bioenergy 35, 4862-4867.
Lindner, J., Zielonka, S., Oechsner, H., and Lemmer, A. (2015). Effect of different pH-values on process parameters in two-phase anaerobic digestion of high-solid substrates. Environ Technol 36, 198-207.
Lo, H.M., Kurniawan, T.A., Sillanpaa, M.E.T., Pai, T.Y., Chiang, C.F., Chao, K.P., Liu, M.H., Chuang, S.H., Banks, C.J., Wang, S.C., et al. (2010). Modeling biogas production from organic fraction of MSW co-digested with MSWI ashes in anaerobic bioreactors. bioresour Technology 101, 6329-6335.
Lovley, D.R. (2000). Anaerobic benzene degradation. Biodegradation 11, 107-116.
Mahmood, T., and Elliott, A. (2006). A review of secondary sludge reduction technologies for the pulp and paper industry. Water Res 40, 2093-2112.
Meyer, T., and Edwards, E.A. (2014). Anaerobic digestion of pulp and paper mill wastewater and sludge. Water Res 65, 321-349.
Moeller, L., Lehnig, M., Schenk, J., and Zehnsdorf, A. (2015). Foam formation in biogas plants caused by anaerobic digestion of sugar beet. Bioresour Technol 178, 270-277.
Moletta, R. (2011). Anaerobic Digestion Monitoring and Control (Narbonne Frane: Laboratorie de Biotechnologie de l'Environnement - INRA).
Mussoline, W., Esposito, G., Lens, P., Spagni, A., and Giordano, A. (2013). Enhanced methane production from rice straw co-digested with anaerobic sludge from pulp and paper mill treatment process. Bioresour Technol 148, 135-143.
NRCan (2015). Leading global pulp and paper exporters. In Natural Resources Canada, N.R. Canada, ed. (Natural Resources Canada: Natural Resources Canada).
Paradigm (2015). Paradigm Environmental Technologies Inc - Manufaturers of MicroSludge Patented Technology.
Park, N.D., Helle, S.S., and Thring, R.W. (2012). Combined alkaline and ultrasound pre-treatment of thickened pulp mill waste activated sludge for improved anaerobic digestion. Biomass and Bioenergy 46, 750-756.
Paul, E., Camacho, P., Lefebvre, D., and Ginestet, P. (2006). Organic matter release in low temperature thermal treatment of biological sludge for reduction of excess sludge production. Water Science and Technology 54, 59-68.
79
Richard, T. (1996). The Effect of Lignin on Biodegradability. In Cornell Composting - Science & Engineering.
Saha, M., Eskicioglu, C., and Marin, J. (2011). Microwave, ultrasonic and chemo-mechanical pretreatments for enhancing methane potential of pulp mill wastewater treatment sludge. Bioresour Technol 102, 7815-7826.
Smil, V. (2008). Energy in Nature and Society. General Energetics of Complex Systems (Massachusetts Institute of Technology).
Speece, R.E. (2008). Anaerobic biotechnology and Odor/Corrosion Control for Municipalities and Industries (Nashville, Tennessee: Archae Press).
Speece, R.E. (2015). Gas Meters For Laboratories.
Stephenson, R.J., and Dhaliwal, H.S. (2000). Method of liquefying microorganisms derived from biological wastewater treatment processes (United States of America: Paradigm Environmental Technologies Inc.).
Stoica, A., Sandberg, M., and Holby, O. (2009). Energy use and recovery strategies within wastewater treatment and sludge handling at pulp and paper mills. Bioresour Technol 100, 3497-3505.
Stroot, P.G., McMahom, K.D., Mackie, R.I., and Raskin, L. (2001). Anaerobic codigestion of muniipal solid waste and biosolids under various mixing conditions - I. Digester performance. Water Resource 35, 1804-1816.
Trulli, E., and Torretta, V. (2015). Influence of feeding mixture composition in batch anaerobic co-digestion of stabilized municipal sludge and waste from dairy farms. Environ Technol 36, 1519-1528.
Tyagi, V.K., Lo, S.L., and Rajpal, A. (2014). Chemically coupled microwave and ultrasonic pre-hydrolysis of pulp and paper mill waste-activated sludge: effect on sludge solubilisation and anaerobic digestion. Environ Sci Pollut Res Int 21, 6205-6217.
Valo, A., Carrere, H., and Delgenes, J.P. (2004). Thermal, chemical and thermo-chemical pre-treatment of waste activated sludge for anaerobic digestion. Journal of Chemical Technology & Biotechnology 79, 1197-1203.
Vlyssides, A. (2004). Thermal-alkaline solubilization of waste activated sludge as a pre-treatment stage for anaerobic digestion. Bioresource Technology 91, 201-206.

80
Wood, N., Tran, H., and Master, E. (2009). Pretreatment of pulp mill secondary sludge for high-rate anaerobic conversion to biogas. Bioresour Technol 100, 5729-5735.
Xu, C., and Lancaster, J. (2012). Treatment of Secondary Sludge for Energy Recovery - Review.
Xu, J., Yuan, H., Lin, J., and Yuan, w. (2014). Evaluation of thermal, thermal-alkaline, alkaline and electrochemical pretreatments on sludge to enhance anaerobic biogas production. Journal of the Taiwan Institute of Chemical Engineers 45, 2531-2536.
Yalcinkaya, S., and Malina, J.F., Jr. (2015). Model development and evaluation of methane potential from anaerobic co-digestion of municipal wastewater sludge and un-dewatered grease trap waste. Waste Manag 40, 53-62.
Yun, Y.M., Jung, K.W., Kim, D.H., Cho, S.K., and Shin, H.S. (2013). Synergistic enhancement of hydrolytic enzyme activities on anaerobic co-digestion. Paper presented at: World Congress on Anaerobic Digestion (Santiago de Compostela, Spain).

81
Appendix A. Raw Experimental Data
Figure A-1 COD standard calibration. (March 14th, 2014). Used for baseline run 2, BMP test set 1
Figure A-2 COD standard calibration. (Aug 25th, 2014). Used for baseline run 1, thermal pre-treatment run, intermediate thermal treatment run 1, BMP test set 2
y = 2601.8x - 41.427 R² = 0.9878
0
200
400
600
800
1000
1200
0 0.1 0.2 0.3 0.4 0.5
Conc
entr
atio
n μg
O2/
ml
A 600nm
y = 2589.1x - 0.6725 R² = 0.9968
0
200
400
600
800
1000
1200
0 0.05 0.1 0.15 0.2 0.25 0.3 0.35 0.4
Con
cent
ratio
n µg
O2/
ml
A 600 nm
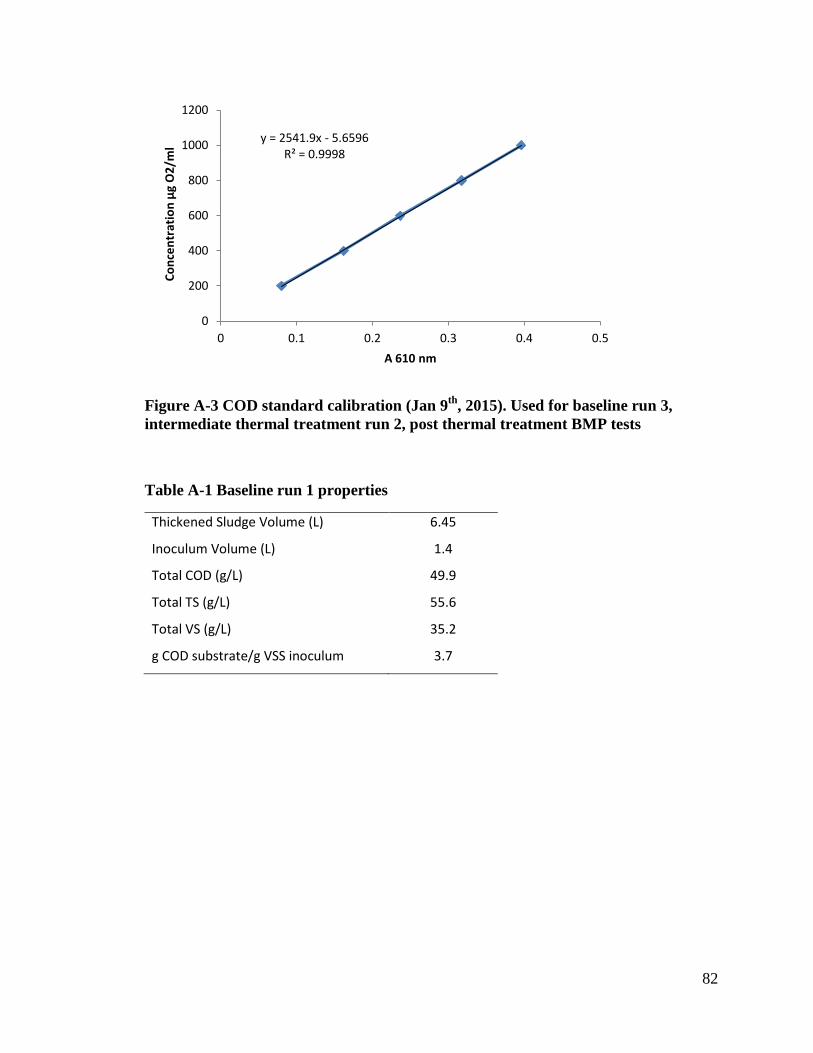
82
Figure A-3 COD standard calibration (Jan 9th, 2015). Used for baseline run 3, intermediate thermal treatment run 2, post thermal treatment BMP tests
Table A-1 Baseline run 1 properties
Thickened Sludge Volume (L) 6.45
Inoculum Volume (L) 1.4
Total COD (g/L) 49.9
Total TS (g/L) 55.6
Total VS (g/L) 35.2
g COD substrate/g VSS inoculum 3.7
y = 2541.9x - 5.6596 R² = 0.9998
0
200
400
600
800
1000
1200
0 0.1 0.2 0.3 0.4 0.5
Con
cent
ratio
n µg
O2/
ml
A 610 nm
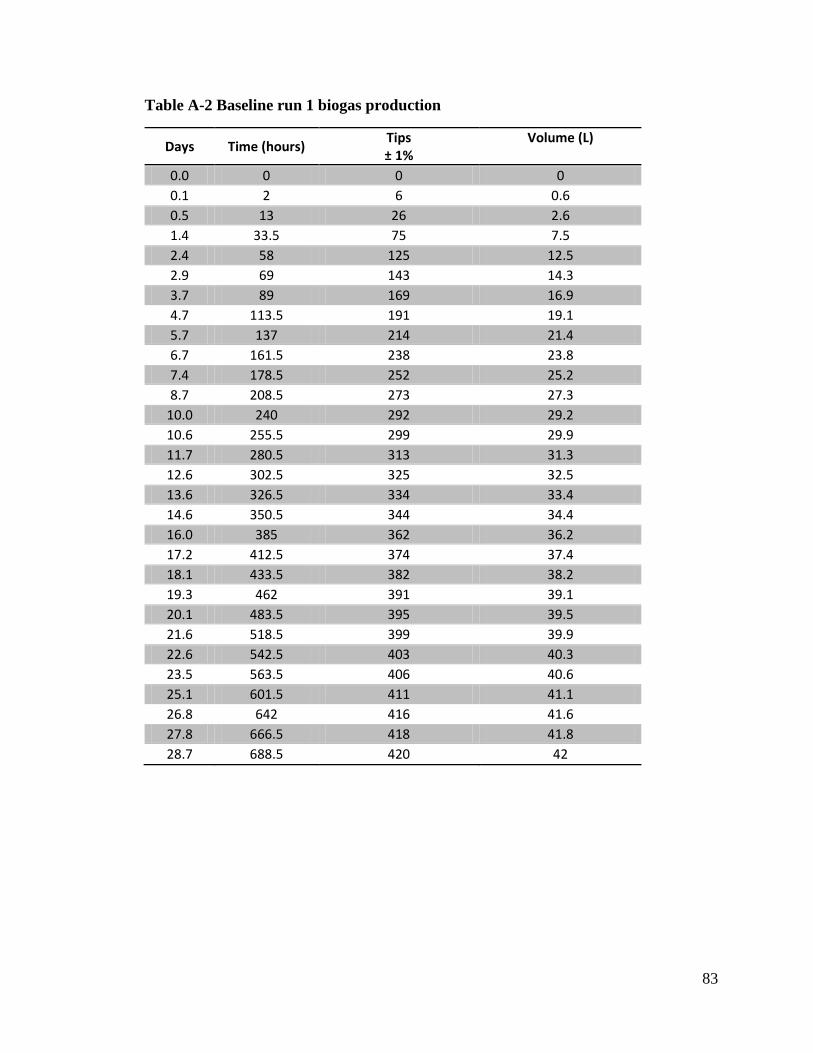
83
Table A-2 Baseline run 1 biogas production
Days Time (hours) Tips ± 1%
Volume (L)
0.0 0 0 0 0.1 2 6 0.6 0.5 13 26 2.6 1.4 33.5 75 7.5 2.4 58 125 12.5 2.9 69 143 14.3 3.7 89 169 16.9 4.7 113.5 191 19.1 5.7 137 214 21.4 6.7 161.5 238 23.8 7.4 178.5 252 25.2 8.7 208.5 273 27.3
10.0 240 292 29.2 10.6 255.5 299 29.9 11.7 280.5 313 31.3 12.6 302.5 325 32.5 13.6 326.5 334 33.4 14.6 350.5 344 34.4 16.0 385 362 36.2 17.2 412.5 374 37.4 18.1 433.5 382 38.2 19.3 462 391 39.1 20.1 483.5 395 39.5 21.6 518.5 399 39.9 22.6 542.5 403 40.3 23.5 563.5 406 40.6 25.1 601.5 411 41.1 26.8 642 416 41.6 27.8 666.5 418 41.8 28.7 688.5 420 42

84
Table A-3 Baseline run 1 COD measurements
Sample Abs Concentration (ug/mL) Dilution Actual
concentration (g/L) Avg (g/L)
Reactor 1 0.183 473.1 100 47.3 49.9 Reactor 2 0.192 496.4 100 49.6 Reactor 3 0.204 527.5 100 52.7
Digestate 1 0.122 304.5 100 30.4 35.5 Digestate 2 0.159 398.5 100 39.9 Digestate 3 0.145 362.9 100 36.3
Table A-4 Baseline run 1 solids measurements
Sample vol (mL)
original weight (g) 105C (g) 550C (g) TS (g/L) VS (g/L) Avg TS Avg VS
Thickened sludge 1 3 1.2893 1.3624 1.301 24.4 20.5 24.3 20.5
Thickened sludge 2 3 1.2876 1.3594 1.2988 23.9 20.2
Thickened sludge 3 3 1.2879 1.3615 1.2991 24.5 20.8
Inoculum 1 3 1.2841 1.5059 1.3218 73.9 61.4 74.6 62.1
Inoculum 2 3 1.2938 1.5131 1.3309 73.1 60.7
Inoculum 3 3 1.3016 1.532 1.339 76.8 64.3
Table A-5 Baseline run 2 properties
Thickened Sludge Volume (L) 8.71
Inoculum Volume (L) 1.8
Total COD (g/L) 36.0
Total TS (g/L) 47.3
Total VS (g/L) 29.7
g COD substrate/g VSS inoculum 4.9
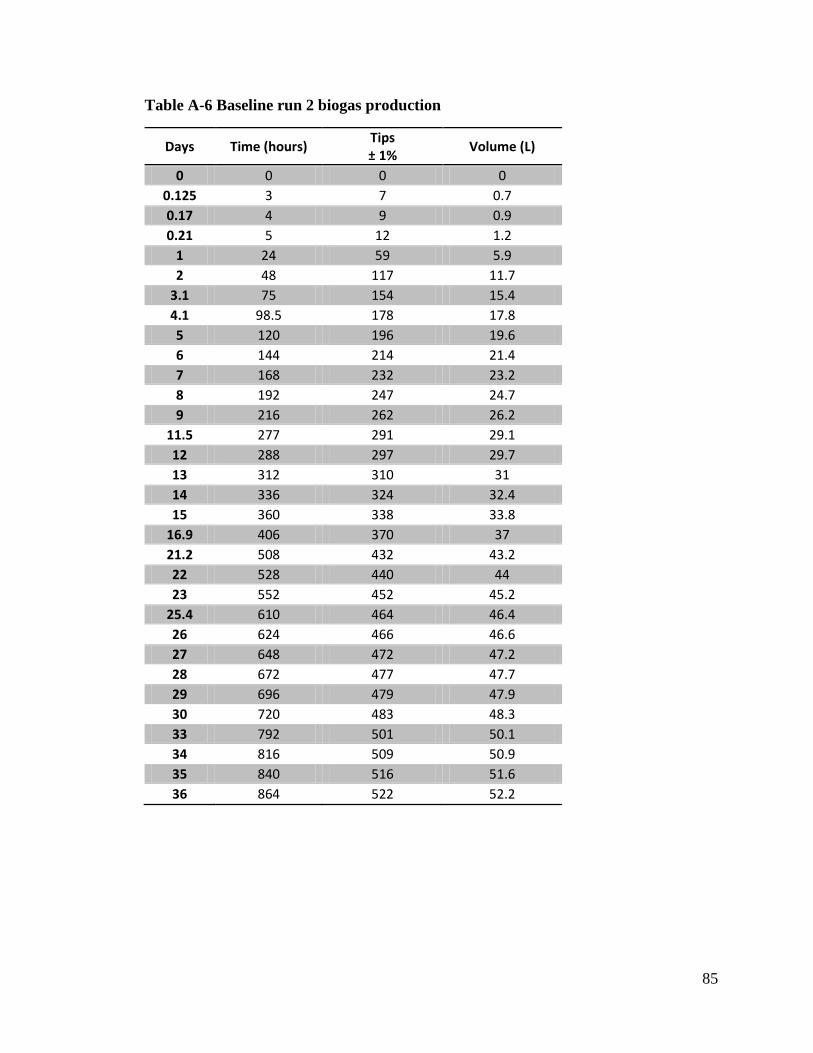
85
Table A-6 Baseline run 2 biogas production
Days Time (hours) Tips ± 1% Volume (L)
0 0 0 0 0.125 3 7 0.7 0.17 4 9 0.9 0.21 5 12 1.2
1 24 59 5.9 2 48 117 11.7
3.1 75 154 15.4 4.1 98.5 178 17.8 5 120 196 19.6 6 144 214 21.4 7 168 232 23.2 8 192 247 24.7 9 216 262 26.2
11.5 277 291 29.1 12 288 297 29.7 13 312 310 31 14 336 324 32.4 15 360 338 33.8
16.9 406 370 37 21.2 508 432 43.2 22 528 440 44 23 552 452 45.2
25.4 610 464 46.4 26 624 466 46.6 27 648 472 47.2 28 672 477 47.7 29 696 479 47.9 30 720 483 48.3 33 792 501 50.1 34 816 509 50.9 35 840 516 51.6 36 864 522 52.2

86
Table A-7 Baseline run 2 COD measurements
Sample Abs Concentration (ug/mL) Dilution Actual
concentration (g/L) Avg (g/L)
Reactor 1 0.308 773.1 50 38.7 36.0 Reactor 2 0.285 714.0 50 35.7 Reactor 3 0.268 670.3 50 33.5
Digestate 1 0.250 609.0 50 30.5 30.9 Digestate 2 0.267 653.3 50 32.7 Digestate 3 0.271 663.7 50 33.2 Digestate 4 0.254 619.4 50 30.9 Digestate 5 0.252 614.2 50 30.7 Digestate 6 0.260 635.0 50 31.8 Digestate 7 0.245 596.0 50 29.8 Digestate 8 0.244 593.4 50 29.7 Digestate 9 0.255 622.0 50 31.1
Digestate 10 0.259 632.4 50 31.6 Digestate 11 0.248 603.8 50 30.2 Digestate 12 0.241 585.6 50 29.3
Note: a total of 4 bottles were used to collect the digestate; therefore, a sample was taken out of each of the 4 bottles for COD analysis. This is the reason for a total of 12 digestate samples
Table A-8 Baseline run 2 solids measurements
Sample vol (mL)
original weight (g) 105C (g) 550C (g) TS (g/L) VS (g/L) Avg TS Avg VS
Thickened sludge 1 2 1.2975 1.3459 1.3044 24.2 20.8 22.8 19.6
Thickened sludge 2 2 1.2933 1.3388 1.2996 22.75 19.6
Thickened sludge 3 2 1.2724 1.3154 1.2786 21.5 18.4
Inoculum 1 3 1.4108 1.5045 1.4201 46.85 42.2 47.1 42.8
Inoculum 2 3 1.4087 1.5004 1.4166 45.85 41.9
Inoculum 3 3 1.3925 1.4898 1.4012 48.65 44.3
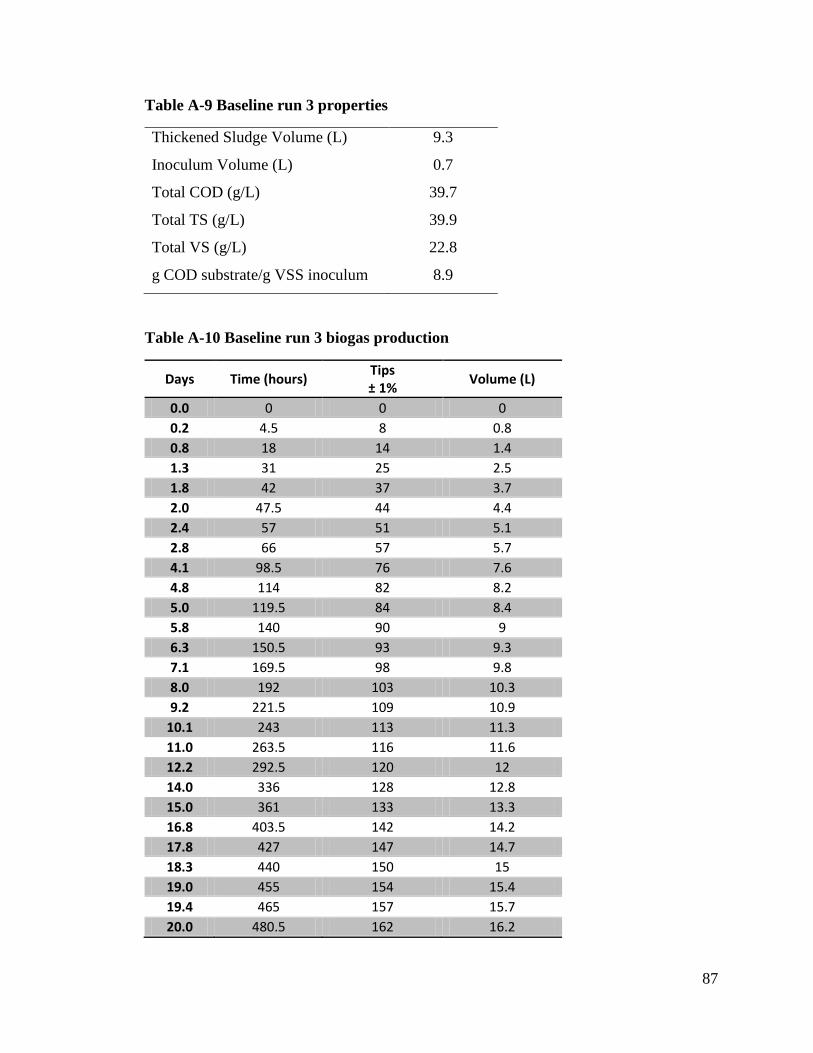
87
Table A-9 Baseline run 3 properties
Thickened Sludge Volume (L) 9.3
Inoculum Volume (L) 0.7
Total COD (g/L) 39.7
Total TS (g/L) 39.9
Total VS (g/L) 22.8
g COD substrate/g VSS inoculum 8.9
Table A-10 Baseline run 3 biogas production
Days Time (hours) Tips ± 1% Volume (L)
0.0 0 0 0 0.2 4.5 8 0.8 0.8 18 14 1.4 1.3 31 25 2.5 1.8 42 37 3.7 2.0 47.5 44 4.4 2.4 57 51 5.1 2.8 66 57 5.7 4.1 98.5 76 7.6 4.8 114 82 8.2 5.0 119.5 84 8.4 5.8 140 90 9 6.3 150.5 93 9.3 7.1 169.5 98 9.8 8.0 192 103 10.3 9.2 221.5 109 10.9
10.1 243 113 11.3 11.0 263.5 116 11.6 12.2 292.5 120 12 14.0 336 128 12.8 15.0 361 133 13.3 16.8 403.5 142 14.2 17.8 427 147 14.7 18.3 440 150 15 19.0 455 154 15.4 19.4 465 157 15.7 20.0 480.5 162 16.2
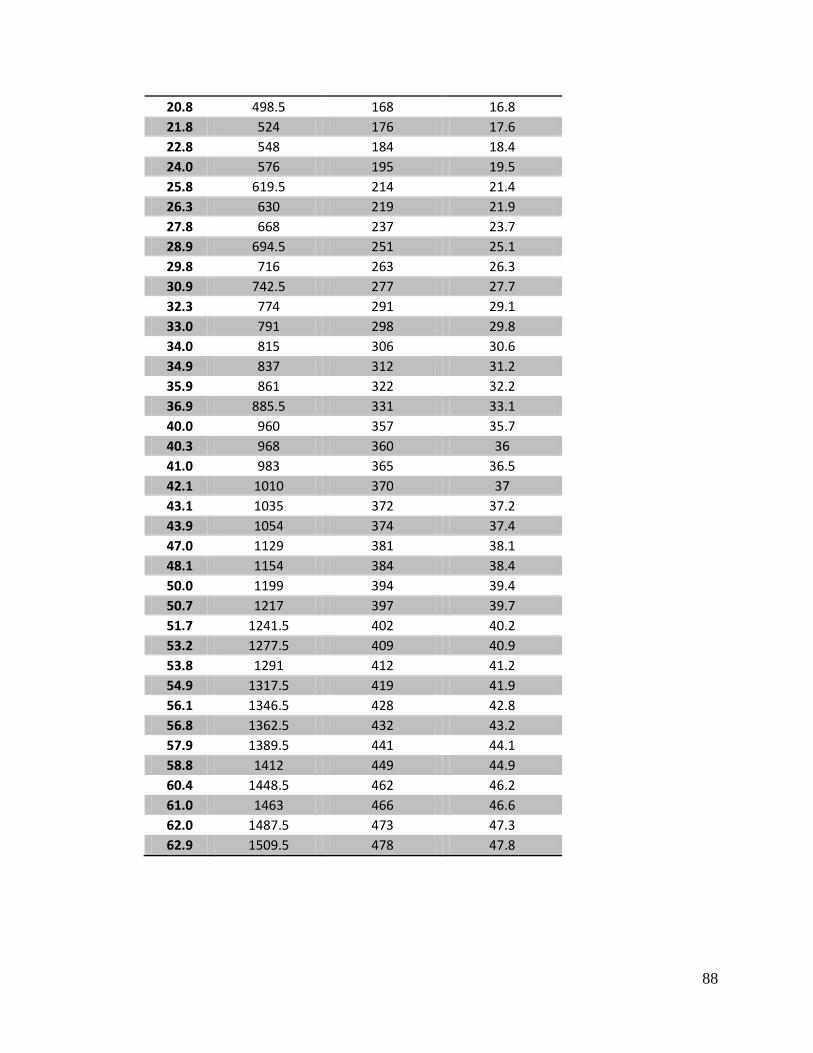
88
20.8 498.5 168 16.8 21.8 524 176 17.6 22.8 548 184 18.4 24.0 576 195 19.5 25.8 619.5 214 21.4 26.3 630 219 21.9 27.8 668 237 23.7 28.9 694.5 251 25.1 29.8 716 263 26.3 30.9 742.5 277 27.7 32.3 774 291 29.1 33.0 791 298 29.8 34.0 815 306 30.6 34.9 837 312 31.2 35.9 861 322 32.2 36.9 885.5 331 33.1 40.0 960 357 35.7 40.3 968 360 36 41.0 983 365 36.5 42.1 1010 370 37 43.1 1035 372 37.2 43.9 1054 374 37.4 47.0 1129 381 38.1 48.1 1154 384 38.4 50.0 1199 394 39.4 50.7 1217 397 39.7 51.7 1241.5 402 40.2 53.2 1277.5 409 40.9 53.8 1291 412 41.2 54.9 1317.5 419 41.9 56.1 1346.5 428 42.8 56.8 1362.5 432 43.2 57.9 1389.5 441 44.1 58.8 1412 449 44.9 60.4 1448.5 462 46.2 61.0 1463 466 46.6 62.0 1487.5 473 47.3 62.9 1509.5 478 47.8
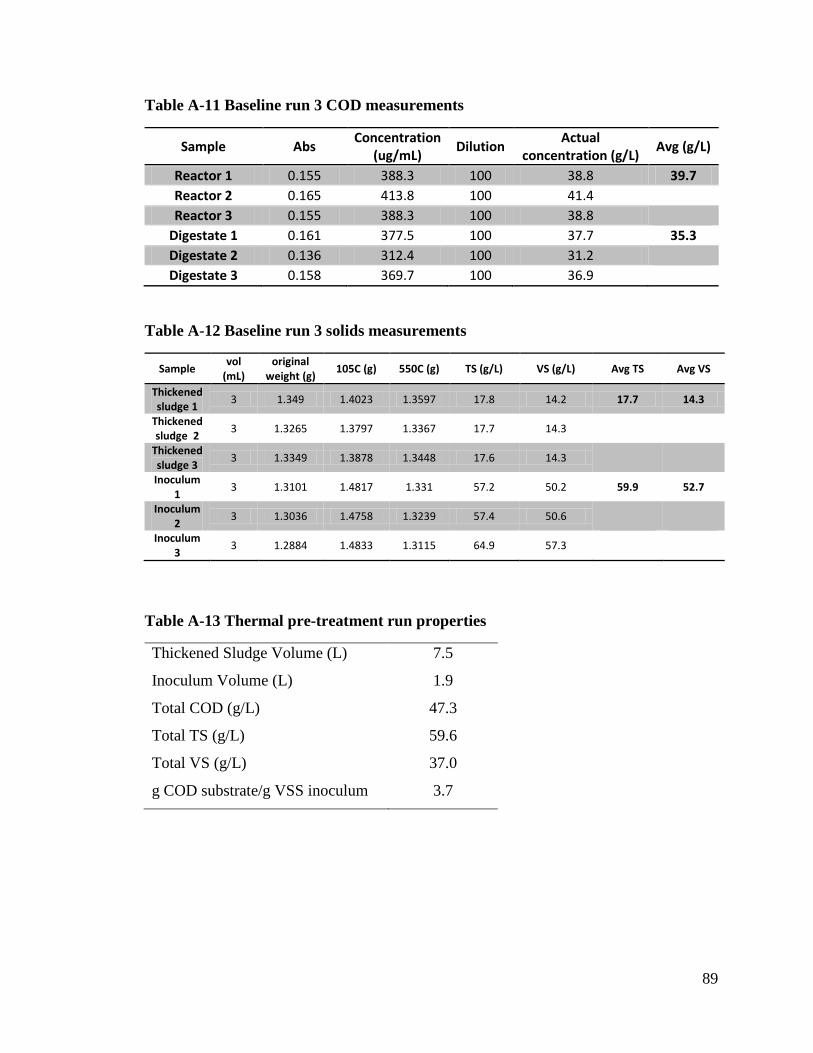
89
Table A-11 Baseline run 3 COD measurements
Sample Abs Concentration (ug/mL) Dilution Actual
concentration (g/L) Avg (g/L)
Reactor 1 0.155 388.3 100 38.8 39.7 Reactor 2 0.165 413.8 100 41.4 Reactor 3 0.155 388.3 100 38.8
Digestate 1 0.161 377.5 100 37.7 35.3 Digestate 2 0.136 312.4 100 31.2 Digestate 3 0.158 369.7 100 36.9
Table A-12 Baseline run 3 solids measurements
Sample vol (mL)
original weight (g) 105C (g) 550C (g) TS (g/L) VS (g/L) Avg TS Avg VS
Thickened sludge 1 3 1.349 1.4023 1.3597 17.8 14.2 17.7 14.3
Thickened sludge 2 3 1.3265 1.3797 1.3367 17.7 14.3
Thickened sludge 3 3 1.3349 1.3878 1.3448 17.6 14.3
Inoculum 1 3 1.3101 1.4817 1.331 57.2 50.2 59.9 52.7
Inoculum 2 3 1.3036 1.4758 1.3239 57.4 50.6
Inoculum 3 3 1.2884 1.4833 1.3115 64.9 57.3
Table A-13 Thermal pre-treatment run properties
Thickened Sludge Volume (L) 7.5
Inoculum Volume (L) 1.9
Total COD (g/L) 47.3
Total TS (g/L) 59.6
Total VS (g/L) 37.0
g COD substrate/g VSS inoculum 3.7

90
Table A-14 Thermal pre-treatment run biogas production
Days Time (hours) Tips ± 1% Volume (L)
0.0 0 0 0 0.3 8 15 1.5 1.0 25 26 2.6 3.1 74 38 3.8 5.7 136 50 5 7.0 168 61 6.1 7.3 175 65 6.5 9.3 223 72 7.2
10.3 247 75 7.5 12.0 287 78 7.8 12.6 303 81 8.1 14.3 344 87 8.7 15.4 369 91 9.1 16.1 386 95 9.5 17.0 409 100 10 17.3 415 109 10.9 18.2 437 116 11.6 19.3 464 123 12.3 20.6 494 137 13.7 22.1 531 152 15.2 23.1 554 165 16.5 24.1 578.5 182 18.2 26.1 625.5 222 22.2 26.6 638 237 23.7 27.2 653 258 25.8 28.1 674 289 28.9 29.1 697.5 327 32.7 30.4 730 372 37.2 31.1 747 391 39.1 32.5 781 417 41.7 33.5 803 434 43.4 34.3 822 449 44.9 35.2 845.5 463 46.3 36.3 871 470 47 38.2 917 479 47.9 40.2 964 486 48.6 42.0 1007 498 49.8 43.0 1033 511 51.1 43.9 1053 521 52.1
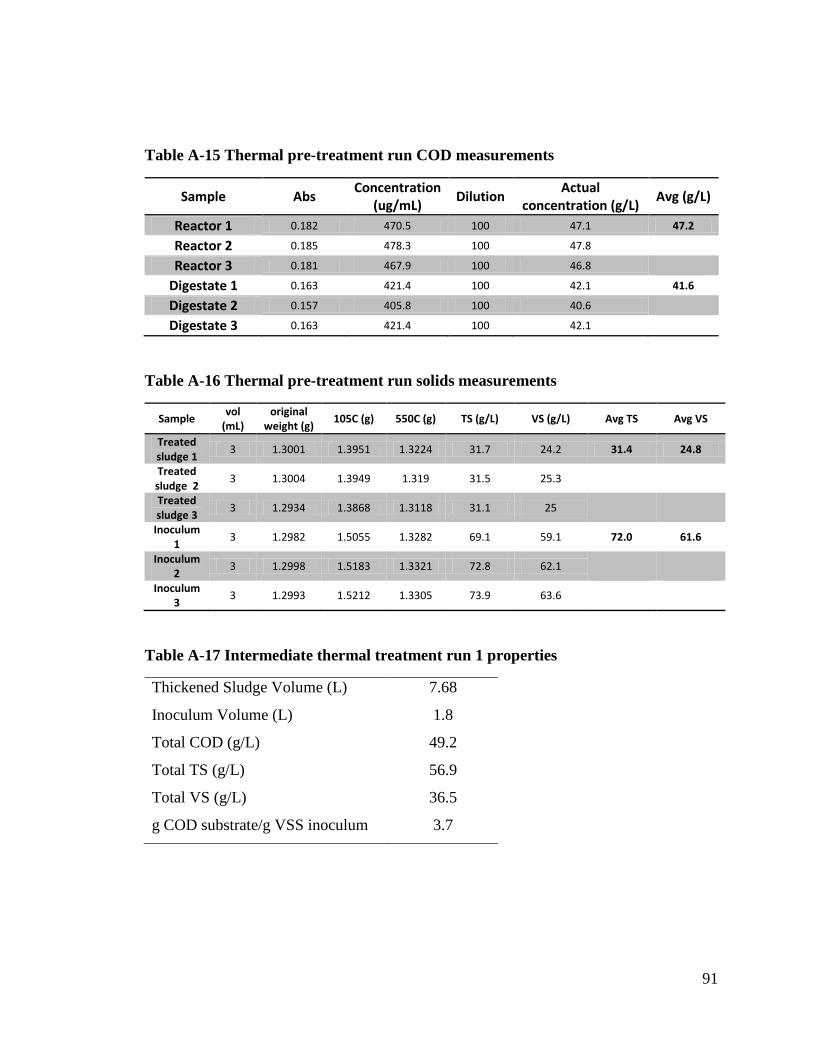
91
Table A-15 Thermal pre-treatment run COD measurements
Sample Abs Concentration (ug/mL) Dilution Actual
concentration (g/L) Avg (g/L)
Reactor 1 0.182 470.5 100 47.1 47.2
Reactor 2 0.185 478.3 100 47.8 Reactor 3 0.181 467.9 100 46.8
Digestate 1 0.163 421.4 100 42.1 41.6
Digestate 2 0.157 405.8 100 40.6 Digestate 3 0.163 421.4 100 42.1
Table A-16 Thermal pre-treatment run solids measurements
Sample vol (mL)
original weight (g) 105C (g) 550C (g) TS (g/L) VS (g/L) Avg TS Avg VS
Treated sludge 1 3 1.3001 1.3951 1.3224 31.7 24.2 31.4 24.8
Treated sludge 2 3 1.3004 1.3949 1.319 31.5 25.3 Treated sludge 3 3 1.2934 1.3868 1.3118 31.1 25
Inoculum 1 3 1.2982 1.5055 1.3282 69.1 59.1 72.0 61.6
Inoculum 2 3 1.2998 1.5183 1.3321 72.8 62.1
Inoculum 3 3 1.2993 1.5212 1.3305 73.9 63.6
Table A-17 Intermediate thermal treatment run 1 properties
Thickened Sludge Volume (L) 7.68
Inoculum Volume (L) 1.8
Total COD (g/L) 49.2
Total TS (g/L) 56.9
Total VS (g/L) 36.5
g COD substrate/g VSS inoculum 3.7

92
Table A-18 Intermediate thermal treatment run 1 biogas production
Days Time (hours) Tips ± 1% Volume (L)
0.0 0 0 0 0.8 19 50 5 1.0 25 68 6.8 1.4 34 89 8.9 2.0 47.5 118 11.8 3.1 75 174 17.4 3.8 91 200 20 4.0 96 207 20.7 4.8 114 232 23.2 5.0 120 238 23.8 6.0 144 261 26.1 6.9 166 285 28.5 8.0 191 311 31.1
10.9 261 391 39.1 11.8 282 403 40.3 12.8 307 441 44.1 13.1 314.5 455 45.5 13.8 330.5 482 48.2 14.8 355 518 51.8 15.0 359 524 52.4 17.8 426 579 57.9 18.1 435 583 58.3 18.7 448 602 60.2 18.9 453.5 609 60.9 19.7 473 624 62.4 20.8 500 637 63.7 21.7 521 645 64.5 24.6 591 668 66.8 25.1 602 668 66.8 25.2 604 672 67.2 26.1 626.5 679 67.9 26.4 634 683 68.3 26.8 642.5 688 68.8 27.3 654 693 69.3 27.7 665.5 701 70.1 28.5 684.5 709 70.9 29.1 699 713 71.3 30.1 722 720 72 30.8 739 723 72.3

93
31.1 746 731 73.1 31.7 760 740 74 32.8 787 755 75.5 33.8 810 767 76.7 35.2 845.5 792 79.2 36.6 877.5 818 81.8 37.4 897.5 833 83.3 38.4 922 849 84.9 39.4 946 860 86 40.4 970 868 86.8
Table A-19 Intermediate thermal treatment run 1 COD measurements
Sample Abs Concentration (ug/mL) Dilution Actual
concentration (g/L) Avg (g/L)
Reactor 1 0.171 403.5 100 40.3 49.2
Reactor 2 0.162 380.1 100 38.0 Reactor 3 0.180 426.9 100 42.7 Reactor 4 0.177 419.1 100 41.9 Reactor 5 0.250 609.0 100 60.9 Reactor 6 0.253 616.8 100 61.7 Reactor 7 0.222 536.2 100 53.6 Reactor 8 0.234 567.4 100 56.7 Reactor 9 0.196 468.5 100 46.9
Digestate 1 0.234 605.2 50 30.3 32.7
Digestate 2 0.246 636.2 50 31.8 Digestate 3 0.243 628.5 50 31.4 Digestate 4 0.258 667.3 50 33.4
Digestate 5 0.260 672.5 50 33.6
Digestate 6 0.274 708.7 50 35.4
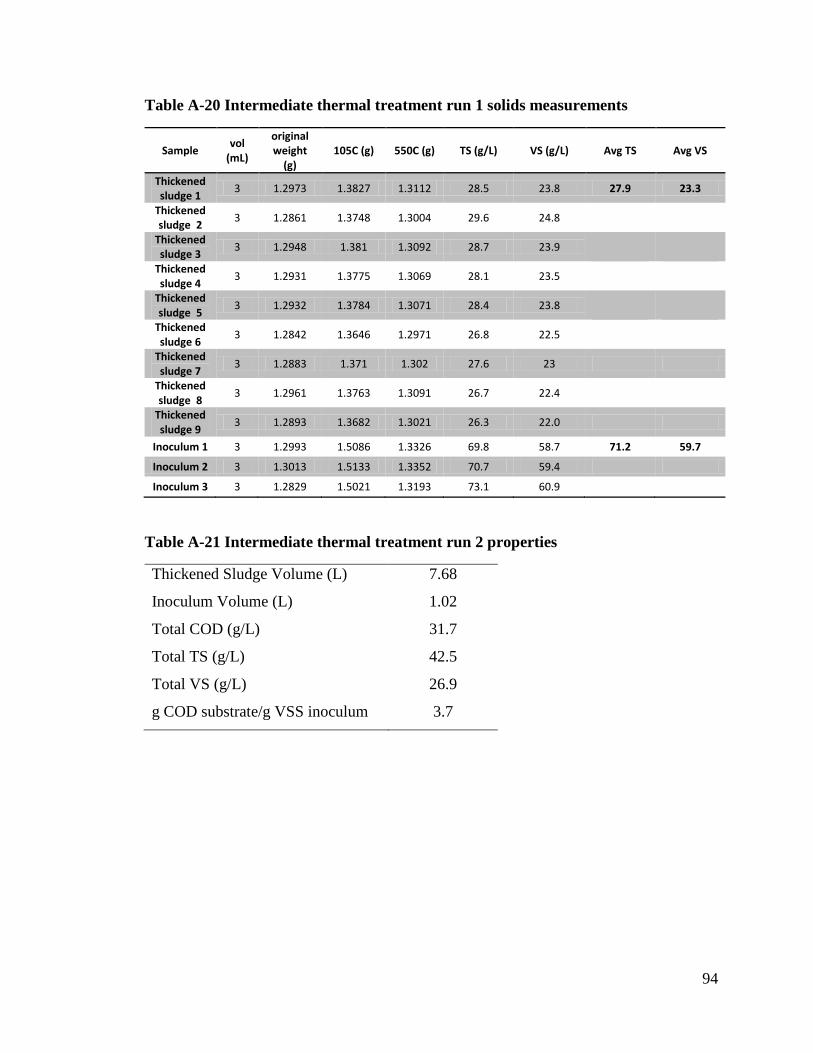
94
Table A-20 Intermediate thermal treatment run 1 solids measurements
Sample vol (mL)
original weight
(g) 105C (g) 550C (g) TS (g/L) VS (g/L) Avg TS Avg VS
Thickened sludge 1 3 1.2973 1.3827 1.3112 28.5 23.8 27.9 23.3
Thickened sludge 2 3 1.2861 1.3748 1.3004 29.6 24.8
Thickened sludge 3 3 1.2948 1.381 1.3092 28.7 23.9
Thickened sludge 4 3 1.2931 1.3775 1.3069 28.1 23.5
Thickened sludge 5 3 1.2932 1.3784 1.3071 28.4 23.8
Thickened sludge 6 3 1.2842 1.3646 1.2971 26.8 22.5
Thickened sludge 7 3 1.2883 1.371 1.302 27.6 23
Thickened sludge 8 3 1.2961 1.3763 1.3091 26.7 22.4
Thickened sludge 9 3 1.2893 1.3682 1.3021 26.3 22.0
Inoculum 1 3 1.2993 1.5086 1.3326 69.8 58.7 71.2 59.7
Inoculum 2 3 1.3013 1.5133 1.3352 70.7 59.4
Inoculum 3 3 1.2829 1.5021 1.3193 73.1 60.9
Table A-21 Intermediate thermal treatment run 2 properties
Thickened Sludge Volume (L) 7.68
Inoculum Volume (L) 1.02
Total COD (g/L) 31.7
Total TS (g/L) 42.5
Total VS (g/L) 26.9
g COD substrate/g VSS inoculum 3.7
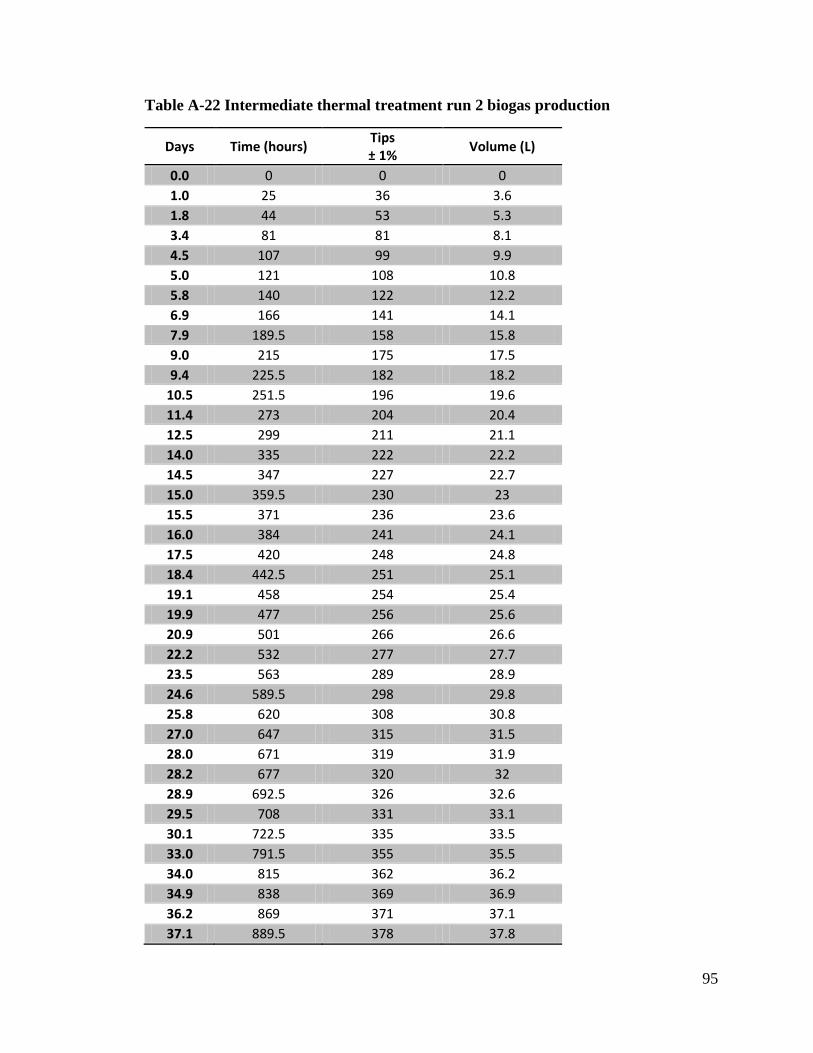
95
Table A-22 Intermediate thermal treatment run 2 biogas production
Days Time (hours) Tips ± 1% Volume (L)
0.0 0 0 0 1.0 25 36 3.6 1.8 44 53 5.3 3.4 81 81 8.1 4.5 107 99 9.9 5.0 121 108 10.8 5.8 140 122 12.2 6.9 166 141 14.1 7.9 189.5 158 15.8 9.0 215 175 17.5 9.4 225.5 182 18.2
10.5 251.5 196 19.6 11.4 273 204 20.4 12.5 299 211 21.1 14.0 335 222 22.2 14.5 347 227 22.7 15.0 359.5 230 23 15.5 371 236 23.6 16.0 384 241 24.1 17.5 420 248 24.8 18.4 442.5 251 25.1 19.1 458 254 25.4 19.9 477 256 25.6 20.9 501 266 26.6 22.2 532 277 27.7 23.5 563 289 28.9 24.6 589.5 298 29.8 25.8 620 308 30.8 27.0 647 315 31.5 28.0 671 319 31.9 28.2 677 320 32 28.9 692.5 326 32.6 29.5 708 331 33.1 30.1 722.5 335 33.5 33.0 791.5 355 35.5 34.0 815 362 36.2 34.9 838 369 36.9 36.2 869 371 37.1 37.1 889.5 378 37.8

96
39.2 940 389 38.9 40.1 961.5 392 39.2 41.0 983 396 39.6 42.3 1015 403 40.3 43.3 1038 407 40.7 44.3 1062 411 41.1 46.3 1111.5 418 41.8 47.0 1127.5 420 42 48.0 1152.5 423 42.3 49.2 1180 425 42.5 50.1 1202 427 42.7 54.1 1299 436 43.6
Table A-23 Intermediate thermal treatment run 2 COD measurements
Sample Abs Concentration (ug/mL) Dilution Actual
concentration (g/L) Avg (g/L)
Reactor 1 0.245 617.1 50 30.9 31.7 Reactor 2 0.276 695.9 50 34.8 Reactor 3 0.234 589.1 50 29.5
Digestate 1 0.196 468.5 50 23.4 23.4 Digestate 2 0.193 460.7 50 23.0 Digestate 3 0.198 473.7 50 23.7
Table A-24 Intermediate thermal treatment run 2 solids measurements
Sample vol (mL)
original weight
(g) 105C (g) 550C (g) TS (g/L) VS (g/L) Avg TS Avg VS
Thickened sludge 1 3 1.3057 1.3707 1.3177 21.7 17.7 22.5 18.2
Thickened sludge 2 3 1.3032 1.3728 1.3171 23.2 18.6
Thickened sludge 3 3 1.303 1.3713 1.3165 22.8 18.3
Inoculum 1 3 1.3101 1.4817 1.331 57.2 50.2 59.9 52.7
Inoculum 2 3 1.3036 1.4758 1.3239 57.4 50.6
Inoculum 3 3 1.2884 1.4833 1.3115 64.9 57.3

97
Figure A-4 GC calibration for CO2
Figure A-5 GC calibration for CH4
y = 0.0002x + 1.3255 R² = 0.9998
0
20
40
60
80
100
120
0 100000 200000 300000 400000 500000 600000
perc
enta
ge
area reading
Carbon Dioxide GC Standards
y = 0.0009x - 3.3013 R² = 0.9921
-20
0
20
40
60
80
100
120
0 20000 40000 60000 80000 100000 120000
perc
enta
ge
area reading
Methane GC Standards

98
Table A-25 GC measurements for bench-scale experiments
Run GC reading for CO2
GC reading for CH4
% CO2 % CH4
Baseline 1 215654 63254 44.5 53.6 Baseline 2 243318 59246 50.0 50.0 Baseline 3 199584 65326 41.2 55.5
Intermediate thermal
treatment 1 219694 61291 45.3 51.9
Intermediate thermal
treatment 1 189512 66780 39.2 56.8
* Note: no GC measurements were done for the initial thermal treatment run due to reactor overloading issue. The GC measurement was done before the first time that the reactor had to be opened to do thermal treatments for the intermediate thermal treatment runs
Monitoring volatile fatty acids and alkalinity is very important in a continuous AD
process; they are indicators of reactor performance. For VFA and alkalinity analysis,
50mL of reactor digestate was obtained. H2SO4 (0.1N) was used to first titrate the sample
to a pH of 4, and with this volume recorded, the sample was further titrated to a pH of 3.3.
The sample was then boiled for 3 minutes on a hot plate and allowed to cool back to
room temperature. NaOH was then used to titrate the sample back to a pH of 7 (Kerri,
1999). The following formulas were used in the calculation of VFA and alkalinity.
Volatile Fatty Acids
𝑻𝒐𝒕𝒂𝒍 𝒂𝒍𝒌𝒂𝒍𝒊𝒏𝒊𝒕𝒚 = (𝒗𝒐𝒍𝒖𝒎𝒆 𝒐𝒇 𝒂𝒄𝒊𝒅)(𝒏𝒐𝒓𝒎𝒂𝒍𝒊𝒕𝒚 𝒐𝒇 𝒂𝒄𝒊𝒅)𝒗𝒐𝒍𝒖𝒎𝒆 𝒐𝒇 𝒔𝒂𝒎𝒑𝒍𝒆
(3)
𝑽𝑭𝑨 = (𝒗𝒐𝒍𝒖𝒎𝒆 𝒐𝒇 𝒃𝒂𝒔𝒆)(𝒏𝒐𝒓𝒎𝒂𝒍𝒊𝒕𝒚 𝒐𝒇 𝒃𝒂𝒔𝒆)𝒗𝒐𝒍𝒖𝒎𝒆 𝒐𝒇 𝒔𝒂𝒎𝒑𝒍𝒆
, (4)
𝑖𝑓 𝑉𝐹𝐴 > 180 𝑚𝑔𝐿𝑡ℎ𝑒𝑛 𝑚𝑢𝑙𝑡𝑖𝑝𝑙𝑦 𝑏𝑦 1.5
99
The reasoning behind multiplying the VFA concentration by 1.5 is unknown and not
explained by Kerri (1999). The VFA/alkalinity ratio is simply the latter (eq. 4) divided by
the former (eq. 3). There are various methods and equipment available for determining
this ratio, and the range of this ratio may vary significantly depending on which is used.
However, it is typically not the absolute value of this ratio that matters, but more
importantly is the trend in this ratio. Once a method is established for a process, the trend
in the ratio should be monitored for indications of potential operational issues.
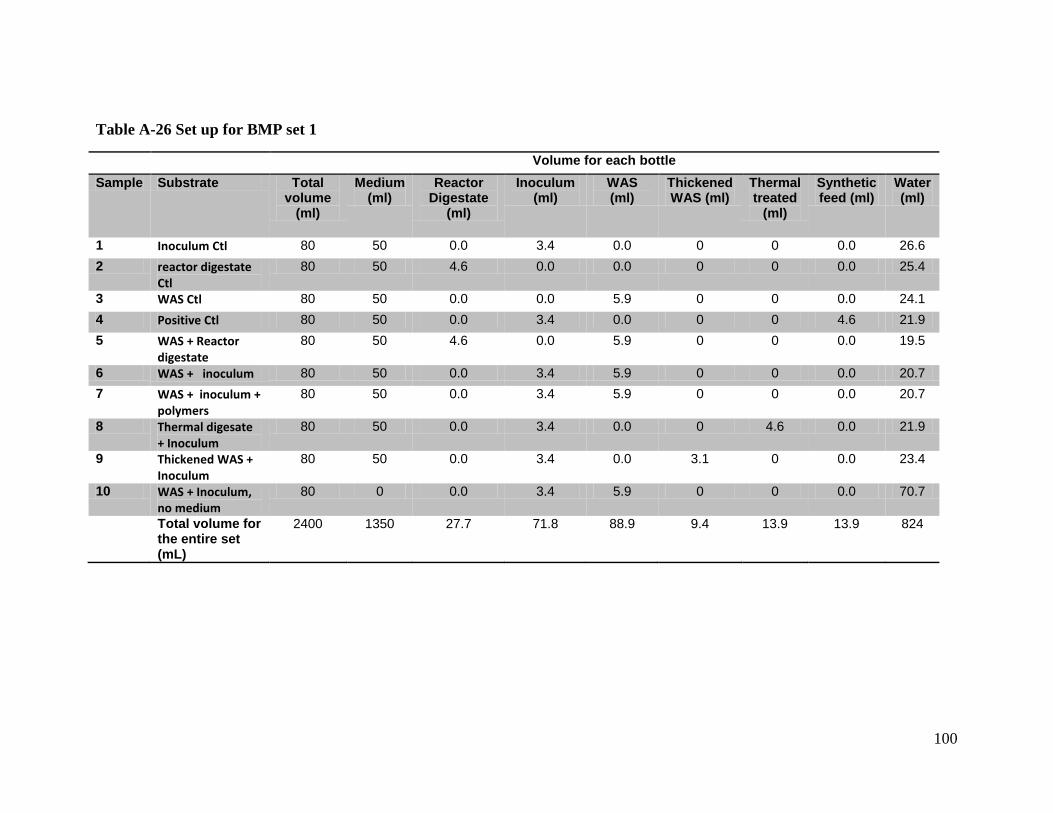
100
Table A-26 Set up for BMP set 1
Volume for each bottle Sample Substrate Total
volume (ml)
Medium (ml)
Reactor Digestate
(ml)
Inoculum (ml)
WAS (ml)
Thickened WAS (ml)
Thermal treated
(ml)
Synthetic feed (ml)
Water (ml)
1 Inoculum Ctl 80 50 0.0 3.4 0.0 0 0 0.0 26.6 2 reactor digestate
Ctl 80 50 4.6 0.0 0.0 0 0 0.0 25.4
3 WAS Ctl 80 50 0.0 0.0 5.9 0 0 0.0 24.1 4 Positive Ctl 80 50 0.0 3.4 0.0 0 0 4.6 21.9 5 WAS + Reactor
digestate 80 50 4.6 0.0 5.9 0 0 0.0 19.5
6 WAS + inoculum 80 50 0.0 3.4 5.9 0 0 0.0 20.7 7 WAS + inoculum +
polymers 80 50 0.0 3.4 5.9 0 0 0.0 20.7
8 Thermal digesate + Inoculum
80 50 0.0 3.4 0.0 0 4.6 0.0 21.9
9 Thickened WAS + Inoculum
80 50 0.0 3.4 0.0 3.1 0 0.0 23.4
10 WAS + Inoculum, no medium
80 0 0.0 3.4 5.9 0 0 0.0 70.7
Total volume for the entire set (mL)
2400 1350 27.7 71.8 88.9 9.4 13.9 13.9 824
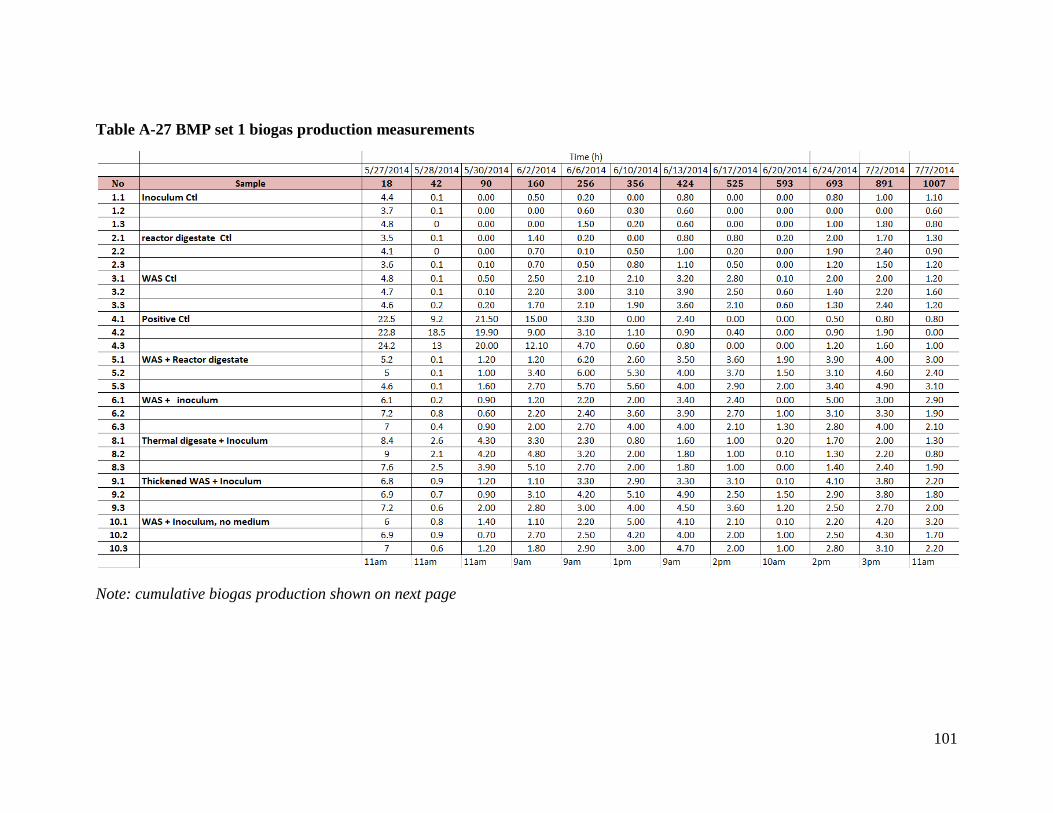
101
Table A-27 BMP set 1 biogas production measurements
Note: cumulative biogas production shown on next page
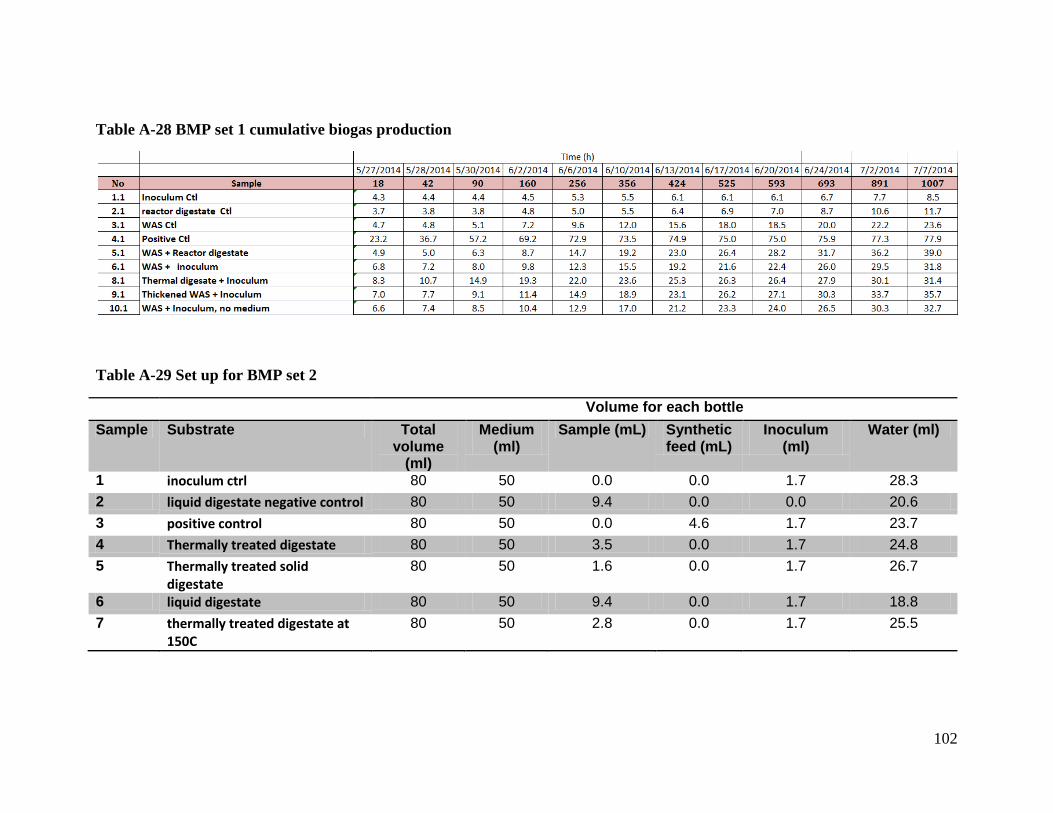
102
Table A-28 BMP set 1 cumulative biogas production
Table A-29 Set up for BMP set 2
Volume for each bottle Sample Substrate Total
volume (ml)
Medium (ml)
Sample (mL) Synthetic feed (mL)
Inoculum (ml)
Water (ml)
1 inoculum ctrl 80 50 0.0 0.0 1.7 28.3 2 liquid digestate negative control 80 50 9.4 0.0 0.0 20.6 3 positive control 80 50 0.0 4.6 1.7 23.7 4 Thermally treated digestate 80 50 3.5 0.0 1.7 24.8 5 Thermally treated solid
digestate 80 50 1.6 0.0 1.7 26.7
6 liquid digestate 80 50 9.4 0.0 1.7 18.8 7 thermally treated digestate at
150C 80 50 2.8 0.0 1.7 25.5
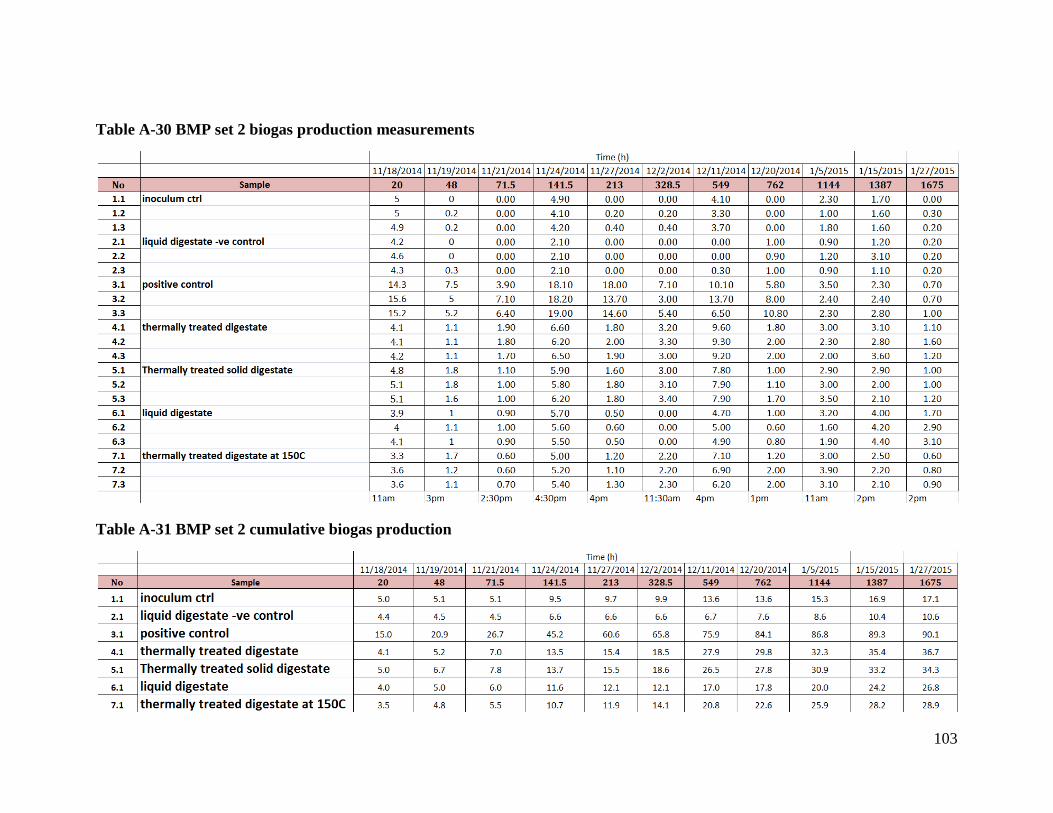
103
Table A-30 BMP set 2 biogas production measurements
Table A-31 BMP set 2 cumulative biogas production
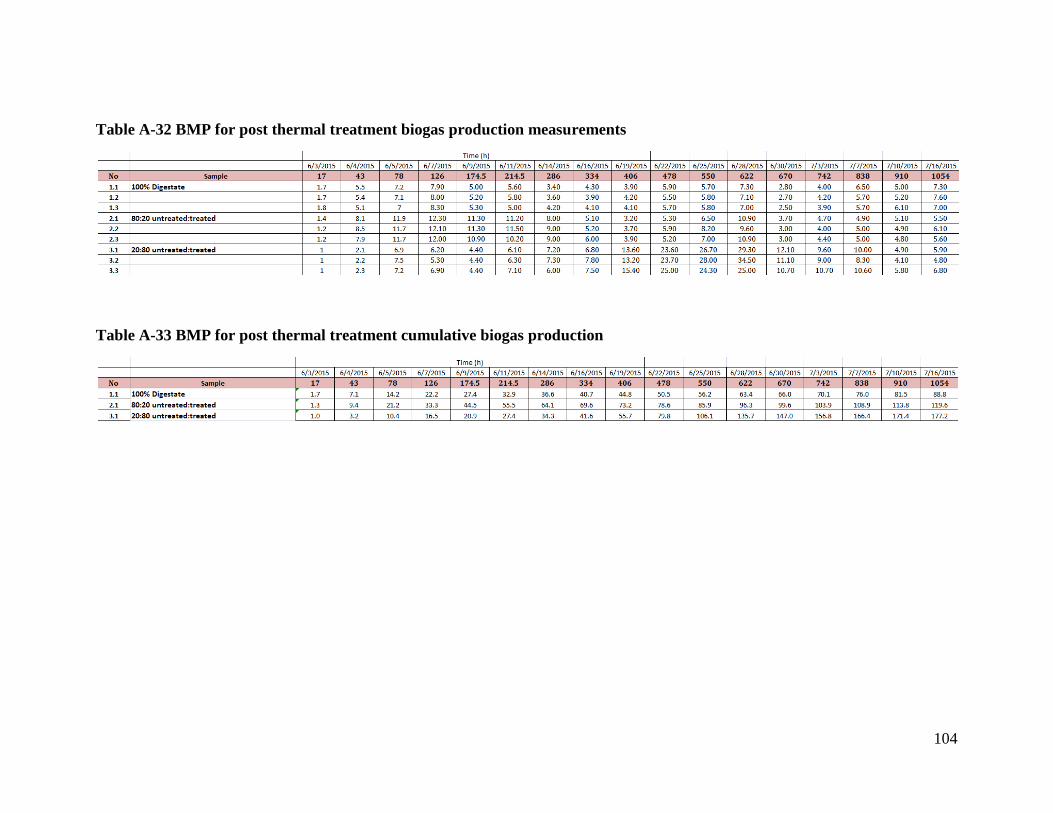
104
Table A-32 BMP for post thermal treatment biogas production measurements
Table A-33 BMP for post thermal treatment cumulative biogas production

105
Appendix B. Sample calculations All values used in the samples are from baseline run 1 unless otherwise stated
Initial COD = 49.9 g/L
COD, TS, VS reduction (Table 5-2 and Table 5-4)
Final COD = 35.5 g/L
𝐶𝑂𝐷 𝑟𝑒𝑑𝑢𝑐𝑡𝑖𝑜𝑛 =(49.9 − 35.5)
49.9× 100% = 28.8%
Initial TS = 55.1 g/L
Final TS = 41.4 g/L
𝑇𝑆 𝑟𝑒𝑑𝑢𝑐𝑡𝑖𝑜𝑛 =(55.1 − 41.4)
55.1× 100% = 24.9%
Initial VS = 34.5 g/L
Final VS = 29.1g/L
𝑉𝑆 𝑟𝑒𝑑𝑢𝑐𝑡𝑖𝑜𝑛 =(34.5 − 29.1)
34.5× 100% = 15.7%
* Values for baseline 3 is used, because the calculation for the specific methane yield
after the post treatment is also shown
Specific methane yield (Table 5-4)
Volume of biogas produced = 48.9L
Total COD in the reactor = 362.2g
𝑆𝑝𝑒𝑐𝑖𝑓𝑖𝑐 𝑚𝑒𝑡ℎ𝑎𝑛𝑒 𝑦𝑖𝑒𝑙𝑑 =48900𝑚𝐿
362.2𝑔∗ 0.60 = 79𝑚𝐿 𝐶𝐻4/𝑔𝐶𝑂𝐷
Specific methane yield for the post-thermal treatment unconventional BMP tests
Volume of biogas produced in 80:20 mixture in BMP bottles = 177.2mL
Liquid volume in BMP bottle = 0.080L
Liquid volume in reactor = 9.0L
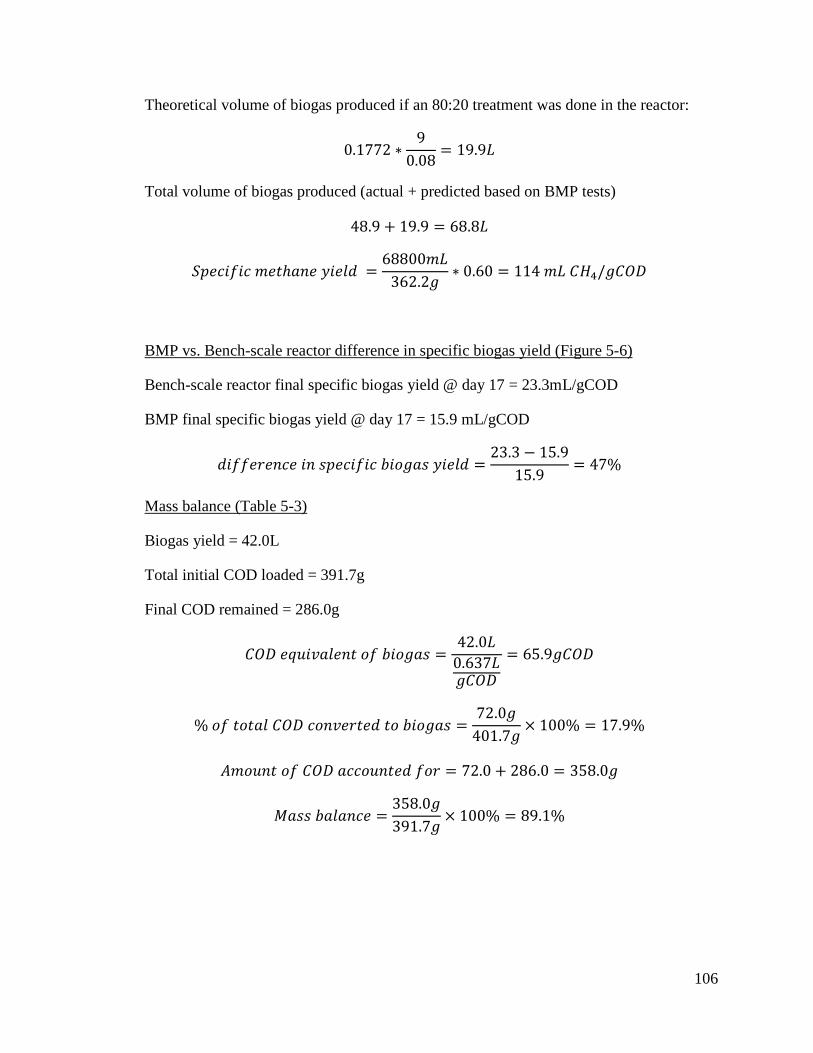
106
Theoretical volume of biogas produced if an 80:20 treatment was done in the reactor:
0.1772 ∗9
0.08= 19.9𝐿
Total volume of biogas produced (actual + predicted based on BMP tests)
48.9 + 19.9 = 68.8𝐿
𝑆𝑝𝑒𝑐𝑖𝑓𝑖𝑐 𝑚𝑒𝑡ℎ𝑎𝑛𝑒 𝑦𝑖𝑒𝑙𝑑 =68800𝑚𝐿
362.2𝑔∗ 0.60 = 114 𝑚𝐿 𝐶𝐻4/𝑔𝐶𝑂𝐷
Bench-scale reactor final specific biogas yield @ day 17 = 23.3mL/gCOD
BMP vs. Bench-scale reactor difference in specific biogas yield (Figure 5-6)
BMP final specific biogas yield @ day 17 = 15.9 mL/gCOD
𝑑𝑖𝑓𝑓𝑒𝑟𝑒𝑛𝑐𝑒 𝑖𝑛 𝑠𝑝𝑒𝑐𝑖𝑓𝑖𝑐 𝑏𝑖𝑜𝑔𝑎𝑠 𝑦𝑖𝑒𝑙𝑑 =23.3 − 15.9
15.9= 47%
Biogas yield = 42.0L
Mass balance (Table 5-3)
Total initial COD loaded = 391.7g
Final COD remained = 286.0g
𝐶𝑂𝐷 𝑒𝑞𝑢𝑖𝑣𝑎𝑙𝑒𝑛𝑡 𝑜𝑓 𝑏𝑖𝑜𝑔𝑎𝑠 =42.0𝐿
0.637𝐿𝑔𝐶𝑂𝐷
= 65.9𝑔𝐶𝑂𝐷
% 𝑜𝑓 𝑡𝑜𝑡𝑎𝑙 𝐶𝑂𝐷 𝑐𝑜𝑛𝑣𝑒𝑟𝑡𝑒𝑑 𝑡𝑜 𝑏𝑖𝑜𝑔𝑎𝑠 =72.0𝑔
401.7𝑔× 100% = 17.9%
𝐴𝑚𝑜𝑢𝑛𝑡 𝑜𝑓 𝐶𝑂𝐷 𝑎𝑐𝑐𝑜𝑢𝑛𝑡𝑒𝑑 𝑓𝑜𝑟 = 72.0 + 286.0 = 358.0𝑔
𝑀𝑎𝑠𝑠 𝑏𝑎𝑙𝑎𝑛𝑐𝑒 =358.0𝑔391.7𝑔
× 100% = 89.1%
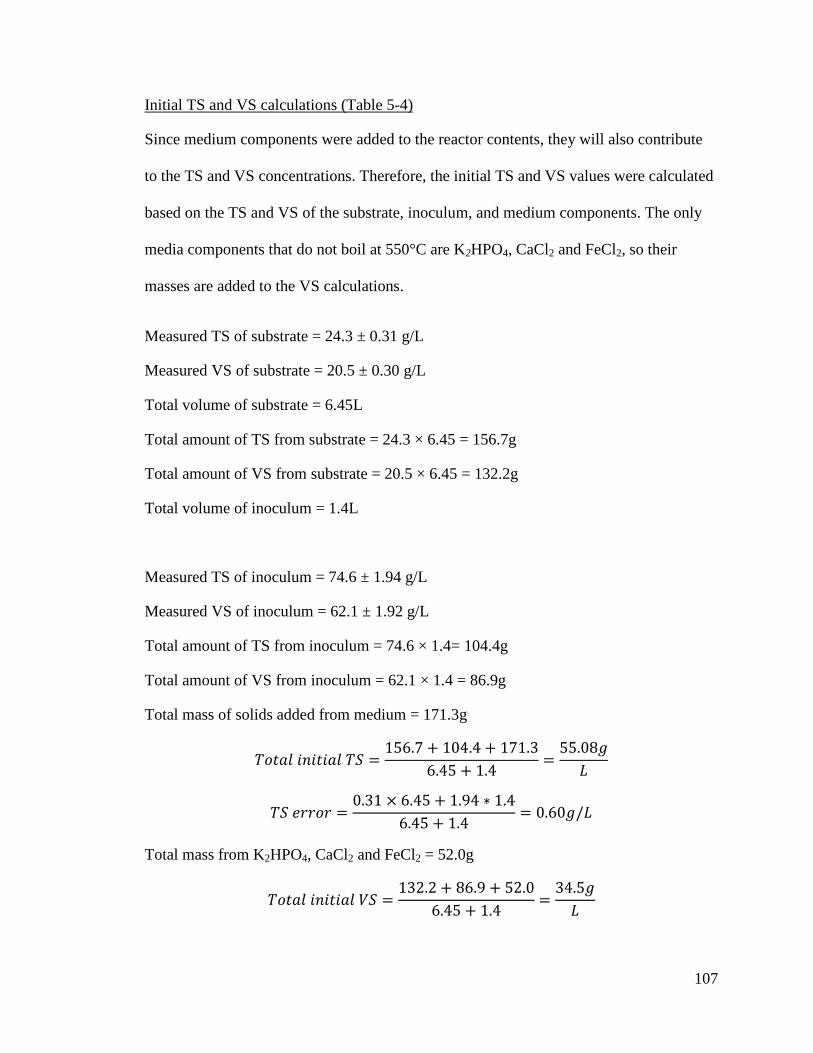
107
Initial TS and VS calculations (Table 5-4)
Since medium components were added to the reactor contents, they will also contribute
to the TS and VS concentrations. Therefore, the initial TS and VS values were calculated
based on the TS and VS of the substrate, inoculum, and medium components. The only
media components that do not boil at 550°C are K2HPO4, CaCl2 and FeCl2, so their
masses are added to the VS calculations.
Measured TS of substrate = 24.3 ± 0.31 g/L
Measured VS of substrate = 20.5 ± 0.30 g/L
Total volume of substrate = 6.45L
Total amount of TS from substrate = 24.3 × 6.45 = 156.7g
Total amount of VS from substrate = 20.5 × 6.45 = 132.2g
Total volume of inoculum = 1.4L
Measured TS of inoculum = 74.6 ± 1.94 g/L
Measured VS of inoculum = 62.1 ± 1.92 g/L
Total amount of TS from inoculum = 74.6 × 1.4= 104.4g
Total amount of VS from inoculum = 62.1 × 1.4 = 86.9g
Total mass of solids added from medium = 171.3g
𝑇𝑜𝑡𝑎𝑙 𝑖𝑛𝑖𝑡𝑖𝑎𝑙 𝑇𝑆 =156.7 + 104.4 + 171.3
6.45 + 1.4=
55.08𝑔𝐿
𝑇𝑆 𝑒𝑟𝑟𝑜𝑟 =0.31 × 6.45 + 1.94 ∗ 1.4
6.45 + 1.4= 0.60𝑔/𝐿
Total mass from K2HPO4, CaCl2 and FeCl2 = 52.0g
𝑇𝑜𝑡𝑎𝑙 𝑖𝑛𝑖𝑡𝑖𝑎𝑙 𝑉𝑆 =132.2 + 86.9 + 52.0
6.45 + 1.4=
34.5𝑔𝐿

108
𝑉𝑆 𝑒𝑟𝑟𝑜𝑟 =0.30 × 6.45 + 1.92 × 1.4
6.45 + 1.4= 0.59𝑔/𝐿

109
Appendix C. BMP biogas production graphs
Figure C-1 Full biogas production graph for BMP test set 1
Figure C-2 Full biogas production graph for BMP test set 2
0.0
10.0
20.0
30.0
40.0
50.0
60.0
70.0
80.0
90.0
0 10 20 30 40 50
Biog
as P
rodu
ctio
n (m
L)
Days
Positive Control
BS + digestate
Thickened BS + GS
Treated digestate + GS
BS + GS
BS Ctrl
Digestate Ctrl
GS Ctrl
0.0
10.0
20.0
30.0
40.0
50.0
60.0
70.0
80.0
90.0
100.0
0 20 40 60 80
Biog
as P
rodu
ctio
n (m
L)
Days
Positive Ctrl
Thermally treated digestate Thermally treated solid digestate Liquid digestate
Inoculum Ctrl
Liquid digestate Ctrl

110
Appendix D. Heavy Hydrocarbon Contaminated Soil Bioremediation
A separate study was conducted during the course of the pulp and paper mill biosludge
work. This study involved examining the anaerobic digestion of heavy hydrocarbon
contaminated soil using BMP tests and a mixture of inocula. Ozonation was also used as
a pre-treatment method to test whether it had any effect on the AD of this soil. This work
is collaborated with the Arizona State University (ASU), and the contaminated soil was
shipped from ASU and the ozonation was also performed at ASU.
A total of 4 different soil samples were received and their total petroleum hydrocarbon
(TPH) concentration was provided by ASU.
Table D-1 Heavy hydrocarbon contaminated soil type and TPH concentrations
Soil TPH (mg/kg) Dry Soil 11000
Dry Ozonated 7000 Wet Soil 15000
Wet Ozonated 10000* * Was not measured, the value is assumed based on the relationship between the dry and dry ozonated soils.
BMP tests were set up in similar manner as described in section 3.5. Instead of biosludge,
a given mass of each soil sample was used in each bottle and the inocula used in each
bottle consisted of 1mL of granular sludge from Tembec, and 1mL of benzene degrading
culture maintained by Fei Luo. The benzene degrading culture is known to act very
slowly relative to the Tembec granular sludge, and it was added to simply provide a
different type of microorganisms that could potentially assist in the degradation of the
heavy hydrocarbons. The biogas production rate is much slower with the soil samples
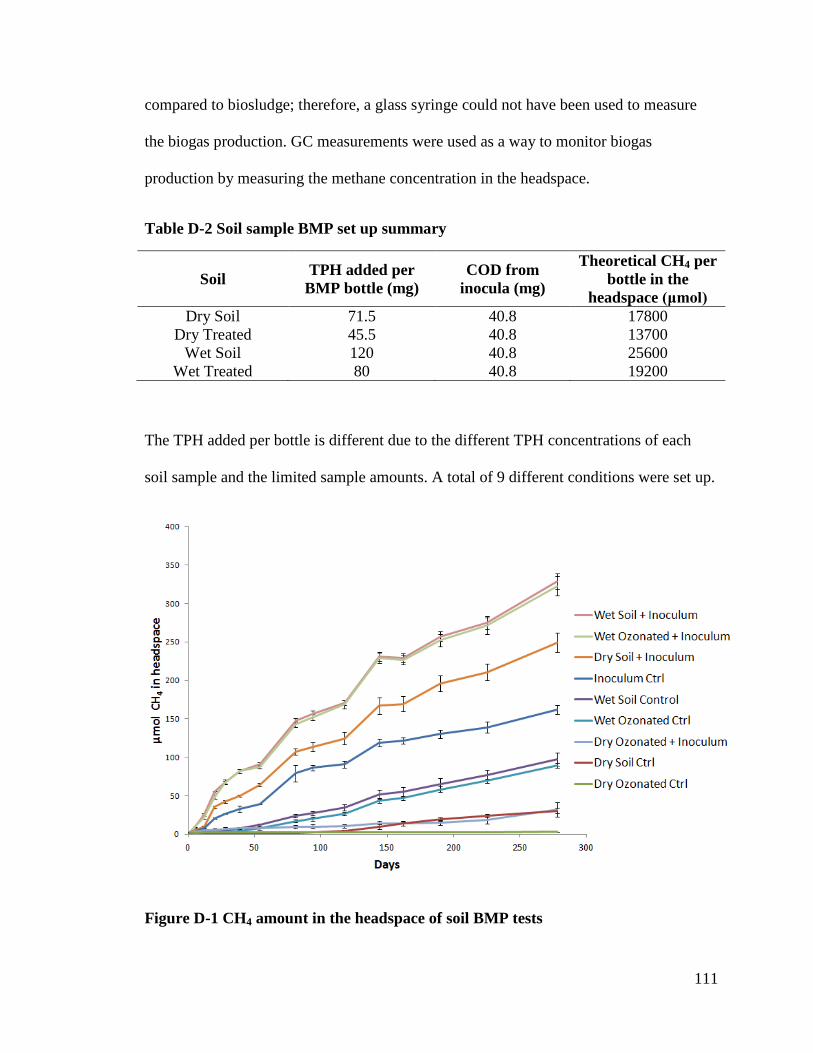
111
compared to biosludge; therefore, a glass syringe could not have been used to measure
the biogas production. GC measurements were used as a way to monitor biogas
production by measuring the methane concentration in the headspace.
Table D-2 Soil sample BMP set up summary
Soil TPH added per BMP bottle (mg)
COD from inocula (mg)
Theoretical CH4 per bottle in the
headspace (μmol) Dry Soil 71.5 40.8 17800
Dry Treated 45.5 40.8 13700 Wet Soil 120 40.8 25600
Wet Treated 80 40.8 19200
The TPH added per bottle is different due to the different TPH concentrations of each
soil sample and the limited sample amounts. A total of 9 different conditions were set up.
Figure D-1 CH4 amount in the headspace of soil BMP tests
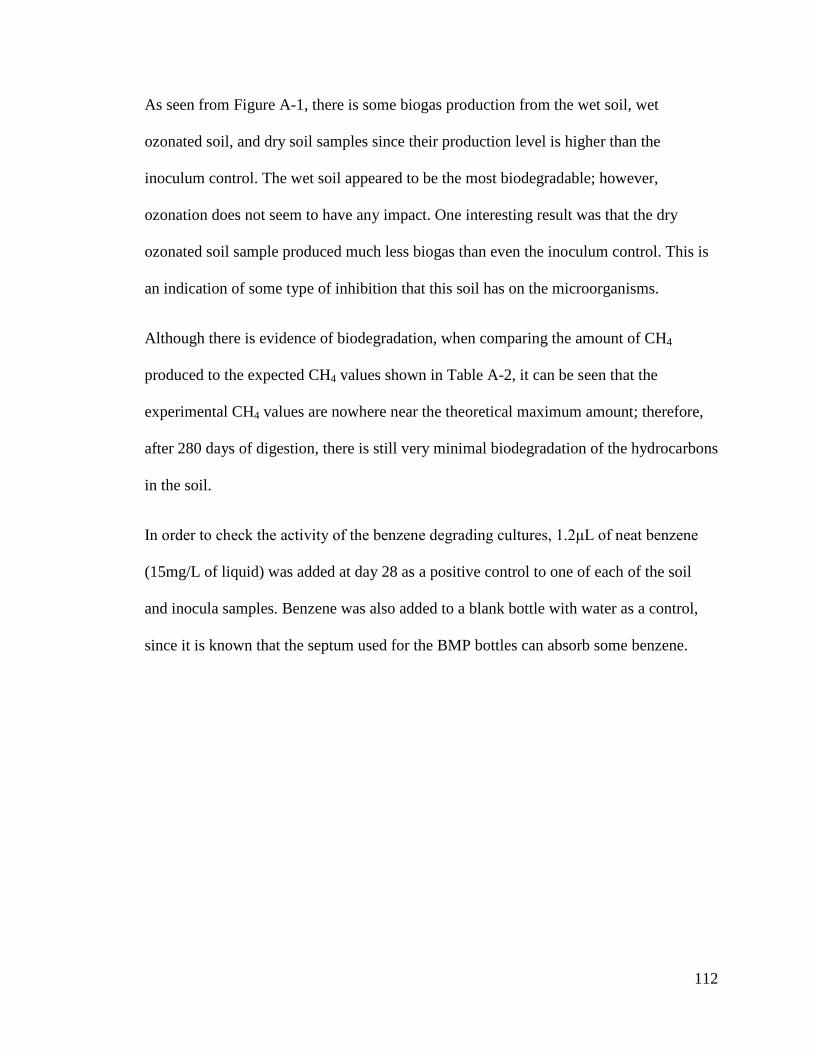
112
As seen from Figure A-1, there is some biogas production from the wet soil, wet
ozonated soil, and dry soil samples since their production level is higher than the
inoculum control. The wet soil appeared to be the most biodegradable; however,
ozonation does not seem to have any impact. One interesting result was that the dry
ozonated soil sample produced much less biogas than even the inoculum control. This is
an indication of some type of inhibition that this soil has on the microorganisms.
Although there is evidence of biodegradation, when comparing the amount of CH4
produced to the expected CH4 values shown in Table A-2, it can be seen that the
experimental CH4 values are nowhere near the theoretical maximum amount; therefore,
after 280 days of digestion, there is still very minimal biodegradation of the hydrocarbons
in the soil.
In order to check the activity of the benzene degrading cultures, 1.2μL of neat benzene
(15mg/L of liquid) was added at day 28 as a positive control to one of each of the soil
and inocula samples. Benzene was also added to a blank bottle with water as a control,
since it is known that the septum used for the BMP bottles can absorb some benzene.
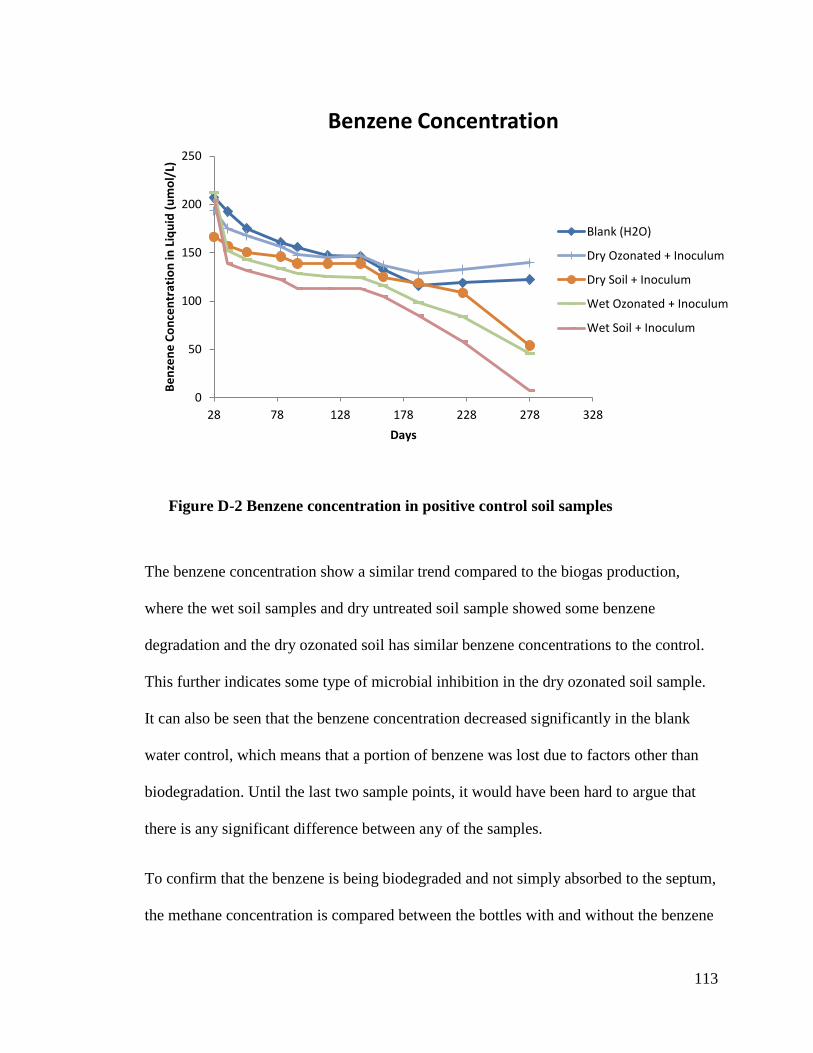
113
Figure D-2 Benzene concentration in positive control soil samples
The benzene concentration show a similar trend compared to the biogas production,
where the wet soil samples and dry untreated soil sample showed some benzene
degradation and the dry ozonated soil has similar benzene concentrations to the control.
This further indicates some type of microbial inhibition in the dry ozonated soil sample.
It can also be seen that the benzene concentration decreased significantly in the blank
water control, which means that a portion of benzene was lost due to factors other than
biodegradation. Until the last two sample points, it would have been hard to argue that
there is any significant difference between any of the samples.
To confirm that the benzene is being biodegraded and not simply absorbed to the septum,
the methane concentration is compared between the bottles with and without the benzene
0
50
100
150
200
250
28 78 128 178 228 278 328
Benz
ene
Conc
entr
atio
n in
Liq
uid
(um
ol/L
)
Days
Benzene Concentration
Blank (H2O)
Dry Ozonated + Inoculum
Dry Soil + Inoculum
Wet Ozonated + Inoculum
Wet Soil + Inoculum
114
addition. The dry ozonated samples were not included in the following analysis due to
the apparent inhibition.
Figure D-3 Methane production comparison between BMP bottles with and without benzene addition
The above figure shows that the samples with benzene added all produced more methane
than the samples without benzene; however, only the wet ozonated soil samples appears
to have the greatest difference, whereas the other two sets of samples have fairly similar
methane concentrations until the last sample point. It’s also important to note that only
one bottle for each condition had benzene added, which means that there are no replicates.
A total of 12μL of neat benzene was added, which is equivalent to 13.5μmol. Anaerobic
benzene degradation follows the following equation (Lovley, 2000):
4𝐶6𝐻6 + 27 𝐻2𝑂 → 15 𝐶𝐻4 + 9 𝐻𝐶𝑂3− + 𝐻+
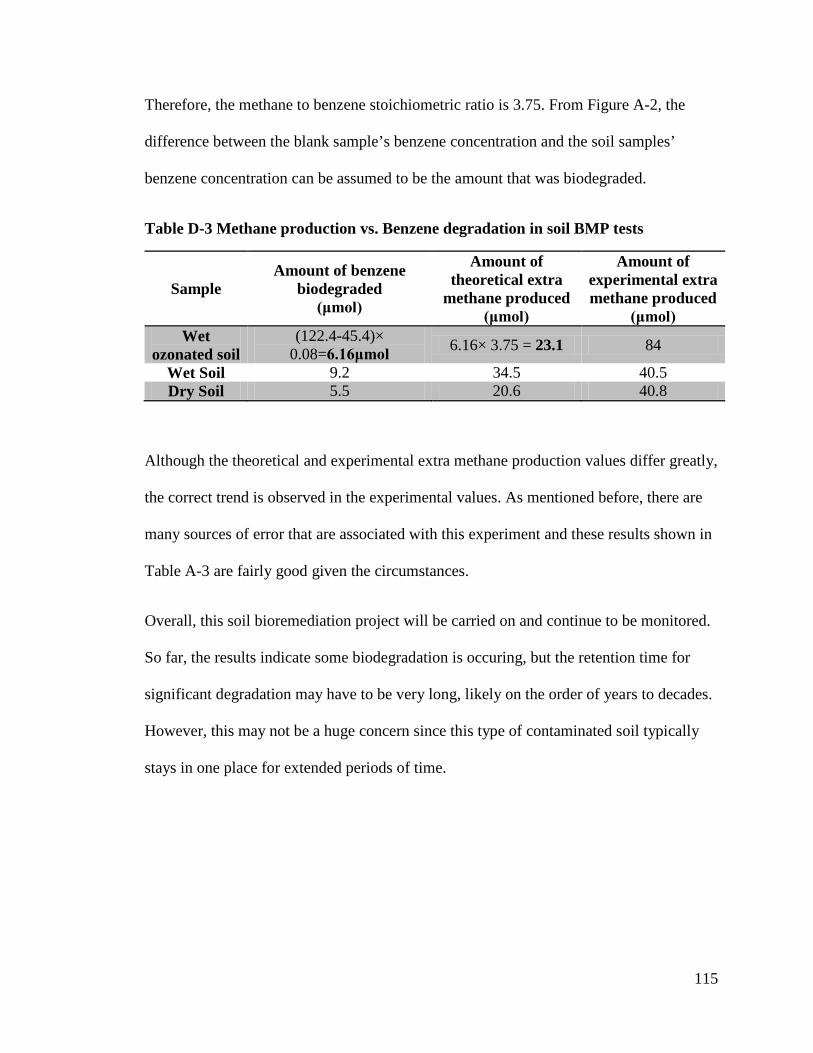
115
Therefore, the methane to benzene stoichiometric ratio is 3.75. From Figure A-2, the
difference between the blank sample’s benzene concentration and the soil samples’
benzene concentration can be assumed to be the amount that was biodegraded.
Table D-3 Methane production vs. Benzene degradation in soil BMP tests
Sample Amount of benzene
biodegraded (μmol)
Amount of theoretical extra
methane produced (μmol)
Amount of experimental extra methane produced
(μmol) Wet
ozonated soil (122.4-45.4)×
0.08=6.16μmol 6.16× 3.75 = 23.1 84
Wet Soil 9.2 34.5 40.5 Dry Soil 5.5 20.6 40.8
Although the theoretical and experimental extra methane production values differ greatly,
the correct trend is observed in the experimental values. As mentioned before, there are
many sources of error that are associated with this experiment and these results shown in
Table A-3 are fairly good given the circumstances.
Overall, this soil bioremediation project will be carried on and continue to be monitored.
So far, the results indicate some biodegradation is occuring, but the retention time for
significant degradation may have to be very long, likely on the order of years to decades.
However, this may not be a huge concern since this type of contaminated soil typically
stays in one place for extended periods of time.