costly dividend signaling: the case of loss firms with ...web.mit.edu/gplesko/www/joosplesko...
TRANSCRIPT

Costly dividend signaling: The case of loss firms with negative cash flows
Peter Joos and George A. Plesko*
First Draft: November 2003 This Draft: January 2004
Abstract We examine the dividend-signaling hypothesis in a sample of firms for which dividend increases are particularly costly, namely loss firms with negative cash flows. When compared to loss firms with positive cash flows, we find the predictive power of dividend increases for future return on assets to be greater for loss firms with negative cash flows, consistent with the predictive power of the dividend signal being stronger when its cost is higher. Our results provide support for the dividend-signaling hypothesis and have broader implications since loss firms comprise a large and increasing share of publicly-traded firms.
Contact information: Sloan School of Management Massachusetts Institute of Technology E52-325, 50 Memorial Drive Cambridge, MA 02142-1347 Joos: 617-253-9459, [email protected] (corresponding author) Plesko: 617-253-2668, [email protected] * We thank Paul Asquith, Joe Weber, and Peter Wysocki for helpful comments.
1
Whether firms signal future prospects through dividend changes has been a source
of debate and research in the corporate finance literature since the early papers by Lintner
(1956) and Miller and Modigliani (1961). Despite considerable research, the debate over
the empirical validity of the dividend-signaling hypothesis remains alive in the literature.
Nissim and Ziv (2001) present evidence consistent with the dividend-signaling
hypothesis by showing dividend increases (but not decreases) relate to future
profitability. However, two recent papers come to different conclusions. Grullon et al.
(2003) argue the results in Nissim and Ziv (2001) follow from a misspecification of the
earnings expectations model used to predict expected earnings. They find the evidence
supporting the dividend-signaling hypothesis disappears when the earnings expectations
model accounts for non-linear patterns in the behavior of earnings.1 In a more general
review of dividend policy, Skinner (2003) concludes structural changes in dividend
policy and the nature of corporate earnings over time rule out signaling, at least in recent
decades. He finds dividends have become too smooth and earnings too volatile for
dividend changes to be an informative signal for future earnings changes.
Although not conclusive, this recent empirical evidence appears to be moving
towards rejecting the dividend-signaling hypothesis.2 In this paper, we contribute to the
debate with a different approach to test the dividend-signaling hypothesis. Instead of
examining dividend behavior for all firms in the market, we examine the dividend-
signaling hypothesis in a setting where use of dividends to signal is particularly costly to
the firm.
Spence (1973) argues the cost of sending an economic signal determines its
informativeness, therefore we test for dividend signaling in a sample of firms that

2
increase their dividend payment (i.e., cash outflow) while experiencing current losses
caused by negative cash flows.3 We argue that, since investors can readily observe the
current loss and its components, management will need to send a strong and credible
signal to convince market participants that performance will improve. We assume that
increasing cash dividends at a time the firm has a negative cash flow constitutes a strong
and costly signal of future performance for two reasons. First, the increase in current
cash dividends will immediately affect the liquidity of the firm. Second, an increase in
the cash dividend implies a strong commitment to maintain the higher level of dividends
in the future, given previous studies document a reluctance of managers to cut dividends
(e.g., Lintner 1956 and Brav et al. 2003).
We test our hypothesis by comparing the predictive power of dividend increases
between loss firms with positive and negative cash flow components for future
performance. We collect a sample of loss observations from 1970-2001 and test whether
a dividend increase provides incremental information in predicting firms’ return on assets
beyond that contained in current earnings and a number of control variables.
Our main results show that, conditioning on cash flows, the signaling power of
dividend increases for loss firms exists only for negative cash flow firms, consistent with
the hypothesis that the costlier the signal is the more information it contains. We verify
our main results in additional analyses focusing on subsamples of firms with multiple
losses for which increased dividend payments are increasingly costly, and on augmented
specifications of our basic model. Although some results are consistent with a loss being
sufficient for a dividend increase to improve forecasts of future returns irrespective of the
sign of the cash flow, all robustness analyses demonstrate the predictive power of
3
dividend increases is larger for loss firms with a negative cash flow than for loss firms
with a positive cash flow.
Our study extends the dividend signaling literature by identifying a particular
segment of firms for which we hypothesize the decision to increase dividends is
particularly costly. Consistent with Spence’s criterion for informative signals, we find
dividends help to predict a firm’s future performance when the dividend signal is costly.
We also extend previous research on the relation between losses and dividends by
focusing on the particular quality of losses that renders the dividend signal costly and
credible, namely the cash flow component of the loss.
In the next section, we discuss related research and motivate our study. In section
II we provide descriptive statistics of the sample and present our empirical model.
Sections III and IV contain our main results and the results of robustness analyses. We
conclude in a final section.
I. Background and motivation
To test the dividend-signaling hypothesis, we evaluate the predictive power of an
increase in cash dividends for future firm performance in a sample of firms that report
current losses. We argue the cost of the dividend signal will determine its
informativeness and distinguish between losses with a negative versus a positive cash
flow component to capture the differential cost of the dividend increase across loss firms.
We are not the first to investigate the relation between dividends and losses. Like
DeAngelo et al. (1992) [hereafter, DDS], we focus on loss firms to study the dividend-
signaling hypothesis, arguing that dividends will have information content when current
4
earnings are an unreliable indicator of future profitability, and that losses provide such a
special context. In a sample of 167 firms over the period 1980-1985, DDS show a loss is
a necessary, but not sufficient, condition for a firm to decrease dividends. They find
firms that decrease dividends experience more severe and more persistent losses than
firms that do not. Further, unusual income items (e.g., special items) are a larger factor in
the earnings of loss firms that do not reduce dividends than of the firms that do. Focusing
explicitly on dividend signaling, they find dividend decreases provide incremental
information to predict future earnings, although their forecasting power diminishes in the
presence of unusual income items.
Using a larger sample over a long time period, Skinner (2003) finds that when
firms paying large dividends experience a loss, the loss is more likely caused by special
items, and more likely to reverse than a loss reported by a firm that does not pay large
dividends.4 In related work, Joos and Plesko (2003) examine a large sample of loss
firms, and the timing of loss reversals. They show the losses of firms that continue to pay
dividends are more likely to reverse than those of non-dividend paying firms, and that
eliminating a dividend is associated with a decrease in the likelihood the loss will reverse
in the immediate future.5
We extend this line of research by comparing whether increases in cash dividends
by loss firms signal future performance better when negative cash flows rather than
negative accruals drive the loss. Whereas previous research focuses specifically on the
role of special items when studying the relation between dividends and losses, we
differentiate between losses with a positive and negative cash flow component to capture
the relative cost of the decision to increase dividend cash outflows. The evidence in Joos
5
and Plesko (2003) showing losses have become more persistent in recent years, often due
to persistent negative cash flows, emphasizes the potential cost of an increase in cash
dividends for loss firms.6
The most recent papers on the dividend-signaling hypothesis find a reduced
signaling role for dividends over time, consistent with findings that firms have changed
their dividend-paying behavior (see Skinner 2003).7 In light of the evidence of the
reduced signaling role of dividends in a general cross-sectional time-series context, we
complement the literature by focusing on a narrower setting that provides a powerful test
of the dividend-signaling hypothesis.
II. Sample construction and descriptive statistics
Our sample consists of firm-year observations from Compustat’s Industrial and
Research Annual Data Bases for the years 1971-2000. Consistent with Hayn (1995) we
define our earnings variable as income (loss) before extraordinary items and discontinued
operations or IB (annual Compustat data item #18). We define two main variables to
capture dividend payments by the firm. We define DIVCF as the total dollar amount of
cash dividends paid by the firm (annual Compustat data item #21).8 We focus on
(changes in) the total amount paid rather than dividends per share to be consistent with
our view that the total dividend cash outflow establishes the cost to a firm already faced
with both a loss and a negative cash flow in a particular year. Since it is possible that the
dividend cash outflow in a particular year increase without dividends per share being
affected if the firm’s number of outstanding shares changes, we define a second variable
to measure dividends paid per share (DIVPS or annual Compustat data item #21 scaled by
6
data item #25).
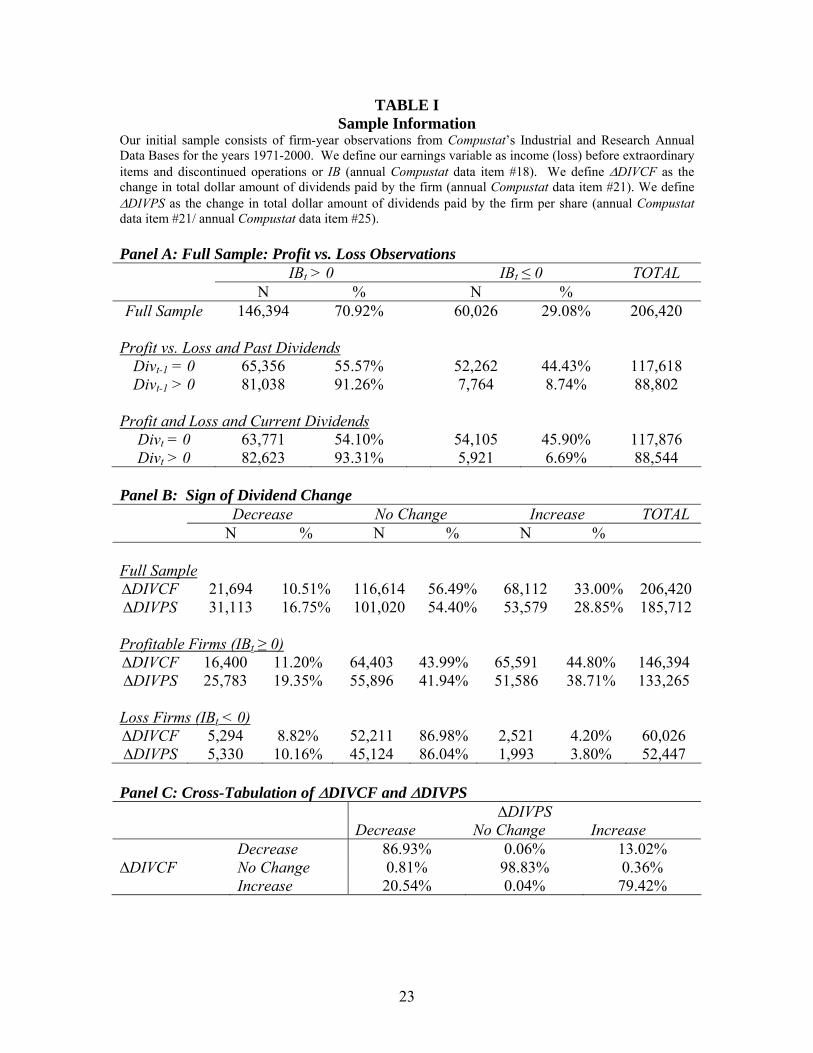
Table I presents descriptive information for the sample. Panel A shows our initial
sample contains 206,420 firm-year observations: 146,394 profit observations and 60,026
loss observations (29.08% of the total). The panel further shows a relation between
dividend payments and loss occurrence: consistent with the evidence in Skinner (2003)
we find dividend-paying firms are less likely to incur losses than non-dividend-paying
firms. Focusing first on the dividend payments of our firm-year observations in the year
prior to the current observation, we observe 117,618 firm-year observations with no
dividends and 88,802 firm-year observations with cash dividends. Of the firms that pay
no dividends 44.43% incur a current loss; by contrast, of the dividend paying firms only
8.74% incur a current loss. The contrast between dividend-paying and non-dividend-
paying firms becomes sharper when we focus on the contemporaneous relation between
dividend payments and firm profitability: of the firm-year observations not paying a
dividend, 45.90% have a contemporaneous loss, compared to only 6.69% of firms
currently paying dividends.
Panel B provides a description of dividend changes occurring in our sample. In
the full sample the majority of firms never change their dividend payments: measured as
total cash outflow (or per share) 56.49% (54.40%) of firm-year observations do not
change dividends in a given year, 33.00% (28.85%) increase dividends, and 10.51%
(16.75%) decrease dividends. The percentages change significantly when we partition
the sample between profit and loss firm-year observations: profitable firms increase
dividends payments far more often than loss firms. By contrast, the large majority of loss
firms do not change their dividend payments (86.98% or 86.04% depending on whether
7
we measure dividends as total cash outflow or per share). The high percentage reflects
the fact that loss firms are less likely to pay dividends, and that only a small fraction of
loss firms that pay dividends increase dividend payments (4.20% or 3.80% depending on
how we measure the dividend variable).
Panel C in Table I cross-tabulates our two measures of dividend changes. The
diagonal percentages in panel C show that in the vast majority of cases both proxies
reflect the same direction of dividend change. However, changes in the number of shares
outstanding, with or without a constant dividend per share, can lead to non-zero off-
diagonal percentages. For example, we observe that in 20.54% of cases firm’s total cash
dividend payments increase in a particular year, yet the dividend per share variable shows
a dividend decrease. Such a combination is the result of an increase in the number of
shares in the same year (e.g., as a result of equity issuances or stock option exercises).
The two variables therefore complement each other as proxies for dividend decisions by
management. While we focus primarily on the dollar value of dividend payments, since
it best captures the amount of cash the firm is using, we present results using both
variables to illustrate the signaling role of dividend increases.
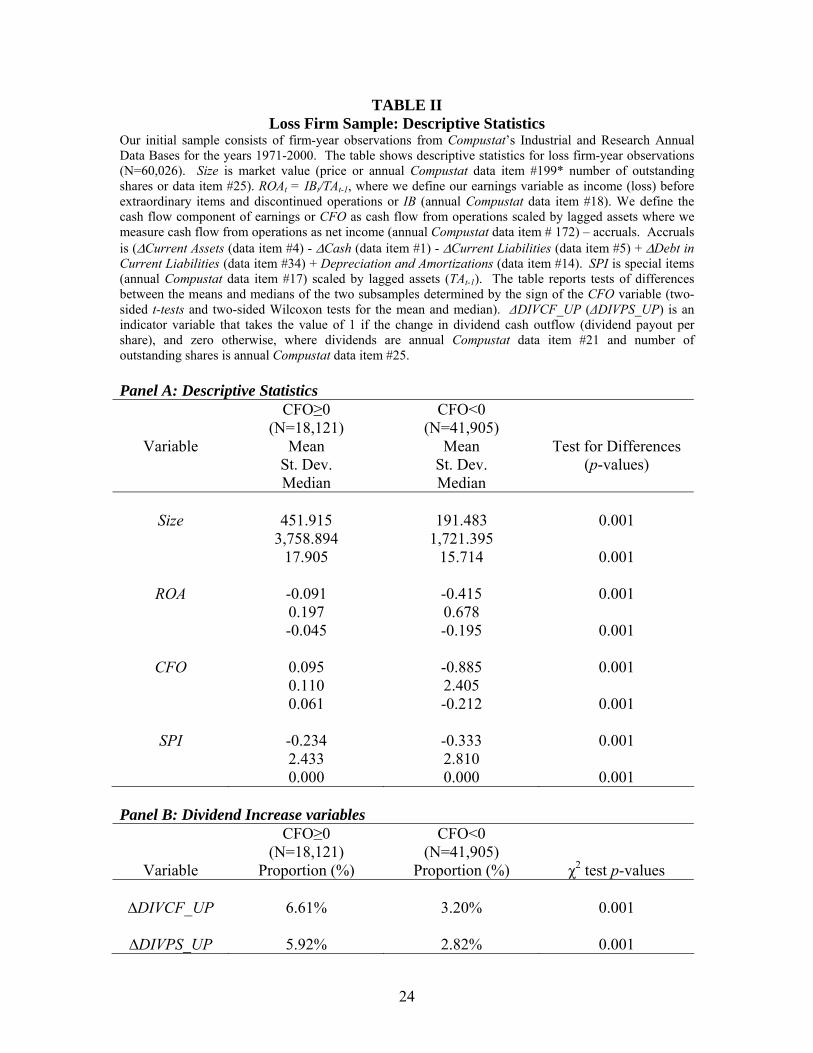
In Table II, we present evidence for our main variables of interest. Since we
hypothesize that the sign of the cash flow component of negative earnings will determine
the relative cost of a dividend increase we present our descriptive statistics for a sample
of loss observations partitioned by the sign of the cash flow component of the losses. We
define the cash flow component of earnings (CFO) as cash flow from operations,
measured as net income (annual Compustat data item # 172) less accruals. We measure
accruals as (∆Current Assets (data item #4) - ∆Cash (data item #1) - ∆Current Liabilities

8
(data item #5) + ∆Debt in Current Liabilities (data item #34) + Depreciation and
Amortizations (data item #14).
Panel A of Table II shows the mean, standard deviation, and median for four
variables of interest. First, we define Size as market value of the firm (stock price times
the number of outstanding shares, or annual Compustat data item #199*data item #25).
Second, we define ROA as earnings before extra-ordinary items and discontinued
operations (or IB as defined before) scaled by lagged total assets (TA, annual Compustat
data item #6). Third, we define CFO as before. Finally, we include SPI, or special items
(annual Compustat data item #17) scaled by lagged assets (TAt-1), in the Panel since
previous research singles out SPI as the specific component of losses related to both the
quality of losses (i.e., degree of permanence) and the dividend-paying behavior of firms
(Skinner 2003).
Panel A reports significant differences between the means and medians of the two
subsamples (based on two-sided t-tests and two-sided Wilcoxon tests for the mean and
median) as a function of the sign of their cash flow component. Generally speaking, loss
observations with a positive cash flow are larger and exhibit stronger profitability
(smaller losses) than loss observations with a negative cash flow component. Positive
cash flow loss firms on average also report less negative SPI, with both types of loss
firms having median SPI of zero though. All differences between means and medians are
statistically significant.
Panel B of Table II provides descriptive statistics on the incidence of dividend
increases in the sample of loss observations as a function of the sign of the cash flow
component of earnings. We define ∆DIVCF_UP (∆DIVPS_UP) as an indicator variable

9
that takes the value of 1 if the change in dividend cash outflow (dividend payout per
share) is positive, and zero otherwise, with DIVCF and DIVPS as defined before. Panel
B shows a significantly smaller proportion of loss observations with a negative cash flow
component increases dividends, consistent with a dividend increase being costly:
regardless of the dividend variable used, the percentage of positive CFO loss firms
increasing their dividends is more than twice the percentage of negative CFO loss firms.
Table II provides evidence consistent with loss observations being different as a
function of the sign of the cash flow component of the loss: a negative cash flow
component suggests a greater deterioration in profitability and a lower incidence of
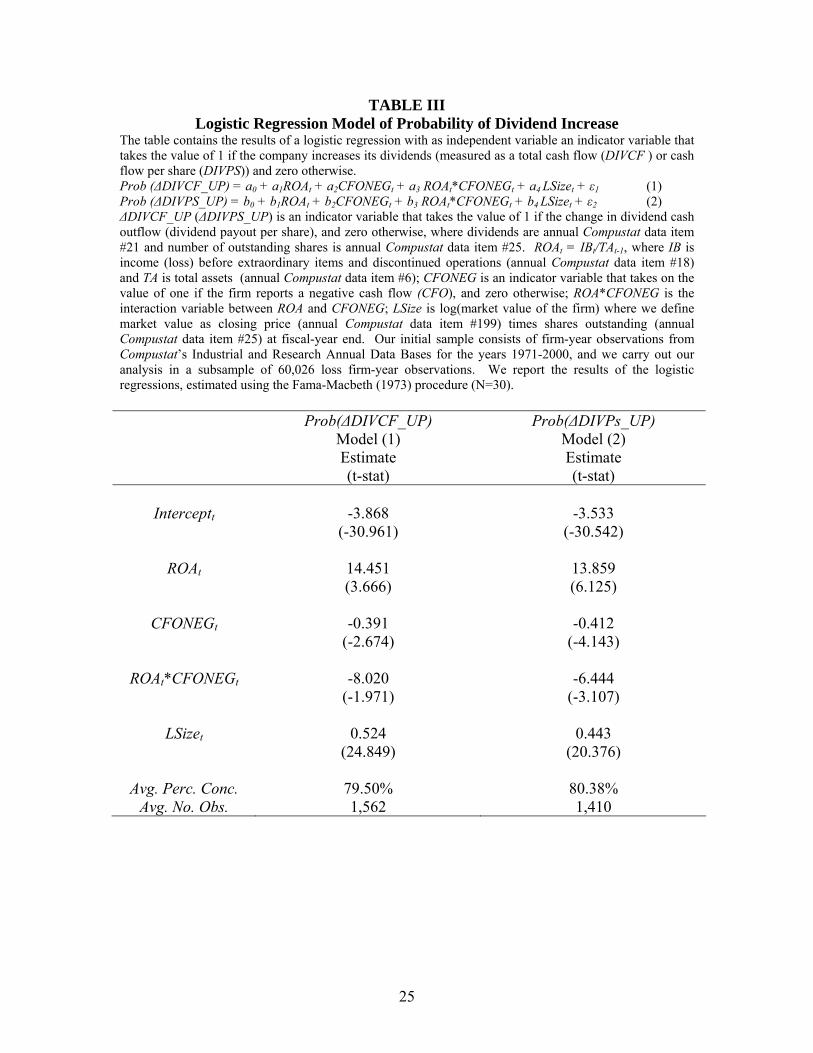
dividend increases. In Table III, we formally test the relation between current
profitability, the sign of current cash flows, and (changes in) dividend payments in the
sample of loss observations. Specifically, we estimate a logistic regression to evaluate
the relation of profitability and its components to the decision to increase current
dividends. Focusing on our two dividend variables we estimate the following four
specifications:
Prob (∆DIVCF_UP) = a0 + a1ROAt + a2CFONEGt + a3 ROAt*CFONEGt + a4 LSizet + ε1 (1)
Prob (∆DIVPS_UP) = b0 + b1ROAt + b2CFONEGt + b3 ROAt*CFONEGt +
b4 LSizet + ε2 (2)
where ∆DIVCF_UP, ∆DIVPS_UP, ROA are as defined before; CFONEG is an indicator
variable equal to one if the firm reports a negative cash flow, and zero otherwise;
ROA*CFONEG is the interaction between ROA and CFONEG. Besides our main
10
variables of interest, ROA, CFONEG, and the interaction between both variables, we
include a control variable for the size of the firm in each specification since Hayn (1995)
and Joos and Plesko (2003) relate the size of the firm to the persistence of the loss and
therefore the potential cost of a dividend increase. Our size variable is LSize, the log of
the market value of the firm.
Table III reports the results of estimating models (1) and (2) using the method
detailed by Fama and Macbeth (1973). In both models the coefficient on ROA is positive
and highly significant, consistent with a relation between higher profitability and
dividend increases. However, the negative coefficient on CFONEG indicates that, on
average, loss firms with negative cash flows are less likely to increase their dividend.
Further, the negative and significant coefficient on ROA*CFONEG shows that the
relation between higher profitability and dividend increases in the full sample is smaller
for firms with a negative cash flow. The size control variable has a positive and
significant coefficient, suggesting that larger firms are more inclined to increase
dividends in the current loss year regardless of the sign of the cash flow.9
In sum, the analyses in Tables I through III suggest a positive relation between a
firm’s profitability and its propensity to increase dividends. Focusing on loss
observations in particular, we find the presence of a negative cash flow component of the
loss reduces the probability of a dividend increase, consistent with negative cash flows
from operations increasing the cost of a dividend increase.

11
III. Do dividend increases forecast future profitability?
To examine whether costly dividend increases constitute strong signals of future
profitability we estimate an earnings forecasting model in our sample of loss
observations. Since we argue that increases in dividend outflows are more costly when
cash flows are negative, we predict the decision to increase dividends is a stronger
predictor of future profitability for negative cash flow loss firms than for positive cash
flow loss firms. We consider two forecast horizons, one and three years, and focus on
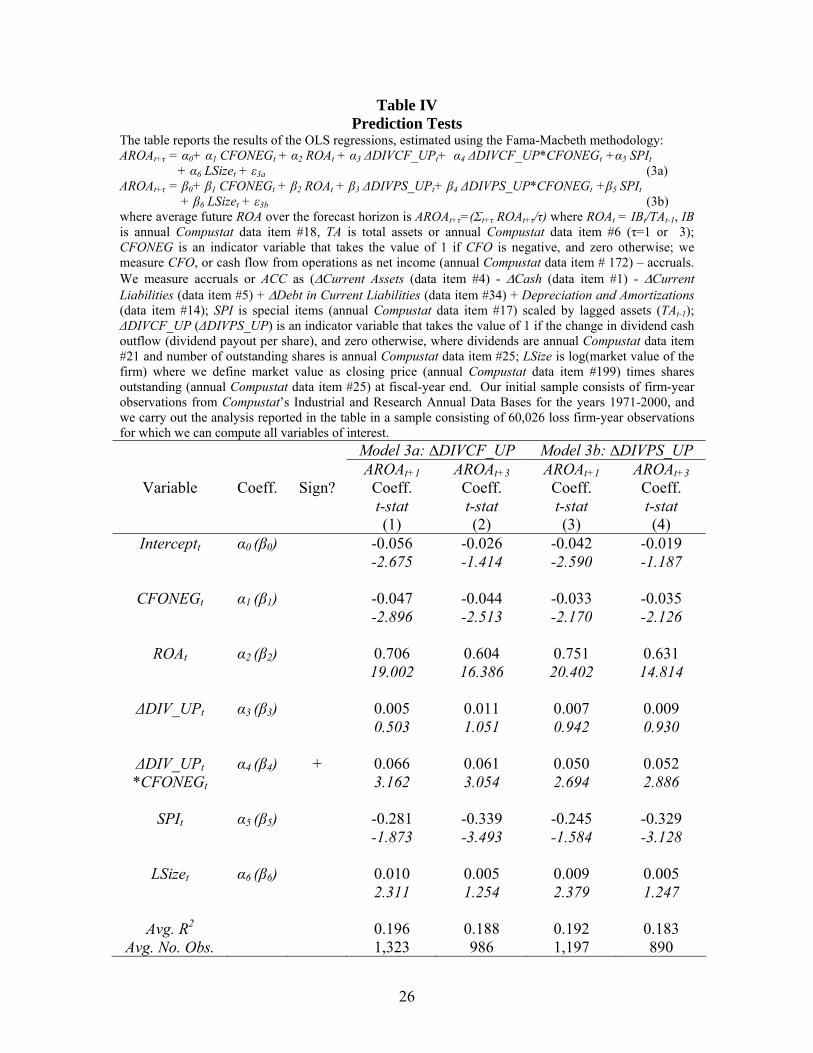
future accounting profitability by estimating the following parsimonious models: 10
AROAt+τ = α0+ α1 CFONEGt + α2 ROAt + α3 ∆DIVCF_UPt+
α4 ∆DIVCF_UP*CFONEGt +α5 SPIt + α6 LSizet + ε3 (3a) AROAt+τ = β0+ β1 CFONEGt + β2 ROAt + β3 ∆DIVPS_UPt+
β4 ∆DIVPS_UP*CFONEGt +β5 SPIt + β6 LSizet + ε3 (3b)
We define future profitability as average future ROA over the forecast horizon:
AROAt+τ=(Σt+τ ROAt+τ/τ, where τ=1 or 3) and estimate models (3a) and (3b). The first
specification (3a) focuses on increases in DIVCF, and the second (3b) on increases in
DIVPS. ROA, SPI, CFONEG, LSize are defined as before. Our main variables of interest
in model (3) are dividend increases (∆DIVCF_UP or ∆DIVPS_UP), and dividend
increases interacted with the negative cash flow indicator variable CFONEG. If our
prediction that the decision to increase dividends is a stronger predictor of future
profitability for negative cash flow loss firms than for positive cash flow loss firms, α4
and β4 will both be positive and significant.
We include controls for current profitability (ROA), special items, and size. We
include special items (SPI) for the reason mentioned earlier, namely that previous

12
research relates SPI to both the quality of losses (i.e., degree of permanence) and the
dividend-paying behavior of firms (Skinner 2003). We include LSize to control for
potentially omitted variables such as risk or growth of the firm. We estimate both
specifications using the Fama-MacBeth methodology.
Table IV presents the results of the estimation of equations (3a)–(3b). All four
estimation results (columns (1) through (4)), focusing on different dividend measures and
forecast horizons, show the same result for the dividend increase variables: the
coefficients α3 and β3 on the dividend increase variables are not significant, indicating
that a dividend increase for loss firms with a positive cash flow component does not
signal future profitability controlling for other factors in the model. By contrast, the
coefficients α4 and β4 on the dividend increase variable interacted with CFONEG are
positive and significant in all specifications. In untabulated analysis, we also find the
sum of α3+α4 and β3+β4 are positive and statistically significant in all specifications. The
evidence is consistent with dividend increases signaling future profitability, even after
controlling for other factors, when the cash flow component of losses is negative. This
finding supports the hypothesis that dividend increases constitute an informative signal
when the cost of the signal is relatively high.
Table IV also shows the coefficients on CFONEG (α1 or β1) are negative and
significant in all four specifications, consistent with losses with negative cash flows
signaling persistent profitability problems (see also Joos and Plesko 2003). By contrast,
the coefficients on ROA (α2 or β2) are positive and highly significant in all specifications,
consistent with the previous findings on the serial correlation and mean reversion of ROA
(e.g., Sloan 1996). The coefficients on SPI (α5 or β5) are negative in all four
13
specifications, but the level of significance varies depending on the forecast horizon: the
coefficients are marginally significant in the one-year horizon models (columns (1) and
(3)), but highly significant over the three-year horizon (columns (2) and (4)), suggesting
special items affect firm profitability more over the longer horizon, and are less
informative over the shorter horizon. Finally, size predicts future profitability only one
year ahead (columns (1) and (3)), but not three years ahead (columns (2) and (4)).
In summary, the results for both dividend variables and both forecast horizons are
consistent with a dividend increase providing information on the future performance of
loss firms only when current cash flows are negative. We interpret the results to indicate
the usefulness of a dividend increase to signal future firm performance is directly related
to the expected cost of the dividend increase.
IV. Robustness analyses
We carry out three (unreported) analyses to test the sensitivity and robustness of
our findings. In our first analysis, we focus on a subsample of firms with more than one
sequential loss, omitting observations for which the current loss is preceded by a
profitable year. We assume that for these firms the cost to increase dividends should be
greater than for firms experiencing a first loss.11 We find changes in dividends vary as a
function of whether a loss is the first loss (i.e., the prior year’s earnings were positive) or
whether the loss is one in a sequence (a repeat loss): 10.38% (9.08%) of first loss
observations increase dividend cash outflows (dividend cash outflows per share) versus
1.44% (1.27%) of repeat loss observations. This finding is consistent with a string of
losses revealing continuing profitability problems, making it more difficult for the firm to

14
increase dividend payments. The proportion of repeat losses with negative cash flows
(74.90%) is also larger than the corresponding proportion of first losses with negative
cash flows (58.60%). Repeat losses with negative cash flows also exhibit lower
profitability than those with a positive cash flow component.12
The descriptive evidence suggests the decision to increase dividends when a firm
faces repeat losses constitutes a powerful signal regardless of the sign of the cash flow.
The existence of such a strong signal for all multiple loss firms could diminish the
signaling value of a dividend increase for loss firms with negative cash flows. We re-
estimate the prediction tests in the sample of repeat loss observations and observe that,
consistent with our conjecture that increasing dividends when facing repeat losses is
costly even for positive CFO firms, the coefficients α3 and β3 become significant (at the
10% level) in the one-year models but not in the three-year models. More important
though, consistent with our previous results, the coefficients α4 and β4 in (3a) and (3b)
remain positive and significant in all specifications. All other results remain qualitatively
the same.
In a second analysis, we include additional control variables in (3a) and (3b) to
capture the level of liquidity and recent growth of the firm. We include cash and short-
term securities scaled by assets (annual Compustat data item #1 scaled by data item #6)
as a proxy for liquidity and the log of Salest/Salest-1 (where Sales is annual Compustat
data item #12) as a proxy for growth. When we include both variables in the models, we
find the coefficient on liquidity is insignificant in all specifications, while the coefficient
on the growth proxy is positive and significant (at the 5% level) in all specifications. As
in the previous robustness test, the coefficients α3 and β3 become significant at the 5%
15
level in the one-year horizon models (corresponding to columns (1) and (3) in Table IV),
but remain insignificant in the three-year horizon models. Throughout, the coefficients
α4 and β4 remain positive and significant in all specifications, reinforcing the stronger
predictive role for future profitability of dividend increases when the cash flow
component of losses is negative. All other results remain qualitatively the same.
In a final test, we re-estimate (3a) and (3b) in separate samples of loss
observations determined by the sign of cash flows. That is, rather than incorporating
CFONEG and the interaction term, we estimate a simplified version of (3a) and (3b) in
separate samples, allowing the coefficients on ROA, SPI, and LSize to vary in both
samples. The procedure allows us to evaluate whether the coefficients on the dividend
increase variable and on the interaction term in Models (3a) and (3b) capture differential
forecasting power of the other variables included in the equation with ‘fixed’ coefficients.
Our estimations show that the coefficients α2 and β2 on ROA vary as a function of the sign
of the cash flow component of losses; the coefficients on SPI and LSize however are not
different across the subsamples. The coefficient on the dividend increase variable is
significant at the 5% level in all specifications, indicating that dividend increases signal
future profitability irrespective of the sign of the cash flow component of the loss when
we estimate the models in separate subsamples. Most importantly though, in support of
our prediction and previous results, the magnitude of the coefficient on the dividend
increase variable remains significantly larger in the subsample of negative CFO loss
firms than in the subsample of positive CFO losses.
Summarizing, the results of the additional analyses in subsamples of loss firms or
for different specifications of Models (3a) and (3b) are all consistent with dividend
16
increases by loss firms being more informative about future profitability when the cash
flow component of the loss is negative than when it is positive. We interpret our results
to indicate that the more costly a dividend signal is, the more informative the dividend is
about the firm’s future performance.
V. Conclusion
This paper provides new evidence on the role of dividends in signaling firms’
future performance. We examine whether firms that report a current loss and have a
negative cash flow signal future performance of the firm through costly increases in cash
dividends. We distinguish between losses determined by negative cash flows versus
negative accruals to capture the cost of a current dividend increase. We argue that
increasing dividend payments when the firm is already losing money constitutes a strong
signal of future performance for two reasons. First, the increase in current cash dividends
affects the current liquidity of the firm. Second, the increase in cash dividends implies a
strong commitment to an increased level of dividend cash outflows in the future since
previous research documents a high reluctance of managers to cut dividends.
The evidence in the paper strongly supports the hypothesis that costly dividend
increases by loss firms with negative cash flows consistently predict future measures of
performance better than dividend increases by other loss firms. While recent empirical
results have discounted the role of dividends as a signaling mechanism in large cross-
sectional samples (Benartzi et al. 1997, Grullon et al. 2003, Skinner 2003), our results
suggest costly dividend increases are informative for a narrow group of firms. For
negative cash flow loss firms, the use of cash to pay a dividend, rather than to reinvest in
17
the ongoing operations of the firm, suggests management judges the prospects of the firm
to be good, even though current earnings are not.
Our focus on loss firms has broader implications as research shows that loss firms
comprise a large and increasing share of publicly-traded firms (e.g., Hayn 1995, Joos and
Plesko 2003, Skinner 2003). Therefore, an increasingly larger set of managers is
confronted with reporting negative earnings that are generally much less informative
about future performance of the firm. As a result, they face the need to rely on additional
mechanisms beyond reported profitability measures to provide investors with information
about the firm’s prospects.
18
References Aharony, Joseph, and Itzhak Swary, 1980. Quarterly dividend and earnings
announcements and stockholders’ returns: An empirical analysis. Journal of Finance, 35, 1, 1-12.
Asquith, Paul, and David W. Mullins, Jr, 1983. The impact of initiating dividend
payments on shareholders’ wealth. Journal of Business, 56, 1, 77-96. Bernartzi, Shlomo, Roni Michaely, and Richard Thaler, 1997. Do changes in dividends
signal the future or the past? Journal of Finance, 52, 3, 1007-1043. Brav, Alon, John R. Graham, Campbell R. Harvey, and Roni Michaely, 2003, Payout
policy in the 21st century. Working paper. Duke University. DeAngelo, Harry, Linda E. DeAngelo, and Douglas J. Skinner, 1992. Dividends and
losses. Journal of Finance, 47, 1837-1863. DeAngelo, Harry, Linda E. DeAngelo, and Douglas J. Skinner, 2003. Are dividends
disappearing? dividend concentration and the consolidation of earnings. Forthcoming Journal of Financial Economics.
Fama, Eugene F., and Kenneth R. French, 2001. Disappearing dividends: changing firm
characteristics or lower propensity to pay? Journal of Financial Economics, 60, 3-43. Fama, Eugene F., and James D. MacBeth, 1973. Risk, return and equilibrium: Empirical
tests. Journal of Political Economy, 81, 607-636. Grullon, Gustavo, Roni Michaely, Shlomo Benartzi and Richard H. Thaler, 2003.
Dividend changes do not signal changes in future profitability. Working paper, Rice University, Cornell University, University of Chicago.
Hayn, C., 1995. The information content of losses. Journal of Accounting and
Economics, 20, 125-153. Healy, Paul. M., and Krishna G. Palepu, 1988. Earnings information conveyed by
dividend initiations and omissions. Journal of Financial Economics, 21, 2, 149-175. Joos, Peter , and George A. Plesko, 2003. Loss reversals, and earnings-based valuation.
Working paper, MIT. Lintner, J., 1956. Distribution of incomes of corporations among dividends, retained
earnings, and taxes. American Economic Review, 46, 97-113. Miller, Merton, and Franco Modigliani, 1961. Dividend policy, growth and the valuation
of shares. Journal of Business, 34, 411-433.
19
Miller, Merton, Kevin Rock, 1985, Dividend policy under asymmetric information
Journal of Finance, 40, 1031 – 1051. Nissim, Doron, and Ziv, Amir, 2001. Dividend changes and future profitability. Journal
of Finance, 56, 2111-2133. Sloan, Richard, 1996. Do stock prices fully reflect information in accruals and cash flows
for future earnings? The Accounting Review, 71, 3, 289-315. Skinner, Douglas J., 2003. What do dividends tell us about earnings quality? Working
paper, University of Chicago Graduate School of Business and University of Michigan Business School.
Spence, Michael, 1973. Job market signaling, The Quarterly Journal of Economics, 87, 3,
355-374. Watts, Ross, 1973. The information content of dividends. Journal of Business, 46, 2, 191-
211.
20
1 Earlier work by Benartzi et al. (1997) discusses how previous empirical work provides
evidence the market treats changes in dividends as newsworthy (see Aharony and Swary
1980, Asquith and Mullins 1983). They also point out it is not clear that dividend
changes signal future earnings changes, as the hypothesis predicts. The authors conclude
changes in dividends summarize information about the past, namely past earnings
increases, rather than the future, i.e., upcoming earnings increases.
2 Other examples of studies that fail to find evidence or find evidence that is mixed on the
question whether dividend changes map into future earnings changes are Watts (1973),
Healy and Palepu (1988), DeAngelo et al. (1992).
3 Previous research proposes costs associated with dividend payments, for example Miller
and Rock (1985) argue the signaling cost of dividends is forgone investment. However,
we know of no research that studies the power of the dividend signal as a function of the
relative level of the cost.
4 Skinner defines large dividend-paying firms as firms whose dividend is in the top
quartile of dividends paid in each decade.
5 Note the results in Joos and Plesko (2003) and Skinner (2003) are at odds with the
finding in Benartzi et al. (1997) “that dividend cuts reliably signal an increase in future
earnings.” (p. 1031-1032, emphasis in the original).
6 DDS report that dividend reductions occur less often when the losses include an accrual
for special items, but do not differentiate whether the underlying loss is driven by
accruals or cash flows. Further, the results of Benartzi et al. (1997) suggest that if
dividends have any signaling power, it is through a reduction, rather than an increase.

21
7 The findings of Fama and French (2001) who report a decrease in the proportion of
dividend-paying firms in the US over time and DDS (2003) who show a large increase in
the concentration of dividend payments over time also underline the changes in dividend-
paying behavior of US firms.
8 We winsorize all variables of interest at the 1st and 99th percentile.
9 In unreported analyses, we estimate additional specifications of models (1) and (2).
Specifically, we also include Special Items in one of the specifications and find that they
obtain a significant negative coefficient, whereas the other results remain qualitatively
unchanged. Similarly, we include an indicator variable to distinguish between first and
repeat losses and find a positive coefficient on this variable, with all other results
remaining qualitatively unchanged. Finally, we also estimate a version of models (1) and
(2) that includes a control variable for the dividend policy of the firm since unreported
analysis shows the incidence of dividend increases relates to whether the firm previously
paid a dividend or not: we include an indicator variable that takes on the value of one if
the firm pays a dividend (i.e., annual Compustat data item #21 is larger than zero), and
zero otherwise and find the results do not change qualitatively.
10 We also estimate two-year horizon models with results similar to the one and three-
year horizon models. Also, consistent with previous research we focus on the prediction
of an accounting variable only (e.g., Nissim and Ziv 2001). Benartzi et al. (1997)
furthermore point out that the relation between dividend increases and future accounting
variables or future returns is distinct: whereas they find no evidence of a relation between
dividend changes and future earnings changes, they observe positive excess returns for
the three years following a dividend increase.

22
11 Joos and Plesko (2003) document that the probability of a loss firm returning to
profitability is higher for firms incurring a first loss than for firms with repeat losses.
12 We also compare the descriptive statistics in Table II to descriptive statistics for repeat
losses and find the repeat loss observations generally exhibit significantly lower
profitability than the total group of loss firms.
23
TABLE I Sample Information
Our initial sample consists of firm-year observations from Compustat’s Industrial and Research Annual Data Bases for the years 1971-2000. We define our earnings variable as income (loss) before extraordinary items and discontinued operations or IB (annual Compustat data item #18). We define ∆DIVCF as the change in total dollar amount of dividends paid by the firm (annual Compustat data item #21). We define ∆DIVPS as the change in total dollar amount of dividends paid by the firm per share (annual Compustat data item #21/ annual Compustat data item #25). Panel A: Full Sample: Profit vs. Loss Observations
IBt > 0 IBt ≤ 0 TOTAL N % N %
Full Sample 146,394 70.92% 60,026 29.08% 206,420
Profit vs. Loss and Past Dividends Divt-1 = 0 65,356 55.57% 52,262 44.43% 117,618 Divt-1 > 0 81,038 91.26% 7,764 8.74% 88,802
Profit and Loss and Current Dividends
Divt = 0 63,771 54.10% 54,105 45.90% 117,876 Divt > 0 82,623 93.31% 5,921 6.69% 88,544
Panel B: Sign of Dividend Change
Decrease No Change Increase TOTAL N % N % N %
Full Sample ∆DIVCF 21,694 10.51% 116,614 56.49% 68,112 33.00% 206,420 ∆DIVPS 31,113 16.75% 101,020 54.40% 53,579 28.85% 185,712
Profitable Firms (IBt ≥ 0) ∆DIVCF 16,400 11.20% 64,403 43.99% 65,591 44.80% 146,394 ∆DIVPS 25,783 19.35% 55,896 41.94% 51,586 38.71% 133,265 Loss Firms (IBt < 0) ∆DIVCF 5,294 8.82% 52,211 86.98% 2,521 4.20% 60,026 ∆DIVPS 5,330 10.16% 45,124 86.04% 1,993 3.80% 52,447 Panel C: Cross-Tabulation of ∆DIVCF and ∆DIVPS ∆DIVPS Decrease No Change Increase Decrease 86.93% 0.06% 13.02% ∆DIVCF No Change 0.81% 98.83% 0.36% Increase 20.54% 0.04% 79.42%
24
TABLE II Loss Firm Sample: Descriptive Statistics
Our initial sample consists of firm-year observations from Compustat’s Industrial and Research Annual Data Bases for the years 1971-2000. The table shows descriptive statistics for loss firm-year observations (N=60,026). Size is market value (price or annual Compustat data item #199* number of outstanding shares or data item #25). ROAt = IBt/TAt-1, where we define our earnings variable as income (loss) before extraordinary items and discontinued operations or IB (annual Compustat data item #18). We define the cash flow component of earnings or CFO as cash flow from operations scaled by lagged assets where we measure cash flow from operations as net income (annual Compustat data item # 172) – accruals. Accruals is (∆Current Assets (data item #4) - ∆Cash (data item #1) - ∆Current Liabilities (data item #5) + ∆Debt in Current Liabilities (data item #34) + Depreciation and Amortizations (data item #14). SPI is special items (annual Compustat data item #17) scaled by lagged assets (TAt-1). The table reports tests of differences between the means and medians of the two subsamples determined by the sign of the CFO variable (two-sided t-tests and two-sided Wilcoxon tests for the mean and median). ∆DIVCF_UP (∆DIVPS_UP) is an indicator variable that takes the value of 1 if the change in dividend cash outflow (dividend payout per share), and zero otherwise, where dividends are annual Compustat data item #21 and number of outstanding shares is annual Compustat data item #25. Panel A: Descriptive Statistics
CFO≥0 (N=18,121)
CFO<0 (N=41,905)
Variable Mean St. Dev. Median
Mean St. Dev. Median
Test for Differences (p-values)
Size 451.915 191.483 0.001
3,758.894 1,721.395 17.905 15.714 0.001
ROA -0.091 -0.415 0.001 0.197 0.678 -0.045 -0.195 0.001
CFO 0.095 -0.885 0.001 0.110 2.405 0.061 -0.212 0.001
SPI -0.234 -0.333 0.001 2.433 2.810 0.000 0.000 0.001
Panel B: Dividend Increase variables
CFO≥0 (N=18,121)
CFO<0 (N=41,905)
Variable Proportion (%) Proportion (%) χ2 test p-values ∆DIVCF_UP 6.61% 3.20% 0.001
∆DIVPS_UP 5.92% 2.82% 0.001
25
TABLE III Logistic Regression Model of Probability of Dividend Increase
The table contains the results of a logistic regression with as independent variable an indicator variable that takes the value of 1 if the company increases its dividends (measured as a total cash flow (DIVCF ) or cash flow per share (DIVPS)) and zero otherwise. Prob (∆DIVCF_UP) = a0 + a1ROAt + a2CFONEGt + a3 ROAt*CFONEGt + a4 LSizet + ε1 (1) Prob (∆DIVPS_UP) = b0 + b1ROAt + b2CFONEGt + b3 ROAt*CFONEGt + b4 LSizet + ε2 (2) ∆DIVCF_UP (∆DIVPS_UP) is an indicator variable that takes the value of 1 if the change in dividend cash outflow (dividend payout per share), and zero otherwise, where dividends are annual Compustat data item #21 and number of outstanding shares is annual Compustat data item #25. ROAt = IBt/TAt-1, where IB is income (loss) before extraordinary items and discontinued operations (annual Compustat data item #18) and TA is total assets (annual Compustat data item #6); CFONEG is an indicator variable that takes on the value of one if the firm reports a negative cash flow (CFO), and zero otherwise; ROA*CFONEG is the interaction variable between ROA and CFONEG; LSize is log(market value of the firm) where we define market value as closing price (annual Compustat data item #199) times shares outstanding (annual Compustat data item #25) at fiscal-year end. Our initial sample consists of firm-year observations from Compustat’s Industrial and Research Annual Data Bases for the years 1971-2000, and we carry out our analysis in a subsample of 60,026 loss firm-year observations. We report the results of the logistic regressions, estimated using the Fama-Macbeth (1973) procedure (N=30).
Prob(∆DIVCF_UP) Prob(∆DIVPs_UP) Model (1) Model (2) Estimate
(t-stat) Estimate (t-stat)
Interceptt -3.868
(-30.961) -3.533
(-30.542)
ROAt 14.451 (3.666)
13.859 (6.125)
CFONEGt -0.391
(-2.674) -0.412
(-4.143)
ROAt*CFONEGt
-8.020 (-1.971)
-6.444 (-3.107)
LSizet 0.524
(24.849) 0.443
(20.376)
Avg. Perc. Conc. 79.50% 80.38% Avg. No. Obs. 1,562 1,410
26
Table IV Prediction Tests
The table reports the results of the OLS regressions, estimated using the Fama-Macbeth methodology: AROAt+τ = α0+ α1 CFONEGt + α2 ROAt + α3 ∆DIVCF_UPt+ α4 ∆DIVCF_UP*CFONEGt +α5 SPIt
+ α6 LSizet + ε3a (3a) AROAt+τ = β0+ β1 CFONEGt + β2 ROAt + β3 ∆DIVPS_UPt+ β4 ∆DIVPS_UP*CFONEGt +β5 SPIt
+ β6 LSizet + ε3b (3b) where average future ROA over the forecast horizon is AROAt+τ=(Σt+τ ROAt+τ/τ) where ROAt = IBt/TAt-1, IB is annual Compustat data item #18, TA is total assets or annual Compustat data item #6 (τ=1 or 3); CFONEG is an indicator variable that takes the value of 1 if CFO is negative, and zero otherwise; we measure CFO, or cash flow from operations as net income (annual Compustat data item # 172) – accruals. We measure accruals or ACC as (∆Current Assets (data item #4) - ∆Cash (data item #1) - ∆Current Liabilities (data item #5) + ∆Debt in Current Liabilities (data item #34) + Depreciation and Amortizations (data item #14); SPI is special items (annual Compustat data item #17) scaled by lagged assets (TAt-1); ∆DIVCF_UP (∆DIVPS_UP) is an indicator variable that takes the value of 1 if the change in dividend cash outflow (dividend payout per share), and zero otherwise, where dividends are annual Compustat data item #21 and number of outstanding shares is annual Compustat data item #25; LSize is log(market value of the firm) where we define market value as closing price (annual Compustat data item #199) times shares outstanding (annual Compustat data item #25) at fiscal-year end. Our initial sample consists of firm-year observations from Compustat’s Industrial and Research Annual Data Bases for the years 1971-2000, and we carry out the analysis reported in the table in a sample consisting of 60,026 loss firm-year observations for which we can compute all variables of interest. Model 3a: ∆DIVCF_UP Model 3b: ∆DIVPS_UP AROAt+1 AROAt+3 AROAt+1 AROAt+3
Variable Coeff. Sign? Coeff. t-stat (1)
Coeff. t-stat (2)
Coeff. t-stat (3)
Coeff. t-stat (4)
Interceptt α0 (β0) -0.056 -0.026 -0.042 -0.019 -2.675 -1.414 -2.590 -1.187
CFONEGt α1 (β1) -0.047 -0.044 -0.033 -0.035 -2.896 -2.513 -2.170 -2.126
ROAt α2 (β2) 0.706 0.604 0.751 0.631 19.002 16.386 20.402 14.814
∆DIV_UPt α3 (β3) 0.005 0.011 0.007 0.009 0.503 1.051 0.942 0.930
∆DIV_UPt *CFONEGt
α4 (β4) + 0.066 3.162
0.061 3.054
0.050 2.694
0.052 2.886
SPIt α5 (β5) -0.281 -0.339 -0.245 -0.329
-1.873 -3.493 -1.584 -3.128
LSizet α6 (β6) 0.010 0.005 0.009 0.005 2.311 1.254 2.379 1.247
Avg. R2 0.196 0.188 0.192 0.183 Avg. No. Obs. 1,323 986 1,197 890