characterization of glonass broadcast clock and...
TRANSCRIPT

Characterization of GLONASS Broadcast Clock
and Ephemeris: Nominal Performance and Fault
Trends for ARAIM
Kazuma Gunning, Stanford University
Todd Walter, Stanford University
Per Enge, Stanford University
BIOGRAPHIES
Kaz Gunning is a Ph.D. candidate in the GPS Research Laboratory working under the guidance of Professor Per Enge and Dr.
Todd Walter in the Department of Aeronautics and Astronautics at Stanford University. Prior to joining the lab in fall 2015 as
a Ph.D. candidate, Kaz worked for Booz Allen Hamilton on the GPS Systems Engineering and Integration group doing
Modeling and Simulation of the next generation GPS Control Segment and software-defined receiver work looking at the GPS
III waveform. His interests are in GNSS modernization and integrity.
Todd Walter is a senior research engineer in the GPS Research Laboratory in the Department of Aeronautics and Astronautics
at Stanford University. He received his Ph.D. from Stanford in 1993 and has worked extensively on the Wide Area
Augmentation System (WAAS). He is currently working on dual-frequency, multi-constellation solutions for aircraft guidance.
He received the Thurlow and Kepler awards from the ION. In addition, he is a fellow of the ION and has served as its president.
Per Enge is a Professor of Aeronautics and Astronautics at Stanford University, where he is the Vance and Arlene Coffman
Professor in the School of Engineering. Here, he directs the GPS Research Laboratory which develops navigation systems
based on the Global Positioning System (GPS). He has been involved in the development of WAAS and LAAS for the Federal
Aviation Administration (FAA). He has received the Kepler, Thurlow, and Burka Awards from the ION. He also received the
Summerfield Award from the American Institute of Aeronautics and Astronautics (AIAA) as well as the Michael Richey Medal
from the Royal Institute of Navigation. He is a fellow of the Institute of Electrical and Electronics Engineers (IEEE), a fellow
of the ION, a member of the National Academy of Engineering, and has been inducted into the Air Force GPS Hall of Fame.
He received his Ph.D. from the University of Illinois in 1983.
ABSTRACT
This paper characterizes the GLONASS broadcast clock and ephemeris performance over an eight year period from 2009
through 2016, where both nominal signal-in-space (SIS) user range error (URE) and faulty behavior are explored. While GPS
is currently widely used in aviation via receiver autonomous integrity monitoring (RAIM), advanced RAIM (ARAIM) could
allow for a multi-GNSS navigation solution that potentially includes GLONASS. In order to demonstrate the safety of such a
system, the performance of each GNSS must be carefully evaluated.
GLONASS broadcast clock and ephemeris parameters are evaluated through comparison with precise clock and ephemeris
products provided by the International GNSS Service (IGS). Clock and ephemeris error are combined to produce SIS URE
values and compared against fault criteria. More than 300 faults over the last eight years have been identified and categorized
by whether they are faults in clock and/or ephemeris, the health state of the satellite preceding the fault event, the duration of
the fault, and other criteria. The data shows a significant improvement in fault rate and duration, where several classes of faults
that were once relatively common have not been observed in several years. Additionally, due to limited GLONASS monitoring
and upload stations, a geographic correlation with fault events is observed. This paper estimates the probability of independent
satellite faults, Psat, and probability of simultaneous satellite failures, Pconst, over this period. Nominal SIS URE performance
is also examined, where SIS ranging biases and error distributions are assessed for each satellite for both clock and ephemeris.
The analysis shows nominal ranging accuracy improvement since 2009 in both clock and ephemeris.

INTRODUCTION
Background
The use of ARAIM requires knowledge of the performance of each of the constellations used. In particular, the signal in space
user range error distribution is modeled as a Gaussian with some probability of exceeding a threshold, over which a major
service failure or fault is declared. Historical data can be used to evaluate whether or not each GNSS has met the commitments
that have been made towards performance both in nominal behavior and faulted behavior. GLONASS is of particular interest
because it is currently the only fully operational GNSS outside of GPS, as it has had a full 24-satellite constellation in operation
since 2010, as shown in Figure 1. Ranging performance has been quantified and estimates of Psat, Pconst, and nominal error
distributions have been produced for GPS [1] in the past. Initial studies of Galileo performance alongside GPS have been
produced [2] as well as multi-constellation nominal performance studies [3]. To an extent, GLONASS performance has also
been investigated though the identification of faults and a description nominal ranging accuracy performance through the period
2009 to 2012 by Heng [4, 5].
The goals of this paper are two-fold: to characterize the fault rate over time of the GLONASS constellation and to characterize
the nominal error distribution over the period of 2009 to 2016. The error of interest is the error related to signal transmission;
terrestrial and receiver effects are not considered. The error studied comes from the constellation service provider’s (CSP)
estimation of the satellite clock and ephemeris state as broadcast in the navigation message. This paper uses historical data to
determine the signal-in-space (SIS) user range error (URE) distribution- the distribution of the error contribution from the
satellite and CSP on the ranging signal as observed by a terrestrial user.
Figure 1: GLONASS Constellation Progression- Number of satellites by block and mean age of active satellites over time
Fault threshold
A draft of the GLONASS performance specification has stated that a GLONASS fault is declared when the SIS URE exceeds
70 meters, and the commitment is to a probability of such an event, Psat, of 10-4 [6]. Similarly, the commitment to the probability
of a constellation-wide fault, Pconst, is 10-4. For a Gaussian error distribution, a 70 meter event at the 10-4 level corresponds to
a standard deviation of approximately 18 meters. This fault threshold and Psat commitment thus sets a floor for the ranging
error standard deviation of 18 meters. This study uses the 70 meter fault criteria and, when applicable, a σURA of 18 meters.
METHODOLOGY
The primary mode of analysis in this study is the comparison of the estimated satellite clock and ephemeris as broadcast by the
navigation message to the precise estimates of the satellite clock and ephemeris produced by various analysis centers (AC). At
each epoch, the broadcast clock and ephemeris are differenced with the precise clock and ephemeris, and the position error is
rotated to the satellite local radial, along-track, and cross-track frame. The error is also projected onto the line of sight of a grid
of 200 evenly spaced users across the globe in order to better capture the user range error for all users. Many metrics only

consider the average URE across the globe, but for high integrity applications, we are concerned with protecting the worst case
user as well. The broadcast navigation messages are logged by the International GNSS Service (IGS) [7] receiver network.
All of the navigation message logs are downloaded and combined using a voting method as described by Heng [8]. Voting
between the logged navigation message logs is performed in order to screen out erroneous navigation message logs.
Unfortunately, the RINEX navigation message files do not have a field for FT, the GLONASS equivalent of the GPS URA
term. In the future, if the fault threshold is changed to be a function of FT, then a separate source of historical FT values will be
required for further analysis.
The precise clock and ephemeris estimates used in this study come from the Information Analytical Center of GLONASS
(IAC), which is an AC and contributor to the IGS final GLONASS ephemeris solution. The IGS final solution is not utilized
in this study because it does not include clock estimates. The error in the IAC clock and ephemeris solution is limited to <5
cm [9] and thus can be considered negligible in the evaluation of SIS URE performance. The span of this analysis is from
January 1, 2009 to December 31, 2016. IAC solutions are output at a 15 minute intervals throughout this span with rare single
satellite outages that are typically near periods where the satellite is set unhealthy, experiences an outage, or has its onboard
clock adjusted. These outages are important for the fault analysis and must be filled in; the process of investigating these
outages is discussed later in the “Methodology” section. From 2012-2016 alone, there are more than 3.5 years of precise clock
and ephemeris outage time, three of which are driven by signal outages on the L2 frequency. The IAC solution for clock and
ephemeris, while very precise, still must be adjusted for clock ensemble bias, relativistic corrections, antenna phase offset.
The clock estimates are corrected for common mode biases across all satellites at each epoch. For most of the period of study,
the bias of the precise clock ensemble versus the broadcast clock ensemble is close to zero, but during 2016 the bias grows and
must be accounted for. Care is taken to exclude outliers in the ensemble bias correction as to not allow a single fault to influence
the clock ensemble correction, which would potentially shift the clock errors across all satellites into the range of a fault when
in fact only a single satellite contained an error. The precise clocks must also be adjusted to include a relativistic correction.
Unlike GPS, where the user computes a relativistic correction to the satellite clock offsets, the GLONASS broadcast clock
already includes a relativistic correction [10]. At each epoch, the precise clocks are adjusted with a small relativistic clock
offset based on the orbital state.
The precise orbital states provided by the IAC refer to the satellite center of mass (CoM), while the broadcast navigation
message refers to the satellite antenna phase center (APC). Before comparing the precise ephemerides to the broadcast
navigation message, the IGS estimates of satellite antenna phase center offsets [11] are applied using the nominal yaw-attitude
model [12]. A previous study by Montenbruck [3] has noted that the APC offsets used by the AC are not necessarily the same
as those used by the constellation service provider (CSP), resulting in a bias in the difference between the precise and broadcast
locations of the APC. The difference in APC offset is primarily in the satellite radial direction, which contributes strongly to
a bias in the user range error. No attempt is made in this study to remove this bias by adjusting the antenna phase center offset
applied to the precise ephemerides. However, in this study, user range error is ultimately computed for an evenly-spaced,
global grid of users, and for each user at each time, the mean ranging error across all satellites in view is removed. The mean
ranging error, driven by the antenna phase center offset difference, contributes to an error for the user in time transfer but not
positioning error, which for the purpose of ARAIM is acceptable. Because the mean ranging error is removed and most of the
operational GLONASS satellites share a similar APC offset bias, the effect of the bias on the user is lessened.
Receiver measurements to fill in precise clock and ephemeris gaps
When there no precise estimates of clock and/or ephemeris for a given satellite, we can use receiver measurements to produce
SIS URE estimates to determine if a fault exists at a given epoch using techniques developed by Heng [13] and Gao [14]. The
IGS maintains a network of GPS and GLONASS receivers, and pseudorange, carrier phase, and signal to noise ratio
measurements are logged by each receiver at 30 second intervals. These measurements are logged and stored in the RINEX
format [15]. These measurements, along with the navigation message broadcast by the satellite of interest and precise clock
and ephemeris estimates from the other satellites in the constellation, can be used to produce an estimate of the SIS URE for
the satellite with missing precise data. An estimate of SIS URE from a given satellite can be developed as follows:
Construct ionosphere-free pseudorange measurements:
���������� = ��� ��� ���
�� ���
��� (1)

The ionosphere-free pseudorange measurement can be modeled as
���������� = � + ���� − ��� + � + � (2)
where r is the true range, c is the speed of light, bu is receiver clock bias, bs is the true satellite clock bias, T is the tropospheric
delay, and � is made up of all additional unmodeled effects, modeling errors, and measurement noise.
Clock and ephemeris error can be represented as
� = ��������� − ������ (3)
�� = � � ������� − ��!��" (4)
where #̂%&'�()* is the range computed using broadcast ephemeris, +,) %&'�()* is satellite clock bias computed using broadcast
clock parameters, and �-./01 and �23-24are the range errors from the broadcast orbit and broadcast clock error, respectively.
Signal-in-space user range error can then be computed:
565 6789 = ������ − ���!��" (5)
565 6789 = ��������� + �:�� − � � �������; + � + � − ���������� (6)
For a static receiver at a known location, ionosphere-free measurements from the satellite of interest, and a tropospheric delay
model, the only remaining term to find in equation (6) is the local receiver clock bias, which can be determined from
measurements from the other satellites in view. For a receiver in a known location, it has been shown that receiver clock bias
can be computed as
��< �
∑ >"��?�
∑ >"�������������� − @ABC������
��� − A����@��<� − � − � � C������� (7)
where D�E.F20)F�0�
is the precise estimate of the satellite position, +,) E.F20)F is the precise estimate of the satellite clock offset, and
G4 is a weighting factor. The weighting factor used in this analysis is based on the elevation angle of the satellite.
Using the MGEX network of IGS receivers [16], at each epoch where there are missing precise clock and ephemeris estimates
missing, an estimate of SIS URE is made from each receiver that has dual frequency measurements available. At each epoch,
the median of all SIS URE estimates across all stations is taken to be the estimated aggregate SIS URE. A simple median is
used to exclude outliers, but in the future a better estimation scheme should be used. If the median SIS URE across the stations
exceeds the 70 meter threshold while also broadcasting a healthy and valid navigation message, then the satellite is determined
to be broadcasting faulty navigation data.
The header of each RINEX observation file contains an approximate location of the receiver. However, many of these estimates
are incorrect on the order of meters, so another truth receiver location is needed. Fortunately, precise estimates of the locations
of the each receiver in the IGS receiver network are produced weekly with an accuracy of 3 mm horizontal, which is much
more accuracy than is required for this application. These precise estimates are used as the A.2'. in equation (7).
Figure 2: Fault on PRN 1, April 10, 2014 observed using
receiver measurements
Figure 3: Observed L2 signal outage on PRN11/SVN723
on March 3, 201

An example of the use of this method is shown in Figure 2. SIS URE estimates from each receiver for which PRN 1 was in
view during the interval are shown as the colored dots, and the median at each epoch is indicated by the black line. The error
grows until it breaks the fault threshold at approximately 12:30, and the fault persists until the precise estimate outage ends at
13:30, at which point the satellite begins to broadcast an unhealthy status, ending the fault. The tight agreement of the SIS
URE estimates from the individual receivers indicates that the error may be a clock error as opposed to an ephemeris error,
which would project differently onto the line-of-sight of each receiver depending on the receiver location.
Examination of the observation data from the IGS receivers, in addition to revealing otherwise hidden faults, exposed
significant periods of L2 signal outage. Figure 3 shows the start of one such outage, where on March 3, 2016, the L2 signal
appears to become either very weak or stop broadcasting entirely. Each colored line in the plot shows the measured signal to
noise ratio of PRN 11 on L1 and L2 for a different IGS receiver. At approximately 10:00 UTC, the L2 signals disappear and
do not return until June 24, 2016, at which point the L2 signal returns. A longer outage was observed on PRN 14 from January
1, 2009 (the start of this study) to October 12, 2011, when the satellite is retired. For each of these events, the satellite continues
to broadcast navigation data on L1 and is useable for a general GNSS user. However, for the ARAIM user who requires dual
frequency GNSS, these periods are considered outages and are thus excluded from this study.
RESULTS AND DISCUSSION
Fault Overview
By comparing broadcast ephemerides to precise clock and ephemeris estimates and then filling in gaps in precise data by using
receiver observations, a history of the GLONASS constellation operational status is built, shown in Figure 4. At each epoch
where a satellite is listed as operational [17], the satellite is described as being in one of several states: healthy with valid
comparison, unhealthy per the navigation message, faulted due to ephemeris error, faulted due to clock error, faulted with a yet
uncategorized error, satellite has truth data available but no broadcast navigation message was found, or navigation data was
found but no truth data exists. The intervals where navigation data was collected but no truth data exists are the periods of L2
outage as described in the “Methodology” section.
Figure 4: GLONASS Constellation Operational Status History

Unlike GPS [1], there exist periods where a navigation signal is broadcast but no navigation message is broadcast with it. These
periods are also observed and logged in the GLONASS IAC daily bulletins [18] and are generally not an outage in navigation
message logging of the IGS network. During these periods, the IGS receiver network is still able to track the signals and
produce truth estimates, but a user is unable to produce a position solution using that satellite. These satellites do not meet the
criteria for a healthy, operational satellite because the ephemeris data is greater than 15 minutes and thus out of the period of
applicability.
A signal is determined to be faulty if it meets all of the following criteria:
1. The maximum projection of the SIS error onto a terrestrial user exceeds 70 meters
2. The satellite is broadcasting that it is set healthy
3. |I − I-F| ≤ 15 minutes (the current time falls within the valid time window of a GLONASS navigation message)
Each of the red dots, circles, and squares in Figure 4 indicates a faulty satellite. The red dots and circles, the faults that have
been categorized as either clock or ephemeris faults, were detected by the maximum projected error (MPE) of the instantaneous
URE generated by comparing the broadcast navigation message to the precise clock and ephemeris products produced by the
IAC. The MPE is the maximum value of the URE seen by a user in the terrestrial volume. At each fifteen minute interval, the
fault criteria was checked and faulty epochs were compiled. Individual fault epochs were grouped into fault events by finding
continuous fault periods. The faults indicated by red stars were detected using receiver observation data. The same fault
criteria was checked using the receiver measurement residuals and again grouped into fault events.
Figure 5: Estimated narrow fault probability with varying
window length.
Figure 6: Estimated wide fault probability with varying
window length
There were a total of 348 observed single satellite faults with a mean fault duration of 1.23 hours over a period of 1,535,753
valid satellite hours. Of these, 285 faults were detected from the precise clock and ephemeris products, and 63 faults were
detected through receiver observations during periods without precise data. Given the times of each fault, the single satellite
fault rate using a sliding window can be computed using methods developed by Walter [19]. Displayed in Figure 5 is the
estimated Psat over time, which is the estimated satellite fault rate multiplied by the mean fault duration, compared to the
GLONASS draft performance specification commitment of 10-4. The data clearly shows a trend of improvement. One can
examine the 36 month window, which for this nine year period still allows for multiple independent windows and shows that
the commitment is only met for the most recent three 36-month windows, despite a small uptick in the number of faults in
2016. The estimated Psat is estimated to be 8.75x10⁻⁵ over the most recent three year window.
There were 2 observed constellation faults with a mean fault duration of 10 hours over a period of 70,128 valid constellation
hours. The wide fault probability is shown in Figure 6, computed in the same way as the narrow fault probability. Despite
there only being two events where multiple faults occurred simultaneously, the significant duration of each of them drives the
fault probability over the GLONASS draft performance commitment of 10-4.

Single satellite fault classification
The faults detected using the precise clock and ephemeris comparisons have been classified by error type and size as well as a
number of sub-classifications. Error type refers to whether the primary contributor to the MPE of the SIS URE at the time of
the fault is the clock error or the ephemeris error. Size refers to whether the MPE of the fault is less than 250 meters at any
time during the event. The 250 meter threshold is used because most “small” faults grow until they exceed the 70 meter fault
threshold and appear to be more related to propagated growth in error, while “large” faults appear to be issues with the
navigation message itself leading to erroneous broadcast clock and/or ephemeris. The faults detected using observation data
were largely left unclassified except for 16 faults manually identified as clock events. These clock events were identified by
very tight agreement in the IURE across geometrically diverse receiver stations, which implies very little ephemeris error.
Figure 7: Number of narrow fault events by type
Figure 8: Total duration of narrow fault events by type
By number of events, the faults fall overwhelmingly into two categories: large clock faults and small ephemeris faults, as shown
in Figure 7. Each of those categories contributes more than 100 faults out of the 301 categorized faults. However, Figure 8
shows that the small ephemeris faults are primarily very short events, and the large clock faults make up approximately 75%
of the fault time. The leading three fault categories by duration (large ephemeris, large clock, and small ephemeris) will be
analyzed in particular in the following section.
Figure 9: Large clock fault on PRN 21, July 21, 2013
Figure 10: Large clock fault on PRN 14, Oct. 18, 2014
Large clock events can be divided further into two primary categories- those that occurred when the satellite was set unhealthy
immediately prior to the fault event and those that occurred when the satellite was operating as normal and set healthy prior to
the fault event. Of the total 144 large clock fault events, for 104 of them, the satellite was broadcasting as unhealthy
immediately prior to the event. These events occurred primarily to satellites that were at the time set unhealthy for extended
periods and for unknown reasons set to broadcast as healthy for a short period, often only a single navigation message, despite

large, persistent clock errors. Figure 9 shows an instance of this fault mode on July 21, 2011 on PRN 21. The top plot in
Figure 9 shows that the on-orbit clock state was adjusted and the navigation message health bit was simultaneously set
unhealthy, as the broadcast clock state was not adjusted in the same manner. The difference in truth clock state and broadcast
clock state is greater than 400 meters, which is acceptable when the satellite is broadcasting a navigation message indicating
that it is unhealthy. However, a single navigation message during this period indicates that the satellite is healthy and thus is
faulty for a period lasting 30 minutes. This fault mode often appears to occur in clusters, as shown by the clusters of red circles
on SVNs 712, 715, and 716 in 2010 in Figure 4. This fault mode has not been observed since 2014, as shown in Figure 11.
The other large clock fault mode, which was observed to have occurred 40 times, occurred on satellites that were previously
broadcasting healthy status. An example of such an event is shown in Figure 10, where at 7:00 AM on October 18, 2014, the
clock error jumps to approximately 30 kilometers for a single navigation message before returning to a non-fault state. The
top plot of Figure 10 shows that the error comes from a change in the broadcast data rather than a change in the on-orbit clock
state.
Figure 11: Large clock faults over time by sub-type
Figure 12: Map of large clock faults since January 1, 2013
The majority of the large clock faults occur before 2013 with only 16 occurring after January 1, 2013. The faults that occurred
after 2013 exhibit a geographic correlation. All but two of these faults occurs within view of the three indicated GLONASS
upload stations in Figure 12, implying that there may be a relationship between the faults and navigation message uploads.
While this is not necessarily surprising, it is an important note that faults unrelated to uploads have become particularly
uncommon.
By number, small ephemeris events are dominated by a single fault mode wherein the position state provided at the time of
ephemeris in the navigation message appears to be properly set, but the velocity and/or acceleration terms create significant
error as the user propagates the broadcast ephemeris to the current time. Unlike GPS, which broadcasts its ephemeris in the
form of Keplerian elements, the GLONASS broadcast ephemeris is broadcast as a state vector of position, velocity, and
acceleration at the time of ephemeris that the user must then propagate. Of the 106 total small ephemeris events, 101 fall under
the category of broadcasting faulty velocity and/or acceleration terms. An important note is that each individual navigation
message that broadcasts erroneous velocity and/or acceleration terms contributes its own fault event because when the current
time is the time of ephemeris, the navigation message does not need to be propagated and the SIS URE is close to zero. As the
user propagates the navigation message, the error grows until it crosses the fault threshold. Because of this, a span of three
navigation messages with bad velocity and acceleration terms will lead to four faults. From the perspective of the CSP, this
may be considered a single event, but the user sees each fault event individually. An example of this fault mode can be seen
in Figure 13. At approximately 6:00, the MPE, driven by the ephemeris, alternates between large and small at each 15 minute
interval, indicating that the position state contained in the navigation message was providing nominal performance, but the
propagation from the time of ephemeris introduced large errors. The majority of the faults with bad velocity and/or acceleration
took place in a single span from July 29-31, 2010, as shown in Table 1. The most recent observed fault of this type was in
June, 2014.

Figure 13: Small ephemeris faults on PRN 20, July 29, 2010 with faulty velocity/acceleration upload
Table 1: Small ephemeris faults with bad velocity and/or acceleration
PRN SVN Date # of affected Nav. Messages
20 719 July 29-31, 2010 85
20 719 August 1, 2010 3
20 719 August 2, 2010 2
21 725 November 02, 2013 8
19 720 June 14, 2014 3
Large ephemeris faults were observed for the third longest duration during the span of the study behind the large clock faults
and small ephemeris faults. Of the 22 observed fault events, 11 of them were only single navigation message events that lasted
30 minutes or less. However, there were also 6 events lasting one hour, and the longest event was 4.5 hours. These events
display a somewhat different trend over time than the previous categories in that during the most recent year of the study, 2016,
the most fault time was experienced. After experiencing only two hours of large ephemeris fault in 2012 and a single hour in
2013, there were no observed large ephemeris faults in 2014 or 2015. The vast majority of large ephemeris fault time was
observed in 2016 with 13.75 hours. This fault time is primarily driven by a periods of occasional faulty behavior across two
satellites- SVN 721 and SVN 742. SVN 742 experiences four faults lasting a total of 8.25 hours in a period of approximately
12 hours from December 23, 2016 to December 24, 2016. These faults are interspersed with healthy periods with no faults,
and the faults produce ranging errors on the order of thousands of kilometers. The SVN 721 case is significantly more spread
out. The six faults it experiences are spread across a nearly month-long period from September 12, 2016 to October 6, 2016.
During this period, the satellite frequently broadcasts ranging signals without an accompanying navigation message. None of
the faults on SVN 721 during this interval last more than 30 minutes. The satellite begins to consistently broadcast navigation
messages without faults after this period.
Constellation faults
The two observed constellation faults have been discussed in previous literature [13], but we will still briefly mention them.
One significant point of interest is that while the two events are both constellation faults, the entirety of the span may not be
considered a constellation fault. At the beginning and end of the constellation fault event in October 2009 and at the end of the
April 2014 constellation fault event, there exists a period where there is only a single satellite experiencing a service failure.
Because a user during those periods would only have knowledge of the single fault, these periods are considered single satellite
faults and these events contain both constellation faults and single satellite faults.

Figure 14: October 2009 constellation fault
Figure 15: April 2014 constellation fault
Error distributions
Figure 16: Radial, along-track, cross-track, clock, and instantaneous URE error per satellite over the period of 2009-2016.
The satellite clock and ephemeris has been characterized using the precise clock and ephemeris comparisons, and the mean,
68% error bound, and 95% error bound for the satellite radial, along-track, cross-track, clock, and instantaneous user range
error are displayed in Figure 16. As is the case for GPS, the radial error is the smallest component of the position error. As
was mentioned in the “Methodology” section, there exists a bias in the radial error that stems from the IGS use of a different
antenna phase center offset than the CSP. For block M satellites, this offset is approximately 0.5 meters. This bias does not
appear in the URE because it affects nearly the entire modern constellation and so to the user appears to be closer to a common-
mode ranging bias across all satellites and thus only impacts the IURE to a small degree. The oldest three block M satellites,
701 M, 712 M, and 713 M, demonstrated noticeably worse performance than their successors with both large clock and
ephemeris error distributions. The along-track error suffers from large variances but close to zero mean error. This can perhaps
be attributed to a lack of observability of the satellites in the along-track direction by the monitoring stations, which for most
of this period were located only in the Russian territory. The cross-track error is generally also close to zero mean with a smaller
variance than the along-track error. The newest block M satellites show the best clock performance, and many of the older
satellites exhibit a mean clock error of up to 5 meters with similarly sized standard deviations. The clock error tends to dominate
the IURE, as the radial error is typically smaller. Because of the removal of the older, worse performing satellites, overall
nominal constellation performance has improved over the span of 2009 to 2016. Figure 17 shows the probability density
function of the errors shown in Figure 16 aggregated across all satellites and shows the same trends as identified previously.
The radial error is the most tightly distributed but exhibits a bias due to the antenna phase center offset, and the along-track and
cross-track exhibit larger spreads. The clock error, on aggregate across all satellites, shows a similar distribution to the cross-
track error, and the IURE distribution, driven by the clock error, shows a slightly larger spread.
Figure 17: Probability density function of SIS error by component and IURE error aggregated across all SVNs, 2009-2016
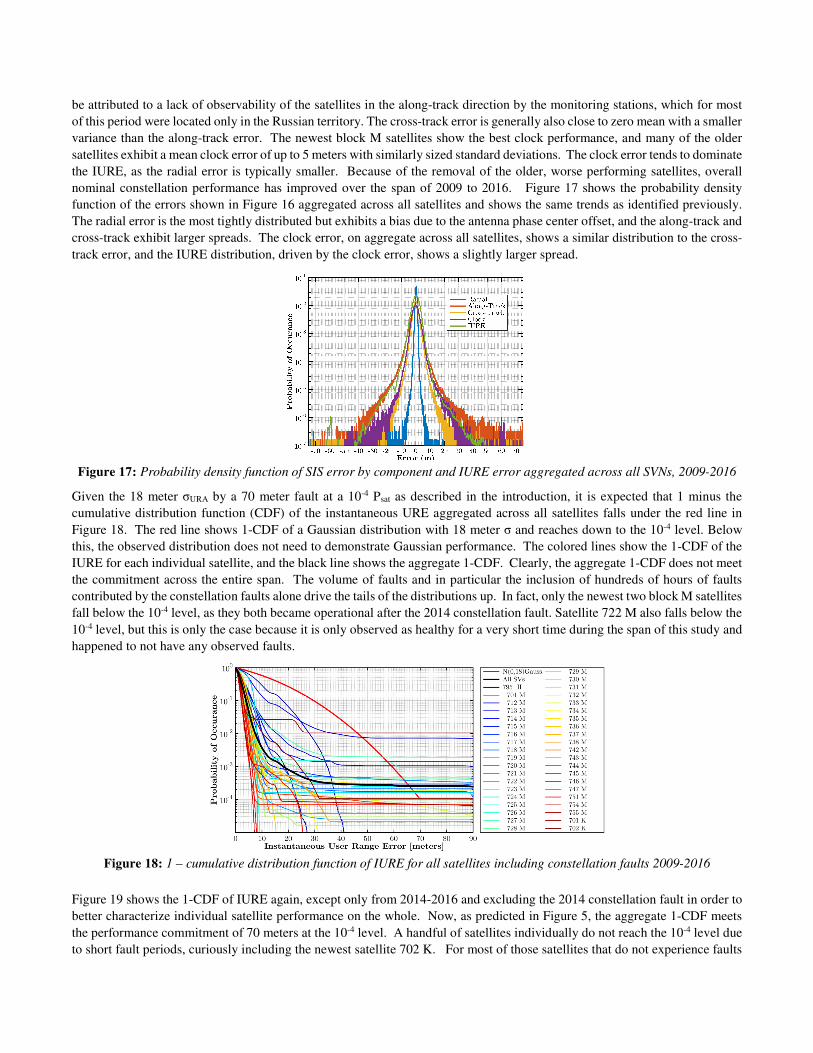
Given the 18 meter σURA by a 70 meter fault at a 10-4 Psat as described in the introduction, it is expected that 1 minus the
cumulative distribution function (CDF) of the instantaneous URE aggregated across all satellites falls under the red line in
Figure 18. The red line shows 1-CDF of a Gaussian distribution with 18 meter σ and reaches down to the 10-4 level. Below
this, the observed distribution does not need to demonstrate Gaussian performance. The colored lines show the 1-CDF of the
IURE for each individual satellite, and the black line shows the aggregate 1-CDF. Clearly, the aggregate 1-CDF does not meet
the commitment across the entire span. The volume of faults and in particular the inclusion of hundreds of hours of faults
contributed by the constellation faults alone drive the tails of the distributions up. In fact, only the newest two block M satellites
fall below the 10-4 level, as they both became operational after the 2014 constellation fault. Satellite 722 M also falls below the
10-4 level, but this is only the case because it is only observed as healthy for a very short time during the span of this study and
happened to not have any observed faults.
Figure 18: 1 – cumulative distribution function of IURE for all satellites including constellation faults 2009-2016
Figure 19 shows the 1-CDF of IURE again, except only from 2014-2016 and excluding the 2014 constellation fault in order to
better characterize individual satellite performance on the whole. Now, as predicted in Figure 5, the aggregate 1-CDF meets
the performance commitment of 70 meters at the 10-4 level. A handful of satellites individually do not reach the 10-4 level due
to short fault periods, curiously including the newest satellite 702 K. For most of those satellites that do not experience faults

during this interval, there is a significant amount of margin between the observed distribution and the red line Gaussian
depicting the commitment.
Figure 19: 1- cumulative distribution function (CDF) of IURE for all satellites excluding constellation faults 2014-2016
Nominal error characterization
The nominal ranging performance is examined by removing any periods where the satellite is faulted from the data and then
finding the overbounding sigma of the remaining distributions. This is the minimum sigma of a Gaussian distribution that
would overbound the distributions in Figure 19 excluding the fault epochs. Figure 20 shows the result of this process over the
period of 2014-2016. Of the 19 satellites that were active at any point in this period, 16 of them have an associated
overbounding sigma of less than three meters, which means that the 18 meter standard deviation implied by the Psat commitment
is extremely conservative. However, there are notable exceptions in SVN 715 M and SVN 721 M, which both go through
periods of error greater than 30 meter URE, leading to very large bounding sigmas. In fact, the overbounding sigma for SVN
721 M is slightly larger than 18 meters due to significant periods of URE greater than 50 meters. For most, but not all
GLONASS satellites, nominal performance is conservatively bounded by the 18 meter σURA.
Figure 20: Overbounding sigma of nominal IURE distributions for all satellites 2014-2016
For even position solutions that involve zero faulty satellites, it is possible for a combination of non-faulted ranging signals to
contribute coherently to a large position solution error. In order to quantify this effect, at each epoch and for each user in the
evenly spaced global grid, the square root of the sum of the squares of the IUREs minus the common mode error is computed;
this is the chi-squared distribution. The IURE is scaled by the σURA of 18 meters, and the probability density function is plotted
in Figure 21. The 1-CDF of the same function is plotted in Figure 22. Both of these plots show that the nominal ranging error
is well behaved relative to the 18 meter URA. The largest root sum squared error across all satellites in view normalized by
the 18 meter σURA is less than 4, which means that for those cases that a single satellite exhibits an error greater than 3 x σURA,

the other satellites in view must each then exhibit errors of much less than 1 x σURA. Concurrent errors that are large relative to
the 18 meter σURA are rare for the GLONASS constellation since 2014.
Figure 21: χ2 probability density function with faults
removed 2014-2016
Figure 22: χ2 1-CDF with faults removed 2014-2016
CONCLUSIONS
This paper has analyzed 8 years of GLONASS data to determine satellite and constellation fault rates as well as characterize
the error distributions. We have found that in the most recent three year span has the narrow fault rate fallen below the
commitment of 10-4, and the data suggests that the constellation fault rate commitment is not met at all during this span. We
characterized and categorized individual faults and aggregated statistics on the types of faults. Several fault modes have been
identified, and some of them have not been observed since 2014. The single satellite faults were found to be primarily made
up of large clock faults in the year occurring before 2013, and over 100 ephemeris faults were identified during a three day
span in 2010.
The nominal ranging errors have been characterized, where the clock error dominates the URE across most satellites, and the
radial error for many of the Block M satellites exhibits a bias due to the antenna phase center offset. Despite the fault rate, the
nominal performance has been found to be conservatively bounded by the 18 meter URA. Future work will be to find a source
of the GLONASS FT navigation message values and to continue the monitoring and evaluation of GLONASS and other GNSS
constellations. Greater communication with the GLONASS operators will be sought to better understand constellation
operation changes.
ACKNOWLEDGMENTS
The authors would like to gratefully acknowledge the FAA Satellite Navigation Management Team for supporting this work
under Cooperative Agreement 2012-G-003. The opinions expressed in this paper are the authors’.
REFERENCES
[1] T. Walter and J. Blanch, "Characterization of GPS Clock and Ephemeris Errors to Support ARAIM," in Proceedings
of the ION 2015 Pacific PNT Meeting, Honolulu, Hawaii, 2015, pp. 920-931.
[2] S. Perea Diaz, M. Meurer, M. Rippl, B. Belabbas, M. Joerger, and B. Pervan, "URA/SISA Analysis for GPS-Galileo
ARAIM Integrity Support Message," 2015.
[3] O. Montenbruck, P. Steigenberger, and A. Hauschild, "Broadcast versus precise ephemerides: a multi-GNSS
perspective," GPS Solutions, vol. 19, no. 2, pp. 321-333, 2015// 2015.
[4] L. Heng, G. X. Gao, T. Walter, and P. Enge, "GLONASS Signal-in-Space Anomalies Since 2009," in Proceedings of
the 25th International Technical Meeting of The Satellite Division of the Institute of Navigation (ION GNSS 2012),
Nashville, TN, 2012, pp. 833-842.

[5] L. Heng, G. X. Gao, T. Walter, and P. Enge, "Statistical characterization of GLONASS broadcast clock errors and
signal-in-space errors," in Proceedings of the 2012 International Technical Meeting of the Institute of Navigation
(ION ITM 2012), Newport Beach, CA, 2012, pp. 1697-1707.
[6] S. K. Vladimir Korchagin, A. Bolkunov, "GLONASS Status," in "Navigation Systems Panel," International Civil
Aviation Organization2016.
[7] J. M. Dow, R. E. Neilan, and C. Rizos, "The International GNSS Service in a changing landscape of Global Navigation
Satellite Systems," Journal of Geodesy, journal article vol. 83, no. 3, pp. 191-198, 2009.
[8] L. Heng, G. X. Gao, T. Walter, and P. Enge, "GPS Signal-in-Space Integrity Performance Evolution in the Last
Decade," IEEE Transactions on Aerospace and Electronic Systems, vol. 48, no. 4, pp. 2932-2946, 2012.
[9] I. G. Service, "Figures and Statistics from the IGS Final GLONASS Orbit Combination."
[10] (2008). GLONASS Interface Control Document.
[11] I. G. Service. IGS Antenna Phase Center Offsets. Available: ftp://igscb.jpl.nasa.gov/pub/station/general/igs08.atx
[12] O. Montenbruck et al., "GNSS satellite geometry and attitude models," Advances in Space Research, vol. 56, no. 6,
pp. 1015-1029, 9/15/ 2015.
[13] L. Heng, "Safe Satellite Navigation with Multiple Constellations: Global Monitoring of GPS and GLONASS Signal-
in-Space Anomalies," 2012.
[14] G. X. Gao, H. Tang, J. Blanch, J. Lee, T. Walter, and P. Enge, "Methodology and case studies of signal-in-space error
calculation: Top-down meets bottom-up," 2009.
[15] W. G. a. L. Estey, "The Receiver Independent Exchange Format Version 3.00," 2007.
[16] C. Rizos, O. Montenbruck, R. Weber, G. Weber, R. Neilan, and U. Hugentobler, "The IGS MGEX experiment as a
milestone for a comprehensive multi-GNSS service," Proceedings of ION PNT, pp. 289-295, 2013.
[17] G. SVOEVP. GLONASS Constellation Status History. Available: http://glonass-svoevp.ru/index.php?lang=en
[18] N. a. T. G. Information and Analysis Center for Position. Archive of GLONASS Daily Bulletins. Available:
https://www.glonass-iac.ru/en/
[19] T. Walter, J. Blanch, M. Joerger, and B. Pervan, "Determination of fault probabilities for ARAIM," in 2016 IEEE/ION
Position, Location and Navigation Symposium (PLANS), 2016, pp. 451-461: IEEE.