carbon pricing watch 2017 -...
TRANSCRIPT
AT A GLANCE – NEW CARBON PRICING OPPORTUNITIES IN THE PARIS AGREEMENT ERA
2016 marked the start of a new era in global action against climate change, with the entry into force of the Paris Agreement on November 4, less than a year after its adoption. The Marrakech Action Proclamation, issued at the end of the 22nd Conference of the Parties (COP 22) to the United Nations Framework Convention on Climate Change (UNFCCC) in November 2016, reaffirmed the Parties’ commitment
to the implementation of the Paris Agreement and encouraged the ratification of the Doha Amendment to the Kyoto Protocol.1 Parties will present the rulebooka to implement the Paris Agreement by COP 24, which will take place in 2018.
Parties stating in their Nationally Determined Contributions (NDCs)b that they are considering the use of carbon pricing cover 58 percent of global greenhouse gas (GHG) emissions. As these Parties—accounting for about two thirds of the submitted NDCs—move forward in the next few years to adopt and implement policies to achieve their NDCs, there will be scope for active consideration of domestic, regional and international emissions trading systems (ETSs) and carbon taxes that could lead to significant cost savings.
a The rulebook refers to the set of decisions needed to operationalize the Paris Agreement. Such decisions are needed on a wide range of topics, including inter alia Nationally Determined Contributions (NDCs), the transparency framework, the global stocktake, implementation and compliance, cooperative mechanisms, and the accounting framework for climate action.
b Intended Nationally Determined Contributions (INDCs) are in the process of being confirmed as NDCs as Parties ratify the Paris Agreement. For the sake of simplicity, this brief refers to NDCs for NDCs as well as INDCs which will be confirmed as NDCs upon ratification.
AN ADVANCE BRIEF FROM THE “STATE AND TRENDS OF CARBON PRICING 2017 ” REPORT, TO BE RELEASED LATE 2017
Carbon Pricing Watch 2017
2
The finalization of the Paris Agreement rulebook with respect to cooperative approaches to reducing emissions under Article 6 will enable Parties to assess the potential use of international market mechanisms.
In addition, Member States of the International Civil Aviation Organization (ICAO) have agreed on the first global sectoral carbon pricing initiative. ICAO’s Carbon Offsetting and Reduction Scheme for International Aviation was adopted on October 7, 2016, capping GHG emissions from international aviation at 2020 levels.
These cooperative actions against climate change come at a time where global temperature records continue to be broken. 2016 was the third consecutive warmest year since records began in 1880.2
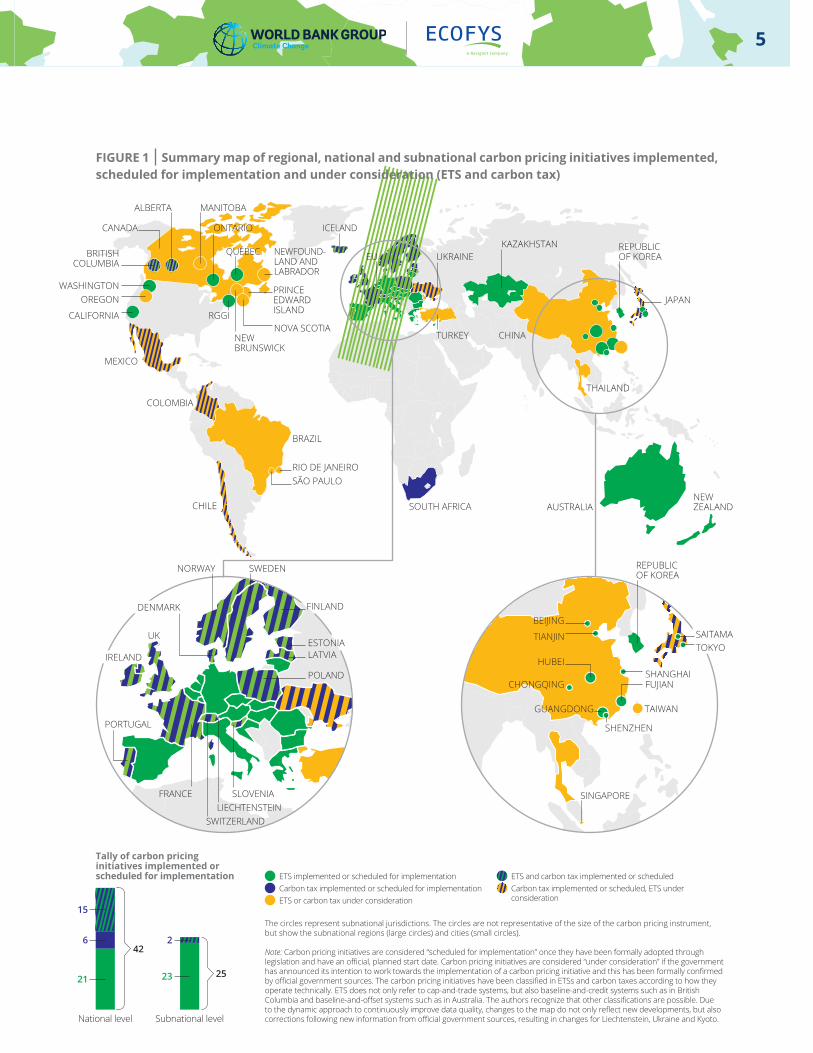
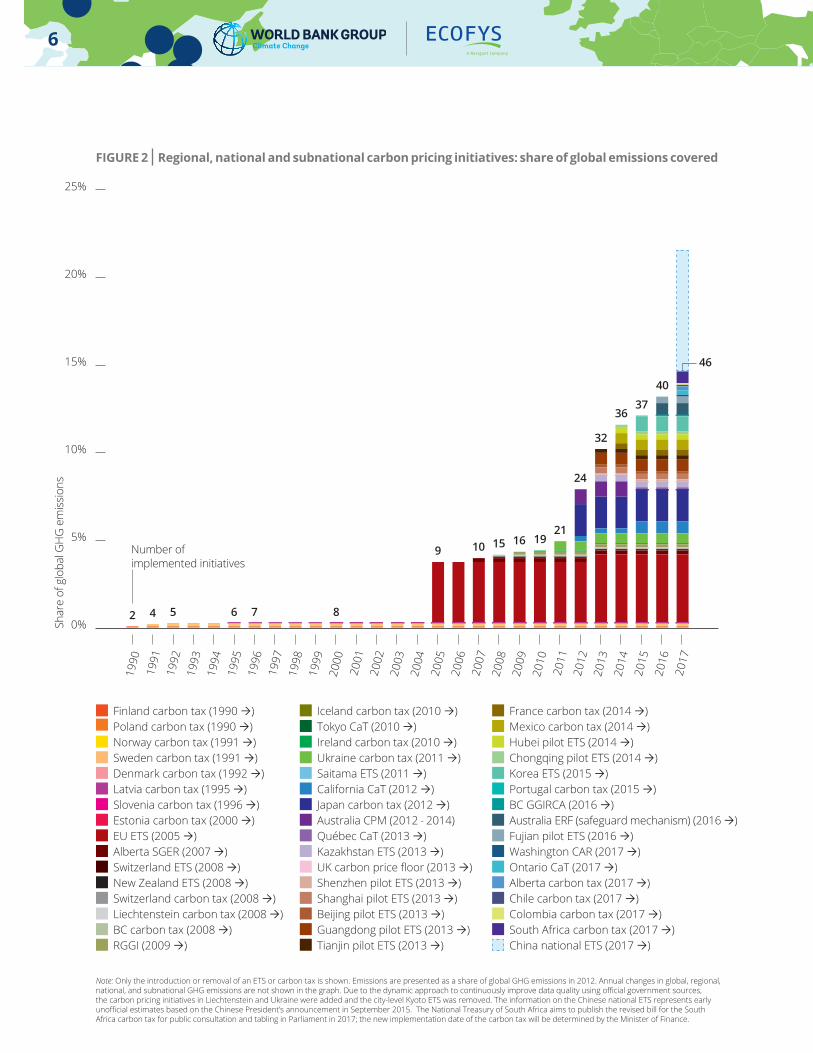
At the national and subnational level, new initiatives can build on substantial progress and experience with carbon pricing over the last 25 years. As of 2017, over 40 national and 25 subnational jurisdictionsc are putting a price on carbon, as shown in Figure 1. Over the past decade, the number of jurisdictions with carbon pricing initiatives has doubled. These jurisdictions are responsible for about a quarter of global GHG emissions. On average, carbon pricing initiatives implemented and scheduled for implementation cover about half of the emissions in these jurisdictions. These numbers translate to a total coverage of about 8 gigatons of carbon dioxide equivalent (GtCO2e) or about 15 percent of global GHG emissions, as displayed in Figure 2. Emissions covered by carbon pricing have increased almost fourfold over the past decade. Figure 2 also shows that the number of carbon pricing initiatives implemented or scheduled for implementation has quadrupled in the past decade and almost doubled over the last five years, reaching 46 in 2017.d
Since 2016,e eight new carbon pricing initiatives have been implemented, highlighting the continued momentum for carbon pricing:
— In 2016: – The Greenhouse Gas Industrial Reporting and
Control Act in British Columbia, establishing a baseline-and-credit systemf in addition to the province’s existing revenue neutral carbon tax;
– The safeguard mechanism to the Emissions Reduction Fund in Australia, launching a baseline-and-offset system; g
– A pilot ETS in Fujian which covers GHG emissions in 2016, in preparation for the introduction of the Chinese national ETS later in 2017.
— In 2017: – A carbon tax in Alberta, covering all GHG
emissions from combustion that are not covered by its existing carbon pricing initiative for large emitters;
– A carbon tax in Chile, which applies to CO2 emissions from large emitters from the power and industrial sector;
– An economy-wide carbon tax in Colombia on all liquid and gaseous fossil fuels used for combustion;
– An ETS in Ontario, covering GHG emissions from industry, electricity generators and importers, natural gas distributors and fuel suppliers;
– The Clean Air Rule in Washington State, establishing a baseline-and-credit system which initially covers fuel distributors and industrial companies that are not considered to be energy intensive nor trade exposed.
c Cities, states, and subnational regions.d In 2007, 10 carbon pricing initiatives were implemented or scheduled
for implementation, increasing to 24 in 2012 and 46 in 2017.
e This brief covers the period from January 1, 2016 until May 1, 2017.f A baseline-and-credit system is an ETS where baseline emissions
levels are defined for individual installations and credits are issued to installations that have reduced their emissions below this level which can be sold to other installations exceeding their baseline emission levels.
g In a baseline-and-offset system, targets or baseline emission levels are defined for individual emitters or groups of emitters and emitters that exceed their baseline emissions can purchase offsets to meet their compliance obligations. In contrast to a baseline-and-credit system, emitters do not automatically receive credits for the emissions they have reduced below their baseline level.
3
In addition, China is gearing up for the commencement of its national ETS, which is planned for the second half of 2017. This will be the largest carbon pricing initiative in the world, surpassing the European Union ETS (EU ETS). Already, the eight Chinese ETS pilots collectively cover 1.2 GtCO2e, or about ten percent of the country’s GHG emissions. Following the launch of the Chinese national ETS, the emissions covered by the world’s largest emitter could increase fourfold.h
The number of carbon pricing initiatives will continue to grow, with several new initiatives under consideration. In the Americas, Canada and the Pacific Alliance countriesi have been at the forefront on carbon pricing developments. In Canada, a national framework was put forward by the government in 2016, requiring all jurisdictions to implement a carbon price by 2018. Jurisdictions that do not already have existing carbon pricing initiatives have taken steps to implement this requirement. Newfoundland and Labrador introduced legislation for a carbon pricing initiative and Nova Scotia announced that it intends to implement a cap-and-trade system. New Brunswick and Prince Edward Island are considering different carbon pricing options. Although Manitoba is not a signatory to the national framework, carbon pricing is nonetheless under consideration. Furthermore, Mexico started a one-year ETS simulation to create domestic awareness and prepare for the launch of an ETS in 2018, while Colombia and Chile continue to consider setting up an ETS following the introduction of their carbon taxes. Also, Kazakhstan is intending to re-launch its ETS in 2018, following a two-year suspension, and Singapore has announced that it intends to implement a carbon pricing initiative in 2019.
Despite these positive international developments, prospects for climate action and carbon pricing in other jurisdictions have slowed or remain uncertain. Following the outcome of the 2016 United States presidential election, the new administration is moving to rescind or review several federal energy- and climate-related policies such as the Clean Power Plan. In addition, the launch of the carbon tax in South Africa has been delayed again; a new start date is expected to be announced during 2017.
In 2016, governments raised about US$22 billion in carbon pricing revenues from allowance auctions, direct payments to meet compliance obligations and carbon tax receipts, a decrease compared to the US$26 billion raised in 2015. This drop is largely due to the lower carbon prices in the EU ETS and Regional Greenhouse Gas Initiative and a large amount of unsold allowances in California and Québec, as well as a drop in revenues from some carbon taxes, in particular, the United Kingdom (UK) carbon price floor. The latter was lower than anticipated due to large GHG emission reductions in the power sector. The UK’s consumption of coal for electricity generation decreased by 76 percent in 2016 compared to 2013 when the Carbon Price Floor was introduced—the lowest level since 1934.3 This trend highlights the influence of carbon pricing in changing the energy mix.
The total value of ETSs and carbon taxes in 2017 is US$52 billion,j an increase of seven percent compared to 2016. This increase is primarily due to the launch of several carbon pricing initiatives at the end of 2016 and in 2017. Part of this increase is offset by lower carbon prices and decreasing caps in some ETSs.
h The emissions to be covered under the Chinese national ETS are estimated to be about half of China’s national GHG emissions, based on the sector scope, as stated in the “US-China Joint Presidential Statement on Climate Change”, and public emissions data from the International Energy Agency. This estimate has not been validated by Chinese authorities. Informed researchers have judged that the GHG emissions coverage could potentially be about 40 percent of China’s total GHG emissions.
i The Pacific Alliance consists of Chile, Colombia, Mexico and Peru.
j The total value of ETS markets was estimated by multiplying each ETS’s annual allowance or credit volume for 2017, or the most recent yearly volume data, with the price of the emission unit on April 1, 2017. The total value for carbon taxes was derived from official government budgets for 2017. Where the allowance or credit volume (for an ETS) or budget information (for a carbon tax) was unavailable, the value of the carbon pricing initiative was calculated by multiplying the GHG emissions covered with the nominal carbon price on April 1, 2017. No information was available on the amount of emission reduction credits which could be generated by facilities under the Washington State Clean Air Rule or offsets under the Australian safeguard mechanism. Also, the Chinese national ETS and South Africa carbon tax are yet to be implemented. Therefore, these were not included in the value calculation.
4
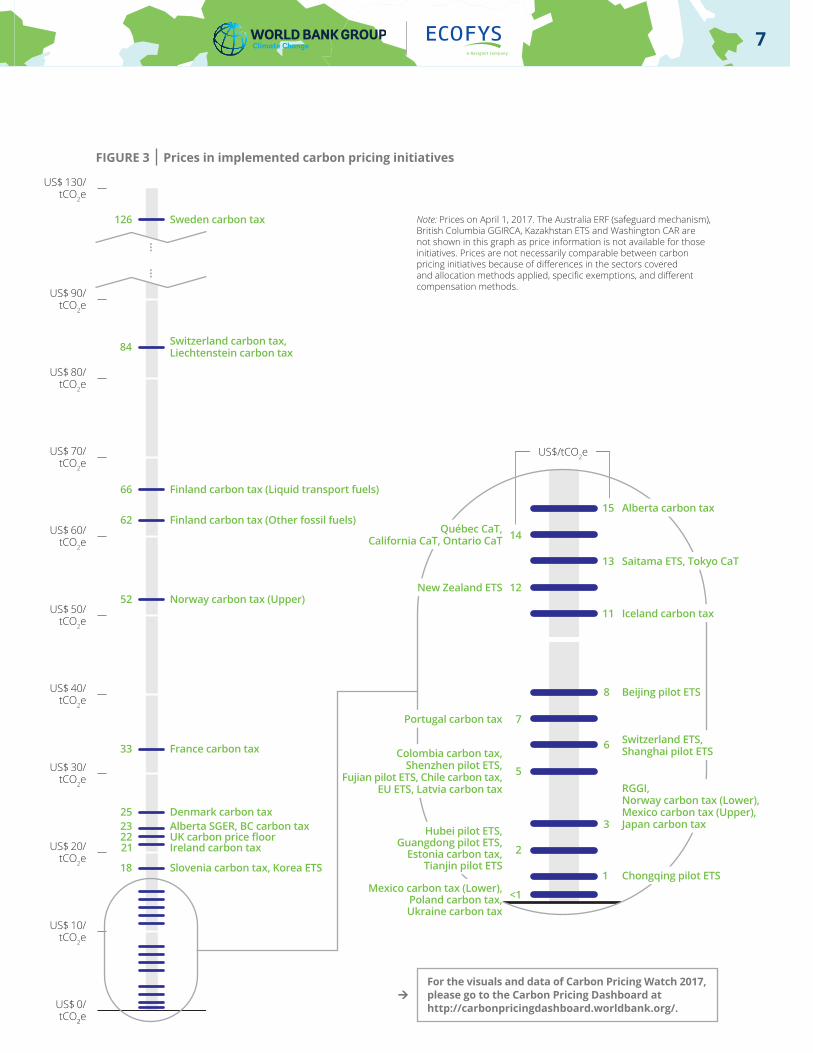
The observed carbon prices span a wide range, from less than US$1 up to US$126/tCO2e, as shown in Figure 3. Despite an increase in average prices witnessed in some newer initiatives such as in France and the Republic of Korea, about three quarters of covered emissions remain priced at less than US$10/tCO2e. Higher prices will be needed to increase the economic impact of carbon pricing and contribute to achieving the Paris Agreement temperature goal. To that end, the High-Level Commission on Carbon Prices4 was launched at the COP 22 to identify indicative corridors of carbon prices which can be used to guide the design of carbon pricing instruments and other climate policies.k This is complemented by a similar initiative from the private sector—the Carbon Pricing Corridors initiative led by CDP and We Mean Business.
Momentum is also building for carbon pricing in the private sector, where an increasing number of companies are actively managing climate-related risks. The number of companies that reported to CDP that they are currently using an internal price on carbon in 2016 has more than tripled compared to 2014.5 Further adoption of internal carbon pricing is anticipated following the recommendations of the Financial Stability Board l (FSB) Task Force on Climate-related Financial Disclosures. These recommendations advise companies to disclose climate-related financial risks and opportunities and to report the internal carbon prices used.
Looking ahead, carbon pricing could play a pivotal role in enabling countries to meet their NDCs to the Paris Agreement through both domestic carbon pricing initiatives and by facilitating international cooperation. The implementation of these initiatives will enable Parties to achieve emission reductions at lower cost and to raise their ambition to meet the Paris Agreement pledge to keep the global average temperature increase to well below 2°C and pursue efforts to hold the increase to 1.5°C.
The State and Trends of Carbon Pricing 2017 report, which will be published in October 2017, will expand on the carbon pricing developments in this brief. Furthermore, the 2017 report will explore how developing countries can harness the synergies between carbon pricing and fiscal policies. The report will also build on modeling analysis of cost savings under an international carbon market and outline strategies for the use of climate finance to help build an international carbon market.
In addition, in May 2017 the World Bank launched the Carbon Pricing Dashboard website, adding an interactive dimension to the annual State and Trends of Carbon Pricing reports. This resource provides an up-to-date overview of carbon pricing initiatives and allows users to navigate through the visuals and data of Carbon Pricing Watch 2017. Please visit http://carbonpricingdashboard.worldbank.org/ to get started.
k The High-Level Commission on Carbon Pricing is co-chaired by Joseph Stiglitz, Nobel Laureate in Economics, and Lord Nicholas Stern. Its objective is to identify indicative carbon price corridors—carbon price ranges which reflect the ambition of the Paris Agreement and support the achievement of the Sustainable Development Goals—to support the design of carbon pricing initiatives or other climate policies.
l The FSB is an international organization composed of senior policy makers from ministries of finance, central banks, and supervisory and regulatory authorities in the G20 and four other key financial centres—Hong Kong, Singapore, Spain and Switzerland. It also includes international financial institutions and standard-setting bodies. The FSB promotes global financial stability by coordinating the development of regulatory, supervisory and other financial sector policies.
5
ETS implemented or scheduled for implementation
Carbon tax implemented or scheduled for implementation
ETS or carbon tax under consideration
ETS and carbon tax implemented or scheduled
Carbon tax implemented or scheduled, ETS under consideration
The circles represent subnational jurisdictions. The circles are not representative of the size of the carbon pricing instrument, but show the subnational regions (large circles) and cities (small circles).
Note: Carbon pricing initiatives are considered “scheduled for implementation” once they have been formally adopted through legislation and have an official, planned start date. Carbon pricing initiatives are considered “under consideration” if the government has announced its intention to work towards the implementation of a carbon pricing initiative and this has been formally confirmed by official government sources. The carbon pricing initiatives have been classified in ETSs and carbon taxes according to how they operate technically. ETS does not only refer to cap-and-trade systems, but also baseline-and-credit systems such as in British Columbia and baseline-and-offset systems such as in Australia. The authors recognize that other classifications are possible. Due to the dynamic approach to continuously improve data quality, changes to the map do not only reflect new developments, but also corrections following new information from official government sources, resulting in changes for Liechtenstein, Ukraine and Kyoto.
Tally of carbon pricing initiatives implemented or scheduled for implementation
National level
21
15
642
Subnational level
25
2
23
SHANGHAI
SHENZHEN
SINGAPORE
TAIWAN
FUJIAN
REPUBLIC OF KOREA
BEIJING
TIANJIN
HUBEI
CHONGQING
GUANGDONG
TOKYOSAITAMA
NORWAY
UK
PORTUGAL
FRANCE
SWITZERLAND
SLOVENIA
POLAND
LATVIAESTONIA
FINLAND
SWEDEN
DENMARK
IRELAND
LIECHTENSTEIN
CHILE
SÃO PAULO
NEWFOUND-LAND AND LABRADOR
NEW BRUNSWICK
PRINCE EDWARD ISLAND
NOVA SCOTIATURKEY
UKRAINE
CHINA
ALBERTA
CANADA
BRITISH COLUMBIA
WASHINGTONOREGON
CALIFORNIA
MEXICO
MANITOBA
ONTARIO
QUÉBEC
RGGI
BRAZIL
RIO DE JANEIRO
SOUTH AFRICA AUSTRALIANEW ZEALAND
THAILAND
EUKAZAKHSTAN REPUBLIC
OF KOREA
JAPAN
ICELAND
COLOMBIA
FIGURE 1 Summary map of regional, national and subnational carbon pricing initiatives implemented, scheduled for implementation and under consideration (ETS and carbon tax)
6
Note: Only the introduction or removal of an ETS or carbon tax is shown. Emissions are presented as a share of global GHG emissions in 2012. Annual changes in global, regional, national, and subnational GHG emissions are not shown in the graph. Due to the dynamic approach to continuously improve data quality using official government sources, the carbon pricing initiatives in Liechtenstein and Ukraine were added and the city-level Kyoto ETS was removed. The information on the Chinese national ETS represents early unofficial estimates based on the Chinese President’s announcement in September 2015. The National Treasury of South Africa aims to publish the revised bill for the South Africa carbon tax for public consultation and tabling in Parliament in 2017; the new implementation date of the carbon tax will be determined by the Minister of Finance.
FIGURE 2 Regional, national and subnational carbon pricing initiatives: share of global emissions covered
Finland carbon tax (1990 ) Poland carbon tax (1990 ) Norway carbon tax (1991 ) Sweden carbon tax (1991 ) Denmark carbon tax (1992 ) Latvia carbon tax (1995 ) Slovenia carbon tax (1996 ) Estonia carbon tax (2000 ) EU ETS (2005 ) Alberta SGER (2007 ) Switzerland ETS (2008 ) New Zealand ETS (2008 ) Switzerland carbon tax (2008 ) Liechtenstein carbon tax (2008 ) BC carbon tax (2008 ) RGGI (2009 )
Iceland carbon tax (2010 ) Tokyo CaT (2010 ) Ireland carbon tax (2010 ) Ukraine carbon tax (2011 ) Saitama ETS (2011 ) California CaT (2012 ) Japan carbon tax (2012 ) Australia CPM (2012 - 2014) Québec CaT (2013 ) Kazakhstan ETS (2013 ) UK carbon price floor (2013 ) Shenzhen pilot ETS (2013 ) Shanghai pilot ETS (2013 ) Beijing pilot ETS (2013 ) Guangdong pilot ETS (2013 ) Tianjin pilot ETS (2013 )
France carbon tax (2014 ) Mexico carbon tax (2014 ) Hubei pilot ETS (2014 ) Chongqing pilot ETS (2014 ) Korea ETS (2015 ) Portugal carbon tax (2015 ) BC GGIRCA (2016 ) Australia ERF (safeguard mechanism) (2016 ) Fujian pilot ETS (2016 ) Washington CAR (2017 ) Ontario CaT (2017 ) Alberta carbon tax (2017 ) Chile carbon tax (2017 ) Colombia carbon tax (2017 ) South Africa carbon tax (2017 ) China national ETS (2017 )
4 5 6 7 8
9 10 15 16 1921
24
32
3637
40
2
Number of implemented initiatives
46
Shar
e of
glo
bal G
HG
em
issi
ons
25%
20%
15%
10%
5%
0%
1990
1992
1995
2000
1998
2003
2004
2005
1991
1994
1997
2002
1993
1996
2001
1999
2006
2007
2008
2009
2010
2011
2012
2013
2014
2015
2016
2017
7
FIGURE 3 Prices in implemented carbon pricing initiatives
US$/tCO2e
15 Alberta carbon tax
13 Saitama ETS, Tokyo CaT
6 Switzerland ETS, Shanghai pilot ETS
RGGI, Norway carbon tax (Lower), Mexico carbon tax (Upper), 3 Japan carbon tax
11 Iceland carbon tax
1 Chongqing pilot ETS
8 Beijing pilot ETS
5
Colombia carbon tax, Shenzhen pilot ETS,
Fujian pilot ETS, Chile carbon tax, EU ETS, Latvia carbon tax
2
Hubei pilot ETS, Guangdong pilot ETS,
Estonia carbon tax, Tianjin pilot ETS
12New Zealand ETS
7Portugal carbon tax
<1 Mexico carbon tax (Lower), Poland carbon tax, Ukraine carbon tax
14Québec CaT, California CaT, Ontario CaT
US$ 0/ tCO2e
US$ 10/ tCO2e
US$ 20/ tCO2e
US$ 30/ tCO2e
US$ 40/ tCO2e
US$ 50/ tCO2e
US$ 60/ tCO2e
US$ 70/ tCO2e
US$ 80/ tCO2e
US$ 90/ tCO2e
US$ 130/ tCO2e
23 Alberta SGER, BC carbon tax22 UK carbon price floor21 Ireland carbon tax
18 Slovenia carbon tax, Korea ETS
126 Sweden carbon tax
66 Finland carbon tax (Liquid transport fuels)
62 Finland carbon tax (Other fossil fuels)
52 Norway carbon tax (Upper)
33 France carbon tax
25 Denmark carbon tax
84 Switzerland carbon tax, Liechtenstein carbon tax
Note: Prices on April 1, 2017. The Australia ERF (safeguard mechanism), British Columbia GGIRCA, Kazakhstan ETS and Washington CAR are not shown in this graph as price information is not available for those initiatives. Prices are not necessarily comparable between carbon pricing initiatives because of differences in the sectors covered and allocation methods applied, specific exemptions, and different compensation methods.
For the visuals and data of Carbon Pricing Watch 2017, please go to the Carbon Pricing Dashboard at http://carbonpricingdashboard.worldbank.org/.
8
INTERNATIONAL CARBON PRICING
Toward the implementation of the Paris Agreement
On October 5, 2016, the threshold for entry into force of the Paris Agreement was reachedm and the Agreement entered into force on November 4, 2016.6 As of April 1, 2017, 194 Parties have signed the Agreement and 143—representing 83 percent of global greenhouse gas (GHG) emissions—have deposited their instruments of ratification.
Over the next two years, in the lead up to the 24th Conference of the Parties (COP 24) to the United Nations Framework Convention on Climate Change (UNFCCC), the Paris Agreement rulebook will be prepared. This rulebook will contain the set of decisions required to operationalize the Paris Agreement. Decisions such as the features of Nationally Determined Contributions (NDCs), the transparency framework, and the global stocktake are being considered under the Ad Hoc Working Group on the Paris Agreement (APA). Rules for approaches to Article 6.2 and the Article 6.4 mechanism are being considered under the Subsidiary Body for Scientific and Technology Advice (SBSTA).
In 2018, a facilitative dialogue among the Parties will take place to take stock of the efforts that have been pledged and inform the next round of pledges to achieve the long-term temperature goal. Parties will prepare this dialogue in 2017 and will report on the planning at COP 23.7 In total, 112 developing countries have indicated that they need financial support to achieve their pledge.8 To facilitate the delivery of financial
and technical assistance to help countries meet their NDCs, various initiatives were launched including the NDC Partnership9 and bilateral programs such as the Facility to support NDC implementation by the French Development Agency, the International Climate Initiative NDC Support Cluster by the German government, and the NDC Leadership Compact by the United States government.10 Recognizing the importance of action by non-Party stakeholders as well as Parties, the Marrakech Partnership for Global Climate Action11 was launched at COP 22. Its aim is to facilitate enhanced ambition in non-Party commitments and implementation, and to foster deeper linkages and coherence with the implementation efforts of Parties.
International carbon market mechanisms
Article 6 of the Paris Agreement recognizes that Parties can voluntarily cooperate on the implementation of their NDCs to facilitate higher ambition in mitigation and adaptation actions. The operationalization of the mechanisms under Article 6 is one of the key challenges which need to be overcome to enable carbon pricing to deliver on its potential for cost-effective decarbonization. Modalities to ensure environmental integrity and avoid double-counting, enable greater ambition and promote sustainable development are at the core of the discussions under the UNFCCC.
At the COP 22 in Marrakech, Parties exchanged views on the operationalization of Article 6.2 cooperative approaches and the Article 6.4 mechanism. Due to a lack of consensus, Parties were invited to submit their views on these topics12 in advance of the May 2017 Bonn Climate Change Conference.n Various Parties responded to the call for inputs on Article 6.2o and
m The Paris Agreement entered into force thirty days after the date on which at least 55 Parties to the UNFCCC accounting in total for at least 55 percent of the global GHG emissions deposited their instruments of ratification, acceptance, approval or accession.
n The 46th sessions of the Subsidiary Body on Implementation (SBI 46) and SBSTA (SBSTA 46) as well as the third part of the first session of the APA (APA 1-3) took place in May 2017 in Bonn, Germany.
o Brazil; Canada; Ecuador on behalf of the Like Minded Group of Developing Countries (LMDC); Ethiopia on behalf of the Least Developed Countries Group; Democratic Republic of the Congo on behalf of the Coalition of Rainforest Nations; Guatemala on behalf of Independent Association of Latin America and the Caribbean (AILAC); Japan; Mali on behalf of the African Group of Negotiators; Maldives on behalf of Alliance of Small Island States; Malta and the European Commission on behalf of the European Union and its Member States; New Zealand; Panama; Republic of Korea; Rwanda on behalf of the Member States of the Central African Forestry Commission (COMIFAC); Saudi Arabia on behalf of the Arab Group; South Africa; Switzerland on behalf of Liechtenstein, Mexico, Monaco and Switzerland; and Venezuela.
9
Article 6.4.p Views on the path to operationalization diverge on topics including governance, modalities to ensure environmental integrity and sustainable development, accounting in the context of NDC implementation, and the relationship between the new approaches and mechanism and existing mechanisms such as the Clean Development Mechanism (CDM).13 For example, on the last point, some Parties advocate for the Article 6.4 mechanism to be similar to the CDM and for the integration of the CDM and the new mechanism. Other Parties highlight the need for significant departures from the Kyoto Protocol approach, as NDCs will have an impact on, inter alia, baseline approaches, crediting periods, accounting rules, and the role of the host country in the new mechanism. Regarding Article 6.2, it is recognized that a robust accounting framework for internationally transferred mitigation outcomes (ITMOs) needs to be developed to avoid double-counting. Decisions need to be made on operational details such as how Parties should make adjustments for emissions and/or removals covered by their NDCs if ITMOs are used.14
To improve the use of the CDM, the CDM Executive Board (CDM EB) adopted a package of revised standards and project cycle procedures in February 2017.15 However, a decision on the overall review of the modalities and procedures of the CDM was not taken in COP 22; this has been deferred to the May 2017 Bonn Climate Change Conference. This suggests a possible shift in focus from the CDM to Article 6 negotiations. Also, due to the persistent low demand for Kyoto credits, the CDM EB continues to search for sources of voluntary demand. The CDM EB requested the UNFCCC Secretariat to reach out to companies and organizations that are likely to use Certified Emission Reductions (CERs) voluntarily, such as sport event organizers, Fortune Global 500 companies, and the tourism sector.16 Of the 19 million CERs that have been voluntarily canceled, as of February 28, 2017, 13 million were CERs originating from the Republic of
Korea, which are likely to be reissued as credits in the Korea emissions trading system.17 The CDM’s online voluntary cancelation platform has facilitated the deletion of fewer than 70,000 CERs since its launch in September 2015. The upcoming Carbon Offsetting and Reduction Scheme for International Aviation (CORSIA) could represent a significant new source of demand for CERs.
International aviation
At the 39th Assembly of the International Civil Aviation Organization (ICAO) which concluded on October 7, 2016, Member States adopted the CORSIA. The CORSIA is a global carbon offsetting initiative that aims to stabilize net emissions from international aviation at 2020 levels; any additional emissions above 2020 levels will have to be offset.18, q The CORSIA will be implemented over three phases: a pilot phase (2021-2023), phase 1 (2024-2026) and phase 2 (2027-2035). While participation in the pilot phase and phase 1 is voluntary, initial coverage is likely to be substantial—as of October 12, 2016, 66 Member States representing about 87 percent of international aviation activities have announced their intention to participate in the voluntary phases.19 Phase 2 of the CORSIA will apply to all countries that exceed a certain threshold based on their share of international aviation activities.
According to researchers and analysts, the CORSIA has the potential to generate demand for carbon assets of around 2.5 gigatons of carbon dioxide equivalent (GtCO2e) between 2021 and 2035, which is comparable to the cumulative volume of Kyoto credits issued so far.20 Demand will be shaped by rules on the type of credits that will be eligible for airlines to purchase to comply with the CORSIA. ICAO’s Committee on Aviation Environmental Protection will recommend a set of rules for eligible credits; adoption of these rules by the ICAO Council is expected by 2018.21
p Brazil; Canada; Democratic Republic of the Congo on behalf of the Coalition of Rainforest Nations; Ecuador on behalf of LMDC; Ethiopia on behalf of the Least Developed Countries Group; Guatemala on behalf of AILAC; Japan; Kuwait; Mali on behalf of the African Group of Negotiators; Malta and the European Commission on behalf of the European Union and its Member States; Panama; Republic of Korea; Rwanda on behalf of COMIFAC; Saudi Arabia on behalf of the Arab Group; South Africa; Switzerland on behalf of Liechtenstein, Mexico, Monaco and Switzerland; and Venezuela.
q Taking into account special circumstances and respective capabilities of Member States.
10
Results-based climate finance
Various results-based climate finance initiatives build on existing carbon market mechanisms and prepare for new instruments. On January 10, 2017, the Pilot Auction Facility for Methane and Climate Change Mitigation (PAF) held its third auction, which targeted nitrous oxide abatement projects at nitric acid facilities (excluding adipic acid production). This auction marked the close of the first phase of the PAF.22, r Options to replicate and scale-up climate auctions beyond the PAF’s first phase by targeting other sectors, such as green buildings, are being explored.23
Announced at COP 21, the Transformative Carbon Asset Facility (TCAF) became operational in March 2017, with a target capitalization of US$500 million. TCAF will use results-based climate finance to pilot programs that will assist countries in the implementation of market-based carbon pricing initiatives and sectoral mitigation measures. TCAF’s efforts are intended to inform the international process established by the Paris Agreement to develop standards and agreements for future carbon crediting instruments and the transfer of mitigation assets.s
REGIONAL, NATIONAL AND SUBNATIONAL CARBON PRICING
As of 2017, 46 carbon pricing initiatives have been implemented or are scheduled for implementation. This consists of 23 emissions trading systems (ETSs), mostly in subnational jurisdictions, and 23 carbon taxes primarily implemented on a national level. Together, these carbon pricing initiatives cover 8 gigatons of carbon dioxide equivalent (GtCO2e) or 15 percent of global greenhouse gas (GHG) emissions. ETSs account for roughly two-thirds of the covered GHG emissions.
The country with the largest volume of emissions covered by carbon pricing initiatives is China, with 1.2 GtCO2e of GHG emissions included in the scope of its eight ETS pilots. The United States (US) and Canada are respectively second and third; in each of these countries, carbon pricing initiatives cover about 0.5 GtCO2e. The European Union ETS (EU ETS) is currently the largest carbon pricing initiative with 2 GtCO2e of GHG emissions within its scope. However, this will be surpassed by China with the launch of its national ETS later this year.
Jurisdictions implementing regional, national and subnational carbon pricing initiatives have been exploring modalities for cooperation and knowledge sharing, which could lead to further regional carbon pricing convergence, alignment and linking. For example, California, Mexico, Ontario and Québec have signed Memorandums of Understanding (MoUs) to explore options to cooperate on carbon markets. In addition, dialogues to explore regional carbon pricing have been taking place in the context of the Pacific Alliance.t Furthermore, China, Japan and Korea inaugurated an
r This phase allocated a total of US$54 million through the auction of put option contracts, which provide a price guarantee for future emission reductions. On November 30, 2016, five investors chose to exercise their rights to redeem their put options issued after the first auction and received a total payment of US$3.1 million in exchange for the equivalent of 1.3 megatons of carbon dioxide equivalent (MtCO2e) of emission reductions. The emission reductions came from four projects: the Jeram landfill gas recovery project in Malaysia, the Kamphaeng Saen West and East: landfill gas to electricity projects in Thailand, and the Central de Resíduos do Recreio landfill gas project in Brazil.
s Through these programs, TCAF will leverage public finance to create favorable conditions for private sector investment in low-carbon technologies, provide blueprints for efficient and low-cost mitigation—globally and at scale, and achieve lasting transformational impact. t The Pacific Alliance consists of Chile, Colombia, Mexico and Peru.
11
annual conference to exchange experiences on carbon pricing and explore areas for cooperation,24 and New Zealand started discussing potential collaboration on carbon markets with China and Korea. Such cooperative developments will support the cost-effective achievement of a 2°C or lower climate target, as demonstrated by modelingu that shows that an international carbon market could deliver a 30 percent reduction in global mitigation costs by 2030 and more than 50 percent reduction by the middle of the century.
Details on the main developments in regional, national and subnational carbon pricing initiatives since 2016 are presented below.v
Australia
The safeguard mechanism of the Emissions Reduction Fund (ERF) came into effect on July 1, 2016, establishing a baseline-and-offset initiative covering around half of Australia’s GHG emissions.25 The safeguard mechanism is intended to ensure that the emission reductions purchased through the ERF are not offset elsewhere in the economy.w The development of further carbon pricing initiatives has been debated in Australia. In its review of Australia’s climate goals and policies, the Australian Climate Change Authority, an independent body established to provide expert advice to the government, recommended the introduction of an emissions intensity based carbon pricing initiative in the electricity sector in 2018 and the enhancement of the safeguard mechanism in other sectors in the near term.26 However, this was opposed by the Australian government.27
The Australian government is currently reviewing its climate change policies to ensure that they can achieve their Nationally Determined Contribution (NDC) under the Paris Agreement. This includes looking into the potential use of international credits to meet its emission reduction targets.28
Canada
On October 3, 2016, the Canadian government put forward a national framework to put a price on GHG emissions. The framework requires all jurisdictions to implement a carbon pricing initiative by 2018, covering at least GHG emissions from all fossil fuel combustion. Jurisdictions can implement either a carbon pricing initiative with a fixed price or a cap-and-trade system. Jurisdictions electing to adopt a carbon pricing initiative with a fixed price such as a carbon tax must implement a minimum price of CAN$10/tCO2e (US$8/tCO2e) in 2018. The framework requires this carbon price to increase in annual increments of CAN$10/tCO2e (US$8/tCO2e) to reach CAN$50/tCO2e (US$38/tCO2e) in 2022. Jurisdictions that choose to implement a cap-and-trade system need to align the cap with Canada’s NDC to reduce GHG emissions by 30 percent below 2005 levels by 2030. The cap should decline annually to at least 2022 at a rate that is equivalent to the projected emissions reductions that would have occurred under the minimum carbon price for fixed price initiatives described above. Revenues raised remain in the jurisdiction of origin and their use is determined by each jurisdiction. Under the framework, jurisdictions are required to report the impacts of the implemented carbon pricing initiative. A review will be conducted in 2022 to consider the path forward and evaluate whether the stringency of the national framework needs to be increased. All jurisdictions except Manitoba and Saskatchewan have signed the framework.29
Several jurisdictions already have carbon pricing initiatives in place. Recent additions include the implementation of the Greenhouse Gas Industrial Reporting and Control Act (GGIRCA) in British Columbia in 2016, and a carbon tax in Alberta and an ETS in Ontario in 2017.x Signatories of the framework that have not yet implemented a carbon pricing initiative are taking steps to meet the requirements of the framework.
u For further details on the modeling analysis, please refer to World Bank, Ecofys and Vivid Economics, State and Trends of Carbon Pricing 2016, October 2016.
v Countries and regions are listed in alphabetical order. w Each facility covered under the safeguard mechanism needs to
surrender one offset unit for every ton of CO2 emitted above their baseline as part of their annual compliance. Facilities do not receive credits for emission reductions below their baseline. For further details on the safeguard mechanism of the ERF, please refer to World Bank, Ecofys and Vivid Economics, State and Trends of Carbon Pricing 2016, October 2016.
x For further details on the British Columbia GGIRCA, the Alberta carbon tax and the Ontario ETS, please refer to World Bank, Ecofys and Vivid Economics, State and Trends of Carbon Pricing 2016, October 2016.
12
Nova Scotia announced in November 2016 that it intends to implement a cap-and-trade system.30 The jurisdiction has proposed design options for its initiative and is currently consulting stakeholders.31 In Newfoundland and Labrador, lawmakers introduced a bill in June 2016 that would launch a carbon pricing initiative covering industry after a GHG emission monitoring period of at least two years.32 Also, New Brunswick is evaluating different forms of carbon pricing and the government has indicated that revenues raised will be earmarked for a dedicated climate change fund,33 while Prince Edward Island is considering a fiscally neutral carbon pricing initiative.34 The Canadian territories—the Northwest Territories, Nunavut and Yukon—are evaluating carbon pricing initiatives in conjunction with the federal government.35 Although Manitoba is not a signatory to the framework, it is nonetheless considering carbon pricing options.36
China
China is preparing for the launch of its national ETS, which is likely to be in the second half of 2017.37 The National Development and Reform Commission (NDRC) has submitted a draft ETS regulation to the State Council and Legislative Affairs Office. It is anticipated that the regulation will be approved in the course of 2017. In addition, the NDRC is developing several technical rules on issues including GHG emission reporting and verification, accreditation of third party verifiers, trading rules, and rules for offsetting. Reporting and verification of historical data is expected to be completed by the first half of 2017. It is anticipated that the coverage of GHG emissions under the national ETS will be clarified after this milestone. Allocation approaches are still being finalized; benchmarking will be the main approach, with grandparentingy used temporarily for certain sectors.38 The starting price of the national ETS is expected to be in the range of the pilot ETS prices of CNY10-60/tCO2e (US$1-9/tCO2e).z To prepare for the national ETS, the administrators of the pilot ETSs have
established capacity building centers to promote knowledge sharing and peer-to-peer learning with stakeholders in jurisdictions without a pilot ETS. In addition to the pilot ETS jurisdictions, a capacity building center was also established in Chengdu.39
China is also looking for opportunities to cooperate with other countries on carbon pricing. In September 2016, government officials from China, Japan and the Republic of Korea held the first annual conference on the exchange of carbon pricing experiences.40 The conference aims to enable sharing of technical expertise and exploring opportunities for further cooperation and potential linking between the ETSs in these countries.
In parallel to the development of the national ETS, the seven subnational pilot ETSs that were launched in 2013–2014 have continued to evolve and expand. The Guangdong ETS added aviation and paper making sectors in 2016, increasing the number of entities covered from 189 to 280.41 In addition, the Shenzhen ETS covered 246 new entities after they met the inclusion threshold in 2016, increasing the total number of entities covered to 824.42 The inclusion threshold in the Hubei ETS for the power sector and several large industrial sectors was lowered in 2016 from an annual energy consumption level of 60,000 tons of standard coal equivalent (tce) to 10,000 tce.43 Also, the baseline period on which inclusion in the ETS is determined shifted to 2013-2015, compared to 2009-2014 under the previous rule. While these changes resulted in the inclusion of 69 additional entities, Hubei continued to decrease its cap from 281 megatons of carbon dioxide equivalent (MtCO2e) in 2015 to 253 MtCO2e in 2016.
Furthermore, Fujian launched China’s eighth ETS pilot on December 15, 2016, which will retrospectively apply to 2016 emissions.44 The Fujian ETS covers about 60 percent of its GHG emissions, applying to 277 entities in the power, industry and aviation sectors with an energy consumption of over 10,000 tce in any
y Also known as grandfathering.z Based on expectations of various experts including government
officials.
13
year from 2013 to 2015. The coverage of the Fujian ETS was designed to broadly align with the national ETS. The majority of allowances are distributed through free allocation. However, to mark the start of the ETS and facilitate price discovery, two auctions were held on December 15 and 22, 2016, with 50 kilotons of carbon dioxide equivalent (ktCO2e) of allowances sold at each auction.45 As a market stability mechanism, authorities can sell additional allowances or repurchase allowances from the market.46 Entities are permitted to use offsets generated in Fujian to meet up to 10 percent of their compliance obligation; these offsets are subject to qualitative restrictions on the project type.47
The rules for offset usage in pilot ETSs became more stringent in the past year. In the Guangdong ETS, all Chinese Certified Emission Reduction (CCER) credits used for compliance in 2017 must originate from within the province, up from 70 percent in 2016.48 Also, Hubei limited offset usage for compliance in 2016 to CCER credits generated from rural biogas and forestry projects in poor areas in the province,49 while Shanghai lowered the quantitative limit for offset usage for compliance in 2017 from 5 percent of annual emissions to 1 percent.50 Since the end of 2016, the NDRC has slowed down the issuance of CCER credits and on March 14, 2017, the NDRC announced that it has temporarily suspended the approval of CCER projects and issuance of CCERs.51 This allows the NDRC to improve and harmonize the rules on the issuance of CCERs to accelerate green and low-carbon development.
Taiwan, China has continued working toward the implementation of an ETS. In February 2017, plans were published to meet a target of halving its GHG emissions by 2050 compared to the 2005 baseline level through the implementation of an ETS, among other policy measures.52
Colombia
In Colombia, a carbon tax of COP15,000/tCO2 (US$5/tCO2) on liquid and gaseous fossil fuels used for combustion came into effect on January 1, 2017.53 International aviation and shipping, and users that are certified to be carbon neutral are exempted from the tax. While the meaning of carbon neutral is yet to be formally defined, supporting regulation indicates that this will permit the use of offsets.54 The revenue that will be raised through the tax is earmarked for the Fund for a Sustainable Colombia, which will support activities such as coastal and water management, and ecosystem protection.
European Union
In February 2017, the European Parliament55 and European Council56 separately voted on amendments to the European Commission’s proposal for revisions to the EU ETS post-2020. Amendments agreed to by both the Parliament and the Council include an increase in the annual cap reduction from 1.74 percent to 2.2 percent and doubling the yearly intake of surplus allowances into the market stability reserve to 24 percent in the first few years of its operation. A key point of difference between the amendments approved by the Parliament and the Council is the compensation that is provided to best-performers and the size of the Innovation Fund to finance low-carbon innovation in industry. Also, the Parliament introduced amendments to include the maritime sector in the EU ETS from 2023 if a global market-based measure has not been implemented by the International Maritime Organization, and to tighten the aviation sector cap. “Trilogue” meetings are currently taking place between the European Parliament, European Council and European Commission to achieve consensus on the EU ETS revisions. The outcomes of the votes have not influenced the price trajectory of European Union Allowances (EUAs) so far. As of April 1, 2017, the EUA price was €5/tCO2e (US$5/tCO2e).
14
The European Commission has proposed to extend the “Stop the clock” provision for intercontinental flights for at least four more years until 2021, when the Carbon Offsetting and Reduction Scheme for International Aviation (CORSIA) will come into force.57 This provision was implemented in 2013 to exclude flights outside the European Economic Area from participation in the EU ETS to allow the International Civil Aviation Organization (ICAO) to develop a global market-based measure for international aviation. The European Commission aims to have the proposal adopted by the end of 2017.58
Mexico
Mexico launched an ETS simulation in November 2016 to prepare companies for its ETS, which is planned to start in 2018.59 About 60 companies from the transport, power and industry sectors are participating in the ETS simulation on a voluntary basis. The simulation does not involve any real transactions. The simulation is scheduled to end in December 2017, before the launch of the ETS.60
In 2014, Mexico and California signed a Memorandum of Understanding (MoU) on international collaboration on climate change mitigation.61 In addition to technical cooperation and assistance with designing and operating a carbon pricing mechanism in Mexico, the MoU also refers to the potential for Mexico to link its carbon market with the California Cap-and-Trade Program.aa In January 2017, an additional MoU was signed with a non-governmental organization to support the Mexico Secretariat of the Environment and Natural Resources and the California Air Resources Board in implementing the action plan established by the first MoU.
New Zealand
A review of the New Zealand ETS (NZ ETS) is taking place over a two-stage process. The first stage concluded in May 2016 with a decision to phase out the one-for-two transitional measure, which currently allows non-forestry ETS facilities to surrender one emission allowance for every two tons of CO2e.62 The second stage of the review is ongoing63 and is focusing on forestry issues and the supply of emission units in 2020, including the alignment of allowance supply with New Zealand’s NDC target and the reduction of free allocation. Further considerations include the introduction of auctioning, price stability mechanisms and the re-introduction of international carbon credits in the NZ ETS. The Ministry for the Environment plans to provide recommendations from the second review stage in mid-2017.64
Furthermore, New Zealand and China signed a bilateral climate change action plan to cooperate on carbon markets.65 The plan includes identifying opportunities for collaboration with other countries in the Asia-Pacific region to discuss potential linking. Also, New Zealand started discussions with Korea on developing carbon markets in the Asia-Pacific region.66
Singapore
The Singaporean government intends to introduce a carbon price in 2019.67 A carbon price of between S$10-20/tCO2e (US$7-14/tCO2e) will apply to direct emitters and the revenue raised will be earmarked to fund industrial emission reduction measures.
Republic of Korea
To address the limited liquidity of the Korea ETS market in its first phase (2015-2017), the Korean government made reforms in 2016 that doubled the share of allowances which companies can borrow for compliance and released additional allowances from the reserve onto the market.68 In addition, new guidelines were
aa In October 2015, Mexico and Quebec signed a specific MoU to strengthen collaboration in carbon markets development and linkage. In August 2016, California, Mexico and Ontario signed a declaration committing to work together on carbon markets.
15
introduced that simplify the qualification procedure for earning credits from emission reductions that were achieved before the ETS was launched, and an additional 17 MtCO2e of allowances were added to the 2017 cap.69 In April 2017, the Korean government announced further measures to deal with the market imbalance for the second phase of the ETS (2018-2021).70 Under the new measures, fewer free allowances will be distributed in 2018 to companies that hold a large surplus and the amount of emission allowances that companies can borrow will be gradually reduced again. The use of international credits for compliance will also be permitted in the second phase. The second phase will see the start of allowance auctions, with the auction share in 2018 set to be three percent, increasing to at least ten percent in 2021.71
South Africa The implementation of the South Africa carbon tax has experienced a further delay and did not launch at the planned start date of January 1, 2017. A new implementation date is expected to be announced during 2017.72 In addition, it is anticipated that the South African government will debate a revised Carbon Tax Bill in parliament and publish a revised carbon offset allowance regulation by mid-2017.73
United Kingdom
Following the United Kingdom (UK) referendum outcome in June 2016 to leave the EU, the government indicated that it remains committed to using carbon pricing as an instrument to help decarbonize the power sector. Currently, the UK participates in the EU ETS and additionally, the Carbon Price Floor applies to the power sector. From 2021, the government will target a “total carbon price rate” that will apply to businesses; the format of this rate is yet to be defined.74 Further details on carbon pricing in the UK post-Brexit are expected by fall 2017.
United States
The federal government is reviewing several energy and climate-related policies of the previous government on a national level, including the Climate Action Plan and the EPA’s Clean Power Plan (CPP), which aims to reduce CO2 emissions in the power sector. However, at the state level, Governors of Washington, Oregon and California, together with mayors of five large cities, released a Joint Statement stating that their jurisdictions would continue to accelerate the transition to low-carbon power generation.75
Developments on a subnational level include Washington State launching its ETS, in the form of a baseline-and-credit-system, on January 1, 2017. The ETS covers two-thirds of Washington’s emissions. It initially covers installations with baseline GHG emissions greater than 100 ktCO2e that are not considered to be energy intensive nor trade exposed. Installations can comply with their target by developing GHG emission mitigation projects or by trading emission reductions with other installations.
California published on January 20, 2017 its proposed plan for meeting its 2030 GHG emission reduction target, including an extension of the state’s ETS from 2020 to 2030.76 The plan also proposes to continue the link with the Québec ETS and to link to the Ontario ETS. The California Air Resources Board is currently evaluating ETS design options that would lead to greater GHG emissions reductions post-2020.77
The Regional Greenhouse Gas Initiative (RGGI) is also currently being reviewed to inform design decisions for the period after 2020.78 The review is considering several changes to the cap trajectory to 2030, the auction reserve price, the Cost Containment Reserve and offset rules.79 Furthermore, RGGI is looking into setting up an Emissions Containment Reserve as a new measure to curb the supply of allowances.80
16
This move is in response to allowance prices dropping to US$3/tCO2 on April 1, 2017—a three year low—due to an oversupply of allowances and the US Supreme Court suspending the implementation of the CPP.81
Oregon continues to study carbon pricing options, including a cap-and-trade program that could be linked to the California and Québec ETSs.82 In addition, lawmakers launched several new bills and draft proposalsbb in 2017 that seek the introduction of a carbon pricing initiative.83
INTERNAL CARBON PRICING
Over 1,200 companies—including more than 100 Fortune Global 500 companies with a total annual revenue of about US$7 trillion—disclosed to CDP in 2016 that they are currently using an internal price on carbon or plan to do so within the next two years.84 All regions have witnessed growth in companies disclosing implemented or planned internal carbon pricing. Despite this growth, over 500 companies in emissions-intensive industries have reported that they do not plan to adopt internal carbon pricing. Of these companies, about 80 percent are headquartered in countries that are putting a mandatory price on carbon or are considering doing so. The absence of an internal carbon price in such companies could indicate that climate-related risks are insufficiently understood or are not yet deemed to be material.
An increase in the adoption of internal carbon pricing is anticipated following the recommendations of the Financial Stability Board Task Force on Climate-related Financial Disclosures (TCFD) published on December 14, 2016. The TCFD considers climate-related risks to be material and advises businesses to disclose their climate-related financial risks and opportunities under existing financial disclosure obligations.85 As part of this disclosure, the TCFD recommends companies to report the internal carbon prices that are used to manage these risks and opportunities. In particular, companies with a high climate-related risk exposure are advised to communicate the internal carbon price scenarios used and explain their assumptions.
Investors and businesses will be supported in their response to the TCFD recommendations through the Carbon Pricing Corridors initiative.cc The initiative aims to identify the carbon prices needed in 2020, 2025, and 2030 to decarbonize the power sector and achieve the objectives of the Paris Agreement from a private sector perspective.86 The initiative will expand its scope over the course of 2017 to cover other high emitting sectors.
bb In 2017, bills to introduce carbon pricing were drafted (LC 1242) or proposed to both the House (HB 2135 and HB 2468) and the Senate (SB 557 and SB 748) of Oregon.
cc The Carbon Pricing Corridors initiative is facilitated by CDP on behalf of We Mean Business and consist of a panel of utilities and investment leaders from across the G20.
17
1 Source: Heads of State, Government, and Delegations, Marrakech Action Proclamation for Our Climate and Sustainable Development, November 2016.
2 Source: National Oceanic and Atmospheric Administration, Global Analysis - Annual 2016, accessed March 14, 2017, https://www.ncdc.noaa.gov/sotc/global/201613.
3 Source: UK government, Energy Trends: solid fuels and derived gases – Coal consumption and coal stocks, accessed March 15, 2017.
4 Source: Carbon Pricing Leadership Coalition, High-Level Commission on Carbon Prices, accessed March 14, 2017, https://www.carbon-pricingleadership.org/highlevel-economic-commission-1/.
5 Source: CDP, Embedding a carbon price into business strategy, September 2016.
6 Source: UNFCCC, Paris Agreement - Status of Ratification, November 4, 2016, http://unfccc.int/paris_agreement/items/9444.php.
7 Source: UNFCCC, Decisions adopted by the Conference of the Parties, Preparations for the entry into force of the Paris Agreement and the first session of the Conference of the Parties serving as the meeting of the Parties to the Paris Agreement, Decision 1/CP.22, January 31, 2017.
8 Source: The World Bank, Intended Nationally Determined Contributions (INDCs), accessed March 15, 2017, http://spappssecext.worldbank.org/sites/indc/Pages/FAQ.aspx.
9 Source: UNFCCC, Countries Partner on National Climate Action Plans: New NDC Partnership Launched, November 15, 2016, http://newsroom.unfccc.int/unfccc-newsroom/countries-partner-on-na-tional-climate-action-plans/.
10 Source: NDC Partnership, NDC Funding and Initiatives Navigator, n.d., http://www.ndcpartnership.org/initiatives-navigator; Partnership on Transparency, NDC Cluster, n.d., https://www.transparency-part-nership.net/ndc-cluster.
11 Source: UNFCCC, Marrakech Partnership for Global Climate Action, November 16, 2016.
12 Source: UNFCCC, Ad Hoc Working Group on the Paris Agreement, Items 3 to 8 of the Agenda, November 14, 2016; Subsidiary Body for Scientific and Technological Advice, Rules, Modalities and Procedures for the Mechanism Established by Article 6, Paragraph 4, of the Paris Agreement, November 12, 2016; Subsidiary Body for Scientific and Technological Advice, Guidance on Cooperative Approaches Referred to in Article 6, Paragraph 2, of the Paris Agreement, November 12, 2016.
13 Source: UNFCCC, Submissions and Statements at SBSTA 47, 2017, http://www4.unfccc.int/submissions/SitePages/sessions.aspx?-showOnlyCurrentCalls=1&populateData=1&expectedsubmission-from=Parties&focalBodies=SBSTA.
14 Source: UNFCCC, Submissions and Statements at SBSTA 46, 2017, http://www4.unfccc.int/Submissions/SitePages/sessions.aspx.
15 Source: UNFCCC, UN’s Clean Development Mechanism Improved: Can Be Used to Make Tourism Sector More Sustainable, February 23, 2017, http://newsroom.unfccc.int/climate-action/cdm-board-adopts-full-package-of-simplified-procedures-to-in-crease-efficiency/.
16 Source: Ibid.17 Source: UNFCCC, CDM Registry: CERs Cancelled to Date in the CDM
Registry, accessed March 16, 2017, https://cdm.unfccc.int/Registry/vc_attest/index.html.
18 Source: International Civil Aviation Organization, Carbon Offsetting and Reduction Scheme for International Aviation (CORSIA), accessed March 14, 2017, http://www.icao.int/environmental-protection/Pages/market-based-measures.aspx.
19 Source: Ibid.20 Source: EDF, EDF Talks Global Climate, October 6, 2016, http://blogs.
edf.org/climatetalks/category/aviation/.21 Source: European Commission, Latest Developments at ICAO - GMBM,
November 8, 2016, https://ec.europa.eu/clima/sites/clima/files/events/docs/0114/rasa_update_on_icao_achievements_en.pdf.
22 Source: The World Bank, 13 Private Companies Compete in $13 Million World Bank Climate Auction, January 11, 2017, http://www.worldbank.org/en/news/feature/2017/01/11/13-private-companies-compete-in-13-million-world-bank-climate-auction.
23 Source: Climate Focus and Ecofys, Pilot Auction Facility: Opportunities Beyond the Piloting Phase, November 2016.
REFERENCES
24 Source: Tsinghua University, 1st Forum of Carbon Pricing Mechanism in China, Japan and Korea, August 9, 2016, http://mp.weixin.qq.com/s?__biz=MzIwODU1NDUyNQ==&mid=2247483676&idx-=1&sn=32a45adc83f30b8b930ce59709cff062&scene=5&sr-cid=0908bAGQ19b2bMjArIU8tbRb.
25 Source: Australian Government - Department of the Environment and Energy, “The Safeguard Mechanism - Overview,” 2016, http://www.environment.gov.au/climate-change/emissions-reduc-tion-fund/publications/factsheet-erf-safeguard-mechanism.
26 Source: Australian Government - Climate Change Authority, Towards a Climate Policy Toolkit: Special Review on Australia’s Climate Goals and Policies, August 2016.
27 Source: Josh Frydenberg, Questions Without Notice (16 February 2017), February 16, 2017, http://www.joshfrydenberg.com.au/guest/SpeechesDetails.aspx?id=409.
28 Source: Australian Government, Review of Climate Change Policies, March 2017.
29 Source: Government of Canada, Annex II: Provincial and Territorial Key Actions and Collaboration Opportunities with the Government of Canada, accessed March 16, 2017, https://www.canada.ca/en/services/environment/weather/climatechange/pan-canadi-an-framework/annex-key-actions-collaboration.html.
30 Source: Government of Canada, The Government of Canada Announces Plan with Nova Scotia to Price Carbon Pollution and Negotiate Coal Phase-out Agreement, November 21, 2016, http://news.gc.ca/web/article-en.do?nid=1158199.
31 Source: Ibid.32 Source: Government of Canada, Annex II: Provincial and Territorial
Key Actions and Collaboration Opportunities with the Government of Canada, accessed March 16, 2017, https://www.canada.ca/en/services/environment/weather/climatechange/pan-canadi-an-framework/annex-key-actions-collaboration.html.
33 Source: Government of New Brunswick, Transitioning to a Low-Carbon Economy, n.d.
34 Source: Government of Prince Edward Island, Pre-Budget Consultations, accessed March 10, 2017, https://www.princeed-wardisland.ca/en/service/pre-budget-consultations.
35 Source: Government of Canada, Annex II: Provincial and Territorial Key Actions and Collaboration Opportunities with the Government of Canada, accessed March 16, 2017, https://www.canada.ca/en/services/environment/weather/climatechange/pan-canadi-an-framework/annex-key-actions-collaboration.html.
36 Source: Government of Manitoba, Speech from the Throne, November 21, 2016, http://www.gov.mb.ca/thronespeech/thronespeech_2016.html.
37 Source: Zhang Yong, deputy director of the NDRC, Information, n.d., http://carbonmkt.cn/plus/view.php?aid=12663.
38 Source: China Business Network, Development and Reform Commission: The National Carbon Market Quota Distribution to the Baseline Method Based, December 2, 2016, http://www.cs.com.cn/xwzx/hg/201612/t20161202_5109579.html.
39 Source: Sichuan News Network (Chengdu), Carbon Market Gong Open City of Sichuan Officially Entered the Ranks of the National Carbon Emissions Trading, December 16, 2016, http://news.163.com/16/1216/11/C8DEOFUB000187VE.html.
40 Source: Tsinghua University, 1st Forum of Carbon Pricing Mechanism in China, Japan and Korea, August 9, 2016, http://mp.weixin.qq.com/s?__biz=MzIwODU1NDUyNQ==&mid=2247483676&idx-=1&sn=32a45adc83f30b8b930ce59709cff062&scene=5&sr-cid=0908bAGQ19b2bMjArIU8tbRb.
41 Source: Guangdong provincial Development and Reform Commission, Guangdong Provincial Development and Reform Commission on the Issuance of Guangdong Province Civil Aviation, Paper Industry 2016 Annual Carbon Emission Quota Allocation Program and White Cement Enterprises in 2016 Quota Allocation Method Notice, January 6, 2017, http://www.gddrc.gov.cn/zwgk/tzgg/zxtz/201701/t20170106_382101.html.
18
42 Source: Hubei provincial Development and Reform Commission, Notice of the Provincial Development and Reform Commission on the Issuance Plan for the Distribution of Carbon Emissions in Hubei Province in 2016, January 3, 2017, http://www.hbfgw.gov.cn/xw/tzgg_3465/gg/tpwj/201701/t20170103_109021.shtml.
43 Source: Ibid. 44 Source: Fujian Development and Reform Commission, Notice of the
Fujian Provincial Development and Reform Commission on Printing and Distributing the Implementation Plan for the Distribution of Carbon Emission Quotas in Fujian Province in 2016, December 7, 2016, http://www.fjdpc.gov.cn/show.aspx?ctlgid=738877&id=112936.
45 Source: Ibid.46 Source: Fujian Development and Reform Commission, Fujian
Provincial Development and Reform Commission Fujian Provincial Department of Finance on the Issuance of “Fujian Carbon Emissions Trading Market Regulation Implementation Details (Trial)” notice, December 5, 2016, http://www.fjdpc.gov.cn/show.aspx?ctl-gid=738877&id=112813.
47 Source: Fujian Development and Reform Commission, Notice on Printing and Distributing the Measures for the Administration of Carbon Emission from Fujian Province (Trial Implementation), December 5, 2016, http://www.fjdpc.gov.cn/show.aspx?ctl-gid=738877&id=112809.
48 Source: Guangdong provincial Development and Reform Commission, Notice of the Guangdong Provincial Development and Reform Commission on Printing and Distributing the Guidance on the Use of National Certification Voluntary Emission Reductions (CCER) to Eliminate the Actual Carbon Work in 2016 in Guangdong Province, January 9, 2017, http://www.gddrc.gov.cn/zwgk/tzgg/zxtz/201701/t20170109_382327.html.
49 Source: Hubei provincial Development and Reform Commission, [Notice] Provincial Development and Reform Commission on the 2016 Hubei Province Carbon Emission Rights Cancellation Mechanism of the Relevant Matters Notice, July 8, 2016, http://www.hbfgw.gov.cn/xw/tzgg_3465/gg/tpwj/201607/t20160708_105942.shtml.
50 Source: Shanghai Municipal Development and Reform Commission, Notice of the Shanghai Municipal Development and Reform Commission on Printing and Distributing the “2016 Carbon Emission Quota Distribution Plan in Shanghai,” November 16, 2016, http://www.shdrc.gov.cn/fzgggz/nyglhjnjb/zcwj/24839.htm.
51 Source: National Development and Reform Commission, Announcement of the National Development and Reform Commission of China, 2017, http://www.ndrc.gov.cn/zcfb/zcfbgg/201703/t20170317_841211.html.
52 Source: Environmental Protection Administration of Taiwan, China, National Climate Change Action Guidelines, February 23, 2017.
53 Source: Dirección de Impuestos y Aduanas Nacionales, Concepto General Impuesto Nacional Al Carbono, February 10, 2017.
54 Source: Dirección de Impuestos y Aduanas Nacionales, Normatividad, accessed March 14, 2017, http://www.dian.gov.co/Dian/13nor-matividad.nsf/b567ccf43e6839ce0525729100707915/0c-3814c34fb3200d052580d9000247cc?OpenDocument.
55 Source: European Parliament, Procedure : 2015/0148(COD), February 15, 2017, http://www.europarl.europa.eu/sides/getDoc.do?type=TA&language=EN&reference=P8-TA-2017-0035.
56 Source: Council of the European Union, Interinstitutional File: 2015/0148 (COD), March 1, 2017.
57 Source: European Commission, The EU Tackles Growing Aviation Emissions, February 3, 2017, http://europa.eu/rapid/press-release_IP-17-189_en.htm.
58 Source: European Commission, Proposal for a REGULATION OF THE EUROPEAN PARLIAMENT AND OF THE COUNCIL amending Directive 2003/87/EC to continue current limitations of scope for aviation activities and to prepare to implement a global market-based measure from 2021, February 3, 2017.
59 Source: Secretaría de Medio Ambiente y Recursos Naturales, Mexico’s Policy Update on Carbon Pricing, 2016.
60 Source: Secretaria de Medio Ambiente y Recursos Naturales & México2 Plataforma Mexicana de Carbono, Ejercicio de Mercado: Sistema de Comercio de Emisiones, 2017.
61 Source: State of California, Ministry of Environment and Natural Resources of the United Mexican States, and National Forestry Commission of the United Mexican States, Memorandum of Understanding to Enhance Cooperation on Climate Change and the Environment between the State of California of the United States of America and the Ministry of Environment and Natural Resources and the National Forestry Commission of the United Mexican States, July 2014.
62 Source: Ministry for the Environment of New Zealand, Phase out of the One-for-two Transitional Measure from the New Zealand Emissions Trading Scheme, May 25, 2016, http://www.mfe.govt.nz/climate-change/reducing-greenhouse-gas-emissions/new-zea-land-emissions-trading-scheme/legislative.
63 Source: New Zealand Emissions Trading Scheme Review 2015/16: Stage Two Submissions, January 27, 2017, http://www.mfe.govt.nz/climate-change/reducing-greenhouse-gas-emissions/new-zea-land-emissions-trading-scheme/reviews-nz-e-2.
64 Source: Ibid.65 Source: New Zealand Foreign Affairs & Trade, Fact Sheet: New
Zealand-China Climate Change Action Plan, March 27, 2017.66 Source: New Zealand Government, Korea and New Zealand discuss
carbon markets, April 13, 2017, https://www.beehive.govt.nz/release/korea-and-new-zealand-discuss-carbon-markets.
67 Source: Singapore Budget, Budget 2017: Moving Forward Together, February 20, 2017.
68 Source: International Carbon Action Partnership, Emissions Trading Worldwide: International Carbon Action Partnership (ICAP) Status Report 2017, 2017.
69 Source: Republic of Korea, Press Releases, January 24, 2017, http://mosf.go.kr/nw/nes/detailNesDtaView.do;jsessionid=4vReRjY22Zrk-mwEEUy7jLgGQ.node20?searchBbsId=MOSFBBS_000000000028&-searchNttId=MOSF_000000000007379&menuNo=4010100.
70 Source: Republic of Korea, The 6th Ministerial Meeting on Economic Relations in 2017, April 5, 2017, http://www.mosf.go.kr/nw/nes/detailNesDtaView.do?searchBbsId1=MOSFBBS_000000000028&-searchNttId1=MOSF_000000000008670&menuNo=4010100.
71 Source: Ministry of Environment of the Republic of Korea, Greenhouse Gas Emissions Trading Scheme, March 16, 2017, http://eng.me.go.kr/eng/web/index.do?menuId=450.
72 Source: South African government, Minister Pravin Gordhan: 2017 Budget Speech, February 22, 2017, http://www.gov.za/speeches/minister-pravin-gordhan-2017-budget-speech-22-feb-2017-0000.
73 Source: Ibid.74 Source: Government of the UK, Spring Budget 2017, March 8,
2017, https://www.gov.uk/government/publications/spring-bud-get-2017-documents/spring-budget-2017.
75 Source: J Brown et al., Joint Statement Regarding the Clean Power Plan By the Governors of Washington, Oregon and California, and the Mayors of Seattle, Portland, San Francisco, Oakland and Los Angeles, March 22, 2017, http://www.governor.wa.gov/news-media/joint-statement-re-garding-clean-power-plan-governors-washington-oregon-and-cali-fornia-and.
76 Source: California Air Resources Board, The 2017 Climate Change Scoping Plan Update: The Proposed Strategy for Achieving California’s 2030 Greenhouse Gas Target, January 20, 2017.
77 Ibid.78 Source: The Regional Greenhouse Gas Initiative, RGGI Public
Stakeholder Meetings, accessed April 7, 2017, https://www.rggi.org/design/2016-program-review/rggi-meetings.
79 Source: The Regional Greenhouse Gas Initiative, RGGI 2016 Program Review - RGGI Program Design Elements: State Considerations, November 21, 2016.
80 Source: The Regional Greenhouse Gas Initiative, RGGI 2016 Program Review - An Emissions Containment Reserve, November 21, 2016.
81 Source: US Energy Information Administration, Regional Greenhouse Gas Initiative Auction Prices Decline, June 24, 2016, https://www.eia.gov/todayinenergy/detail.php?id=26812.
82 Source: Oregon Department of Environmental Quality, Considerations for Designing a Cap-and-Trade Program in Oregon, February 14, 2017.
83 Source: Oregon State Legislature, 2017 Regular Session, March 1, 2017, https://olis.leg.state.or.us/liz/2017R1/Committees/HEE/2017-03-01-15-00/Agenda.
84 Source: CDP, Embedding a carbon price into business strategy, September 2016.
85 Source: FSB Task Force on Climate-Related Financial Disclosures, Recommendations of the Task Force on Climate-Related Financial Disclosures, December 14, 2016.
86 Source: CDP, Press Release: Industry Leads New Initiative to Revolutionize Carbon Pricing for Investors, January 16, 2017, https://www.cdp.net/en/articles/media/industry-leads-new-initiative-to-rev-olutionize-carbon-pricing-for-investors.
19
© 2017 International Bank for Reconstruction and Development / The World Bank1818 H Street NW, Washington DC 20433Telephone: 202-473-1000; Internet: www.worldbank.orgSome rights reserved1 2 3 4 20 19 18 17
This work is a product of the staff of The World Bank with external contributions. The findings, interpretations, and conclusions expressed in this work do not necessarily reflect the views of The World Bank, its Board of Executive Directors, or the governments they represent. The World Bank does not guarantee the accuracy of the data included in this work. The boundaries, colors, denominations, and other information shown on any map in this work do not imply any judgment on the part of The World Bank concerning the legal status of any territory or the endorsement or acceptance of such boundaries.
Nothing herein shall constitute or be considered to be a limitation upon or waiver of the privileges and immunities of The World Bank, all of which are specifically reserved.
Rights and Permissions
This work is available under the Creative Commons Attribution 3.0 IGO license (CC BY 3.0 IGO) http://creativecommons.org/licenses/by/3.0/igo. Under the Creative Commons Attribution license, you are free to copy, distribute, transmit, and adapt this work, including for commercial purposes, under the following conditions:
Attribution—Please cite the work as follows: World Bank and Ecofys. 2017. “Carbon Pricing Watch 2017.” (May), Washington, DC: World Bank. Doi: 10.1596/978-1-4648-1129-6. License: Creative Commons Attribution CC BY 3.0 IGO
Translations—If you create a translation of this work, please add the following disclaimer along with the attribution: This translation was not created by The World Bank and should not be considered an official World Bank translation. The World Bank shall not be liable for any content or error in this translation.
Adaptations—If you create an adaptation of this work, please add the following disclaimer along with the attribution: This is an adaptation of an original work by The World Bank. Views and opinions expressed in the adaptation are the sole responsibility of the author or authors of the adaptation and are not endorsed by The World Bank.
Third-party content—The World Bank does not necessarily own each component of the content contained within the work. The World Bank therefore does not warrant that the use of any third-party-owned individual component or part contained in the work will not infringe on the rights of those third parties. The risk of claims resulting from such infringement rests solely with you. If you wish to re-use a component of the work, it is your responsibility to determine whether permission is needed for that re-use and to obtain permission from the copyright owner. Examples of components can include, but are not limited to, tables, figures, or images.
All queries on rights and licenses should be addressed to World Bank Publications, The World Bank Group, 1818 H Street NW, Washington, DC 20433, USA; e-mail: [email protected].
ISBN (electronic): 978-1-4648-1129-6DOI: 10.1596/978-1-4648-1129-6
Design: Meike Naumann Visuelle Kommunikation
IMPRINT
This report was prepared jointly by the World Bank and Ecofys.
A World Bank team consisting of Richard Zechter, Alexandre Kossoy, Céline Ramstein, Grzegorz Peszko, Klaus Oppermann, and Angela Churie Kallhauge conceptualized this report.
The Ecofys team consisted of Long Lam, Noémie Klein, Lindee Wong, Jialiang Zhang, Sam Nierop, Maurice Quant, Maarten Neelis, and Kathelijn van der Ven, supported by a SinoCarbon team composed of Qian Guoqiang, Liu Ying, Lai Han, and Huang Xiaochen.
Definition of carbon pricing: For the purpose of the State and Trends of Carbon Pricing report series, and also applicable to this brief, carbon pricing refers to initiatives that put an explicit price on greenhouse gas emissions, i.e. a price expressed as a value per ton of carbon dioxide equivalent (tCO2e). These initiatives include not only emissions trading systems (ETSs), carbon taxes, offset mechanisms, and results-based climate finance, but also internal carbon prices set by organizations. Policies that put an implicit price on carbon, for example removal of fossil fuel subsidies, fuel taxation, support for renewable energy, and energy efficiency certificate trading, are not included as they are outside the scope of this brief.