beneficial electrification - raponline.org · beneficial electrification ensuring electrification...
TRANSCRIPT
Beneficial ElectrificationEnsuring Electrification in the Public Interest
By David Farnsworth, Jessica Shipley, Jim Lazar, and Nancy Seidman
JUNE 2018
The Regulatory Assistance Project (RAP)®50 State Street, Suite 3
Montpelier, Vermont
USA
Tel: 802-223-8199
E-mail: [email protected]
raponline.org
linkedin.com/company/the-regulatory-assistance-project
twitter.com/regassistproj
© RAP. This work is licensed under a Creative Commons Attribution-NonCommercial License
(CC BY-NC 3.0).
How to Cite This PaperFarnsworth, D., Shipley, J., Lazar, J., and Seidman, N. (2018, June). Beneficial electrification: Ensuring
electrification in the public interest. Montpelier, VT: Regulatory Assistance Project.
BENEFICIAL ELECTRIFICATION: ENSURING ELECTRIFICATION IN THE PUBLIC INTEREST | 1 REGULATORY ASSISTANCE PROJECT
Table of ContentsAbout This Series. . . . . . . . . . . . . . . . . . . . . . . . . . . . . . . . . . . . . . . . . . . . . . . . . . . . . . . . . . . . . . . . 6
Foreword . . . . . . . . . . . . . . . . . . . . . . . . . . . . . . . . . . . . . . . . . . . . . . . . . . . . . . . . . . . . . . . . . . . . . . . 7
Executive Summary . . . . . . . . . . . . . . . . . . . . . . . . . . . . . . . . . . . . . . . . . . . . . . . . . . . . . . . . . . . . . 8
Principles for Maximizing the Benefits . . . . . . . . . . . . . . . . . . . . . . . . . . . . . . . . . . . . . . . . . . . . . . . . . . . . . . . . . 9
Putting Beneficial Electrification Into Action . . . . . . . . . . . . . . . . . . . . . . . . . . . . . . . . . . . . . . . . . . . . . . . . . . . 11
Lay the Foundation in Policy . . . . . . . . . . . . . . . . . . . . . . . . . . . . . . . . . . . . . . . . . . . . . . . . . . . . . . . . . . . . 11
Ensure an Open Process . . . . . . . . . . . . . . . . . . . . . . . . . . . . . . . . . . . . . . . . . . . . . . . . . . . . . . . . . . . . . . . . 12
Anticipate Specific Issues . . . . . . . . . . . . . . . . . . . . . . . . . . . . . . . . . . . . . . . . . . . . . . . . . . . . . . . . . . . . . . 12
Opportunities in a Changing Energy Sector . . . . . . . . . . . . . . . . . . . . . . . . . . . . . . . . . . . . . . . 16
Principles for Maximizing the Benefits . . . . . . . . . . . . . . . . . . . . . . . . . . . . . . . . . . . . . . . . . . .23
Principle 1: Put Efficiency First . . . . . . . . . . . . . . . . . . . . . . . . . . . . . . . . . . . . . . . . . . . . . . . . . . . . . . . . . . . . . . . 25
Principle 2: Recognize the Value of Flexible Load for Grid Operations . . . . . . . . . . . . . . . . . . . . . . . . . . . . . 29
Space Heating . . . . . . . . . . . . . . . . . . . . . . . . . . . . . . . . . . . . . . . . . . . . . . . . . . . . . . . . . . . . . . . . . . . . . . . . 29
Water Heating . . . . . . . . . . . . . . . . . . . . . . . . . . . . . . . . . . . . . . . . . . . . . . . . . . . . . . . . . . . . . . . . . . . . . . . .30
Electric Vehicles . . . . . . . . . . . . . . . . . . . . . . . . . . . . . . . . . . . . . . . . . . . . . . . . . . . . . . . . . . . . . . . . . . . . . . 31
Principle 3: Understand the Emissions Effects of Changes in Load . . . . . . . . . . . . . . . . . . . . . . . . . . . . . . . 34
Principle 4: Use Emissions Efficiency to Measure the Air Impacts of Beneficial Electrification . . . . . . . 37
Principle 5: Account for the Lives of Investments . . . . . . . . . . . . . . . . . . . . . . . . . . . . . . . . . . . . . . . . . . . . . . . 39
Principle 6: Design Rates to Encourage Beneficial Electrification . . . . . . . . . . . . . . . . . . . . . . . . . . . . . . . . . 41
Timing Should Matter . . . . . . . . . . . . . . . . . . . . . . . . . . . . . . . . . . . . . . . . . . . . . . . . . . . . . . . . . . . . . . . . . 41
What’s the Differential? . . . . . . . . . . . . . . . . . . . . . . . . . . . . . . . . . . . . . . . . . . . . . . . . . . . . . . . . . . . . . . . . 42
Twin Peaks . . . . . . . . . . . . . . . . . . . . . . . . . . . . . . . . . . . . . . . . . . . . . . . . . . . . . . . . . . . . . . . . . . . . . . . . . . . 42
Putting Beneficial Electrification Into Action . . . . . . . . . . . . . . . . . . . . . . . . . . . . . . . . . . . . . . .45
Lay the Foundation in Policy . . . . . . . . . . . . . . . . . . . . . . . . . . . . . . . . . . . . . . . . . . . . . . . . . . . . . . . . . . . . . . . . . 46
Develop Goals . . . . . . . . . . . . . . . . . . . . . . . . . . . . . . . . . . . . . . . . . . . . . . . . . . . . . . . . . . . . . . . . . . . . . . . . 46
2 | BENEFICIAL ELECTRIFICATION: ENSURING ELECTRIFICATION IN THE PUBLIC INTEREST REGULATORY ASSISTANCE PROJECT
Identify Barriers . . . . . . . . . . . . . . . . . . . . . . . . . . . . . . . . . . . . . . . . . . . . . . . . . . . . . . . . . . . . . . . . . . . . . . 46
Establish Metrics . . . . . . . . . . . . . . . . . . . . . . . . . . . . . . . . . . . . . . . . . . . . . . . . . . . . . . . . . . . . . . . . . . . . . . 47
Address Timing . . . . . . . . . . . . . . . . . . . . . . . . . . . . . . . . . . . . . . . . . . . . . . . . . . . . . . . . . . . . . . . . . . . . . . . 47
Consider Flexibility . . . . . . . . . . . . . . . . . . . . . . . . . . . . . . . . . . . . . . . . . . . . . . . . . . . . . . . . . . . . . . . . . . . . 47
Identify Affected Participants . . . . . . . . . . . . . . . . . . . . . . . . . . . . . . . . . . . . . . . . . . . . . . . . . . . . . . . . . . 47
Ensure an Open Process . . . . . . . . . . . . . . . . . . . . . . . . . . . . . . . . . . . . . . . . . . . . . . . . . . . . . . . . . . . . . . . . . . . . 48
Anticipate Specific Issues . . . . . . . . . . . . . . . . . . . . . . . . . . . . . . . . . . . . . . . . . . . . . . . . . . . . . . . . . . . . . . . . . . . 49
Rate Design . . . . . . . . . . . . . . . . . . . . . . . . . . . . . . . . . . . . . . . . . . . . . . . . . . . . . . . . . . . . . . . . . . . . . . . . . .50
Utility Incentives for Participating Customers . . . . . . . . . . . . . . . . . . . . . . . . . . . . . . . . . . . . . . . . . . . .50
Energy Efficiency Resource Standards and Financing . . . . . . . . . . . . . . . . . . . . . . . . . . . . . . . . . . . . .50
Energy Standards for New Construction and Appliances . . . . . . . . . . . . . . . . . . . . . . . . . . . . . . . . . . .50
Fossil Fuel Phaseout . . . . . . . . . . . . . . . . . . . . . . . . . . . . . . . . . . . . . . . . . . . . . . . . . . . . . . . . . . . . . . . . . . . 51
Conclusion . . . . . . . . . . . . . . . . . . . . . . . . . . . . . . . . . . . . . . . . . . . . . . . . . . . . . . . . . . . . . . . . . . . .52
Appendix: Beneficial Electrification and Carbon Management . . . . . . . . . . . . . . . . . . . . . . .53
Assessing Emissions Effects of Electrification . . . . . . . . . . . . . . . . . . . . . . . . . . . . . . . . . . . . . . . . . . . . . . . . . 55
Identifying Marginal Emissions . . . . . . . . . . . . . . . . . . . . . . . . . . . . . . . . . . . . . . . . . . . . . . . . . . . . . . . . . 55
Modeling . . . . . . . . . . . . . . . . . . . . . . . . . . . . . . . . . . . . . . . . . . . . . . . . . . . . . . . . . . . . . . . . . . . . . . . . . . . . . 56
BENEFICIAL ELECTRIFICATION: ENSURING ELECTRIFICATION IN THE PUBLIC INTEREST | 3 REGULATORY ASSISTANCE PROJECT
AcknowledgmentsEditorial assistance was provided by Camille Kadoch, Donna Brutkoski, Ruth Hare,
Ken Colburn, and Rick Weston
The authors would like to acknowledge and express their appreciation to the following
people who provided helpful insights into early drafts of this paper:
Ann Rendahl, Commissioner, Washington Utilities and Transportation Commission
Matthew Schuerger, Commissioner, Minnesota Public Utilities Commission
Gary Connett, formerly Great River Energy
Noel Crisostomo, California Energy Commission
Katherine Dayem and Peter May-Ostendorp, Xergy Consulting
Keith Dennis, National Rural Electric Cooperative Association
Erin Falquier, Chicane Labs
Noah Garcia, Natural Resources Defense Council
Jamie Howland, Mark LeBel, and Emily Lewis, Acadia Center
Drew Kodjak, International Council on Clean Transportation
Chris Neme, Energy Futures Group
Responsibility for the information and views set out in this paper lies entirely with the authors.

4 | BENEFICIAL ELECTRIFICATION: ENSURING ELECTRIFICATION IN THE PUBLIC INTEREST REGULATORY ASSISTANCE PROJECT
AbbreviationsBE . . . . . . . . beneficial electrification
BNEF . . . . . . Bloomberg New Energy Finance
Btu . . . . . . . . British thermal unit(s)
CO2 . . . . . . . . carbon dioxide
EV . . . . . . . . . electric vehicle
GWh . . . . . . . gigawatt-hour
kWh . . . . . . . kilowatt-hour
MWh . . . . . . . megawatt-hour
PUC . . . . . . . public utility commission
TOU . . . . . . . time-of-use
VER . . . . . . . variable energy resource
BENEFICIAL ELECTRIFICATION: ENSURING ELECTRIFICATION IN THE PUBLIC INTEREST | 5 REGULATORY ASSISTANCE PROJECT
FiguresFigure 1. Solar Photovoltaic Costs, Third Quarter 2017 . . . . . . . . . . . . . . . . . . . . . . . . . . . . . . . . . . . . . . . . . . . . . . . . . . . . . . . 17
Figure 2. Wind Cost Per kWh (US) . . . . . . . . . . . . . . . . . . . . . . . . . . . . . . . . . . . . . . . . . . . . . . . . . . . . . . . . . . . . . . . . . . . . . . . . . 18
Figure 3. Bids Received by Public Service Company of Colorado vs. Existing Plants . . . . . . . . . . . . . . . . . . . . . . . . . . . . . 19
Figure 4. Electric Storage Costs . . . . . . . . . . . . . . . . . . . . . . . . . . . . . . . . . . . . . . . . . . . . . . . . . . . . . . . . . . . . . . . . . . . . . . . . . . . 19
Figure 5. Implications for Information – Global Devices and Connections Growth . . . . . . . . . . . . . . . . . . . . . . . . . . . . . . 20
Figure 6. Relationship of Electrification to Potential Benefits . . . . . . . . . . . . . . . . . . . . . . . . . . . . . . . . . . . . . . . . . . . . . . . . . 21
Figure 7. Northwest Power and Conservation Council’s Seventh Plan Resource Portfolio . . . . . . . . . . . . . . . . . . . . . . . . .26
Figure 8. Percentage of Residential Electricity Customers Who Are Also Natural Gas Customers . . . . . . . . . . . . . . . . 30
Figure 9. Water Heater Usage Profile for Upper Midwest . . . . . . . . . . . . . . . . . . . . . . . . . . . . . . . . . . . . . . . . . . . . . . . . . . . . . 31
Figure 10. Utility System Costs and Benefits from Electric Vehicle Charging in California . . . . . . . . . . . . . . . . . . . . . . . .32
Figure 11. Wind Curtailment . . . . . . . . . . . . . . . . . . . . . . . . . . . . . . . . . . . . . . . . . . . . . . . . . . . . . . . . . . . . . . . . . . . . . . . . . . . . . . .33
Figure 12. PJM Marginal Units by Fuel . . . . . . . . . . . . . . . . . . . . . . . . . . . . . . . . . . . . . . . . . . . . . . . . . . . . . . . . . . . . . . . . . . . . . .35
Figure 13. Illustrative Emissions Efficiency of Water Heater Technologies . . . . . . . . . . . . . . . . . . . . . . . . . . . . . . . . . . . . . .38
Figure 14. Lifetimes Until Replacement for Key Equipment and Infrastructure . . . . . . . . . . . . . . . . . . . . . . . . . . . . . . . . . 40
Figure 15. Conceptual Emissions of Individual Water Heaters in a Rapidly Decarbonizing Grid . . . . . . . . . . . . . . . . . . . 40
Figure 16. A Difference in Rates Can Influence When Customers Charge Vehicles . . . . . . . . . . . . . . . . . . . . . . . . . . . . . . .42
Figure 17. Example Residential Time-of-Use Rate . . . . . . . . . . . . . . . . . . . . . . . . . . . . . . . . . . . . . . . . . . . . . . . . . . . . . . . . . . . .43
Figure 18. Customer Peaks vs. System Peak . . . . . . . . . . . . . . . . . . . . . . . . . . . . . . . . . . . . . . . . . . . . . . . . . . . . . . . . . . . . . . . 44
Figure 19. US Energy-Related Greenhouse Gas Emissions with Fully Decarbonized Electric Power Sector in 2050 . . . . 54
TablesTable 1. Beneficial Electrification Principles Summary . . . . . . . . . . . . . . . . . . . . . . . . . . . . . . . . . . . . . . . . . . . . . . . . . . . . . . .24
Table 2. Roles of Participants in BE Policies . . . . . . . . . . . . . . . . . . . . . . . . . . . . . . . . . . . . . . . . . . . . . . . . . . . . . . . . . . . . . . . . 48
Table 3. Types of Collaboratives . . . . . . . . . . . . . . . . . . . . . . . . . . . . . . . . . . . . . . . . . . . . . . . . . . . . . . . . . . . . . . . . . . . . . . . . . . 50
Table 4. What the Types of Energy Sector Models Do Well . . . . . . . . . . . . . . . . . . . . . . . . . . . . . . . . . . . . . . . . . . . . . . . . . . . .56
InfographicSix Principles of Beneficial Electrification . . . . . . . . . . . . . . . . . . . . . . . . . . . . . . . . . . . . . . . . . . . . . . . . . . . . . . . . . . . . . . . 14-15
6 | BENEFICIAL ELECTRIFICATION: ENSURING ELECTRIFICATION IN THE PUBLIC INTEREST REGULATORY ASSISTANCE PROJECT
About This Series
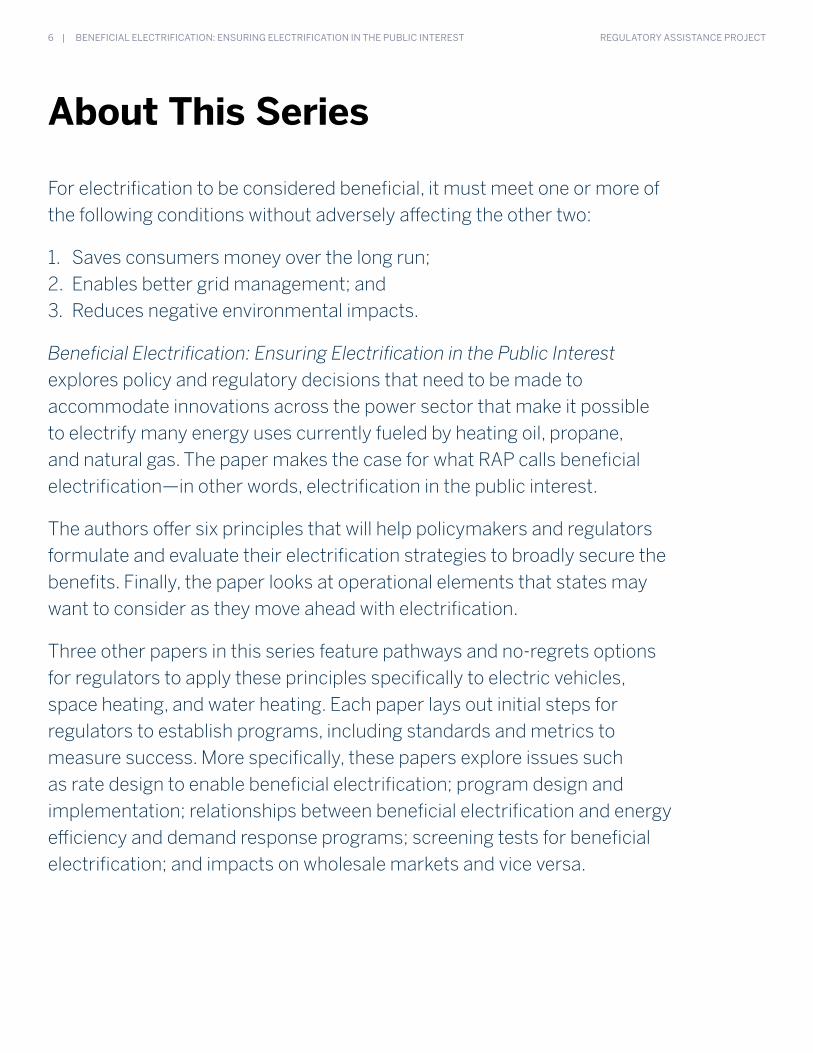
For electrification to be considered beneficial, it must meet one or more of the following conditions without adversely affecting the other two:
1. Saves consumers money over the long run;2. Enables better grid management; and3. Reduces negative environmental impacts.
Beneficial Electrification: Ensuring Electrification in the Public Interest explores policy and regulatory decisions that need to be made to accommodate innovations across the power sector that make it possible to electrify many energy uses currently fueled by heating oil, propane, and natural gas. The paper makes the case for what RAP calls beneficial electrification—in other words, electrification in the public interest.
The authors offer six principles that will help policymakers and regulators formulate and evaluate their electrification strategies to broadly secure the benefits. Finally, the paper looks at operational elements that states may want to consider as they move ahead with electrification.
Three other papers in this series feature pathways and no-regrets options for regulators to apply these principles specifically to electric vehicles, space heating, and water heating. Each paper lays out initial steps for regulators to establish programs, including standards and metrics to measure success. More specifically, these papers explore issues such as rate design to enable beneficial electrification; program design and implementation; relationships between beneficial electrification and energy efficiency and demand response programs; screening tests for beneficial electrification; and impacts on wholesale markets and vice versa.

BENEFICIAL ELECTRIFICATION: ENSURING ELECTRIFICATION IN THE PUBLIC INTEREST | 7 REGULATORY ASSISTANCE PROJECT
Foreword
Among the wide-ranging changes taking place on the
customer side of the power sector, one of the more
striking is the opportunity for beneficial electrifica-
tion—electrifying end uses historically powered by fossil fuels
to reduce costs as well as greenhouse gas and other emissions.
At RAP, we are interested in nearly every type of public
policy affecting the electric power sector. Beneficial electrifi-
cation is of particular interest because it provides the oppor-
tunity to convert space and water heating—more than half
of US home energy consumption in 2015—to electric power.
Likewise, electric vehicles have the potential to affect nearly
a third of the nation’s total energy use and lower the nation’s
transportation costs.
Such innovative energy conversion opportunities don’t
come along very often. And in this case, they offer the promise
not only of greater efficiency, but also of capitalizing on an
electric sector that is getting cleaner every day. Furthermore,
some of the end uses being electrified provide storage capacity
that, when managed, can actually assist power system opera-
tors in accommodating more low-cost, zero-carbon renewable
energy resources on the grid.
As a result, beneficial electrification supports policymakers
in achieving climate goals and simultaneously utilizes markets
to find the best means to achieve them. This is good news for
consumers, the nation’s economy, and our global environment.
But the potential misuse of these new technologies needs
to be considered, too. Will they be deployed in ways that
save consumers money, aid in managing the grid, and reduce
harmful air emissions, or will they be pursued mainly to build
utility load? Will these innovations be pursued equitably, or
be available only to the wealthy? The potential for misuse and
disruption reinforces the importance of implementing electri-
fication consistent with guiding principles that focus on the
public interest.
Beneficial Electrification: Ensuring Electrification in the Public
Interest articulates a set of such principles to help policymakers
better understand electrification trends and optimize the
opportunities they create. Moreover, it formulates first steps
for decision-makers to keep in mind in developing beneficial
electrification strategies for their states, cities, and companies.
Ken Colburn, principal and director, US Program
Montpelier, Vermont
June 2018
8 | BENEFICIAL ELECTRIFICATION: ENSURING ELECTRIFICATION IN THE PUBLIC INTEREST REGULATORY ASSISTANCE PROJECT
1 “Battery electric cars will be more expensive than equivalent internal combustion engine vehicles for the next 7-9 years, depending on segment. By the end of the 2020’s, the average [battery electric vehicle] in the US and Europe will be cheaper than a comparable [internal combustion vehicle] in all market segments, though for small cars the gap will be
marginal.” Soulopoulos, N. (2017). When will electric vehicles be cheaper than conventional vehicles? Bloomberg New Energy Finance. Retrieved from https://data.bloomberglp.com/bnef/sites/14/2017/06/BNEF_2017_04_12_EV-Price-Parity-Report.pdf
Executive Summary
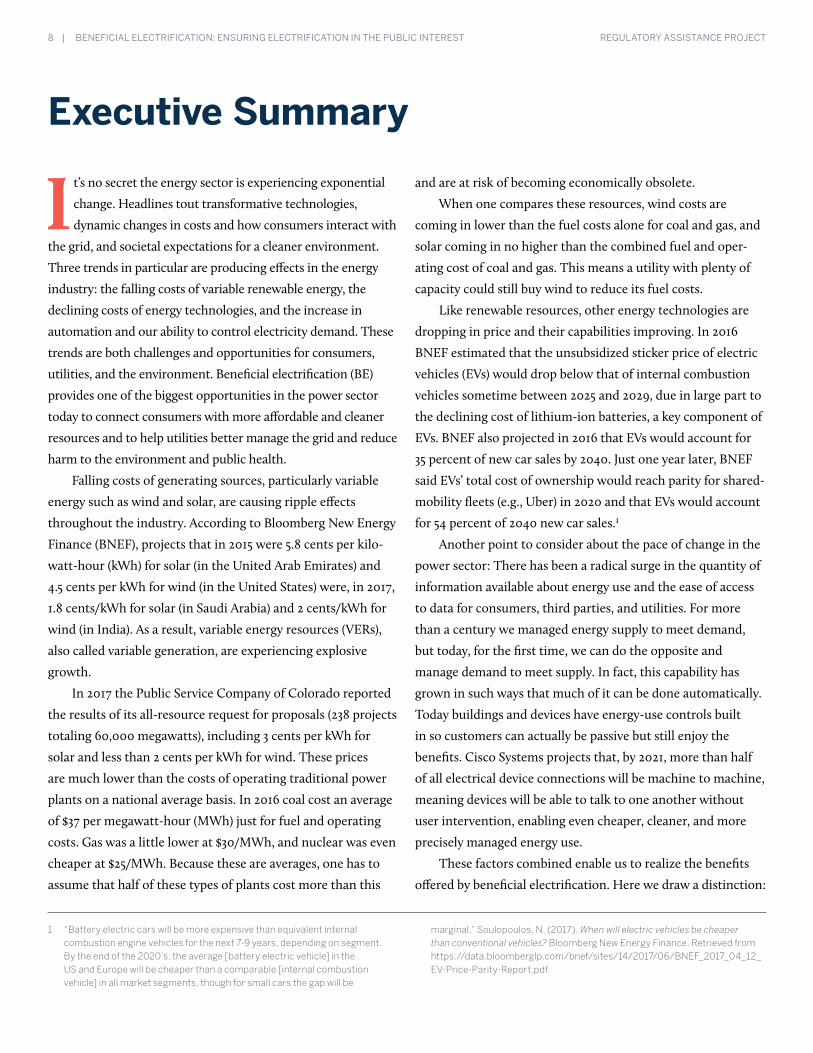
I t’s no secret the energy sector is experiencing exponential
change. Headlines tout transformative technologies,
dynamic changes in costs and how consumers interact with
the grid, and societal expectations for a cleaner environment.
Three trends in particular are producing effects in the energy
industry: the falling costs of variable renewable energy, the
declining costs of energy technologies, and the increase in
automation and our ability to control electricity demand. These
trends are both challenges and opportunities for consumers,
utilities, and the environment. Beneficial electrification (BE)
provides one of the biggest opportunities in the power sector
today to connect consumers with more affordable and cleaner
resources and to help utilities better manage the grid and reduce
harm to the environment and public health.
Falling costs of generating sources, particularly variable
energy such as wind and solar, are causing ripple effects
throughout the industry. According to Bloomberg New Energy
Finance (BNEF), projects that in 2015 were 5.8 cents per kilo-
watt-hour (kWh) for solar (in the United Arab Emirates) and
4.5 cents per kWh for wind (in the United States) were, in 2017,
1.8 cents/kWh for solar (in Saudi Arabia) and 2 cents/kWh for
wind (in India). As a result, variable energy resources (VERs),
also called variable generation, are experiencing explosive
growth.
In 2017 the Public Service Company of Colorado reported
the results of its all-resource request for proposals (238 projects
totaling 60,000 megawatts), including 3 cents per kWh for
solar and less than 2 cents per kWh for wind. These prices
are much lower than the costs of operating traditional power
plants on a national average basis. In 2016 coal cost an average
of $37 per megawatt-hour (MWh) just for fuel and operating
costs. Gas was a little lower at $30/MWh, and nuclear was even
cheaper at $25/MWh. Because these are averages, one has to
assume that half of these types of plants cost more than this
and are at risk of becoming economically obsolete.
When one compares these resources, wind costs are
coming in lower than the fuel costs alone for coal and gas, and
solar coming in no higher than the combined fuel and oper-
ating cost of coal and gas. This means a utility with plenty of
capacity could still buy wind to reduce its fuel costs.
Like renewable resources, other energy technologies are
dropping in price and their capabilities improving. In 2016
BNEF estimated that the unsubsidized sticker price of electric
vehicles (EVs) would drop below that of internal combustion
vehicles sometime between 2025 and 2029, due in large part to
the declining cost of lithium-ion batteries, a key component of
EVs. BNEF also projected in 2016 that EVs would account for
35 percent of new car sales by 2040. Just one year later, BNEF
said EVs’ total cost of ownership would reach parity for shared-
mobility fleets (e.g., Uber) in 2020 and that EVs would account
for 54 percent of 2040 new car sales.1
Another point to consider about the pace of change in the
power sector: There has been a radical surge in the quantity of
information available about energy use and the ease of access
to data for consumers, third parties, and utilities. For more
than a century we managed energy supply to meet demand,
but today, for the first time, we can do the opposite and
manage demand to meet supply. In fact, this capability has
grown in such ways that much of it can be done automatically.
Today buildings and devices have energy-use controls built
in so customers can actually be passive but still enjoy the
benefits. Cisco Systems projects that, by 2021, more than half
of all electrical device connections will be machine to machine,
meaning devices will be able to talk to one another without
user intervention, enabling even cheaper, cleaner, and more
precisely managed energy use.
These factors combined enable us to realize the benefits
offered by beneficial electrification. Here we draw a distinction:
BENEFICIAL ELECTRIFICATION: ENSURING ELECTRIFICATION IN THE PUBLIC INTEREST | 9 REGULATORY ASSISTANCE PROJECT
Electrification is not the same as BE. We assert that for it to be
considered beneficial, or in the public interest, electrification
must meet one or more of the following conditions, without
adversely affecting the other two:
1. Saves consumers money over the long run;
2. Enables better grid management; and
3. Reduces negative environmental impacts.
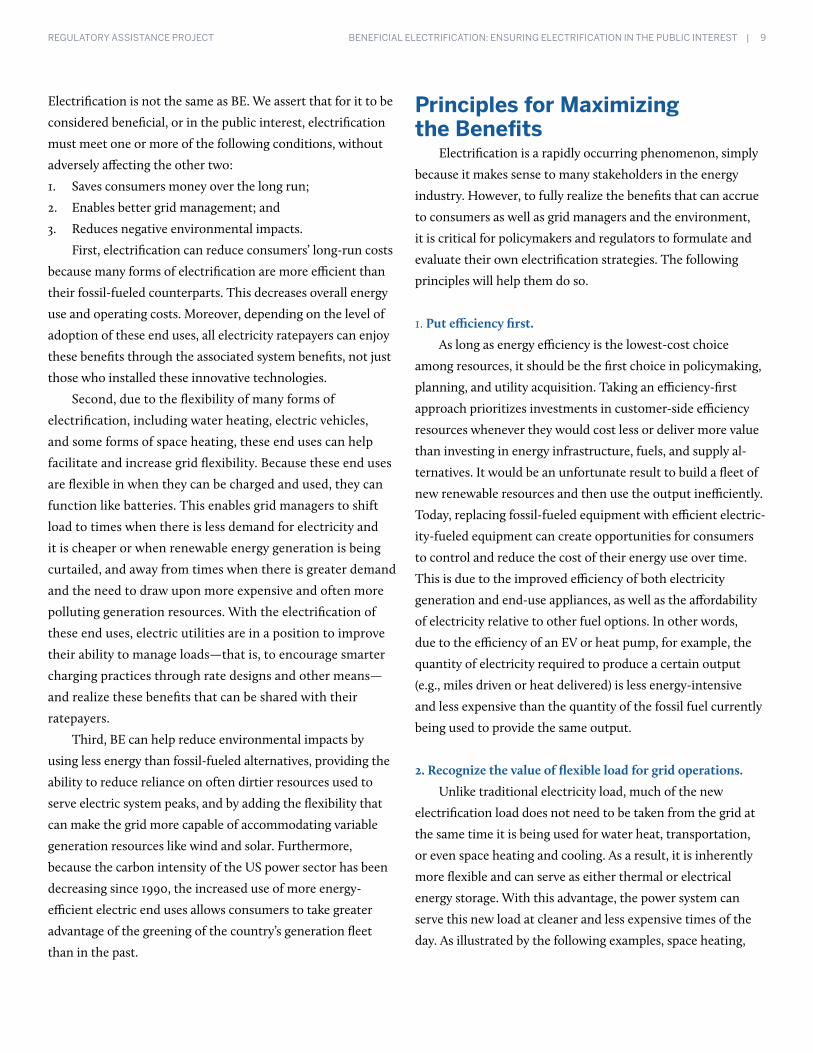
First, electrification can reduce consumers’ long-run costs
because many forms of electrification are more efficient than
their fossil-fueled counterparts. This decreases overall energy
use and operating costs. Moreover, depending on the level of
adoption of these end uses, all electricity ratepayers can enjoy
these benefits through the associated system benefits, not just
those who installed these innovative technologies.
Second, due to the flexibility of many forms of
electrification, including water heating, electric vehicles,
and some forms of space heating, these end uses can help
facilitate and increase grid flexibility. Because these end uses
are flexible in when they can be charged and used, they can
function like batteries. This enables grid managers to shift
load to times when there is less demand for electricity and
it is cheaper or when renewable energy generation is being
curtailed, and away from times when there is greater demand
and the need to draw upon more expensive and often more
polluting generation resources. With the electrification of
these end uses, electric utilities are in a position to improve
their ability to manage loads—that is, to encourage smarter
charging practices through rate designs and other means—
and realize these benefits that can be shared with their
ratepayers.
Third, BE can help reduce environmental impacts by
using less energy than fossil-fueled alternatives, providing the
ability to reduce reliance on often dirtier resources used to
serve electric system peaks, and by adding the flexibility that
can make the grid more capable of accommodating variable
generation resources like wind and solar. Furthermore,
because the carbon intensity of the US power sector has been
decreasing since 1990, the increased use of more energy-
efficient electric end uses allows consumers to take greater
advantage of the greening of the country’s generation fleet
than in the past.
Principles for Maximizing the Benefits
Electrification is a rapidly occurring phenomenon, simply
because it makes sense to many stakeholders in the energy
industry. However, to fully realize the benefits that can accrue
to consumers as well as grid managers and the environment,
it is critical for policymakers and regulators to formulate and
evaluate their own electrification strategies. The following
principles will help them do so.
1. Put efficiency first.
As long as energy efficiency is the lowest-cost choice
among resources, it should be the first choice in policymaking,
planning, and utility acquisition. Taking an efficiency-first
approach prioritizes investments in customer-side efficiency
resources whenever they would cost less or deliver more value
than investing in energy infrastructure, fuels, and supply al-
ternatives. It would be an unfortunate result to build a fleet of
new renewable resources and then use the output inefficiently.
Today, replacing fossil-fueled equipment with efficient electric-
ity-fueled equipment can create opportunities for consumers
to control and reduce the cost of their energy use over time.
This is due to the improved efficiency of both electricity
generation and end-use appliances, as well as the affordability
of electricity relative to other fuel options. In other words,
due to the efficiency of an EV or heat pump, for example, the
quantity of electricity required to produce a certain output
(e.g., miles driven or heat delivered) is less energy-intensive
and less expensive than the quantity of the fossil fuel currently
being used to provide the same output.
2. Recognize the value of flexible load for grid operations.
Unlike traditional electricity load, much of the new
electrification load does not need to be taken from the grid at
the same time it is being used for water heat, transportation,
or even space heating and cooling. As a result, it is inherently
more flexible and can serve as either thermal or electrical
energy storage. With this advantage, the power system can
serve this new load at cleaner and less expensive times of the
day. As illustrated by the following examples, space heating,

10 | BENEFICIAL ELECTRIFICATION: ENSURING ELECTRIFICATION IN THE PUBLIC INTEREST REGULATORY ASSISTANCE PROJECT
water heating, and EV loads don’t need to be entirely served
during the morning and evening peaks when power is more
constrained, more expensive, and often more polluting.
Space heating: Electrification holds great promise in space
heating, where technologies that directly use fossil fuels like
oil, propane, and natural gas have historically predominated.
Not only are heat pumps far more efficient in most circum-
stances than combustion alternatives, but when connected
with smart thermostats, they can help manage system demand
by preheating or precooling a space during the afternoon
and running less during the early evening peak, or by making
use of thermal energy storage systems. This flexibility can
be increased by enabling participation in demand response
programs that provide measurable peak load reduction benefits
to the grid and avoid unnecessary air emissions.
Water heating: The tank on a water heater is a form
of thermal battery, capable of providing significant storage
capacity and opportunities for utilities and ratepayers. It does
not matter to a consumer if her shower water was heated five
minutes or five hours earlier as long as it is hot when she needs
it and there is enough. To the extent it is possible to shift water
heater energy consumption to lower demand times of the day,
it is possible to “charge” water heaters during cheaper and
lower-emissions hours. Moreover, this flexibility, especially
when aggregated, can deliver capacity, energy, and ancillary
services to the grid.
Electric vehicles: EVs constitute a significant source of
flexible load because they are battery-powered and, like various
types of electric water heaters, can be charged at times that are
most beneficial to the grid. This flexibility means EVs can also
help reduce loads that would otherwise add to system peaks
and drive unnecessary grid investment and costs to ratepayers.
As noted above, this flexibility can also help the electric sector
accommodate increased amounts of variable renewable gener-
ation and further reduce the sector’s carbon intensity.
3. Understand the emissions effects of changes in load.
Knowing the generation source of the electricity being
used to power devices like heat pumps and EVs is crucial for
determining the overall emissions impacts of BE. Nationwide,
today’s power sector emits the same amount of carbon dioxide
(CO2) as it did a generation ago, in 1993, although it produces
nearly 30 percent more electricity annually. This positive trend
is due in large part to cleaner generation resources.
Because electrification will add load, knowing a system’s
marginal emissions is especially important as electrification
programs become operational around the country and
policymakers try to determine related energy savings. A
marginal emissions analysis shows, in aggregate, the emissions
from the resource on the margin in a system, meaning the
emissions that would be added with the use of one more kWh,
or that would be reduced if a kWh is avoided, at each time
period during the year.
Although determining marginal emissions will be im-
portant as electrification programs get underway, it will also
be important to have a sense of the emissions expected as
significant amounts of electrification load are added to the
nation’s grids. If states decide to pursue policies and programs
that increase electricity sales, most of that added load may
be served by a combination of resources with a very different
emissions profile than the marginal unit at each hour of the
day in any given power grid. Getting a sense of total emissions
is thus likely to require the use of power sector modeling.
4. Use emissions efficiency to measure the air impacts of
beneficial electrification.
Beneficial electrification adopts a total-system efficiency
viewpoint and seeks to recognize a reduction in the use of
primary energy. Despite using more kWhs of electricity,
consumers are in a position to use less energy overall, thereby
producing fewer pounds of pollution per vehicle mile traveled
or per gallon of hot water produced.
The emissions impact of electrification, combined with
the wealth of available load, emissions, and consumption
data, including system analytics and grid operating data, will
enable utilities to ascertain the times of day and months of
the year when electrification produces the lowest amount
of generation-related emissions on their power systems.
Grid managers and regulators can thus develop a more
complete picture of the relative emissions efficiency benefits
of electrifying certain end uses—and shape load accordingly.
Understanding when and where electrification is most
BENEFICIAL ELECTRIFICATION: ENSURING ELECTRIFICATION IN THE PUBLIC INTEREST | 11 REGULATORY ASSISTANCE PROJECT
emissions-efficient will enable regulators to develop policies,
rate structures, and incentives to ensure that electrification
minimizes any incremental emissions.
5. Account for the lives of investments.
Energy infrastructure investments—whether made by
utilities or homeowners—are long-lived: Generation, trans-
mission, and distribution assets can have expected useful
lives of 30 or 40 years or longer, while a home water heater or
lighting fixture can last more than a decade. Consequently,
opportunities for new investments are necessarily limited and
best undertaken when they can avoid other investments. These
limitations are especially important because, unless utilities
and consumers are positioned to make informed investments
when infrastructure replacement time arrives, the opportunity
to make lower-cost, cleaner investments may be lost. It is
important when these decisions arise to replace infrastructure
with least-cost, emissions-efficient resources that will provide
years of valuable flexibility to grid managers and cost savings to
consumers.
BE investments raise an additional noteworthy factor:
As the power sector reduces its environmental footprint over
time, the emissions efficiency of electric end uses will improve
correspondingly. Consequently, it is important to recognize
that the total emissions over the life of an electrification
investment may be lower than for the fossil-fueled alternative,
even if emissions are higher in the early years of the
investment. Thus, in certain jurisdictions where the regional
power grid is rapidly decarbonizing, it is worth considering
electrification even before end uses are more emissions-
efficient than the fossil-fueled alternatives they replace. Note
too that fossil-fueled options do not share this advantage. No
matter how emissions-efficient they may be today, that will not
change over their useful lives.
6. Design rates to encourage beneficial electrification.
Customers are willing to shift their consumption to
cheaper hours of the day when the financial incentive to do
so is meaningful. Using rates to signal value to consumers is
not a new strategy. As noted, many electric technologies can
be scheduled to charge when the cost of operating the grid
is lower. However, for customers to have incentives to take
advantage of that low-cost power—and for them and the utility
to reap the economic benefits—time-sensitive pricing will be
necessary to communicate to customers the differences in
costs at different times of day.
Further, innovation can flow from good rate design. Rates
shape the way we use the grid, and grid managers can use rates
to make more efficient use of existing grid investments, avoid
unnecessary new investments, and motivate customers.
Putting Beneficial Electrification Into Action
Despite being a pathway to significant innovations and op-
portunities for utilities, consumers, and the environment, BE
probably will not occur, nor will related benefits materialize, in
the absence of focused action by states. This section outlines
the important policy prerequisites, process steps, and other
considerations that can contribute to the successful implemen-
tation of BE and the realization of its many benefits.
Lay the Foundation in Policy 1. Develop goals: The first step in developing any effective
policy is to articulate why it is being created. A BE policy
should be no different. BE may be a worthy goal in and of
itself, but states adopting it will have other policy objec-
tives that may be affected or that may inform how each
state implements BE. States will benefit from first defining
goals and then prioritizing them before making decisions
about specific BE implementation efforts.
2. Identify barriers: It is important for policymakers,
regulators, and utilities to identify barriers to achievement
of their goals. These include, for example, traditional cost-
of-service regulation and the incentive it gives utilities to
increase sales and resist any measures that might reduce
them.
3. Establish metrics: Identifying criteria and metrics is
essential for states to track progress toward their goals.
Metrics could include, for example, the number of EVs
sold or heat pumps installed, the quantity of emissions
avoided, fossil fuel savings, or peak demand reductions.

12 | BENEFICIAL ELECTRIFICATION: ENSURING ELECTRIFICATION IN THE PUBLIC INTEREST REGULATORY ASSISTANCE PROJECT
Not only can states use metrics for tracking progress, they
may also wish to revisit established regulatory practices
and use these metrics to develop performance incentives
for utilities.
4. Address timing: Policymakers will want to recognize that
the development and implementation of BE programs
represents a long-term effort.
5. Consider flexibility: How much flexibility do policymak-
ers want to provide the entities charged with implement-
ing BE? As long as providers are delivering measurable
results that meet policy goals and objectives, it could be
useful to grant them the leeway to choose the specifics of
program design, implementation, and delivery.
6. Identify affected participants: States will want to recog-
nize, and perhaps leverage, the many actors that could
affect or be affected as BE activity develops.
Ensure an Open ProcessAnother key to successfully developing policy and creating
support for it is to establish a process in which interested
parties can participate and engage with one another. Most
energy-related proceedings are formally convened before
a state public utility commission (PUC) and offer limited
opportunities for consumers and other stakeholders to
participate. Rules governing interactions vary such that some
state utility commissioners may engage in discussions with all
interested stakeholders, while other states may strictly limit
such interactions. Absent an affirmative step by states, process-
es for examining BE could become more constrained and less
inclusive.
Collaborative efforts can also give regulators the oppor-
tunity to convene multiple stakeholders unfamiliar with the
commission, its scope, and its rules to discuss a variety of
issues in a constructive and less formal environment. Collab-
oratives can provide a flexible structure to help work through
policy questions and resolve conflicts as part of or completely
outside a typical quasi-judicial PUC setting. Collaboratives
lend themselves to addressing the many broad policy ques-
tions electrification raises. They can be set up to address the
full suite of issues associated with designing, implementing,
monitoring, improving, and even adapting such programs to
changing conditions. Over the last several years, state commis-
sions in Maryland, Minnesota, Rhode Island, and Illinois have
hosted collaboratives on emerging energy policy issues.
Anticipate Specific IssuesOnce states have engaged stakeholders and identified
BE-related goals, several specific issues are likely to arise. They
include rate design, utility incentives, efficiency resource
standards, building codes for new construction, appliance
standards, and fossil fuel phaseout.
1. Rate design: Adapting electric rate design is a key element
of electrification. Electrification depends on independent
actions by energy users enabled through sufficient trans-
parency and promise of compensation. For electrification
consumers to benefit from the value produced by their
flexible electrified loads, the value of their actions must be
communicated through the electricity prices they pay or
avoid. It is not essential to apply advanced rate design to
all customers; that is a separate regulatory decision from
making optional time-varying rates available to consumers
able to control or shift their usage into low-cost, low-emis-
sions periods.
2. Utility incentives for participating customers: Electric
utilities have provided ratepayer-funded incentives to en-
hance the deployment of innovative technologies for many
years. It is reasonable to expect that the same rationale will
apply at least in part for BE-related equipment.
3. Energy efficiency resource standards: BE may result
in higher kWh consumption even as the efficient use of
energy overall (all fuels) improves. Where existing energy
efficiency standards impose obligations only on electricity
consumption, states would be wise to modify them to
include all fuels. Standards could also consider other
metrics, such as avoided CO2 emissions, Btu savings, or
peak reductions.
4. Building energy codes for new construction and appli-
ance standards: New construction is the ideal opportunity
to deploy new technologies, so states may want to consider
building codes that advance BE technologies. The entire
cost of an efficient heating and cooling system, as well as
a water heating system, is then only an incremental cost.

BENEFICIAL ELECTRIFICATION: ENSURING ELECTRIFICATION IN THE PUBLIC INTEREST | 13 REGULATORY ASSISTANCE PROJECT
Likewise, appliance standards that explicitly consider the
competitiveness of BE appliances will contribute to their
adoption.
5. Fossil fuel phaseout: We recommend that states consider
incorporating equipment investment lifetimes into
current planning and analysis. As electric technologies
continue to improve and decline in price, the costs of
all fossil fuel-based investments over their useful lives
may not be as attractive as today, and the risk of creating
stranded costs is greater.
This paper is intended to stimulate discussion about how
to approach the many opportunities associated with major
trends and innovations in the power sector today. BE is a
collection of strategies designed to identify and overcome
barriers and take advantage of these trends and related
opportunities to benefit consumers, electric utilities, and the
environment.
14 | BENEFICIAL ELECTRIFICATION: ENSURING ELECTRIFICATION IN THE PUBLIC INTEREST REGULATORY ASSISTANCE PROJECT
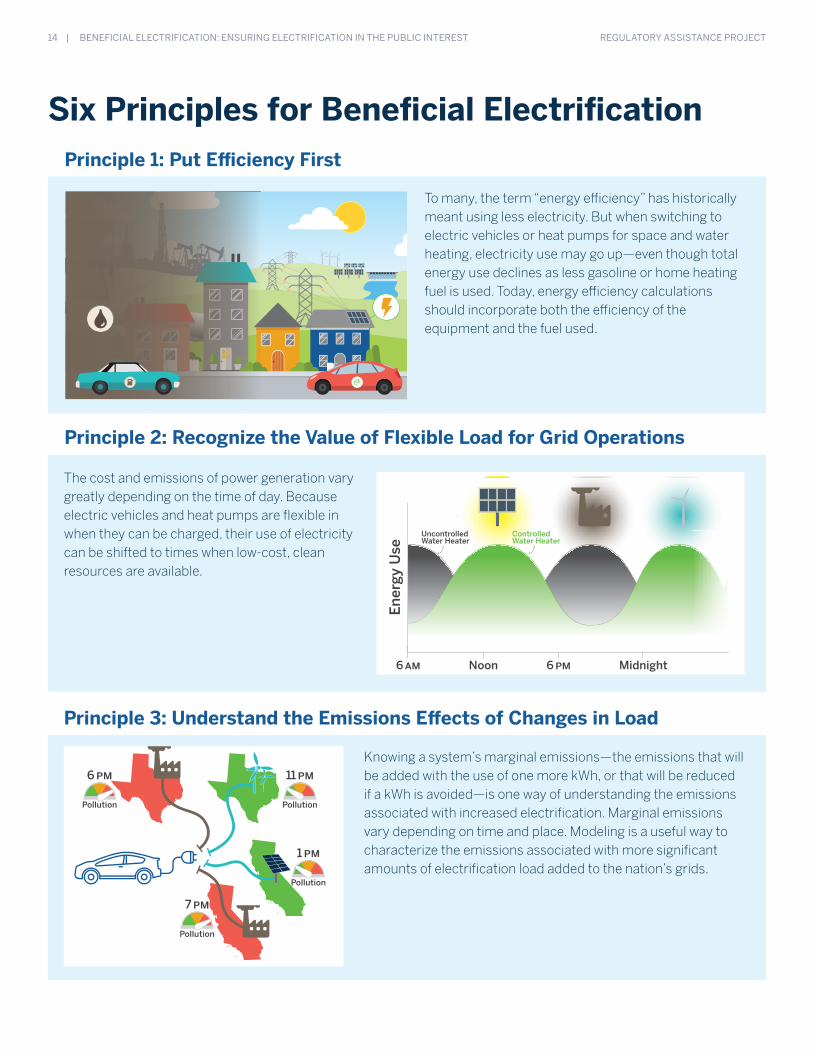
Six Principles for Beneficial Electrification
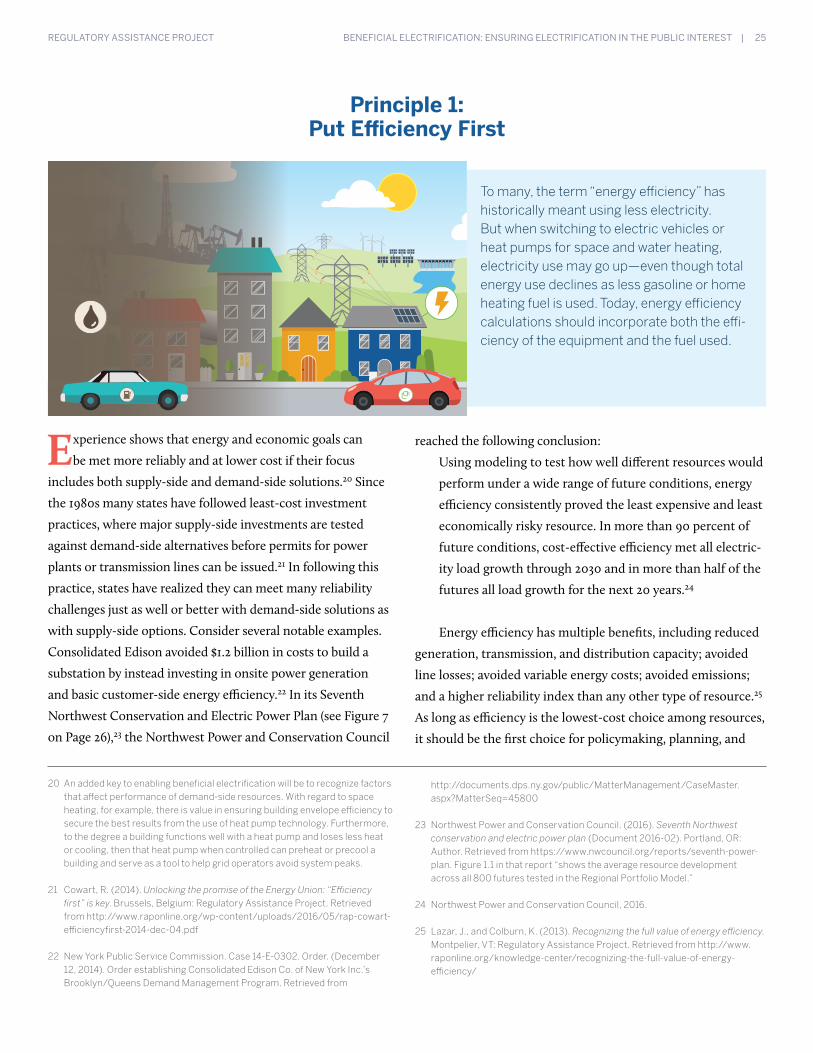
To many, the term “energy efficiency” has historically meant using less electricity. But when switching to electric vehicles or heat pumps for space and water heating, electricity use may go up—even though total energy use declines as less gasoline or home heating fuel is used. Today, energy efficiency calculations should incorporate both the efficiency of the equipment and the fuel used.
Principle 1: Put Efficiency First
The cost and emissions of power generation vary greatly depending on the time of day. Because electric vehicles and heat pumps are flexible in when they can be charged, their use of electricity can be shifted to times when low-cost, clean resources are available.
Ener
gy U
se
6 AM 6 PM MidnightNoon
Uncontrolled Water Heater
Controlled Water Heater
Principle 2: Recognize the Value of Flexible Load for Grid Operations
Knowing a system’s marginal emissions—the emissions that will be added with the use of one more kWh, or that will be reduced if a kWh is avoided—is one way of understanding the emissions associated with increased electrification. Marginal emissions vary depending on time and place. Modeling is a useful way to characterize the emissions associated with more significant amounts of electrification load added to the nation’s grids.
Principle 3: Understand the Emissions Effects of Changes in Load
7 PM
Pollution
11 PM
Pollution
1 PM
Pollution
6 PM
Pollution
BENEFICIAL ELECTRIFICATION: ENSURING ELECTRIFICATION IN THE PUBLIC INTEREST | 15 REGULATORY ASSISTANCE PROJECT
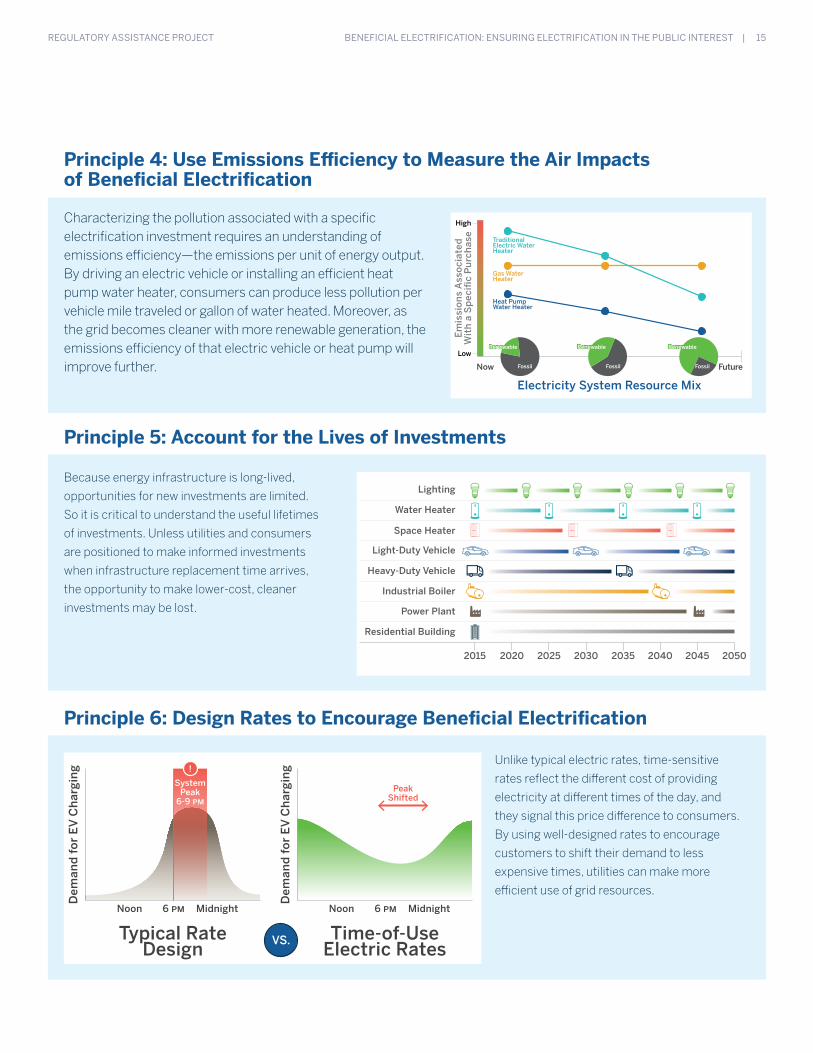
Characterizing the pollution associated with a specific electrification investment requires an understanding of emissions efficiency—the emissions per unit of energy output. By driving an electric vehicle or installing an efficient heat pump water heater, consumers can produce less pollution per vehicle mile traveled or gallon of water heated. Moreover, as the grid becomes cleaner with more renewable generation, the emissions efficiency of that electric vehicle or heat pump will improve further.
Principle 4: Use Emissions Efficiency to Measure the Air Impacts of Beneficial Electrification
High
Emis
sion
s A
ssoc
iate
d W
ith
a S
peci
�c
Pur
chas
e
Electricity System Resource Mix
Now Future
Low
TraditionalElectric WaterHeater
Heat Pump Water Heater
Gas Water Heater
Fossil Fossil Fossil
RenewableRenewable RenewableRenewable RenewableRenewable
Because energy infrastructure is long-lived,
opportunities for new investments are limited.
So it is critical to understand the useful lifetimes
of investments. Unless utilities and consumers
are positioned to make informed investments
when infrastructure replacement time arrives,
the opportunity to make lower-cost, cleaner
investments may be lost.
Principle 5: Account for the Lives of Investments
2015 2020 2025 2030 2035 2040 2045 2050
Industrial Boiler
Heavy-Duty Vehicle
Water Heater
Lighting
Light-Duty Vehicle
Space Heater
Residential Building
Power Plant
Unlike typical electric rates, time-sensitive
rates reflect the different cost of providing
electricity at different times of the day, and
they signal this price difference to consumers.
By using well-designed rates to encourage
customers to shift their demand to less
expensive times, utilities can make more
efficient use of grid resources.
Principle 6: Design Rates to Encourage Beneficial Electrification
6 PM MidnightNoon
Dem
and
for
EV
Cha
rgin
g
Typical Rate Design
6 PM MidnightNoon
Dem
and
for
EV
Cha
rgin
g
Time-of-UseElectric Rates
System Peak
6-9 PM
VS.
!
Peak Shifted
Opportunities in a Changing Energy SectorTechnologies are gaining new capabilities while costs decline, enabling an energy transformation that benefits consumers and the environment.
BENEFICIAL ELECTRIFICATION: ENSURING ELECTRIFICATION IN THE PUBLIC INTEREST | 17 REGULATORY ASSISTANCE PROJECT
Beneficial electrification (BE) provides one
of the biggest opportunities in the power
sector today to connect consumers with
far more affordable and cleaner resources and to
help utilities better manage the grid and reduce
harm to the environment and public health.
Although the electric power system was once
a centralized structure supplied by remote and
largely fossil fuel-fired resources, it is becoming
more distributed and interconnected, allowing customers to
produce, consume, and save energy in numerous ways. Utility
customers are becoming accustomed to the growing availabili-
ty and convenience of newly electrified end uses in transporta-
tion, space heating, and water heating. Because of their greater
efficiency, these electric technologies can be significantly less
costly to operate than traditional fossil fuel-based alternatives
and are poised to bring a new wave of innovation and opportu-
nity for our economy.
The energy sector—specifically the costs and capabilities
of energy technologies—is undergoing exponential change. Al-
though that term may be overused, we think of it as illustrated
by Moore’s law, describing regular doublings of computing
power. In the energy sector this translates into doublings in
an absolute sense (as in numbers of installations), a capability
sense (such as an electric vehicle, or EV, going farther on a
charge), or a cost sense (such as halving of the market price for
different technologies).
This is happening in many ways. Smart meters and other
technologies make data about the grid more available than ever
before. Variable energy resources (VERs), also called variable
generation, are experiencing explosive growth. And there
is rapid advancement in the capabilities of storage and EVs.
These forces compound each other, due to the digitization
of energy, creating network effects that will enable electricity
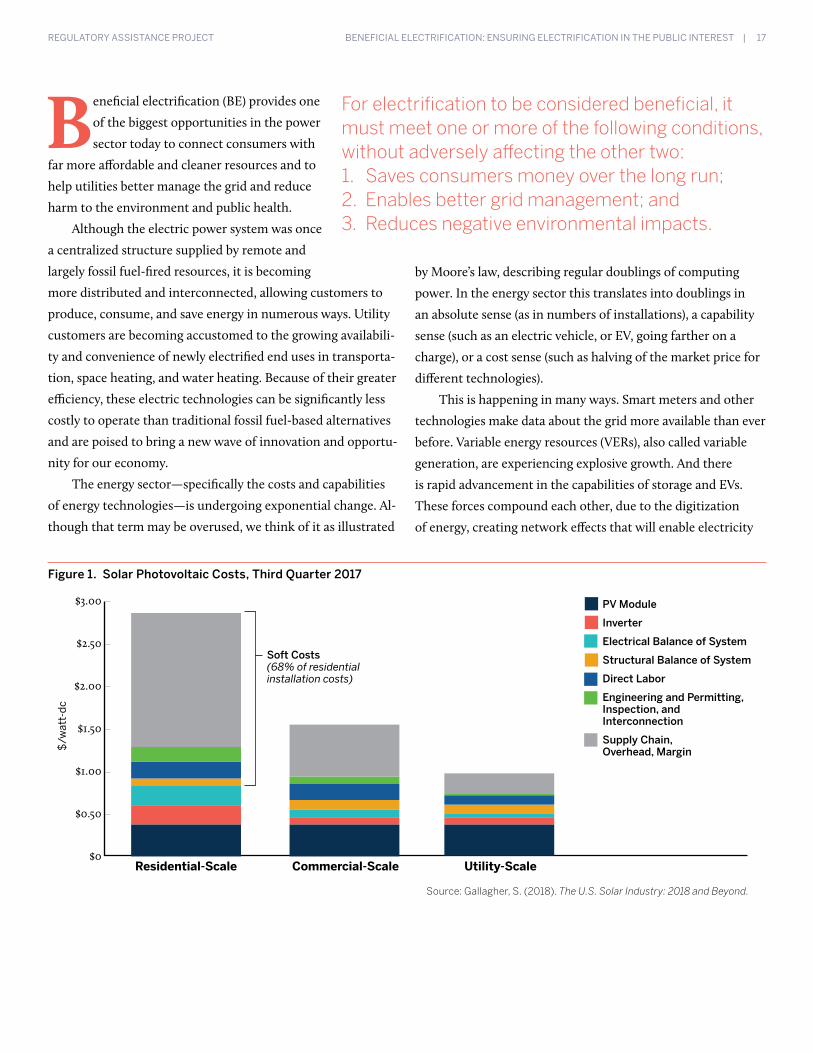
Figure 1. Solar Photovoltaic Costs, Third Quarter 2017
$3.00
$2.50
$2.00
$1.50
$1.00
$0.50
$0
$/w
att-
dc
Residential-Scale
PV Module
Inverter
Electrical Balance of System
Structural Balance of System
Direct Labor
Engineering and Permitting,Inspection, and Interconnection
Supply Chain,Overhead, Margin
Commercial-Scale Utility-Scale
Soft Costs(68% of residential installation costs)
Source: Gallagher, S. (2018). The U.S. Solar Industry: 2018 and Beyond.
For electrification to be considered beneficial, it must meet one or more of the following conditions, without adversely affecting the other two: 1. Saves consumers money over the long run;2. Enables better grid management; and3. Reduces negative environmental impacts.
18 | BENEFICIAL ELECTRIFICATION: ENSURING ELECTRIFICATION IN THE PUBLIC INTEREST REGULATORY ASSISTANCE PROJECT
2 Gallagher, S. (2018, January 19). The U.S. solar industry: 2018 and beyond [Presentation]. Solar Energy Industries Association. Retrieved from https://www.renewwisconsin.org/wp-content/uploads/2018/01/7.-SeanGallagher-SEIA.pdf
3 US Department of Energy. (2014.) The clean energy economy in three charts [Webpage]. Retrieved from https://www.energy.gov/articles/clean-energy-economy-three-charts
4 Wiser, R., and Bolinger, M. (2017). 2016 wind technologies market report. Washington, DC: US Department of Energy, Office of Energy Efficiency & Renewable Energy. Retrieved from https://energy.gov/sites/prod/files/2017/10/f37/2016_Wind_Technologies_Market_Report_101317.pdf. See also US Department of Energy, Office of Energy Efficiency & Renewable Energy. (2015). EERE 2014 wind technologies market report finds wind power
demand to be managed for the first time in history. This
flexibility can make the electric grid more capable of accom-
modating even greater amounts of low-cost VERs.
Wind and solar costs are falling around the globe. This is
occurring for solar systems of all sizes. Figure 1 on Page 17
shows that by the third quarter of 2017, residential solar
systems cost less than $3 per watt, and utility-scale systems
broke the $1 per watt threshold.2
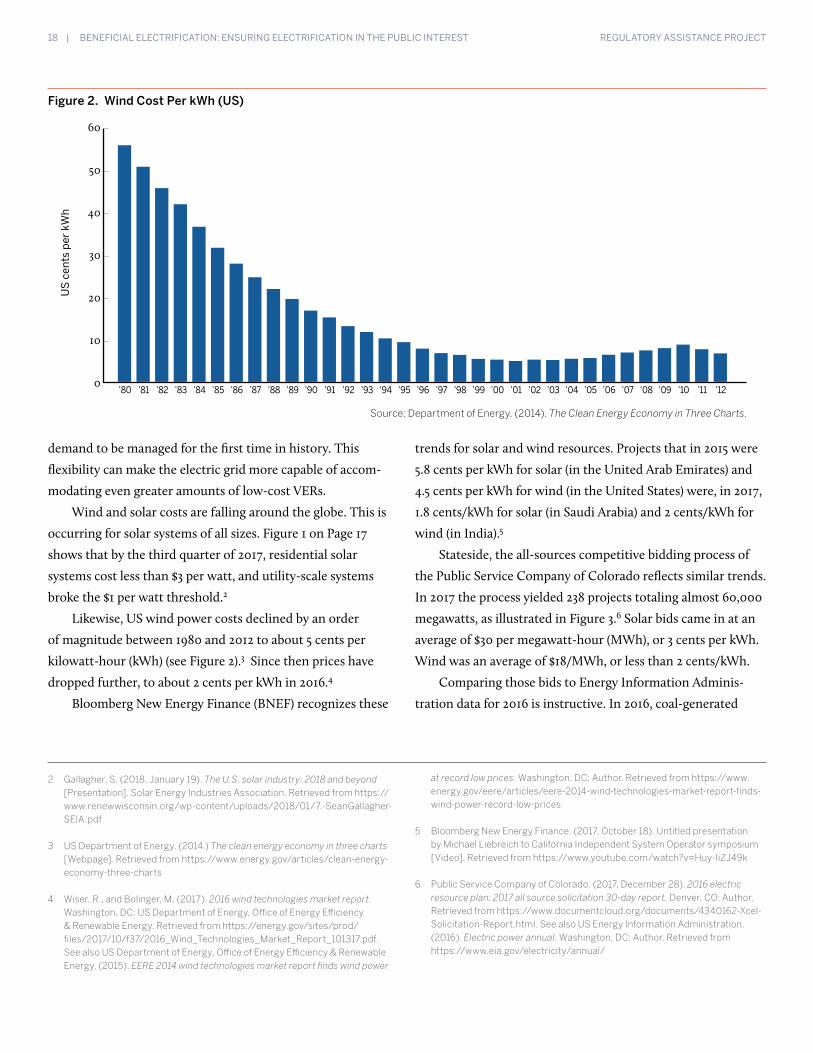
Likewise, US wind power costs declined by an order
of magnitude between 1980 and 2012 to about 5 cents per
kilowatt-hour (kWh) (see Figure 2).3 Since then prices have
dropped further, to about 2 cents per kWh in 2016.4
Bloomberg New Energy Finance (BNEF) recognizes these
Figure 2. Wind Cost Per kWh (US)
60
50
40
30
20
10
0
US
cen
ts p
er k
Wh
’80 ’81 ’82 ’83 ’84 ’85 ’86 ’87 ’88 ’89 ’90 ’91 ’92 ’93 ’94 ’95 ’96 ’97 ’98 ’99 ’00 ’01 ’02 ’03 ’04 ’05 ’06 ’07 ’08 ’09 ’10 ’11 ’12
Source: Department of Energy. (2014). The Clean Energy Economy in Three Charts.
at record low prices. Washington, DC: Author. Retrieved from https://www.energy.gov/eere/articles/eere-2014-wind-technologies-market-report-finds-wind-power-record-low-prices
5 Bloomberg New Energy Finance. (2017, October 18). Untitled presentation by Michael Liebreich to California Independent System Operator symposium [Video]. Retrieved from https://www.youtube.com/watch?v=Huy-IiZJ49k
6 Public Service Company of Colorado. (2017, December 28). 2016 electric resource plan: 2017 all source solicitation 30-day report. Denver, CO: Author. Retrieved from https://www.documentcloud.org/documents/4340162-Xcel-Solicitation-Report.html. See also US Energy Information Administration. (2016). Electric power annual. Washington, DC: Author. Retrieved from https://www.eia.gov/electricity/annual/
trends for solar and wind resources. Projects that in 2015 were
5.8 cents per kWh for solar (in the United Arab Emirates) and
4.5 cents per kWh for wind (in the United States) were, in 2017,
1.8 cents/kWh for solar (in Saudi Arabia) and 2 cents/kWh for
wind (in India).5
Stateside, the all-sources competitive bidding process of
the Public Service Company of Colorado reflects similar trends.
In 2017 the process yielded 238 projects totaling almost 60,000
megawatts, as illustrated in Figure 3.6 Solar bids came in at an
average of $30 per megawatt-hour (MWh), or 3 cents per kWh.
Wind was an average of $18/MWh, or less than 2 cents/kWh.
Comparing those bids to Energy Information Adminis-
tration data for 2016 is instructive. In 2016, coal-generated
BENEFICIAL ELECTRIFICATION: ENSURING ELECTRIFICATION IN THE PUBLIC INTEREST | 19 REGULATORY ASSISTANCE PROJECT
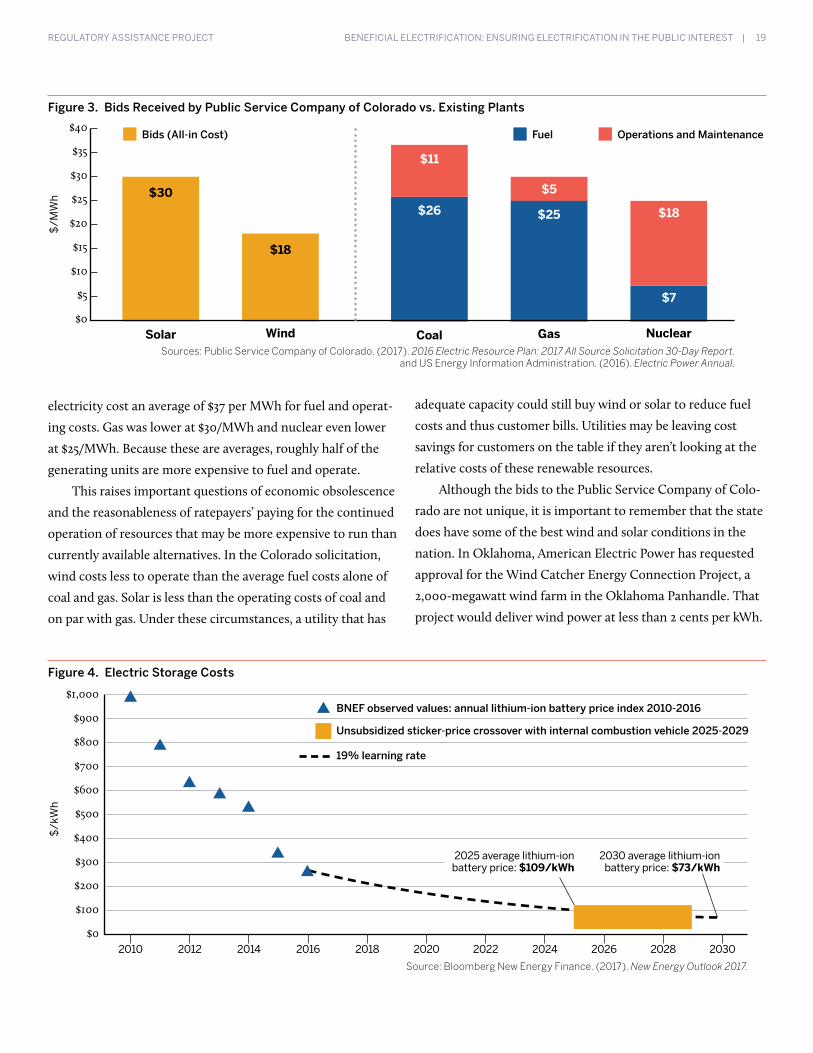
electricity cost an average of $37 per MWh for fuel and operat-
ing costs. Gas was lower at $30/MWh and nuclear even lower
at $25/MWh. Because these are averages, roughly half of the
generating units are more expensive to fuel and operate.
This raises important questions of economic obsolescence
and the reasonableness of ratepayers’ paying for the continued
operation of resources that may be more expensive to run than
currently available alternatives. In the Colorado solicitation,
wind costs less to operate than the average fuel costs alone of
coal and gas. Solar is less than the operating costs of coal and
on par with gas. Under these circumstances, a utility that has
Figure 3. Bids Received by Public Service Company of Colorado vs. Existing Plants
Solar CoalWind Gas Nuclear
Fuel Operations and MaintenanceBids (All-in Cost)
$30
$18
$11
$26
$5
$25 $18
$7
$/M
Wh
Sources: Public Service Company of Colorado. (2017). 2016 Electric Resource Plan: 2017 All Source Solicitation 30-Day Report. and US Energy Information Administration. (2016). Electric Power Annual.
adequate capacity could still buy wind or solar to reduce fuel
costs and thus customer bills. Utilities may be leaving cost
savings for customers on the table if they aren’t looking at the
relative costs of these renewable resources.
Although the bids to the Public Service Company of Colo-
rado are not unique, it is important to remember that the state
does have some of the best wind and solar conditions in the
nation. In Oklahoma, American Electric Power has requested
approval for the Wind Catcher Energy Connection Project, a
2,000-megawatt wind farm in the Oklahoma Panhandle. That
project would deliver wind power at less than 2 cents per kWh.
Figure 4. Electric Storage Costs
BNEF observed values: annual lithium-ion battery price index 2010-2016
Unsubsidized sticker-price crossover with internal combustion vehicle 2025-2029
19% learning rate
$1,000
$900
$800
$700
$600
$500
$400
$300
$200
$100
$0
$/k
Wh
2010 2012 2014 2016 2018 2020
2030 average lithium-ion battery price: $73/kWh
2022 2024 2026 2028 2030
2025 average lithium-ion battery price: $109/kWh
Source: Bloomberg New Energy Finance. (2017). New Energy Outlook 2017.
$40
$35
$30
$25
$20
$15
$10
$5
$0
20 | BENEFICIAL ELECTRIFICATION: ENSURING ELECTRIFICATION IN THE PUBLIC INTEREST REGULATORY ASSISTANCE PROJECT
7 Prices are an average of battery electric vehicle and plug-in hybrid electric vehicle batteries and include both cell and pack costs. Historical prices are nominal; future ones are in real 2016 US dollars. Bloomberg New Energy Finance. (2017). New energy outlook 2017. Retrieved from https://about.bnef.com/new-energy-outlook/
8 Hogan, M. (2018, February 12). As reliable as your morning coffee: Why do we go overboard on generation resource adequacy? [Blog post]. Regulatory
Like renewables, other energy technologies are declining
in cost and their capabilities improving. Figure 4 on Page 19
illustrates the cost of lithium-ion batteries—a key component
in EVs—and BNEF’s estimate of the unsubsidized sticker price
crossover point with internal combustion vehicles.7
The blue triangles depict the actual observed prices per
kWh through 2016. The hatched line illustrates BNEF’s projec-
tion of how prices are likely to track over the next decade.
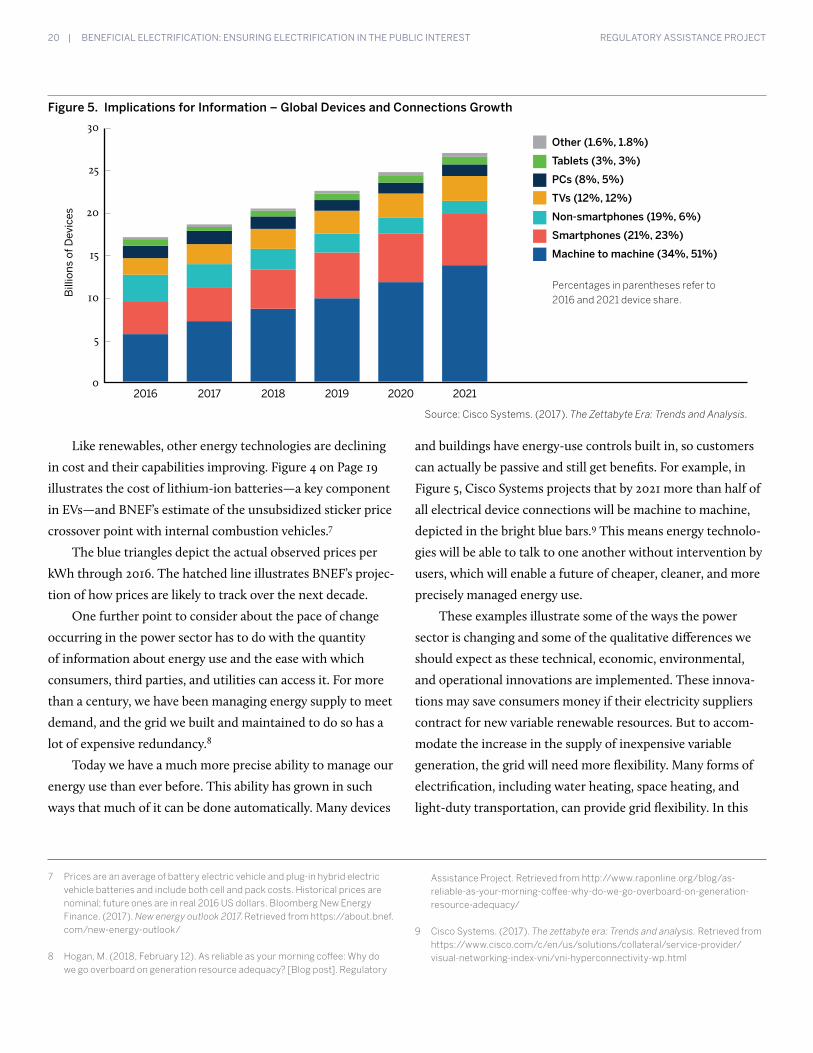
One further point to consider about the pace of change
occurring in the power sector has to do with the quantity
of information about energy use and the ease with which
consumers, third parties, and utilities can access it. For more
than a century, we have been managing energy supply to meet
demand, and the grid we built and maintained to do so has a
lot of expensive redundancy.8
Today we have a much more precise ability to manage our
energy use than ever before. This ability has grown in such
ways that much of it can be done automatically. Many devices
Figure 5. Implications for Information – Global Devices and Connections Growth
30
25
20
15
10
5
0
Bill
ions
of D
evic
es
2016 2017 2018 2019 2020 2021
Other (1.6%, 1.8%)
Tablets (3%, 3%)
PCs (8%, 5%)
TVs (12%, 12%)
Non-smartphones (19%, 6%)
Smartphones (21%, 23%)
Machine to machine (34%, 51%)
Source: Cisco Systems. (2017). The Zettabyte Era: Trends and Analysis.
Percentages in parentheses refer to 2016 and 2021 device share.
and buildings have energy-use controls built in, so customers
can actually be passive and still get benefits. For example, in
Figure 5, Cisco Systems projects that by 2021 more than half of
all electrical device connections will be machine to machine,
depicted in the bright blue bars.9 This means energy technolo-
gies will be able to talk to one another without intervention by
users, which will enable a future of cheaper, cleaner, and more
precisely managed energy use.
These examples illustrate some of the ways the power
sector is changing and some of the qualitative differences we
should expect as these technical, economic, environmental,
and operational innovations are implemented. These innova-
tions may save consumers money if their electricity suppliers
contract for new variable renewable resources. But to accom-
modate the increase in the supply of inexpensive variable
generation, the grid will need more flexibility. Many forms of
electrification, including water heating, space heating, and
light-duty transportation, can provide grid flexibility. In this
Assistance Project. Retrieved from http://www.raponline.org/blog/as-reliable-as-your-morning-coffee-why-do-we-go-overboard-on-generation-resource-adequacy/
9 Cisco Systems. (2017). The zettabyte era: Trends and analysis. Retrieved from https://www.cisco.com/c/en/us/solutions/collateral/service-provider/visual-networking-index-vni/vni-hyperconnectivity-wp.html
BENEFICIAL ELECTRIFICATION: ENSURING ELECTRIFICATION IN THE PUBLIC INTEREST | 21 REGULATORY ASSISTANCE PROJECT
paper we use three examples of electrical end uses to illustrate
their efficiency, flexibility, and potential as power grid resourc-
es: air source heat pumps, heat pump water heaters, and EVs.10
These electrified end uses are far more efficient than
their fossil-fueled counterparts. Heat pumps, for example, are
capable of providing 1.5 to 3 times more heat energy than the
heat value of the electrical energy they consume, making them
ideal for space and water heating. Likewise, EVs are capable of
converting 60 percent of the energy they draw from the grid
into miles traveled, while comparable gasoline-fueled passen-
ger vehicles convert only about 20 percent of primary energy to
10 We have chosen these three examples for clarity of exposition. We recognize that there are many alternatives to and variations of these three types of technologies, and their effectiveness will depend on a large number of factors including climate and use patterns. See, for example, Deason, J., Wei, M., Leventis, G., Smith, S., and Schwartz, L.C. (2018). Electrification of buildings and industry in the United States: Drivers, barriers, prospects, and policy approaches (LBNL-2001133). Berkeley, CA: Lawrence Berkeley National Laboratory. Retrieved from http://eta-publications.lbl.gov/sites/default/files/electrification_of_buildings_and_industry_final_0.pdf. See also Nadel, S. (2016). Comparative energy use of residential furnaces and heat pumps (Research report No. A1602). Washington, DC: American Council for an Energy-Efficient Economy. Retrieved from http://aceee.org/comparative-energy-use-residential-furnaces-and
11 “EVs convert about 59%-62% of the electrical energy from the grid to power at the wheels. Conventional gasoline vehicles only convert about 17%–21% of the energy stored in gasoline to power at the wheels.” US Department of
Energy, Office of Energy Efficiency & Renewable Energy. All-electric vehicles [Webpage]. Retrieved from https://www.fueleconomy.gov/feg/evtech.shtml. Heat pump water heaters “can be two to three times more energy efficient than conventional electric resistance water heaters.” US Department of Energy, Office of Energy Efficiency & Renewable Energy. Heat pump water heaters [Webpage]. Retrieved from https://energy.gov/energysaver/heat-pump-water-heaters. See also Northeast Energy Efficiency Partnerships. Cold climate air source heat pump. Retrieved from http://www.neep.org/initiatives/high-efficiency-products/emerging-technologies/ashp/cold-climate-air-source-heat-pump
12 For additional examples of this flexibility, see the discussion of ice and chilled water storage applications for commercial air-conditioning applications in Lazar, J. (2016). Teaching the “duck” to fly (2nd edition). Montpelier, VT: Regulatory Assistance Project. Retrieved from http://www.raponline.org/document/download/id/7956
the same purpose.11
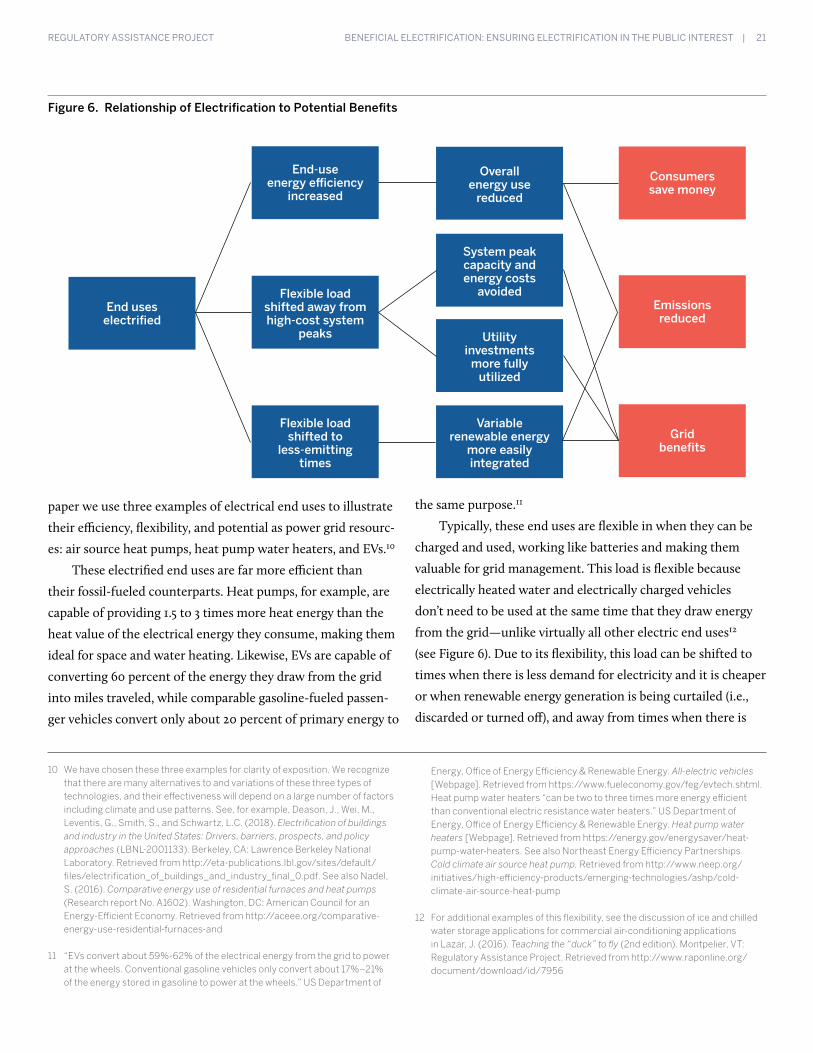
Typically, these end uses are flexible in when they can be
charged and used, working like batteries and making them
valuable for grid management. This load is flexible because
electrically heated water and electrically charged vehicles
don’t need to be used at the same time that they draw energy
from the grid—unlike virtually all other electric end uses12
(see Figure 6). Due to its flexibility, this load can be shifted to
times when there is less demand for electricity and it is cheaper
or when renewable energy generation is being curtailed (i.e.,
discarded or turned off), and away from times when there is
Figure 6. Relationship of Electrification to Potential Benefits
End uses electrified
Overall energy use
reduced
System peak capacity and energy costs
avoided
Utility investments
more fully utilized
Variable renewable energy
more easily integrated
End-use energy efficiency
increased
Emissions reduced
Grid benefits
Consumers save money
Flexible load shifted away from high-cost system
peaks
Flexible load shifted to
less-emitting times

22 | BENEFICIAL ELECTRIFICATION: ENSURING ELECTRIFICATION IN THE PUBLIC INTEREST REGULATORY ASSISTANCE PROJECT
13 This emissions efficiency is a key aspect of BE and raises questions about traditional energy efficiency assumptions. Emissions efficiency is further discussed in the next two sections of this paper.
14 Weiss, J., Hledik, R., Hagerty, M., and Gorman, W. (2017). Electrification: Emerging opportunities for utility growth. Cambridge, MA: The Brattle Group. Retrieved from http://www.brattle.com/system/news/pdfs/000/001/174/original/Electrification_Whitepaper_Final_Single_Pages.pdf?1485532518
15 Flexible electrification load can provide various grid management services. See Alstone, P., Potter, J., Piette, M.A., Schwartz, P., Berger, M., Dunn, L.N., et al. (2017). Final report on Phase 2 results: 2025 California demand response potential study. Retrieved from http://www.cpuc.ca.gov/WorkArea/DownloadAsset.aspx?id=6442452698; see also St. John, J. (2017, January 26). How California can shape, shift and shimmy to demand response nirvana.
Greentech Media. Retrieved from https://www.greentechmedia.com/articles/read/how-california-can-shape-shift-and-shimmy-to-demand-response#gs.NERYCdk
16 The authors recognize that the environmental footprint of power sector infrastructure including generation is broader than the associated air emissions or, more narrowly, the associated carbon emissions. However, in this paper we focus more narrowly to ensure clarity of exposition and to better illustrate these beneficial electrification principles.
17 We also recognize that electrification will be affected by changes in federal and state energy and environmental policies. See the Appendix.
18 See Table 1 on Page 24.
greater demand and the need to dispatch more
expensive and often more polluting generation
resources. Because this load can be shifted, it is
valuable to consumers and the utilities that serve
them.
Because of their flexibility, these end uses
have potential as grid resources that can help utilities with load
management. BE load can be managed through appropriate
rate designs and other smart-charging programs to help
balance increasing amounts of variable generation on the grid
and the retirement of older, less flexible steam generating
units. Using BE load as a grid management tool also positions
utilities to provide new and innovative services and programs
to customers and to defer or permanently avoid costly gen-
eration, transmission, and distribution system upgrades that
might otherwise be necessary with new uncontrolled load.
Furthermore, as BE makes the grid more flexible and
capable of accommodating VERs by reducing system peaks and
enables the grid to accommodate greater amounts of cleaner
resources, it also contributes to an even cleaner power sector
overall. The availability of more energy-efficient electric end
uses, in combination with the greening of the generation
fleet, creates the potential for far greater emissions efficiency.
In other words, despite consuming more kilowatt-hours of
electricity, consumers will produce fewer pounds of pollution
per vehicle mile traveled or per gallon of hot water produced.13
To some, electrification may simply represent increasing
The availability of more energy-efficient electric end uses, in combination with the greening of the generation fleet, creates the potential for far greater emissions efficiency.
load.14 But for it to be considered beneficial, electrification
must meet one or more of the following conditions, without
adversely affecting the other two:
1. Saves consumers money over the long run;
2. Enables better grid management;15 and
3. Reduces negative environmental impacts.16
These three conditions guide our discussion of BE in the
following pages.17 We should emphasize, however, that while
fundamental to beneficial electrification, these conditions
characterize only potential benefits; they won’t occur auto-
matically. To help ensure they do occur, the next section of
this paper sets out six principles for regulators to observe in
developing and evaluating electrification strategies. Observing
these principles will make it more likely that electrification will
develop in a manner that serves the public good and broadly
produces benefits.18 The final section discusses practical, im-
plementation-related first steps that states can consider as they
move ahead with BE or work to position their jurisdictions to
do so. These include articulating key policy prerequisites and
developing informal collaborative efforts among stakeholders.

BENEFICIAL ELECTRIFICATION: ENSURING ELECTRIFICATION IN THE PUBLIC INTEREST | 23 REGULATORY ASSISTANCE PROJECT
Principles for Maximizing the BenefitsSix guiding statements will help policymakers and regulators accomplish the objectives of beneficial electrification.
24 | BENEFICIAL ELECTRIFICATION: ENSURING ELECTRIFICATION IN THE PUBLIC INTEREST REGULATORY ASSISTANCE PROJECT
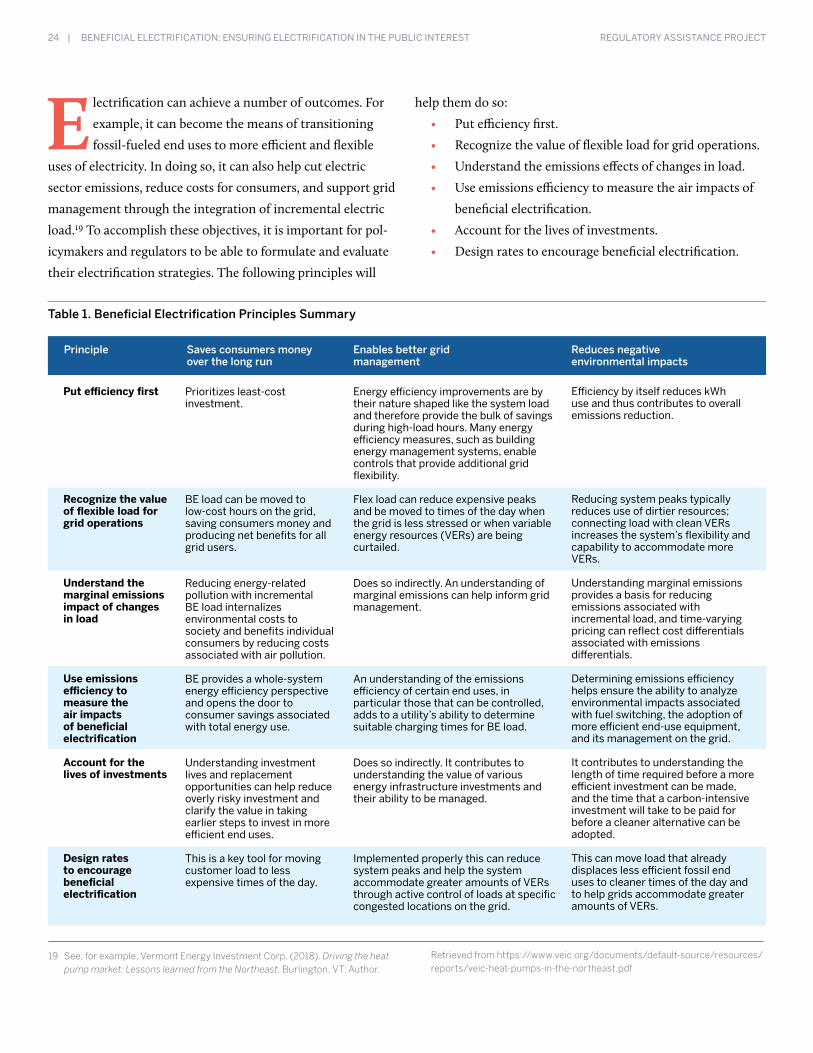
E lectrification can achieve a number of outcomes. For
example, it can become the means of transitioning
fossil-fueled end uses to more efficient and flexible
uses of electricity. In doing so, it can also help cut electric
sector emissions, reduce costs for consumers, and support grid
management through the integration of incremental electric
load.19 To accomplish these objectives, it is important for pol-
icymakers and regulators to be able to formulate and evaluate
their electrification strategies. The following principles will
help them do so:
• Put efficiency first.
• Recognize the value of flexible load for grid operations.
• Understand the emissions effects of changes in load.
• Use emissions efficiency to measure the air impacts of
beneficial electrification.
• Account for the lives of investments.
• Design rates to encourage beneficial electrification.
19 See, for example, Vermont Energy Investment Corp. (2018). Driving the heat pump market: Lessons learned from the Northeast. Burlington, VT: Author.
Table 1. Beneficial Electrification Principles Summary
Put efficiency first
Recognize the value of flexible load for grid operations
Understand the marginal emissions impact of changes in load
Use emissions efficiency to measure the air impacts of beneficial electrification
Account for the lives of investments
Design rates to encourage beneficial electrification
Prioritizes least-cost investment.
BE load can be moved to low-cost hours on the grid, saving consumers money and producing net benefits for all grid users.
Reducing energy-related pollution with incremental BE load internalizes environmental costs to society and benefits individual consumers by reducing costs associated with air pollution.
BE provides a whole-system energy efficiency perspective and opens the door to consumer savings associated with total energy use.
Understanding investment lives and replacement opportunities can help reduce overly risky investment and clarify the value in taking earlier steps to invest in more efficient end uses.
This is a key tool for moving customer load to less expensive times of the day.
Energy efficiency improvements are by their nature shaped like the system load and therefore provide the bulk of savings during high-load hours. Many energy efficiency measures, such as building energy management systems, enable controls that provide additional grid flexibility.
Flex load can reduce expensive peaks and be moved to times of the day when the grid is less stressed or when variable energy resources (VERs) are being curtailed.
Does so indirectly. An understanding of marginal emissions can help inform grid management.
An understanding of the emissions efficiency of certain end uses, in particular those that can be controlled, adds to a utility’s ability to determine suitable charging times for BE load.
Does so indirectly. It contributes to understanding the value of various energy infrastructure investments and their ability to be managed.
Implemented properly this can reduce system peaks and help the system accommodate greater amounts of VERs through active control of loads at specific congested locations on the grid.
Efficiency by itself reduces kWh use and thus contributes to overall emissions reduction.
Reducing system peaks typically reduces use of dirtier resources; connecting load with clean VERs increases the system’s flexibility and capability to accommodate more VERs.
Understanding marginal emissions provides a basis for reducing emissions associated with incremental load, and time-varying pricing can reflect cost differentials associated with emissions differentials. Determining emissions efficiency helps ensure the ability to analyze environmental impacts associated with fuel switching, the adoption of more efficient end-use equipment, and its management on the grid.
It contributes to understanding the length of time required before a more efficient investment can be made, and the time that a carbon-intensive investment will take to be paid for before a cleaner alternative can be adopted.
This can move load that already displaces less efficient fossil end uses to cleaner times of the day and to help grids accommodate greater amounts of VERs.
Principle Saves consumers money over the long run
Enables better grid management
Reduces negative environmental impacts
Retrieved from https://www.veic.org/documents/default-source/resources/reports/veic-heat-pumps-in-the-northeast.pdf
BENEFICIAL ELECTRIFICATION: ENSURING ELECTRIFICATION IN THE PUBLIC INTEREST | 25 REGULATORY ASSISTANCE PROJECT
20 An added key to enabling beneficial electrification will be to recognize factors that affect performance of demand-side resources. With regard to space heating, for example, there is value in ensuring building envelope efficiency to secure the best results from the use of heat pump technology. Furthermore, to the degree a building functions well with a heat pump and loses less heat or cooling, then that heat pump when controlled can preheat or precool a building and serve as a tool to help grid operators avoid system peaks.
21 Cowart, R. (2014). Unlocking the promise of the Energy Union: “Efficiency first” is key. Brussels, Belgium: Regulatory Assistance Project. Retrieved from http://www.raponline.org/wp-content/uploads/2016/05/rap-cowart-efficiencyfirst-2014-dec-04.pdf
22 New York Public Service Commission. Case 14-E-0302. Order. (December 12, 2014). Order establishing Consolidated Edison Co. of New York Inc.’s Brooklyn/Queens Demand Management Program. Retrieved from
http://documents.dps.ny.gov/public/MatterManagement/CaseMaster.aspx?MatterSeq=45800
23 Northwest Power and Conservation Council. (2016). Seventh Northwest conservation and electric power plan (Document 2016-02). Portland, OR: Author. Retrieved from https://www.nwcouncil.org/reports/seventh-power-plan. Figure 1.1 in that report “shows the average resource development across all 800 futures tested in the Regional Portfolio Model.”
24 Northwest Power and Conservation Council, 2016.
25 Lazar, J., and Colburn, K. (2013). Recognizing the full value of energy efficiency. Montpelier, VT: Regulatory Assistance Project. Retrieved from http://www.raponline.org/knowledge-center/recognizing-the-full-value-of-energy-efficiency/
Experience shows that energy and economic goals can
be met more reliably and at lower cost if their focus
includes both supply-side and demand-side solutions.20 Since
the 1980s many states have followed least-cost investment
practices, where major supply-side investments are tested
against demand-side alternatives before permits for power
plants or transmission lines can be issued.21 In following this
practice, states have realized they can meet many reliability
challenges just as well or better with demand-side solutions as
with supply-side options. Consider several notable examples.
Consolidated Edison avoided $1.2 billion in costs to build a
substation by instead investing in onsite power generation
and basic customer-side energy efficiency.22 In its Seventh
Northwest Conservation and Electric Power Plan (see Figure 7
on Page 26),23 the Northwest Power and Conservation Council
reached the following conclusion:
Using modeling to test how well different resources would
perform under a wide range of future conditions, energy
efficiency consistently proved the least expensive and least
economically risky resource. In more than 90 percent of
future conditions, cost-effective efficiency met all electric-
ity load growth through 2030 and in more than half of the
futures all load growth for the next 20 years.24
Energy efficiency has multiple benefits, including reduced
generation, transmission, and distribution capacity; avoided
line losses; avoided variable energy costs; avoided emissions;
and a higher reliability index than any other type of resource.25
As long as efficiency is the lowest-cost choice among resources,
it should be the first choice for policymaking, planning, and
To many, the term “energy efficiency” has historically meant using less electricity. But when switching to electric vehicles or heat pumps for space and water heating, electricity use may go up—even though total energy use declines as less gasoline or home heating fuel is used. Today, energy efficiency calculations should incorporate both the effi-ciency of the equipment and the fuel used.
Principle 1: Put Efficiency First
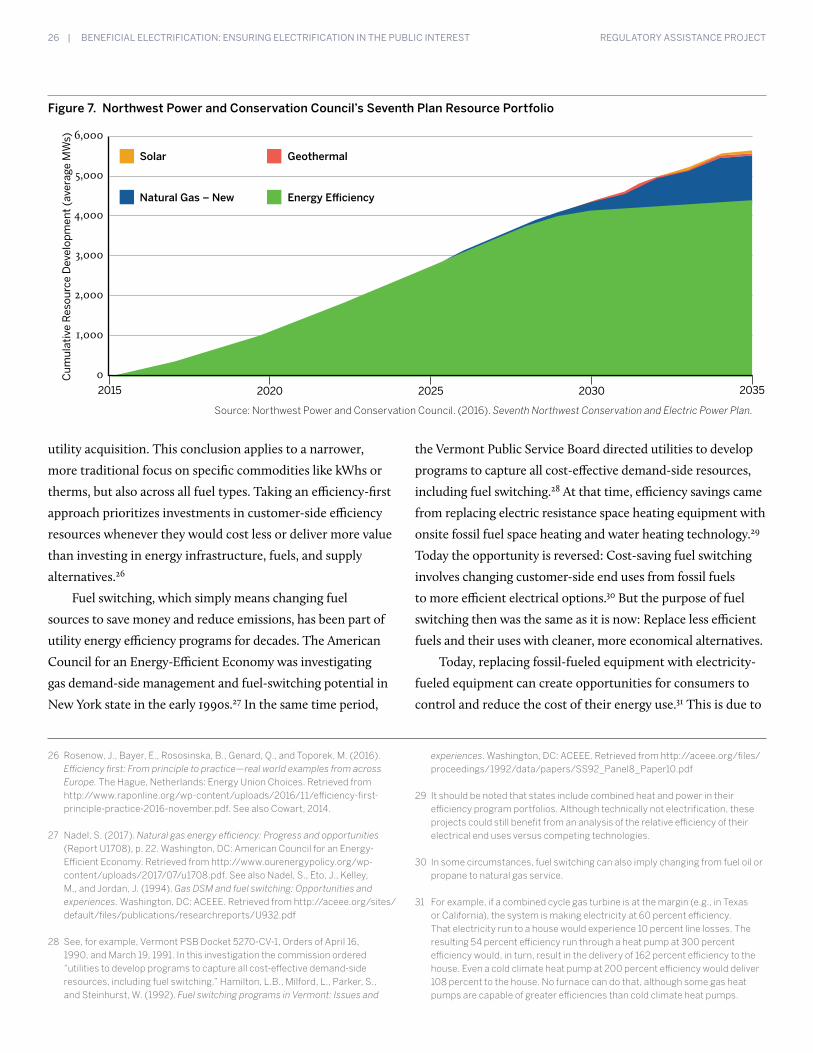
26 | BENEFICIAL ELECTRIFICATION: ENSURING ELECTRIFICATION IN THE PUBLIC INTEREST REGULATORY ASSISTANCE PROJECT
26 Rosenow, J., Bayer, E., Rososinska, B., Genard, Q., and Toporek, M. (2016). Efficiency first: From principle to practice—real world examples from across Europe. The Hague, Netherlands: Energy Union Choices. Retrieved from http://www.raponline.org/wp-content/uploads/2016/11/efficiency-first-principle-practice-2016-november.pdf. See also Cowart, 2014.
27 Nadel, S. (2017). Natural gas energy efficiency: Progress and opportunities (Report U1708), p. 22. Washington, DC: American Council for an Energy-Efficient Economy. Retrieved from http://www.ourenergypolicy.org/wp-content/uploads/2017/07/u1708.pdf. See also Nadel, S., Eto, J., Kelley, M., and Jordan, J. (1994). Gas DSM and fuel switching: Opportunities and experiences. Washington, DC: ACEEE. Retrieved from http://aceee.org/sites/default/files/publications/researchreports/U932.pdf
28 See, for example, Vermont PSB Docket 5270-CV-1, Orders of April 16, 1990, and March 19, 1991. In this investigation the commission ordered “utilities to develop programs to capture all cost-effective demand-side resources, including fuel switching.” Hamilton, L.B., Milford, L., Parker, S., and Steinhurst, W. (1992). Fuel switching programs in Vermont: Issues and
experiences. Washington, DC: ACEEE. Retrieved from http://aceee.org/files/proceedings/1992/data/papers/SS92_Panel8_Paper10.pdf
29 It should be noted that states include combined heat and power in their efficiency program portfolios. Although technically not electrification, these projects could still benefit from an analysis of the relative efficiency of their electrical end uses versus competing technologies.
30 In some circumstances, fuel switching can also imply changing from fuel oil or propane to natural gas service.
31 For example, if a combined cycle gas turbine is at the margin (e.g., in Texas or California), the system is making electricity at 60 percent efficiency. That electricity run to a house would experience 10 percent line losses. The resulting 54 percent efficiency run through a heat pump at 300 percent efficiency would, in turn, result in the delivery of 162 percent efficiency to the house. Even a cold climate heat pump at 200 percent efficiency would deliver 108 percent to the house. No furnace can do that, although some gas heat pumps are capable of greater efficiencies than cold climate heat pumps.
Figure 7. Northwest Power and Conservation Council’s Seventh Plan Resource Portfolio
6,000
5,000
4,000
3,000
2,000
1,000
0Cum
ulat
ive
Res
ourc
e D
evel
opm
ent
(ave
rage
MW
s)
2015 2020 2025 2030 2035
Solar Geothermal
Natural Gas – New Energy Efficiency
Source: Northwest Power and Conservation Council. (2016). Seventh Northwest Conservation and Electric Power Plan.
utility acquisition. This conclusion applies to a narrower,
more traditional focus on specific commodities like kWhs or
therms, but also across all fuel types. Taking an efficiency-first
approach prioritizes investments in customer-side efficiency
resources whenever they would cost less or deliver more value
than investing in energy infrastructure, fuels, and supply
alternatives.26
Fuel switching, which simply means changing fuel
sources to save money and reduce emissions, has been part of
utility energy efficiency programs for decades. The American
Council for an Energy-Efficient Economy was investigating
gas demand-side management and fuel-switching potential in
New York state in the early 1990s.27 In the same time period,
the Vermont Public Service Board directed utilities to develop
programs to capture all cost-effective demand-side resources,
including fuel switching.28 At that time, efficiency savings came
from replacing electric resistance space heating equipment with
onsite fossil fuel space heating and water heating technology.29
Today the opportunity is reversed: Cost-saving fuel switching
involves changing customer-side end uses from fossil fuels
to more efficient electrical options.30 But the purpose of fuel
switching then was the same as it is now: Replace less efficient
fuels and their uses with cleaner, more economical alternatives.
Today, replacing fossil-fueled equipment with electricity-
fueled equipment can create opportunities for consumers to
control and reduce the cost of their energy use.31 This is due to
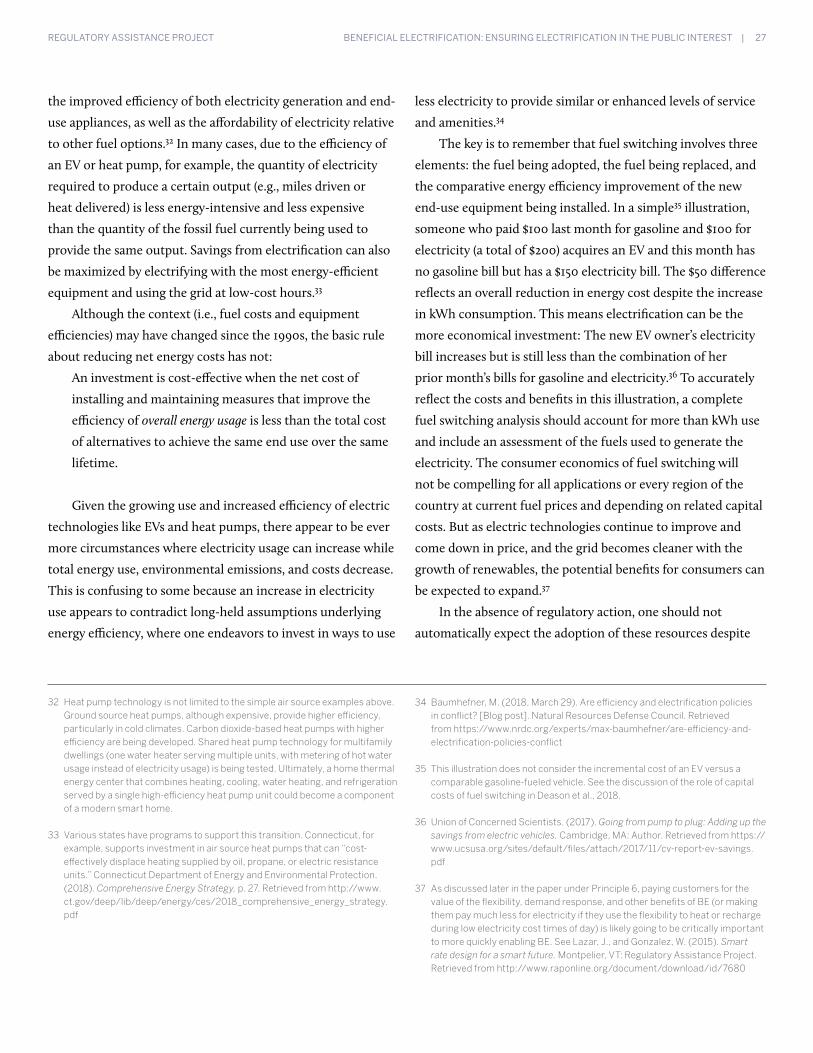
BENEFICIAL ELECTRIFICATION: ENSURING ELECTRIFICATION IN THE PUBLIC INTEREST | 27 REGULATORY ASSISTANCE PROJECT
the improved efficiency of both electricity generation and end-
use appliances, as well as the affordability of electricity relative
to other fuel options.32 In many cases, due to the efficiency of
an EV or heat pump, for example, the quantity of electricity
required to produce a certain output (e.g., miles driven or
heat delivered) is less energy-intensive and less expensive
than the quantity of the fossil fuel currently being used to
provide the same output. Savings from electrification can also
be maximized by electrifying with the most energy-efficient
equipment and using the grid at low-cost hours.33
Although the context (i.e., fuel costs and equipment
efficiencies) may have changed since the 1990s, the basic rule
about reducing net energy costs has not:
An investment is cost-effective when the net cost of
installing and maintaining measures that improve the
efficiency of overall energy usage is less than the total cost
of alternatives to achieve the same end use over the same
lifetime.
Given the growing use and increased efficiency of electric
technologies like EVs and heat pumps, there appear to be ever
more circumstances where electricity usage can increase while
total energy use, environmental emissions, and costs decrease.
This is confusing to some because an increase in electricity
use appears to contradict long-held assumptions underlying
energy efficiency, where one endeavors to invest in ways to use
less electricity to provide similar or enhanced levels of service
and amenities.34
The key is to remember that fuel switching involves three
elements: the fuel being adopted, the fuel being replaced, and
the comparative energy efficiency improvement of the new
end-use equipment being installed. In a simple35 illustration,
someone who paid $100 last month for gasoline and $100 for
electricity (a total of $200) acquires an EV and this month has
no gasoline bill but has a $150 electricity bill. The $50 difference
reflects an overall reduction in energy cost despite the increase
in kWh consumption. This means electrification can be the
more economical investment: The new EV owner’s electricity
bill increases but is still less than the combination of her
prior month’s bills for gasoline and electricity.36 To accurately
reflect the costs and benefits in this illustration, a complete
fuel switching analysis should account for more than kWh use
and include an assessment of the fuels used to generate the
electricity. The consumer economics of fuel switching will
not be compelling for all applications or every region of the
country at current fuel prices and depending on related capital
costs. But as electric technologies continue to improve and
come down in price, and the grid becomes cleaner with the
growth of renewables, the potential benefits for consumers can
be expected to expand.37
In the absence of regulatory action, one should not
automatically expect the adoption of these resources despite
32 Heat pump technology is not limited to the simple air source examples above. Ground source heat pumps, although expensive, provide higher efficiency, particularly in cold climates. Carbon dioxide-based heat pumps with higher efficiency are being developed. Shared heat pump technology for multifamily dwellings (one water heater serving multiple units, with metering of hot water usage instead of electricity usage) is being tested. Ultimately, a home thermal energy center that combines heating, cooling, water heating, and refrigeration served by a single high-efficiency heat pump unit could become a component of a modern smart home.
33 Various states have programs to support this transition. Connecticut, for example, supports investment in air source heat pumps that can “cost-effectively displace heating supplied by oil, propane, or electric resistance units.” Connecticut Department of Energy and Environmental Protection. (2018). Comprehensive Energy Strategy, p. 27. Retrieved from http://www.ct.gov/deep/lib/deep/energy/ces/2018_comprehensive_energy_strategy.pdf
34 Baumhefner, M. (2018, March 29). Are efficiency and electrification policies in conflict? [Blog post]. Natural Resources Defense Council. Retrieved from https://www.nrdc.org/experts/max-baumhefner/are-efficiency-and-electrification-policies-conflict
35 This illustration does not consider the incremental cost of an EV versus a comparable gasoline-fueled vehicle. See the discussion of the role of capital costs of fuel switching in Deason et al., 2018.
36 Union of Concerned Scientists. (2017). Going from pump to plug: Adding up the savings from electric vehicles. Cambridge, MA: Author. Retrieved from https://www.ucsusa.org/sites/default/files/attach/2017/11/cv-report-ev-savings.pdf
37 As discussed later in the paper under Principle 6, paying customers for the value of the flexibility, demand response, and other benefits of BE (or making them pay much less for electricity if they use the flexibility to heat or recharge during low electricity cost times of day) is likely going to be critically important to more quickly enabling BE. See Lazar, J., and Gonzalez, W. (2015). Smart rate design for a smart future. Montpelier, VT: Regulatory Assistance Project. Retrieved from http://www.raponline.org/document/download/id/7680

28 | BENEFICIAL ELECTRIFICATION: ENSURING ELECTRIFICATION IN THE PUBLIC INTEREST REGULATORY ASSISTANCE PROJECT
their being more efficient than traditional alter-
natives and thus offering the potential to save
consumers money, lower air emissions, and in-
crease grid flexibility. More meaningful metrics
are needed to overcome established barriers in
the way we currently measure and account for
energy efficiency. On the demand side, investments in efficient
solutions have traditionally encountered numerous market
barriers to individual action; on the supply side, industry
practices, business models, and regulatory practices have
tended to favor fossil fuel-based energy infrastructure and sales
over energy-saving technologies. Furthermore, even as capital
costs decrease, certain vulnerable populations still may not be
situated to take full advantage of these innovations. However,
as long as energy efficiency—in this example the adoption of
an EV and a fuel switch from gasoline to electricity—costs
less and delivers more value than investing in alternatives to
achieve the same end use over the same lifetime, it should be
the resource of choice.
As long as energy efficiency costs less and delivers more value than investing in alternatives to achieve the same end use over the same lifetime, it should be the resource of choice.
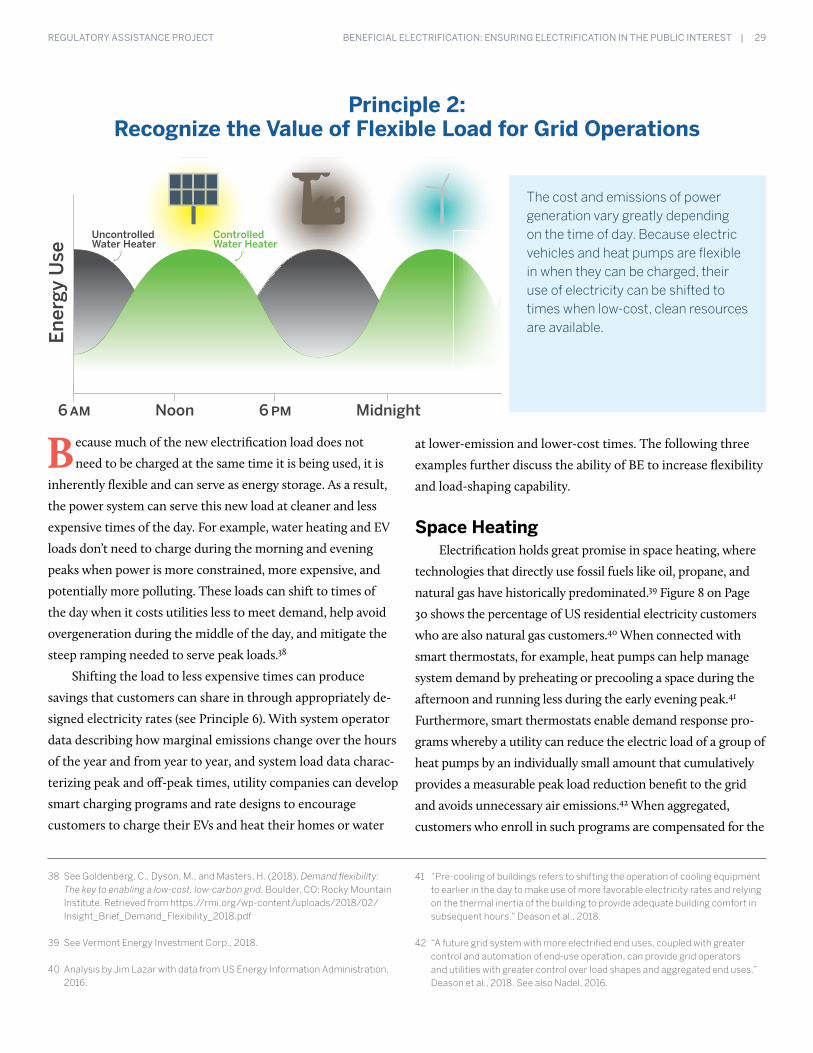
BENEFICIAL ELECTRIFICATION: ENSURING ELECTRIFICATION IN THE PUBLIC INTEREST | 29 REGULATORY ASSISTANCE PROJECT
38 See Goldenberg, C., Dyson, M., and Masters, H. (2018). Demand flexibility: The key to enabling a low-cost, low-carbon grid. Boulder, CO: Rocky Mountain Institute. Retrieved from https://rmi.org/wp-content/uploads/2018/02/Insight_Brief_Demand_Flexibility_2018.pdf
39 See Vermont Energy Investment Corp., 2018.
40 Analysis by Jim Lazar with data from US Energy Information Administration, 2016.
41 “Pre-cooling of buildings refers to shifting the operation of cooling equipment to earlier in the day to make use of more favorable electricity rates and relying on the thermal inertia of the building to provide adequate building comfort in subsequent hours.” Deason et al., 2018.
42 “A future grid system with more electrified end uses, coupled with greater control and automation of end-use operation, can provide grid operators and utilities with greater control over load shapes and aggregated end uses.” Deason et al., 2018. See also Nadel, 2016.
The cost and emissions of power generation vary greatly depending on the time of day. Because electric vehicles and heat pumps are flexible in when they can be charged, their use of electricity can be shifted to times when low-cost, clean resources are available.
Because much of the new electrification load does not
need to be charged at the same time it is being used, it is
inherently flexible and can serve as energy storage. As a result,
the power system can serve this new load at cleaner and less
expensive times of the day. For example, water heating and EV
loads don’t need to charge during the morning and evening
peaks when power is more constrained, more expensive, and
potentially more polluting. These loads can shift to times of
the day when it costs utilities less to meet demand, help avoid
overgeneration during the middle of the day, and mitigate the
steep ramping needed to serve peak loads.38
Shifting the load to less expensive times can produce
savings that customers can share in through appropriately de-
signed electricity rates (see Principle 6). With system operator
data describing how marginal emissions change over the hours
of the year and from year to year, and system load data charac-
terizing peak and off-peak times, utility companies can develop
smart charging programs and rate designs to encourage
customers to charge their EVs and heat their homes or water
at lower-emission and lower-cost times. The following three
examples further discuss the ability of BE to increase flexibility
and load-shaping capability.
Space HeatingElectrification holds great promise in space heating, where
technologies that directly use fossil fuels like oil, propane, and
natural gas have historically predominated.39 Figure 8 on Page
30 shows the percentage of US residential electricity customers
who are also natural gas customers.40 When connected with
smart thermostats, for example, heat pumps can help manage
system demand by preheating or precooling a space during the
afternoon and running less during the early evening peak.41
Furthermore, smart thermostats enable demand response pro-
grams whereby a utility can reduce the electric load of a group of
heat pumps by an individually small amount that cumulatively
provides a measurable peak load reduction benefit to the grid
and avoids unnecessary air emissions.42 When aggregated,
customers who enroll in such programs are compensated for the
Principle 2: Recognize the Value of Flexible Load for Grid Operations
Ener
gy U
se
6 AM 6 PM MidnightNoon
Uncontrolled Water Heater
Controlled Water Heater
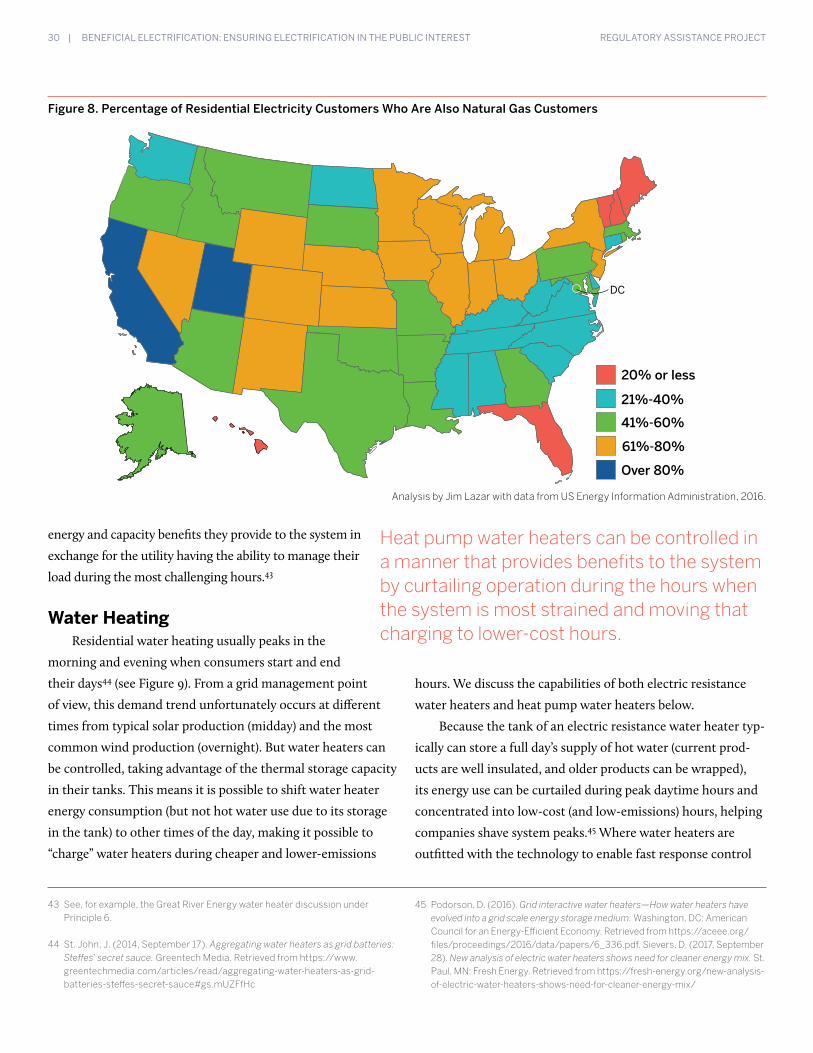
30 | BENEFICIAL ELECTRIFICATION: ENSURING ELECTRIFICATION IN THE PUBLIC INTEREST REGULATORY ASSISTANCE PROJECT
43 See, for example, the Great River Energy water heater discussion under Principle 6.
44 St. John, J. (2014, September 17). Aggregating water heaters as grid batteries: Steffes’ secret sauce. Greentech Media. Retrieved from https://www.greentechmedia.com/articles/read/aggregating-water-heaters-as-grid-batteries-steffes-secret-sauce#gs.mUZFfHc
45 Podorson, D. (2016). Grid interactive water heaters—How water heaters have evolved into a grid scale energy storage medium. Washington, DC: American Council for an Energy-Efficient Economy. Retrieved from https://aceee.org/files/proceedings/2016/data/papers/6_336.pdf. Sievers, D. (2017, September 28). New analysis of electric water heaters shows need for cleaner energy mix. St. Paul, MN: Fresh Energy. Retrieved from https://fresh-energy.org/new-analysis-of-electric-water-heaters-shows-need-for-cleaner-energy-mix/
energy and capacity benefits they provide to the system in
exchange for the utility having the ability to manage their
load during the most challenging hours.43
Water Heating Residential water heating usually peaks in the
morning and evening when consumers start and end
their days44 (see Figure 9). From a grid management point
of view, this demand trend unfortunately occurs at different
times from typical solar production (midday) and the most
common wind production (overnight). But water heaters can
be controlled, taking advantage of the thermal storage capacity
in their tanks. This means it is possible to shift water heater
energy consumption (but not hot water use due to its storage
in the tank) to other times of the day, making it possible to
“charge” water heaters during cheaper and lower-emissions
Figure 8. Percentage of Residential Electricity Customers Who Are Also Natural Gas Customers
hours. We discuss the capabilities of both electric resistance
water heaters and heat pump water heaters below.
Because the tank of an electric resistance water heater typ-
ically can store a full day’s supply of hot water (current prod-
ucts are well insulated, and older products can be wrapped),
its energy use can be curtailed during peak daytime hours and
concentrated into low-cost (and low-emissions) hours, helping
companies shave system peaks.45 Where water heaters are
outfitted with the technology to enable fast response control
20% or less
21%-40%
41%-60%
61%-80%
Over 80%
DC
Analysis by Jim Lazar with data from US Energy Information Administration, 2016.
Heat pump water heaters can be controlled in a manner that provides benefits to the system by curtailing operation during the hours when the system is most strained and moving that charging to lower-cost hours.
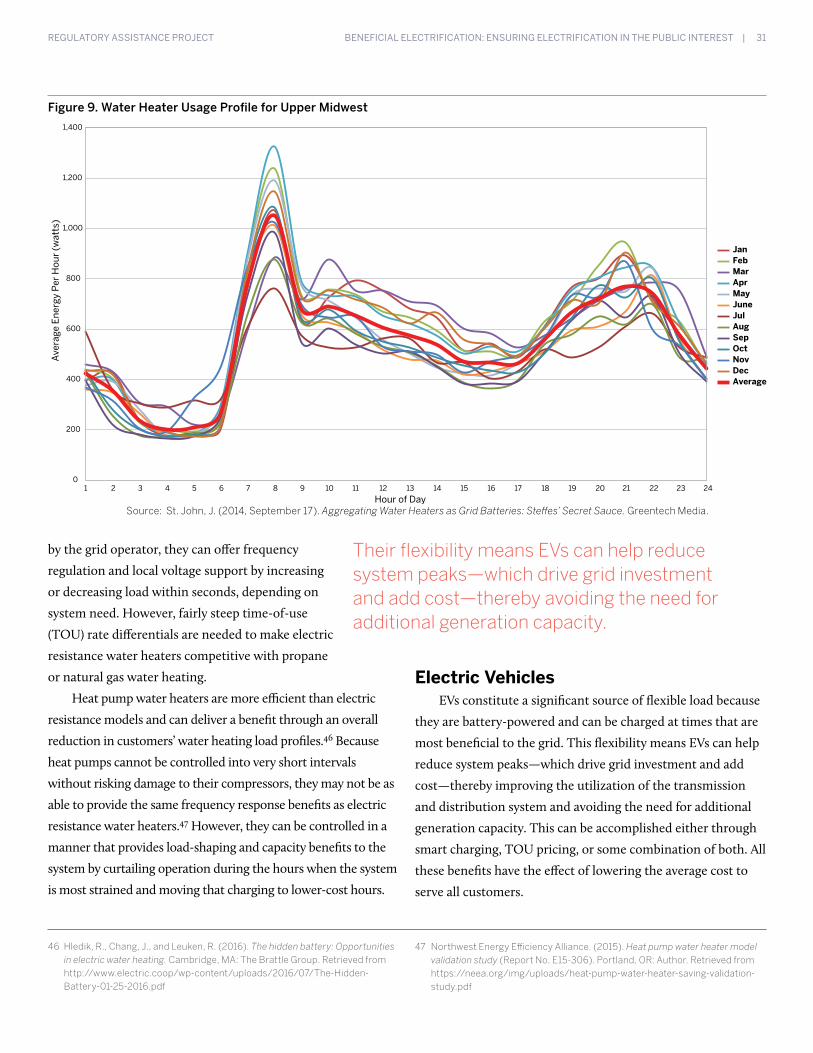
BENEFICIAL ELECTRIFICATION: ENSURING ELECTRIFICATION IN THE PUBLIC INTEREST | 31 REGULATORY ASSISTANCE PROJECT
46 Hledik, R., Chang, J., and Leuken, R. (2016). The hidden battery: Opportunities in electric water heating. Cambridge, MA: The Brattle Group. Retrieved from http://www.electric.coop/wp-content/uploads/2016/07/The-Hidden-Battery-01-25-2016.pdf
47 Northwest Energy Efficiency Alliance. (2015). Heat pump water heater model validation study (Report No. E15-306). Portland, OR: Author. Retrieved from https://neea.org/img/uploads/heat-pump-water-heater-saving-validation-study.pdf
by the grid operator, they can offer frequency
regulation and local voltage support by increasing
or decreasing load within seconds, depending on
system need. However, fairly steep time-of-use
(TOU) rate differentials are needed to make electric
resistance water heaters competitive with propane
or natural gas water heating.
Heat pump water heaters are more efficient than electric
resistance models and can deliver a benefit through an overall
reduction in customers’ water heating load profiles.46 Because
heat pumps cannot be controlled into very short intervals
without risking damage to their compressors, they may not be as
able to provide the same frequency response benefits as electric
resistance water heaters.47 However, they can be controlled in a
manner that provides load-shaping and capacity benefits to the
system by curtailing operation during the hours when the system
is most strained and moving that charging to lower-cost hours.
Source: St. John, J. (2014, September 17). Aggregating Water Heaters as Grid Batteries: Steffes’ Secret Sauce. Greentech Media.
Figure 9. Water Heater Usage Profile for Upper Midwest
0
200
400
600
800
1,000
1,200
1,400
1 2 3 4 5 6 7 8 9 10 11 12 13 14 15 16 17 18 19 20 21 22 23 24
Ave
rage
Ene
rgy
Per
Hou
r (w
atts
)
Hour of Day
JanFebMarAprMayJuneJulAugSepOctNovDecAverage
Electric Vehicles EVs constitute a significant source of flexible load because
they are battery-powered and can be charged at times that are
most beneficial to the grid. This flexibility means EVs can help
reduce system peaks—which drive grid investment and add
cost—thereby improving the utilization of the transmission
and distribution system and avoiding the need for additional
generation capacity. This can be accomplished either through
smart charging, TOU pricing, or some combination of both. All
these benefits have the effect of lowering the average cost to
serve all customers.
Their flexibility means EVs can help reduce system peaks—which drive grid investment and add cost—thereby avoiding the need for additional generation capacity.
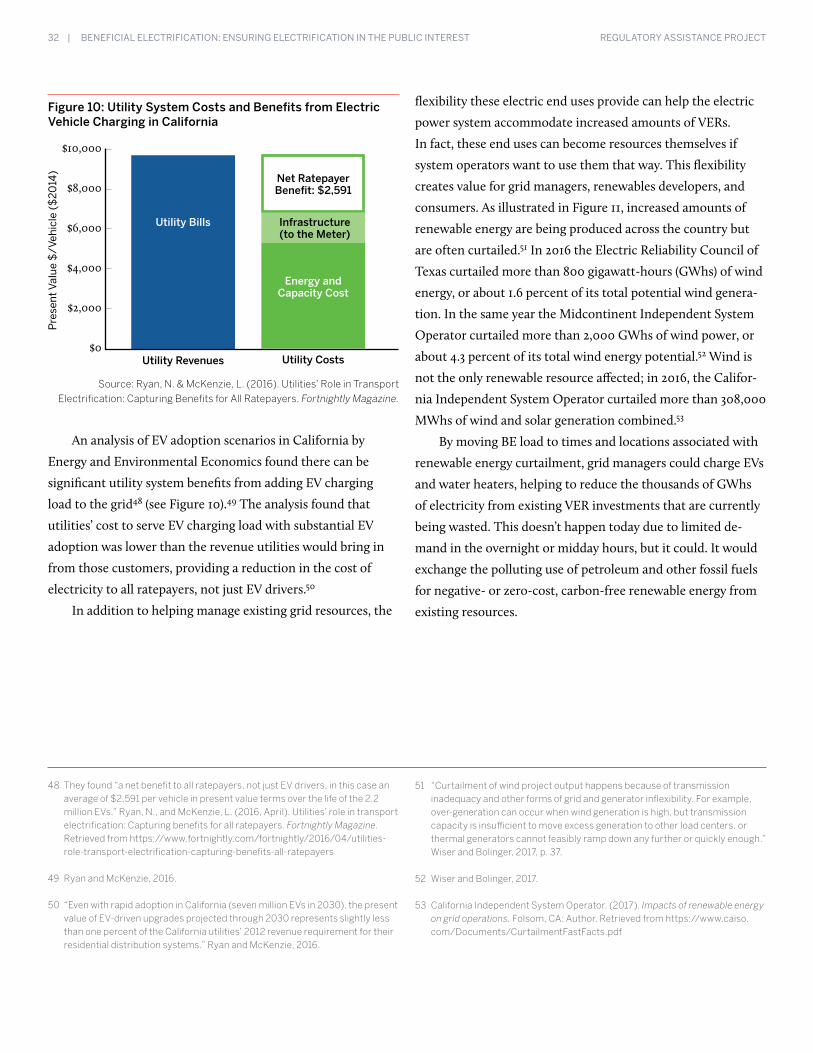
32 | BENEFICIAL ELECTRIFICATION: ENSURING ELECTRIFICATION IN THE PUBLIC INTEREST REGULATORY ASSISTANCE PROJECT
48 They found “a net benefit to all ratepayers, not just EV drivers, in this case an average of $2,591 per vehicle in present value terms over the life of the 2.2 million EVs.” Ryan, N., and McKenzie, L. (2016, April). Utilities’ role in transport electrification: Capturing benefits for all ratepayers. Fortnightly Magazine. Retrieved from https://www.fortnightly.com/fortnightly/2016/04/utilities-role-transport-electrification-capturing-benefits-all-ratepayers
49 Ryan and McKenzie, 2016.
50 “Even with rapid adoption in California (seven million EVs in 2030), the present value of EV-driven upgrades projected through 2030 represents slightly less than one percent of the California utilities’ 2012 revenue requirement for their residential distribution systems.” Ryan and McKenzie, 2016.
51 “Curtailment of wind project output happens because of transmission inadequacy and other forms of grid and generator inflexibility. For example, over-generation can occur when wind generation is high, but transmission capacity is insufficient to move excess generation to other load centers, or thermal generators cannot feasibly ramp down any further or quickly enough.” Wiser and Bolinger, 2017, p. 37.
52 Wiser and Bolinger, 2017.
53 California Independent System Operator. (2017). Impacts of renewable energy on grid operations. Folsom, CA: Author. Retrieved from https://www.caiso.com/Documents/CurtailmentFastFacts.pdf
$10,000
$8,000
$6,000
$4,000
$2,000
$0
Pre
sent
Val
ue $
/Veh
icle
($
2014
)
Figure 10: Utility System Costs and Benefits from Electric Vehicle Charging in California
Utility Bills
Energy and Capacity Cost
Net Ratepayer Benefit: $2,591
Utility Revenues Utility Costs
Infrastructure(to the Meter)
Source: Ryan, N. & McKenzie, L. (2016). Utilities’ Role in Transport Electrification: Capturing Benefits for All Ratepayers. Fortnightly Magazine.
flexibility these electric end uses provide can help the electric
power system accommodate increased amounts of VERs.
In fact, these end uses can become resources themselves if
system operators want to use them that way. This flexibility
creates value for grid managers, renewables developers, and
consumers. As illustrated in Figure 11, increased amounts of
renewable energy are being produced across the country but
are often curtailed.51 In 2016 the Electric Reliability Council of
Texas curtailed more than 800 gigawatt-hours (GWhs) of wind
energy, or about 1.6 percent of its total potential wind genera-
tion. In the same year the Midcontinent Independent System
Operator curtailed more than 2,000 GWhs of wind power, or
about 4.3 percent of its total wind energy potential.52 Wind is
not the only renewable resource affected; in 2016, the Califor-
nia Independent System Operator curtailed more than 308,000
MWhs of wind and solar generation combined.53
By moving BE load to times and locations associated with
renewable energy curtailment, grid managers could charge EVs
and water heaters, helping to reduce the thousands of GWhs
of electricity from existing VER investments that are currently
being wasted. This doesn’t happen today due to limited de-
mand in the overnight or midday hours, but it could. It would
exchange the polluting use of petroleum and other fossil fuels
for negative- or zero-cost, carbon-free renewable energy from
existing resources.
An analysis of EV adoption scenarios in California by
Energy and Environmental Economics found there can be
significant utility system benefits from adding EV charging
load to the grid48 (see Figure 10).49 The analysis found that
utilities’ cost to serve EV charging load with substantial EV
adoption was lower than the revenue utilities would bring in
from those customers, providing a reduction in the cost of
electricity to all ratepayers, not just EV drivers.50
In addition to helping manage existing grid resources, the
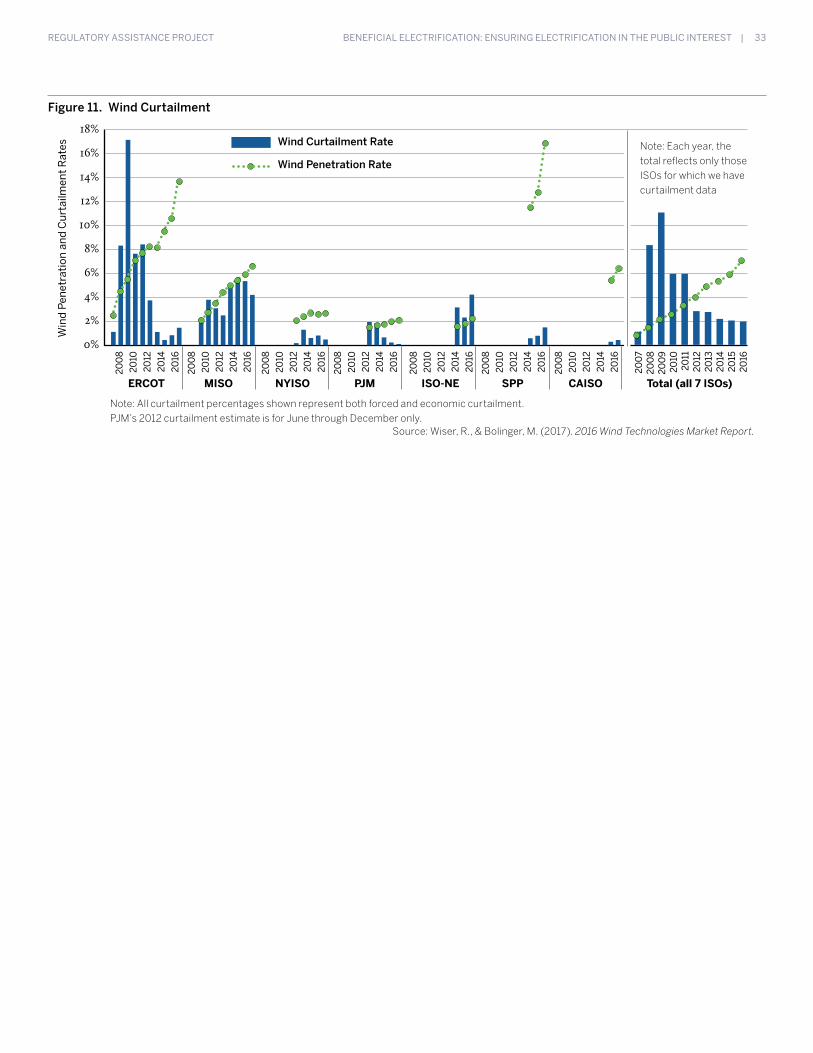
BENEFICIAL ELECTRIFICATION: ENSURING ELECTRIFICATION IN THE PUBLIC INTEREST | 33 REGULATORY ASSISTANCE PROJECT
Wind Curtailment Rate
Wind Penetration Rate
Figure 11. Wind Curtailment
18%
16%
14%
12%
10%
8%
6%
4%
2%
0%
Win
d Pe
netr
atio
n an
d C
urta
ilmen
t R
ates
200
820
1020
1220
1420
16
200
820
1020
1220
1420
16
200
820
1020
1220
1420
16
200
820
1020
1220
1420
16
200
820
1020
1220
1420
16
200
820
1020
1220
1420
16
200
820
1020
1220
1420
16
200
720
08
200
920
1020
1120
1220
1320
1420
1520
16
ERCOT NYISO ISO-NEMISO PJM SPP CAISO Total (all 7 ISOs)
Note: Each year, the total reflects only those ISOs for which we have curtailment data
Note: All curtailment percentages shown represent both forced and economic curtailment. PJM’s 2012 curtailment estimate is for June through December only.
Source: Wiser, R., & Bolinger, M. (2017). 2016 Wind Technologies Market Report.
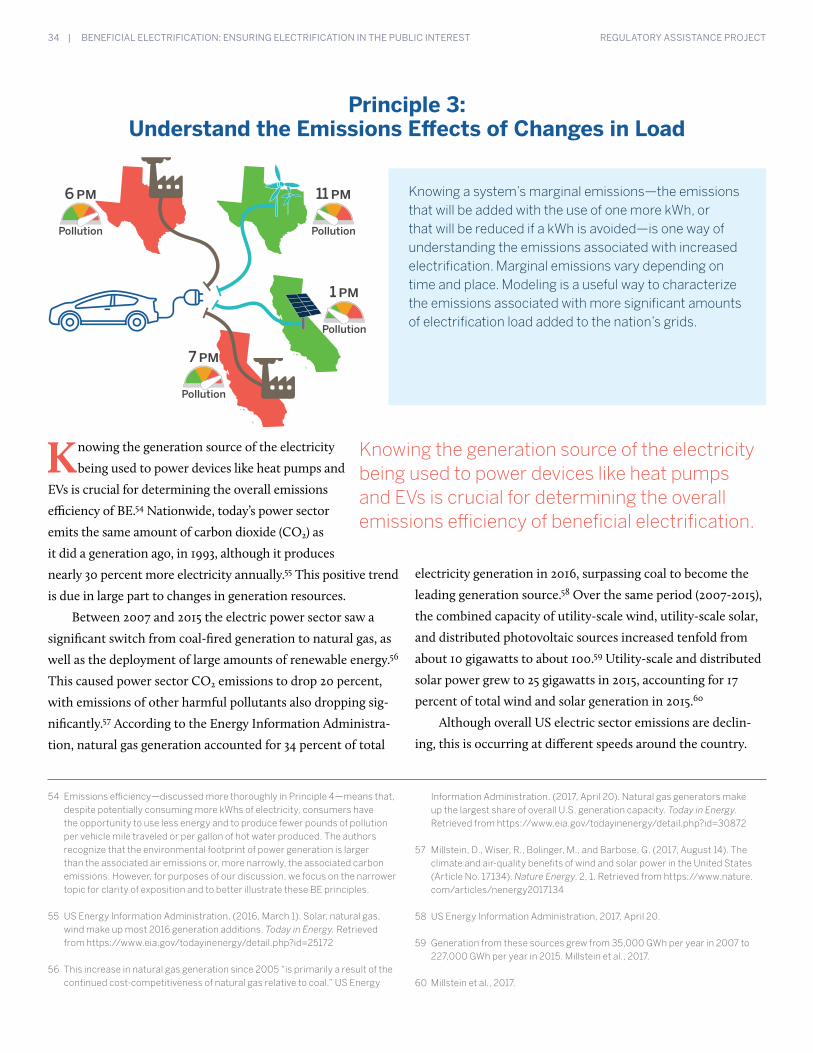
34 | BENEFICIAL ELECTRIFICATION: ENSURING ELECTRIFICATION IN THE PUBLIC INTEREST REGULATORY ASSISTANCE PROJECT
54 Emissions efficiency—discussed more thoroughly in Principle 4—means that, despite potentially consuming more kWhs of electricity, consumers have the opportunity to use less energy and to produce fewer pounds of pollution per vehicle mile traveled or per gallon of hot water produced. The authors recognize that the environmental footprint of power generation is larger than the associated air emissions or, more narrowly, the associated carbon emissions. However, for purposes of our discussion, we focus on the narrower topic for clarity of exposition and to better illustrate these BE principles.
55 US Energy Information Administration. (2016, March 1). Solar, natural gas, wind make up most 2016 generation additions. Today in Energy. Retrieved from https://www.eia.gov/todayinenergy/detail.php?id=25172
56 This increase in natural gas generation since 2005 “is primarily a result of the continued cost-competitiveness of natural gas relative to coal.” US Energy
Information Administration. (2017, April 20). Natural gas generators make up the largest share of overall U.S. generation capacity. Today in Energy. Retrieved from https://www.eia.gov/todayinenergy/detail.php?id=30872
57 Millstein, D., Wiser, R., Bolinger, M., and Barbose, G. (2017, August 14). The climate and air-quality benefits of wind and solar power in the United States (Article No. 17134). Nature Energy, 2, 1. Retrieved from https://www.nature.com/articles/nenergy2017134
58 US Energy Information Administration, 2017, April 20.
59 Generation from these sources grew from 35,000 GWh per year in 2007 to 227,000 GWh per year in 2015. Millstein et al., 2017.
60 Millstein et al., 2017.
Knowing a system’s marginal emissions—the emissions that will be added with the use of one more kWh, or that will be reduced if a kWh is avoided—is one way of understanding the emissions associated with increased electrification. Marginal emissions vary depending on time and place. Modeling is a useful way to characterize the emissions associated with more significant amounts of electrification load added to the nation’s grids.
Knowing the generation source of the electricity
being used to power devices like heat pumps and
EVs is crucial for determining the overall emissions
efficiency of BE.54 Nationwide, today’s power sector
emits the same amount of carbon dioxide (CO2) as
it did a generation ago, in 1993, although it produces
nearly 30 percent more electricity annually.55 This positive trend
is due in large part to changes in generation resources.
Between 2007 and 2015 the electric power sector saw a
significant switch from coal-fired generation to natural gas, as
well as the deployment of large amounts of renewable energy.56
This caused power sector CO2 emissions to drop 20 percent,
with emissions of other harmful pollutants also dropping sig-
nificantly.57 According to the Energy Information Administra-
tion, natural gas generation accounted for 34 percent of total
electricity generation in 2016, surpassing coal to become the
leading generation source.58 Over the same period (2007-2015),
the combined capacity of utility-scale wind, utility-scale solar,
and distributed photovoltaic sources increased tenfold from
about 10 gigawatts to about 100.59 Utility-scale and distributed
solar power grew to 25 gigawatts in 2015, accounting for 17
percent of total wind and solar generation in 2015.60
Although overall US electric sector emissions are declin-
ing, this is occurring at different speeds around the country.
Knowing the generation source of the electricitybeing used to power devices like heat pumps and EVs is crucial for determining the overall emissions efficiency of beneficial electrification.
Principle 3: Understand the Emissions Effects of Changes in Load
7 PM
Pollution
11 PM
Pollution
1 PM
Pollution
6 PM
Pollution
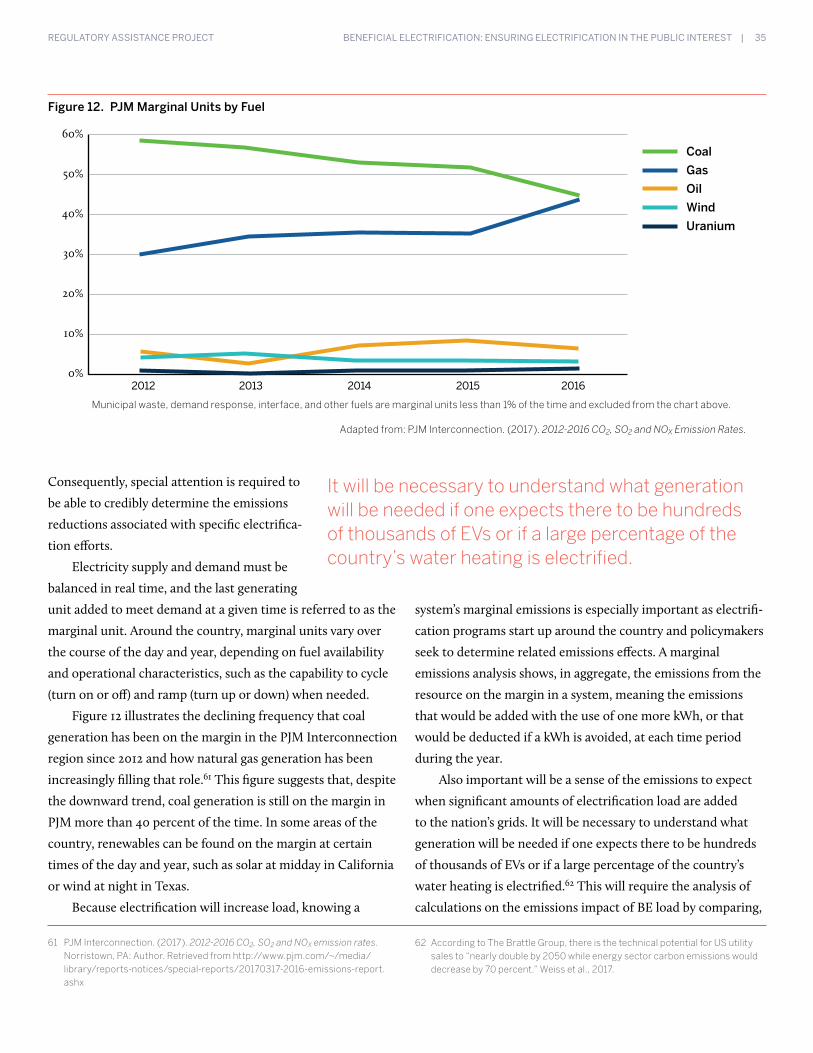
BENEFICIAL ELECTRIFICATION: ENSURING ELECTRIFICATION IN THE PUBLIC INTEREST | 35 REGULATORY ASSISTANCE PROJECT
61 PJM Interconnection. (2017). 2012-2016 CO2, SO2 and NOX emission rates. Norristown, PA: Author. Retrieved from http://www.pjm.com/~/media/library/reports-notices/special-reports/20170317-2016-emissions-report.ashx
62 According to The Brattle Group, there is the technical potential for US utility sales to “nearly double by 2050 while energy sector carbon emissions would decrease by 70 percent.” Weiss et al., 2017.
Figure 12. PJM Marginal Units by Fuel
60%
50%
40%
30%
20%
10%
0%
CoalGasOilWindUranium
Adapted from: PJM Interconnection. (2017). 2012-2016 CO2, SO2 and NOX Emission Rates.
2012 2013 2014 2015 2016
Consequently, special attention is required to
be able to credibly determine the emissions
reductions associated with specific electrifica-
tion efforts.
Electricity supply and demand must be
balanced in real time, and the last generating
unit added to meet demand at a given time is referred to as the
marginal unit. Around the country, marginal units vary over
the course of the day and year, depending on fuel availability
and operational characteristics, such as the capability to cycle
(turn on or off) and ramp (turn up or down) when needed.
Figure 12 illustrates the declining frequency that coal
generation has been on the margin in the PJM Interconnection
region since 2012 and how natural gas generation has been
increasingly filling that role.61 This figure suggests that, despite
the downward trend, coal generation is still on the margin in
PJM more than 40 percent of the time. In some areas of the
country, renewables can be found on the margin at certain
times of the day and year, such as solar at midday in California
or wind at night in Texas.
Because electrification will increase load, knowing a
system’s marginal emissions is especially important as electrifi-
cation programs start up around the country and policymakers
seek to determine related emissions effects. A marginal
emissions analysis shows, in aggregate, the emissions from the
resource on the margin in a system, meaning the emissions
that would be added with the use of one more kWh, or that
would be deducted if a kWh is avoided, at each time period
during the year.
Also important will be a sense of the emissions to expect
when significant amounts of electrification load are added
to the nation’s grids. It will be necessary to understand what
generation will be needed if one expects there to be hundreds
of thousands of EVs or if a large percentage of the country’s
water heating is electrified.62 This will require the analysis of
calculations on the emissions impact of BE load by comparing,
It will be necessary to understand what generation will be needed if one expects there to be hundredsof thousands of EVs or if a large percentage of the country’s water heating is electrified.
Municipal waste, demand response, interface, and other fuels are marginal units less than 1% of the time and excluded from the chart above.

36 | BENEFICIAL ELECTRIFICATION: ENSURING ELECTRIFICATION IN THE PUBLIC INTEREST REGULATORY ASSISTANCE PROJECT
63 See the Appendix.
over the long term, business-as-usual generation and expected
generation with BE policies in place.
If states pursue policies and programs that increase
electric sales, most of that added load may eventually be served
by some combination of capacity that has a very different
emissions profile than the marginal unit at each hour of the
day in any given power grid. Although gas may frequently be
on the margin for decades to help balance a system, it may be
a relatively small amount and therefore shouldn’t necessarily
be used as the basis for determining emissions attributed to
BE load over the coming decades. Capacity expansion mod-
eling will be a useful way to capture the expected changes to
generation resources due to large changes in electricity load
from electrification.63 It will be useful in answering the ques-
tion: What is the least-cost and highest-value mix of resources
over the time horizons chosen?
The average emissions from the US electricity grid have
decreased in recent decades, reflecting how successful the
nation has been in reducing overall power plant emissions. But
because electrification will add load, it is important to be able
to account for the emissions from the generating resources
that will serve that load. The Appendix looks further at several
approaches touched upon here that states can use for deter-
mining relevant emissions and ensuring BE.
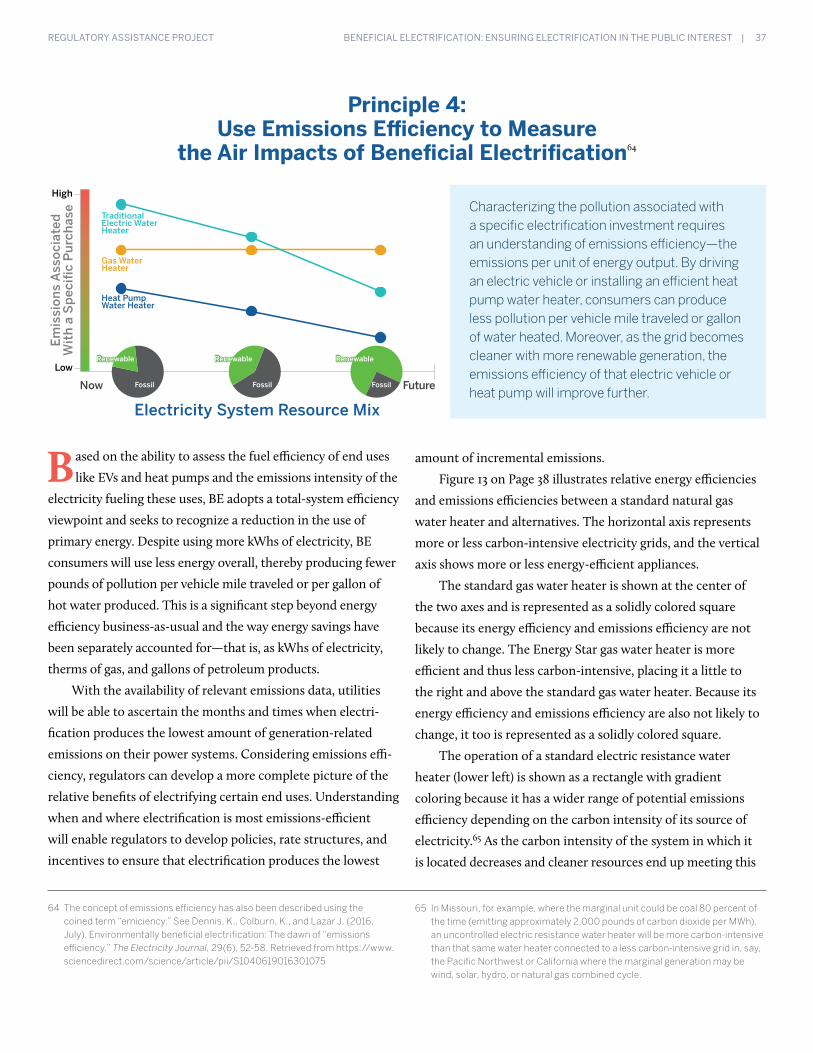
BENEFICIAL ELECTRIFICATION: ENSURING ELECTRIFICATION IN THE PUBLIC INTEREST | 37 REGULATORY ASSISTANCE PROJECT
64 The concept of emissions efficiency has also been described using the coined term “emiciency.” See Dennis, K., Colburn, K., and Lazar J. (2016, July). Environmentally beneficial electrification: The dawn of “emissions efficiency.” The Electricity Journal, 29(6), 52-58. Retrieved from https://www.sciencedirect.com/science/article/pii/S1040619016301075
65 In Missouri, for example, where the marginal unit could be coal 80 percent of the time (emitting approximately 2,000 pounds of carbon dioxide per MWh), an uncontrolled electric resistance water heater will be more carbon-intensive than that same water heater connected to a less carbon-intensive grid in, say, the Pacific Northwest or California where the marginal generation may be wind, solar, hydro, or natural gas combined cycle.
Characterizing the pollution associated with a specific electrification investment requires an understanding of emissions efficiency—the emissions per unit of energy output. By driving an electric vehicle or installing an efficient heat pump water heater, consumers can produce less pollution per vehicle mile traveled or gallon of water heated. Moreover, as the grid becomes cleaner with more renewable generation, the emissions efficiency of that electric vehicle or heat pump will improve further.
Based on the ability to assess the fuel efficiency of end uses
like EVs and heat pumps and the emissions intensity of the
electricity fueling these uses, BE adopts a total-system efficiency
viewpoint and seeks to recognize a reduction in the use of
primary energy. Despite using more kWhs of electricity, BE
consumers will use less energy overall, thereby producing fewer
pounds of pollution per vehicle mile traveled or per gallon of
hot water produced. This is a significant step beyond energy
efficiency business-as-usual and the way energy savings have
been separately accounted for—that is, as kWhs of electricity,
therms of gas, and gallons of petroleum products.
With the availability of relevant emissions data, utilities
will be able to ascertain the months and times when electri-
fication produces the lowest amount of generation-related
emissions on their power systems. Considering emissions effi-
ciency, regulators can develop a more complete picture of the
relative benefits of electrifying certain end uses. Understanding
when and where electrification is most emissions-efficient
will enable regulators to develop policies, rate structures, and
incentives to ensure that electrification produces the lowest
amount of incremental emissions.
Figure 13 on Page 38 illustrates relative energy efficiencies
and emissions efficiencies between a standard natural gas
water heater and alternatives. The horizontal axis represents
more or less carbon-intensive electricity grids, and the vertical
axis shows more or less energy-efficient appliances.
The standard gas water heater is shown at the center of
the two axes and is represented as a solidly colored square
because its energy efficiency and emissions efficiency are not
likely to change. The Energy Star gas water heater is more
efficient and thus less carbon-intensive, placing it a little to
the right and above the standard gas water heater. Because its
energy efficiency and emissions efficiency are also not likely to
change, it too is represented as a solidly colored square.
The operation of a standard electric resistance water
heater (lower left) is shown as a rectangle with gradient
coloring because it has a wider range of potential emissions
efficiency depending on the carbon intensity of its source of
electricity.65 As the carbon intensity of the system in which it
is located decreases and cleaner resources end up meeting this
Principle 4: Use Emissions Efficiency to Measure
the Air Impacts of Beneficial Electrification64
High
Emis
sion
s A
ssoc
iate
d W
ith
a S
peci
�c
Pur
chas
e
Electricity System Resource Mix
Now Future
Low
TraditionalElectric WaterHeater
Heat Pump Water Heater
Gas Water Heater
Fossil Fossil Fossil
RenewableRenewable RenewableRenewable RenewableRenewable
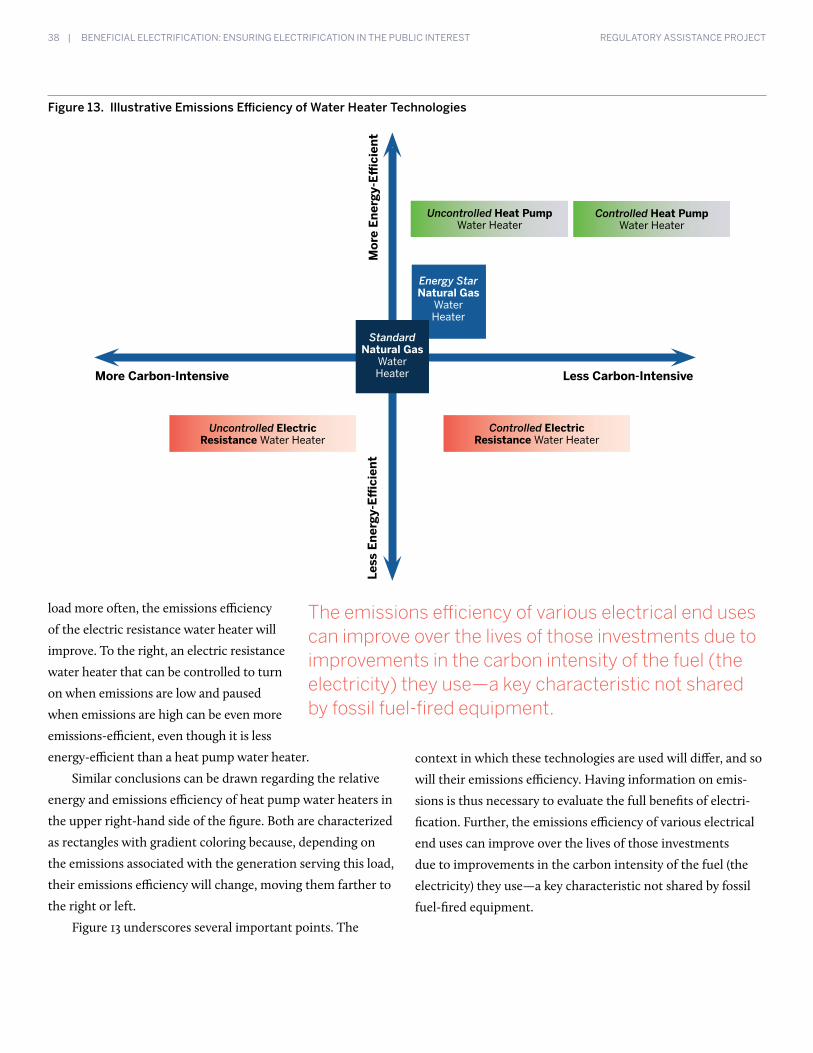
38 | BENEFICIAL ELECTRIFICATION: ENSURING ELECTRIFICATION IN THE PUBLIC INTEREST REGULATORY ASSISTANCE PROJECT
Energy Star Natural Gas
Water Heater
Figure 13. Illustrative Emissions Efficiency of Water Heater Technologies
Standard Natural Gas
Water Heater
Uncontrolled Heat Pump Water Heater
Uncontrolled Electric Resistance Water Heater
Controlled Electric Resistance Water Heater
Controlled Heat Pump Water Heater
More Carbon-Intensive Less Carbon-IntensiveM
ore
Ener
gy-E
ffici
ent
Less
Ene
rgy-
Effici
ent
load more often, the emissions efficiency
of the electric resistance water heater will
improve. To the right, an electric resistance
water heater that can be controlled to turn
on when emissions are low and paused
when emissions are high can be even more
emissions-efficient, even though it is less
energy-efficient than a heat pump water heater.
Similar conclusions can be drawn regarding the relative
energy and emissions efficiency of heat pump water heaters in
the upper right-hand side of the figure. Both are characterized
as rectangles with gradient coloring because, depending on
the emissions associated with the generation serving this load,
their emissions efficiency will change, moving them farther to
the right or left.
Figure 13 underscores several important points. The
context in which these technologies are used will differ, and so
will their emissions efficiency. Having information on emis-
sions is thus necessary to evaluate the full benefits of electri-
fication. Further, the emissions efficiency of various electrical
end uses can improve over the lives of those investments
due to improvements in the carbon intensity of the fuel (the
electricity) they use—a key characteristic not shared by fossil
fuel-fired equipment.
The emissions efficiency of various electrical end uses can improve over the lives of those investments due to improvements in the carbon intensity of the fuel (the electricity) they use—a key characteristic not shared by fossil fuel-fired equipment.
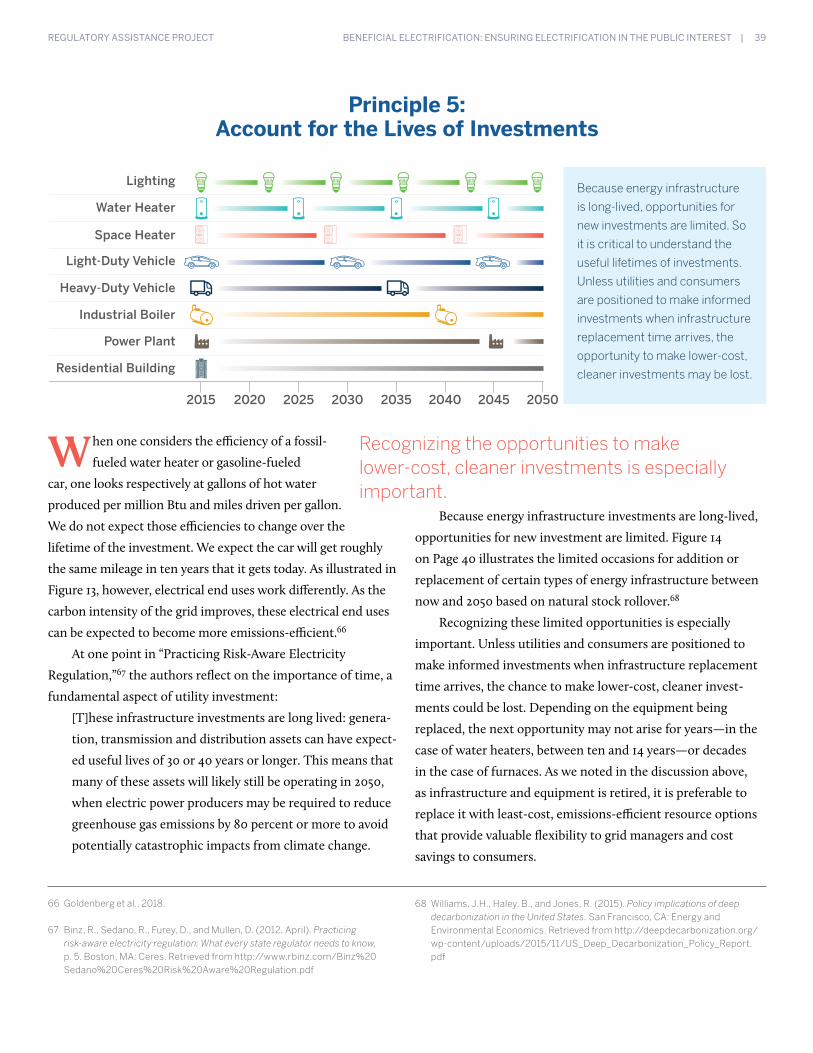
BENEFICIAL ELECTRIFICATION: ENSURING ELECTRIFICATION IN THE PUBLIC INTEREST | 39 REGULATORY ASSISTANCE PROJECT
66 Goldenberg et al., 2018.
67 Binz, R., Sedano, R., Furey, D., and Mullen, D. (2012, April). Practicing risk-aware electricity regulation: What every state regulator needs to know, p. 5. Boston, MA: Ceres. Retrieved from http://www.rbinz.com/Binz%20Sedano%20Ceres%20Risk%20Aware%20Regulation.pdf
68 Williams, J.H., Haley, B., and Jones, R. (2015). Policy implications of deep decarbonization in the United States. San Francisco, CA: Energy and Environmental Economics. Retrieved from http://deepdecarbonization.org/wp-content/uploads/2015/11/US_Deep_Decarbonization_Policy_Report.pdf
Because energy infrastructure
is long-lived, opportunities for
new investments are limited. So
it is critical to understand the
useful lifetimes of investments.
Unless utilities and consumers
are positioned to make informed
investments when infrastructure
replacement time arrives, the
opportunity to make lower-cost,
cleaner investments may be lost.
When one considers the efficiency of a fossil-
fueled water heater or gasoline-fueled
car, one looks respectively at gallons of hot water
produced per million Btu and miles driven per gallon.
We do not expect those efficiencies to change over the
lifetime of the investment. We expect the car will get roughly
the same mileage in ten years that it gets today. As illustrated in
Figure 13, however, electrical end uses work differently. As the
carbon intensity of the grid improves, these electrical end uses
can be expected to become more emissions-efficient.66
At one point in “Practicing Risk-Aware Electricity
Regulation,”67 the authors reflect on the importance of time, a
fundamental aspect of utility investment:
[T]hese infrastructure investments are long lived: genera-
tion, transmission and distribution assets can have expect-
ed useful lives of 30 or 40 years or longer. This means that
many of these assets will likely still be operating in 2050,
when electric power producers may be required to reduce
greenhouse gas emissions by 80 percent or more to avoid
potentially catastrophic impacts from climate change.
Because energy infrastructure investments are long-lived,
opportunities for new investment are limited. Figure 14
on Page 40 illustrates the limited occasions for addition or
replacement of certain types of energy infrastructure between
now and 2050 based on natural stock rollover.68
Recognizing these limited opportunities is especially
important. Unless utilities and consumers are positioned to
make informed investments when infrastructure replacement
time arrives, the chance to make lower-cost, cleaner invest-
ments could be lost. Depending on the equipment being
replaced, the next opportunity may not arise for years—in the
case of water heaters, between ten and 14 years—or decades
in the case of furnaces. As we noted in the discussion above,
as infrastructure and equipment is retired, it is preferable to
replace it with least-cost, emissions-efficient resource options
that provide valuable flexibility to grid managers and cost
savings to consumers.
Recognizing the opportunities to make lower-cost, cleaner investments is especially important.
Principle 5: Account for the Lives of Investments
2015 2020 2025 2030 2035 2040 2045 2050
Industrial Boiler
Heavy-Duty Vehicle
Water Heater
Lighting
Light-Duty Vehicle
Space Heater
Residential Building
Power Plant
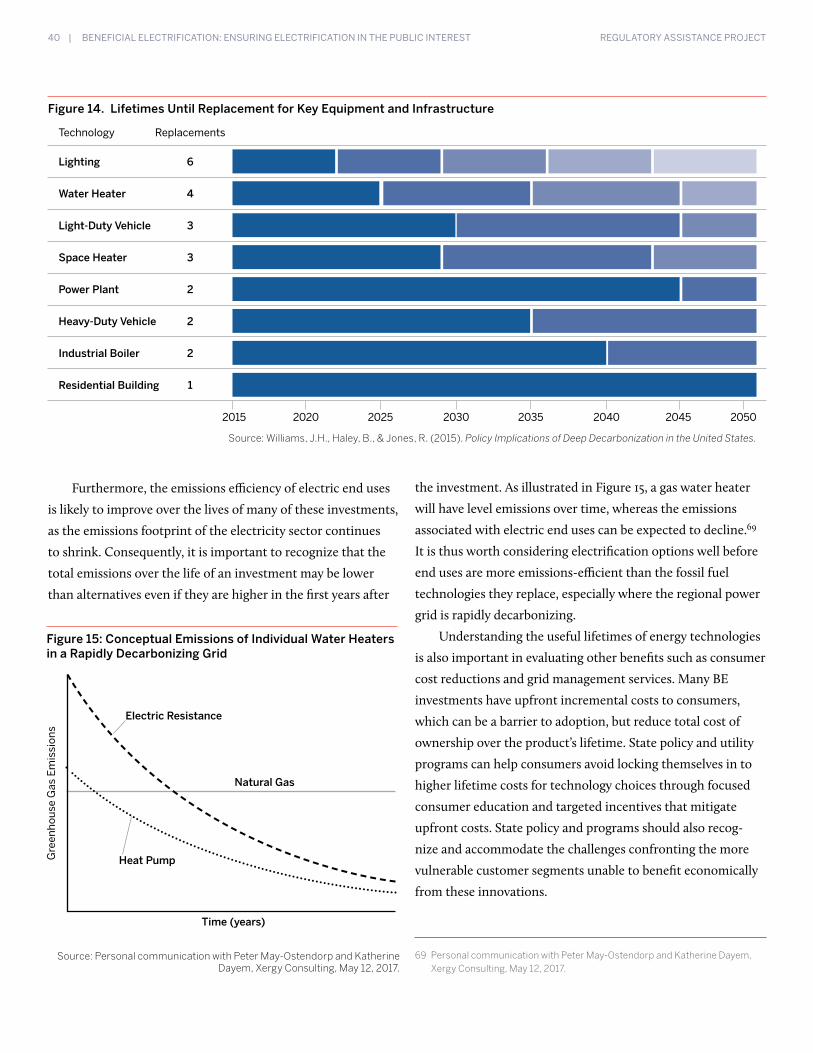
40 | BENEFICIAL ELECTRIFICATION: ENSURING ELECTRIFICATION IN THE PUBLIC INTEREST REGULATORY ASSISTANCE PROJECT
69 Personal communication with Peter May-Ostendorp and Katherine Dayem, Xergy Consulting, May 12, 2017.
Figure 14. Lifetimes Until Replacement for Key Equipment and Infrastructure
Technology Replacements
Lighting 6
Water Heater 4
Light-Duty Vehicle 3
Space Heater 3
Power Plant 2
Heavy-Duty Vehicle 2
Industrial Boiler 2
Residential Building 1
2015 2020 2025 2030 2035 2040 2045 2050
Source: Williams, J.H., Haley, B., & Jones, R. (2015). Policy Implications of Deep Decarbonization in the United States.
Furthermore, the emissions efficiency of electric end uses
is likely to improve over the lives of many of these investments,
as the emissions footprint of the electricity sector continues
to shrink. Consequently, it is important to recognize that the
total emissions over the life of an investment may be lower
than alternatives even if they are higher in the first years after
the investment. As illustrated in Figure 15, a gas water heater
will have level emissions over time, whereas the emissions
associated with electric end uses can be expected to decline.69
It is thus worth considering electrification options well before
end uses are more emissions-efficient than the fossil fuel
technologies they replace, especially where the regional power
grid is rapidly decarbonizing.
Understanding the useful lifetimes of energy technologies
is also important in evaluating other benefits such as consumer
cost reductions and grid management services. Many BE
investments have upfront incremental costs to consumers,
which can be a barrier to adoption, but reduce total cost of
ownership over the product’s lifetime. State policy and utility
programs can help consumers avoid locking themselves in to
higher lifetime costs for technology choices through focused
consumer education and targeted incentives that mitigate
upfront costs. State policy and programs should also recog-
nize and accommodate the challenges confronting the more
vulnerable customer segments unable to benefit economically
from these innovations.
Gre
enho
use
Gas
Em
issi
ons
Figure 15: Conceptual Emissions of Individual Water Heaters in a Rapidly Decarbonizing Grid
Natural Gas
Electric Resistance
Heat Pump
Time (years)
Source: Personal communication with Peter May-Ostendorp and Katherine Dayem, Xergy Consulting, May 12, 2017.
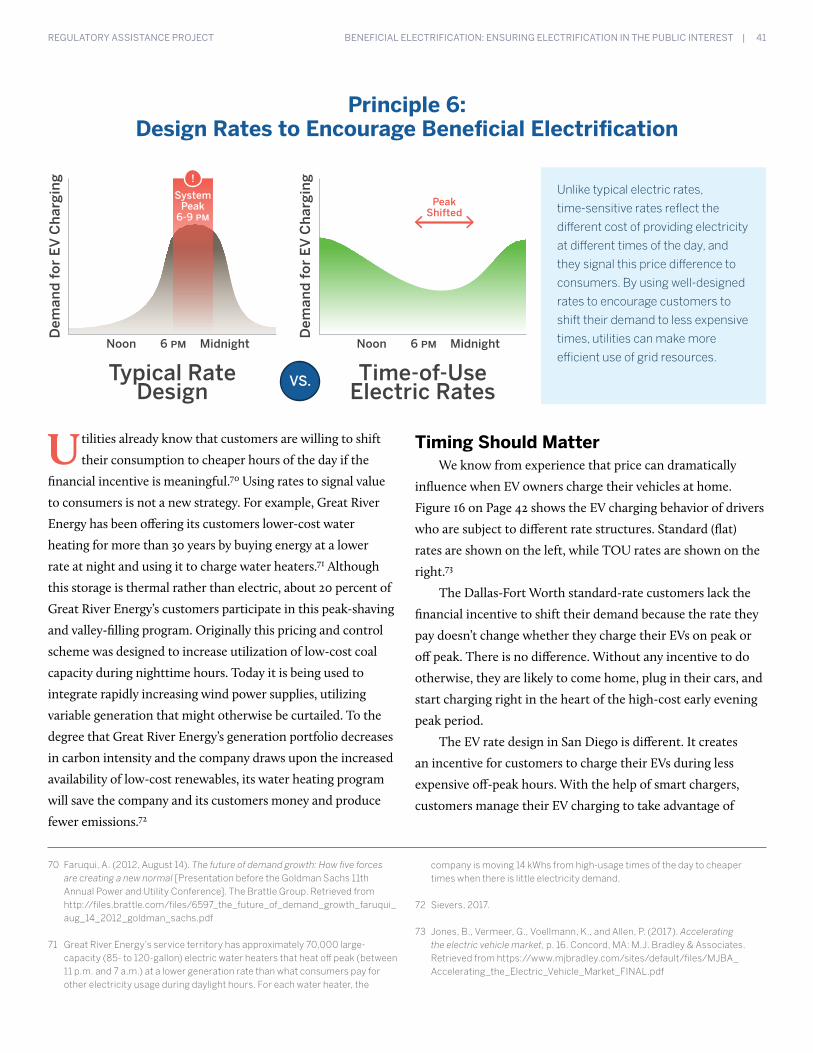
BENEFICIAL ELECTRIFICATION: ENSURING ELECTRIFICATION IN THE PUBLIC INTEREST | 41 REGULATORY ASSISTANCE PROJECT
Unlike typical electric rates,
time-sensitive rates reflect the
different cost of providing electricity
at different times of the day, and
they signal this price difference to
consumers. By using well-designed
rates to encourage customers to
shift their demand to less expensive
times, utilities can make more
efficient use of grid resources.
Utilities already know that customers are willing to shift
their consumption to cheaper hours of the day if the
financial incentive is meaningful.70 Using rates to signal value
to consumers is not a new strategy. For example, Great River
Energy has been offering its customers lower-cost water
heating for more than 30 years by buying energy at a lower
rate at night and using it to charge water heaters.71 Although
this storage is thermal rather than electric, about 20 percent of
Great River Energy’s customers participate in this peak-shaving
and valley-filling program. Originally this pricing and control
scheme was designed to increase utilization of low-cost coal
capacity during nighttime hours. Today it is being used to
integrate rapidly increasing wind power supplies, utilizing
variable generation that might otherwise be curtailed. To the
degree that Great River Energy’s generation portfolio decreases
in carbon intensity and the company draws upon the increased
availability of low-cost renewables, its water heating program
will save the company and its customers money and produce
fewer emissions.72
Timing Should MatterWe know from experience that price can dramatically
influence when EV owners charge their vehicles at home.
Figure 16 on Page 42 shows the EV charging behavior of drivers
who are subject to different rate structures. Standard (flat)
rates are shown on the left, while TOU rates are shown on the
right.73
The Dallas-Fort Worth standard-rate customers lack the
financial incentive to shift their demand because the rate they
pay doesn’t change whether they charge their EVs on peak or
off peak. There is no difference. Without any incentive to do
otherwise, they are likely to come home, plug in their cars, and
start charging right in the heart of the high-cost early evening
peak period.
The EV rate design in San Diego is different. It creates
an incentive for customers to charge their EVs during less
expensive off-peak hours. With the help of smart chargers,
customers manage their EV charging to take advantage of
70 Faruqui, A. (2012, August 14). The future of demand growth: How five forces are creating a new normal [Presentation before the Goldman Sachs 11th Annual Power and Utility Conference]. The Brattle Group. Retrieved from http://files.brattle.com/files/6597_the_future_of_demand_growth_faruqui_aug_14_2012_goldman_sachs.pdf
71 Great River Energy’s service territory has approximately 70,000 large-capacity (85- to 120-gallon) electric water heaters that heat off peak (between 11 p.m. and 7 a.m.) at a lower generation rate than what consumers pay for other electricity usage during daylight hours. For each water heater, the
company is moving 14 kWhs from high-usage times of the day to cheaper times when there is little electricity demand.
72 Sievers, 2017.
73 Jones, B., Vermeer, G., Voellmann, K., and Allen, P. (2017). Accelerating the electric vehicle market, p. 16. Concord, MA: M.J. Bradley & Associates. Retrieved from https://www.mjbradley.com/sites/default/files/MJBA_Accelerating_the_Electric_Vehicle_Market_FINAL.pdf
Principle 6: Design Rates to Encourage Beneficial Electrification
6 PM MidnightNoon
Dem
and
for
EV
Cha
rgin
g
Typical Rate Design
6 PM MidnightNoon
Dem
and
for
EV
Cha
rgin
g
Time-of-UseElectric Rates
System Peak
6-9 PM
VS.
!
Peak Shifted
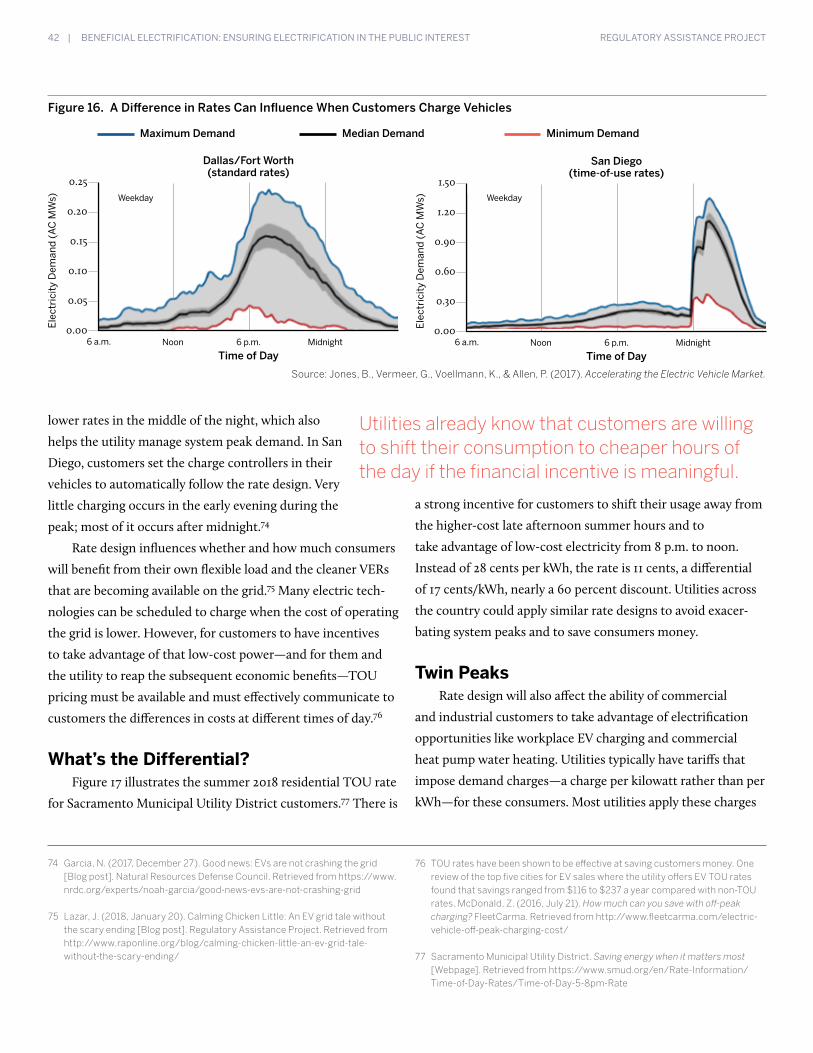
42 | BENEFICIAL ELECTRIFICATION: ENSURING ELECTRIFICATION IN THE PUBLIC INTEREST REGULATORY ASSISTANCE PROJECT
74 Garcia, N. (2017, December 27). Good news: EVs are not crashing the grid [Blog post]. Natural Resources Defense Council. Retrieved from https://www.nrdc.org/experts/noah-garcia/good-news-evs-are-not-crashing-grid
75 Lazar, J. (2018, January 20). Calming Chicken Little: An EV grid tale without the scary ending [Blog post]. Regulatory Assistance Project. Retrieved from http://www.raponline.org/blog/calming-chicken-little-an-ev-grid-tale-without-the-scary-ending/
76 TOU rates have been shown to be effective at saving customers money. One review of the top five cities for EV sales where the utility offers EV TOU rates found that savings ranged from $116 to $237 a year compared with non-TOU rates. McDonald, Z. (2016, July 21). How much can you save with off-peak charging? FleetCarma. Retrieved from http://www.fleetcarma.com/electric-vehicle-off-peak-charging-cost/
77 Sacramento Municipal Utility District. Saving energy when it matters most [Webpage]. Retrieved from https://www.smud.org/en/Rate-Information/Time-of-Day-Rates/Time-of-Day-5-8pm-Rate
Figure 16. A Difference in Rates Can Influence When Customers Charge Vehicles
0.25
0.20
0.15
0.10
0.05
0.00
1.50
1.20
0.90
0.60
0.30
0.006 a.m. 6 a.m.Noon Noon6 p.m. 6 p.m.Midnight Midnight
Ele
ctri
city
Dem
and
(AC
MW
s)
Ele
ctri
city
Dem
and
(AC
MW
s)
Time of Day Time of Day
Dallas/Fort Worth(standard rates)
Maximum Demand Median Demand Minimum Demand
San Diego(time-of-use rates)
Source: Jones, B., Vermeer, G., Voellmann, K., & Allen, P. (2017). Accelerating the Electric Vehicle Market.
Weekday Weekday
lower rates in the middle of the night, which also
helps the utility manage system peak demand. In San
Diego, customers set the charge controllers in their
vehicles to automatically follow the rate design. Very
little charging occurs in the early evening during the
peak; most of it occurs after midnight.74
Rate design influences whether and how much consumers
will benefit from their own flexible load and the cleaner VERs
that are becoming available on the grid.75 Many electric tech-
nologies can be scheduled to charge when the cost of operating
the grid is lower. However, for customers to have incentives
to take advantage of that low-cost power—and for them and
the utility to reap the subsequent economic benefits—TOU
pricing must be available and must effectively communicate to
customers the differences in costs at different times of day.76
What’s the Differential? Figure 17 illustrates the summer 2018 residential TOU rate
for Sacramento Municipal Utility District customers.77 There is
a strong incentive for customers to shift their usage away from
the higher-cost late afternoon summer hours and to
take advantage of low-cost electricity from 8 p.m. to noon.
Instead of 28 cents per kWh, the rate is 11 cents, a differential
of 17 cents/kWh, nearly a 60 percent discount. Utilities across
the country could apply similar rate designs to avoid exacer-
bating system peaks and to save consumers money.
Twin PeaksRate design will also affect the ability of commercial
and industrial customers to take advantage of electrification
opportunities like workplace EV charging and commercial
heat pump water heating. Utilities typically have tariffs that
impose demand charges—a charge per kilowatt rather than per
kWh—for these consumers. Most utilities apply these charges
Utilities already know that customers are willing to shift their consumption to cheaper hours of the day if the financial incentive is meaningful.
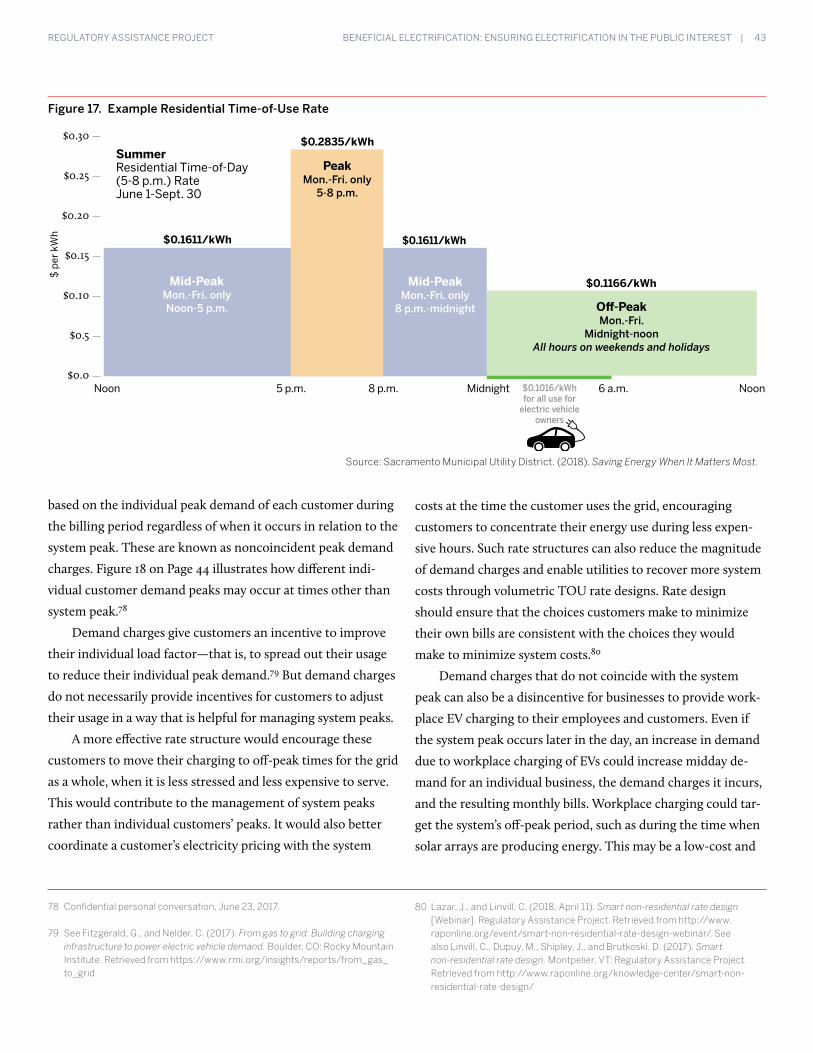
BENEFICIAL ELECTRIFICATION: ENSURING ELECTRIFICATION IN THE PUBLIC INTEREST | 43 REGULATORY ASSISTANCE PROJECT
Figure 17. Example Residential Time-of-Use Rate
$ p
er k
Wh
Source: Sacramento Municipal Utility District. (2018). Saving Energy When It Matters Most.
$0.30
$0.25
$0.20
$0.15
$0.10
$0.5
$0.0Noon 5 p.m. 8 p.m. Midnight 6 a.m. Noon
SummerResidential Time-of-Day (5-8 p.m.) RateJune 1-Sept. 30
$0.1611/kWh $0.1611/kWh
$0.1166/kWh
$0.2835/kWh
$0.1016/kWh for all use for
electric vehicle owners
PeakMon.-Fri. only
5-8 p.m.
Mid-PeakMon.-Fri. onlyNoon-5 p.m. Off-Peak
Mon.-Fri. Midnight-noon
All hours on weekends and holidays
Mid-PeakMon.-Fri. only
8 p.m.-midnight
based on the individual peak demand of each customer during
the billing period regardless of when it occurs in relation to the
system peak. These are known as noncoincident peak demand
charges. Figure 18 on Page 44 illustrates how different indi-
vidual customer demand peaks may occur at times other than
system peak.78
Demand charges give customers an incentive to improve
their individual load factor—that is, to spread out their usage
to reduce their individual peak demand.79 But demand charges
do not necessarily provide incentives for customers to adjust
their usage in a way that is helpful for managing system peaks.
A more effective rate structure would encourage these
customers to move their charging to off-peak times for the grid
as a whole, when it is less stressed and less expensive to serve.
This would contribute to the management of system peaks
rather than individual customers’ peaks. It would also better
coordinate a customer’s electricity pricing with the system
78 Confidential personal conversation, June 23, 2017.
79 See Fitzgerald, G., and Nelder, C. (2017). From gas to grid: Building charging infrastructure to power electric vehicle demand. Boulder, CO: Rocky Mountain Institute. Retrieved from https://www.rmi.org/insights/reports/from_gas_to_grid
80 Lazar, J., and Linvill, C. (2018, April 11). Smart non-residential rate design [Webinar]. Regulatory Assistance Project. Retrieved from http://www.raponline.org/event/smart-non-residential-rate-design-webinar/. See also Linvill, C., Dupuy, M., Shipley, J., and Brutkoski, D. (2017). Smart non-residential rate design. Montpelier, VT: Regulatory Assistance Project. Retrieved from http://www.raponline.org/knowledge-center/smart-non-residential-rate-design/
costs at the time the customer uses the grid, encouraging
customers to concentrate their energy use during less expen-
sive hours. Such rate structures can also reduce the magnitude
of demand charges and enable utilities to recover more system
costs through volumetric TOU rate designs. Rate design
should ensure that the choices customers make to minimize
their own bills are consistent with the choices they would
make to minimize system costs.80
Demand charges that do not coincide with the system
peak can also be a disincentive for businesses to provide work-
place EV charging to their employees and customers. Even if
the system peak occurs later in the day, an increase in demand
due to workplace charging of EVs could increase midday de-
mand for an individual business, the demand charges it incurs,
and the resulting monthly bills. Workplace charging could tar-
get the system’s off-peak period, such as during the time when
solar arrays are producing energy. This may be a low-cost and
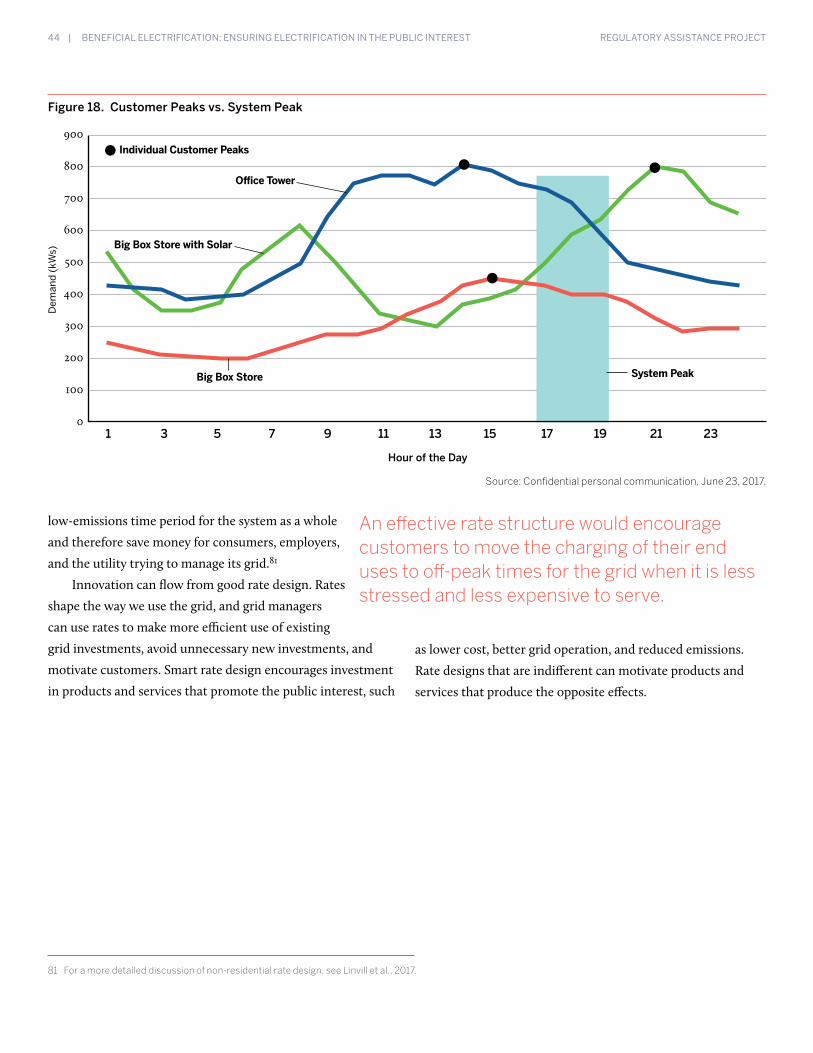
44 | BENEFICIAL ELECTRIFICATION: ENSURING ELECTRIFICATION IN THE PUBLIC INTEREST REGULATORY ASSISTANCE PROJECT
81 For a more detailed discussion of non-residential rate design, see Linvill et al., 2017.
low-emissions time period for the system as a whole
and therefore save money for consumers, employers,
and the utility trying to manage its grid.81
Innovation can flow from good rate design. Rates
shape the way we use the grid, and grid managers
can use rates to make more efficient use of existing
grid investments, avoid unnecessary new investments, and
motivate customers. Smart rate design encourages investment
in products and services that promote the public interest, such
An effective rate structure would encourage customers to move the charging of their end uses to off-peak times for the grid when it is less stressed and less expensive to serve.
as lower cost, better grid operation, and reduced emissions.
Rate designs that are indifferent can motivate products and
services that produce the opposite effects.
Dem
and
(kW
s)
Hour of the Day
Source: Confidential personal communication, June 23, 2017.
Big Box Store System Peak
Individual Customer Peaks
Big Box Store with Solar
Office Tower
Figure 18. Customer Peaks vs. System Peak
900
800
700
600
500
400
300
200
100
0 1 3 5 7 9 11 13 15 17 19 21 23
BENEFICIAL ELECTRIFICATION: ENSURING ELECTRIFICATION IN THE PUBLIC INTEREST | 45 REGULATORY ASSISTANCE PROJECT
Putting Beneficial Electrification Into ActionStates considering measures to encourage BE will be wise to first lay a solid foundation in policy and set out a process that invites wide participation.

46 | BENEFICIAL ELECTRIFICATION: ENSURING ELECTRIFICATION IN THE PUBLIC INTEREST REGULATORY ASSISTANCE PROJECT
In companion pieces to this paper, RAP will
examine in greater detail the operationalizing
of BE for specific technologies like EVs, heat
pumps, and heat pump water heaters. However,
before states undertake actual BE measures—such as
an EV charging proposal or a heat pump rebate program—they
may wish to consider other important elements, including
policy prerequisites and process designs.
Lay the Foundation in Policy
Develop GoalsThe first step in developing any effective policy is to
articulate why it is being created. A BE policy should be no
different. BE may be a worthy goal in and of itself, but states
adopting BE steps may have additional policy objectives that
could be affected or could inform how the state interprets
BE.82 Related goals might include saving consumers money,
avoiding greenhouse gas emissions, ensuring greater equity
in access to transportation resources, encouraging innovation
and job creation, and making power grids more flexible and
capable of accommodating greater amounts of VERs. Different
states often have distinctly different goals. States will benefit
from first defining and then prioritizing goals before making
decisions about specific BE implementation efforts.
Identify Barriers It is important for policymakers, regulators, and utilities
to address how new policy initiatives and legacy frameworks
States will benefit from first defining and then prioritizing goals before making decisions about specific BE implementation efforts.
dovetail and create mixed signals, if not perverse incentives,
that complicate expeditious and economically efficient utility
and private investment.83 For example, a state’s energy efficien-
cy standard may require reductions in kWhs only, rather than
recognizing overall energy savings.84 Without modification,
such policies could inhibit the ability to develop and achieve
BE energy goals and savings.
Traditional utility regulation could also constitute a
barrier to achieving electrification goals. Regulators interested
in encouraging utilities to recognize the emissions efficiency of
their investments may need to revisit ingrained assumptions
behind traditional cost-of-service regulation, where utilities
earn a rate of return on rate base. This gives utilities incentives
to invest in additional infrastructure to increase their profit,
even when less capital-intensive options are available to meet
customer needs.
Cost-of-service regulation also motivates utilities to
increase sales and resist any measures that might reduce
them—a fundamental incentive that is often at odds with the
public interest and particularly the acquisition of resources
with the lowest social costs.85 In the absence of measures to
mitigate it, this so-called throughput incentive may lead to
a real or perceived belief that utility electrification proposals
are self-serving and not in the interest of ratepayers.86 Utility
82 See the Appendix.
83 Correspondence with Noel Crisostomo, California Energy Commission. See also California Energy Commission. (2017). 2017 integrated energy policy report (Publication No. CEC-100-2017-001-CMF), pp. 78-79. Sacramento, CA: Author. Retrieved from http://www.energy.ca.gov/2017_energypolicy/
84 See, for example, Energy Star. The difference between source and site energy [Webpage]. Retrieved from https://www.energystar.gov/buildings/facility-owners-and-managers/existing-buildings/use-portfolio-manager/understand-metrics/difference
85 Sedano, R. (2014). Solutions to the throughput incentive. Montpelier, VT: Regulatory Assistance Project. Retrieved from http://www.raponline.org/knowledge-center/solutions-to-the-throughput-incentive/
86 See, for example, The Utility Reform Network. (2017, July 25). Prepared testimony of Eric Borden addressing the proposal of Pacific Gas and Electric Company for fast charging infrastructure program (CPUC Docket: A.17-01-020 et al.). San Francisco, CA: Author. Retrieved from http://www.turn.org/wp-content/uploads/2017/09/A.17-01-020-et-al._TURN_7.25.17_.pdf. See also Massachusetts Attorney General (2017, July). Initial brief of the Office of the Attorney General re: NSTAR Electric Company and Western Massachusetts Electric Company d/b/a Eversource Energy. D.P.U. 17-05. Boston, MA. Retrieved from http://www.mass.gov/ago/docs/energy-utilities/ago-initial-brief-dpu-17-05.pdf

BENEFICIAL ELECTRIFICATION: ENSURING ELECTRIFICATION IN THE PUBLIC INTEREST | 47 REGULATORY ASSISTANCE PROJECT
regulators could mitigate this concern by addressing the
overarching problem of the throughput incentive.87
Asking these and related questions can provide greater
clarity as states identify and formulate their electrification and
other policy goals.
Establish MetricsIdentifying criteria and metrics can help states track
progress toward their goals. Metrics could include, for
example, the number of EVs sold or heat pumps installed,
the quantity of emissions avoided, fossil fuel savings, or peak
demand reductions.88
Not only can states use metrics for tracking progress, they
may wish to revisit established regulatory practices and use
these metrics to develop performance incentives for utilities.
This can help address the limitations of the traditional regula-
tory framework discussed above, connecting utilities’ compen-
sation and returns to service goals and targets like emissions
efficiency. Incentive regulation can encourage utilities to
pursue smart rate design; to value flexibility and provide an
opportunity for third-party providers to monetize it; to include
emissions as a factor in pricing; and to enable customers’
access to electrified end uses.89 This can enhance the grid, give
customers more options, and align utility profit incentives with
least-cost and higher-value solutions.
Address TimingPolicymakers will also benefit from the recognition that
implementing BE programs will be a long-term effort. Where
state regulators—such as utility commissions, energy offices,
and environmental regulators—are responsible for overseeing
programs that legislators, utilities, and other market players
will develop, it can require some time to design, develop, and
implement a program. So, a willingness to engage in experi-
mentation will be useful.
Consider FlexibilityPolicymakers may want to consider how much flexibility
to provide the different entities charged with implementing
BE.90 As long as these entities are delivering measurable results
that meet policy goals and objectives, it could be useful to
grant them the leeway to propose the specifics of program
design, implementation, and delivery and to adjust and
innovate in response to lessons learned and changing market
conditions.
Identify Affected Participants In addition to developing criteria for success, states could
benefit from recognizing the different actors that could affect
or be affected as BE activity develops. These groups include:
• Branches of state government beyond the public utility
commission (e.g., departments of transportation,
energy, and environment) and other substate
jurisdictions (e.g., municipal and county governments);
• Natural gas utilities;
• Electric utilities;
• Technology providers;
• Propane and heating oil retailers;
• Third-party charging service providers;
• Consumer and ratepayer advocates;
• Environmental advocates;
• Environmental justice and social justice advocates;
• Transmission system operators;
• Demand aggregators;
• Distributed resource providers;
• Vehicle manufacturers and dealers;
87 Including the related capital bias that serves as a barrier to accommodating greater amounts of customer resources in their system planning. Sedano, R. (2017, June 8). Decoupling and the power sector of 2020 and beyond [Presentation to New Jersey Utilities Association]. Regulatory Assistance Project. Retrieved from https://www.raponline.org/wp-content/uploads/2017/06/rap_sedano_njua_2017_june_8.pdf; and Lazar, J., Weston, F., Shirley, W., Migden-Ostrander, J., Lamont, D., and Watson, E. (2016). Revenue regulation and decoupling: A guide to theory and application. Montpelier, VT: Regulatory Assistance Project. Retrieved from http://www.raponline.org/knowledge-center/revenue-regulation-and-decoupling-a-guide-to-theory-and-application-incl-case-studies/
88 Littell, D., Kadoch, C., Baker, P., Bharvirkar, R., Dupuy, M., Hausauer, B., et al. (2017). Next-generation performance-based regulation (Technical Report NREL/TP-6A50-68512). Golden, CO: National Renewable Energy Laboratory. Retrieved from https://www.nrel.gov/docs/fy17osti/68512.pdf
89 Littell et al., 2017. See also Lazar et al., 2016.
90 The use of the term “entity” is intentional. Electrification is likely to be delivered by a mix of providers, utilities, and others.

48 | BENEFICIAL ELECTRIFICATION: ENSURING ELECTRIFICATION IN THE PUBLIC INTEREST REGULATORY ASSISTANCE PROJECT
• Commercial building and multi-unit dwelling owners;
• Competitive retail electric suppliers, if applicable; and
• Elected officials.
States will benefit from being as clear as possible at the
outset about these actors’ possible roles and contributions as
states develop a market and programs for BE. Table 2 contains
some suggestions to illustrate how this might play out.
Ensure an Open ProcessAnother key to successfully developing policy proposals and
the necessary support for them is to set out a process in which
interested parties can participate and engage with one another.
Most energy-related proceedings are formally convened before a
state public utility commission (PUC) and offer limited opportu-
nities for consumers and other stakeholders to participate. Rules
governing interactions with utility commissioners vary such that
in some states commissioners may engage in discussions with all
interested stakeholders, while in others their interactions may
Table 2. Roles of Participants in BE Policies
Legislature, energy office, utility commission
Administrator (governmental or not)
Obligated entities
Private sector• Product and service providers• Lenders• Local authorities• Community organizations• Others (e.g., aggregator and retailer handling
the power sector parts of the value stream)
• Establish policy goals and criteria for success• Select entities obligated• Identify expected source(s) of funding• Define performance parameters• Develop regulations where necessary
• Develop performance parameters and consequences with obligated entities • Establish consequences for failing to meet BE goals• Ensure verification of achievement of BE goals
• Develop and refine delivery strategies• Manage implementation of strategies• Develop supply chain relationships• Interact with end users• Develop quality assurance• Track and report budget, expenses, overall energy savings, and avoided emissions
• Train contractors • Manage financing • Oversee infrastructure sales and installation • Develop complementary programs • Provide advice and support
91 For example, the California Legislature identified the need to reduce the barrier to EVs because, as utility sector emissions increase, ratepayers would be responsible for the costs of emissions allowances as purchased under the cap-and-trade regulation.
92 It is important to recognize that informal workshops or a series of workshops can be set up inside formal dockets, between dockets, through sessions directed at the end of one docket explicitly intended to inform a future docket, or, as described above, as purely freestanding sessions hosted by the commission to gather information for indeterminate purposes. Also, in some states it may be the energy office or office of the governor that may be in the best position to host collaborative meetings.
be strictly limited. Absent an affirmative step by states, efforts to
examine BE could encounter similar obstacles.91
Alternatively, collaborative efforts can provide regulators
the opportunity to convene multiple stakeholders unfamiliar
with the commission, its scope, and its rules to discuss a variety
of issues in a constructive and less formal environment. Collab-
oratives can provide a flexible structure to help work through
policy questions and resolve conflicts as part of or completely
outside a typical quasi-judicial PUC setting.92
Collaboratives also lend themselves to addressing many
broad policy questions that electrification raises. Collabora-
tives can be set up to address the full suite of issues associated
with designing, implementing, monitoring, improving, and
even adapting such programs to changing conditions. Cov-
ering much of this ground in an informal manner can also
help PUCs reduce program costs and improve the quality of
decision-making as they explore the development of BE in
their jurisdictions.
Over the last several years, state commissions have

BENEFICIAL ELECTRIFICATION: ENSURING ELECTRIFICATION IN THE PUBLIC INTEREST | 49 REGULATORY ASSISTANCE PROJECT
93 The purpose of the proceeding is to “explore issues that will maximize benefits and choice to Maryland electric customers and, in particular, assess how the evolving electric grid impacts low- and moderate-income ratepayers.” The process in Case No. 9478 concluded with a package of transportation electrification proposals that were formally supported by utilities, nongovernmental organizations, charging service providers, and many other groups. See Maryland Public Service Commission. Transforming Maryland’s electric grid (PC44) [Webpage]. Retrieved from http://www.psc.state.md.us/transforming-marylands-electric-grid-pc44/. See also Garcia, N. (2018, March 27). Maryland on the edge of EV leadership [Blog post]. Natural Resources Defense Council. Retrieved from https://www.nrdc.org/experts/noah-garcia/maryland-edge-ev-leadership
94 NextGrid: Illinois utility of the future study [Website]. Retrieved from https://nextgrid.illinois.gov/
95 See, for example, Rhode Island Public Utilities Commission, Docket No. 4600, Order on July 31, 2017. Retrieved from http://www.ripuc.org/eventsactions/docket/4600-NGrid-Ord22851_7-31-17.pdf. See also Rhode Island Division of Public Utilities & Carriers, Office of Energy Resources, and Public Utilities Commission. (2017). Rhode Island power sector transformation: Phase One report to Governor Gina M. Raimondo. Retrieved from http://www.ripuc.org/utilityinfo/electric/PST%20Report_Nov_8.pdf
96 Washington State Utilities and Transportation Commission, Dockets UE-151069 and U-161024, Report and Policy Order on October 11, 2017, paragraphs 1-8, and Docket UE-160799, Policy and Interpretive Statement on June 14, 2017. Retrieved by docket number from https://www.utc.wa.gov/docs/Pages/RecentOrders.aspx
97 Li, M., and Bryson, J. (2015). Energy efficiency collaboratives. Washington, DC: State and Local Energy Efficiency Action Network. Retrieved from http://www.raponline.org/wp-content/uploads/2016/05/seeaction-eecollaboratives-2015-sep.pdf
hosted numerous collaboratives on emerging policy
issues. For example, the Maryland Public Service
Commission has convened a process called Public
Conference 44, or PC44, to review the status of state
electric distribution systems and issues affecting
the deployment of distributed energy resources and
EVs.93 The Illinois Commerce Commission is managing a pro-
cess called NextGrid, a study looking at issues facing the state’s
electric utility industry, including topics like innovative tech-
nologies, grid improvements, and economic development.94 In
2017, Rhode Island’s Power Sector Transformation Initiative
investigated changes to its energy sector to accommodate BE,
including new technologies and customer-owned resources.
Several Rhode Island Public Utilities Commission-hosted col-
laboratives focused specifically on buildings and transportation
electrification.95 Another example of a more narrowly focused
collaborative is the series of workshops the Washington Util-
ities and Transportation Commission conducted in 2015 and
2016 that led to its policy statements on EV supply equipment,
storage, and integrated resource planning.96 Rhode Island and
Washington have very different power sectors, illustrating that
collaborative processes have broad applicability. Washington
is dominated by hydro and wind and has low rates, and about
half the state is served by public power. By contrast, Rhode
Island is a high-cost state served by investor-owned utilities
and has a largely thermal power supply base.
In 2015 the State and Local Energy Efficiency Action
Network published a useful report titled “Energy Efficiency
Collaboratives.” It examines how different models of these
collaboratives across the United States are created, how they
make decisions, how their membership is identified, and their
precise relationship with PUCs.97 As illustrated in Table 3 on
Page 50, the report also identifies types of collaboratives whose
attributes would lend themselves to state efforts to explore and
develop BE policies.
These collaborative models may be informal meetings
that are general and introductory or focused more narrowly
on specific topics. Initial meetings can explore topics such as
other programs around the country or focus on the capability
of available technologies. Regardless of the approach, taking
these initial steps can help states identify the many issues
that are likely to arise and the range of interested individuals
and groups that will want to participate as the discourse on
electrification develops.
Anticipate Specific Issues States will want to focus initially on setting goals
and developing appropriate venues for having BE-related
conversations with stakeholders, but shortly thereafter several
derivative issues will arise. They include rate design, utility
incentives, efficiency resource standards, building codes
for new construction, appliance standards, and fossil fuel
phaseout.
Another key to successfully developing policy proposals and the necessary support for them is to set out a process in which interested parties can participate and engage with one another.
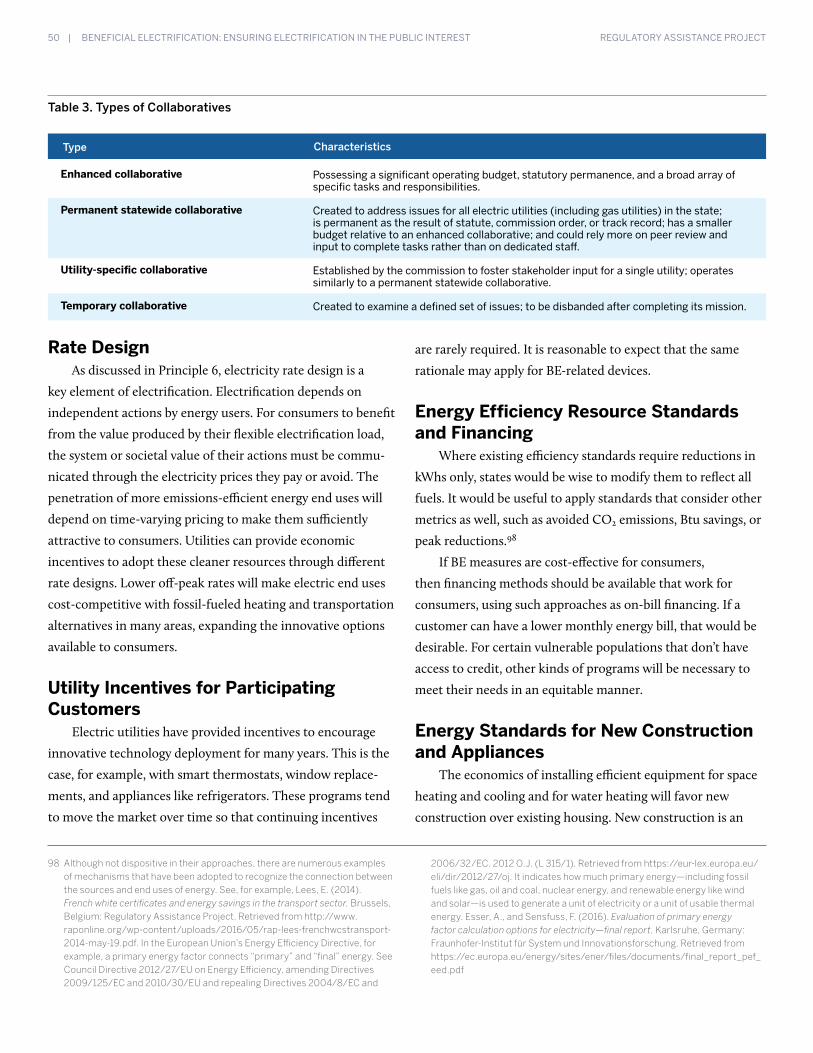
50 | BENEFICIAL ELECTRIFICATION: ENSURING ELECTRIFICATION IN THE PUBLIC INTEREST REGULATORY ASSISTANCE PROJECT
Rate DesignAs discussed in Principle 6, electricity rate design is a
key element of electrification. Electrification depends on
independent actions by energy users. For consumers to benefit
from the value produced by their flexible electrification load,
the system or societal value of their actions must be commu-
nicated through the electricity prices they pay or avoid. The
penetration of more emissions-efficient energy end uses will
depend on time-varying pricing to make them sufficiently
attractive to consumers. Utilities can provide economic
incentives to adopt these cleaner resources through different
rate designs. Lower off-peak rates will make electric end uses
cost-competitive with fossil-fueled heating and transportation
alternatives in many areas, expanding the innovative options
available to consumers.
Utility Incentives for Participating Customers
Electric utilities have provided incentives to encourage
innovative technology deployment for many years. This is the
case, for example, with smart thermostats, window replace-
ments, and appliances like refrigerators. These programs tend
to move the market over time so that continuing incentives
Table 3. Types of Collaboratives
Enhanced collaborative
Permanent statewide collaborative
Utility-specific collaborative
Temporary collaborative
Possessing a significant operating budget, statutory permanence, and a broad array of specific tasks and responsibilities.
Created to address issues for all electric utilities (including gas utilities) in the state; is permanent as the result of statute, commission order, or track record; has a smaller budget relative to an enhanced collaborative; and could rely more on peer review and input to complete tasks rather than on dedicated staff.
Established by the commission to foster stakeholder input for a single utility; operates similarly to a permanent statewide collaborative.
Created to examine a defined set of issues; to be disbanded after completing its mission.
Type Characteristics
are rarely required. It is reasonable to expect that the same
rationale may apply for BE-related devices.
Energy Efficiency Resource Standards and Financing
Where existing efficiency standards require reductions in
kWhs only, states would be wise to modify them to reflect all
fuels. It would be useful to apply standards that consider other
metrics as well, such as avoided CO2 emissions, Btu savings, or
peak reductions.98
If BE measures are cost-effective for consumers,
then financing methods should be available that work for
consumers, using such approaches as on-bill financing. If a
customer can have a lower monthly energy bill, that would be
desirable. For certain vulnerable populations that don’t have
access to credit, other kinds of programs will be necessary to
meet their needs in an equitable manner.
Energy Standards for New Construction and Appliances
The economics of installing efficient equipment for space
heating and cooling and for water heating will favor new
construction over existing housing. New construction is an
98 Although not dispositive in their approaches, there are numerous examples of mechanisms that have been adopted to recognize the connection between the sources and end uses of energy. See, for example, Lees, E. (2014). French white certificates and energy savings in the transport sector. Brussels, Belgium: Regulatory Assistance Project. Retrieved from http://www.raponline.org/wp-content/uploads/2016/05/rap-lees-frenchwcstransport-2014-may-19.pdf. In the European Union’s Energy Efficiency Directive, for example, a primary energy factor connects “primary” and “final” energy. See Council Directive 2012/27/EU on Energy Efficiency, amending Directives 2009/125/EC and 2010/30/EU and repealing Directives 2004/8/EC and
2006/32/EC. 2012 O.J. (L 315/1). Retrieved from https://eur-lex.europa.eu/eli/dir/2012/27/oj. It indicates how much primary energy—including fossil fuels like gas, oil and coal, nuclear energy, and renewable energy like wind and solar—is used to generate a unit of electricity or a unit of usable thermal energy. Esser, A., and Sensfuss, F. (2016). Evaluation of primary energy factor calculation options for electricity—final report. Karlsruhe, Germany: Fraunhofer-Institut für System und Innovationsforschung. Retrieved from https://ec.europa.eu/energy/sites/ener/files/documents/final_report_pef_eed.pdf

BENEFICIAL ELECTRIFICATION: ENSURING ELECTRIFICATION IN THE PUBLIC INTEREST | 51 REGULATORY ASSISTANCE PROJECT
ideal opportunity to deploy new technology, because the entire
cost of a heating and cooling system is being considered.
Appliance standards set out minimum energy standards,
and they are typically adopted separately for gas-fired and elec-
tric technologies.99 In light of the competitiveness of air source
heat pumps and air source heat pump water heating systems, it
would be worthwhile to consider including these requirements
in new building codes and appliance standards and ensuring
their effective adoption.100
Fossil Fuel PhaseoutThe economics for phasing out end uses employing fuel
oil, petroleum, and propane are currently more compelling
99 See discussion of codes and standards at Section 3.6 of Deason et al., 2018.
100 The redesign of buildings to include electrified end uses can be expected to increase efficiency and contribute to greater system resiliency. See Wei, M., Nelson, J.H., Greenblatt, J.B., Mileva, A., Johnston, J., Ting, M., et al. (2013). Deep carbon reductions in California require electrification and integration across economic sectors. Environmental Research Letters, 8(1). Retrieved from http://iopscience.iop.org/article/10.1088/1748-9326/8/1/014038
101 Although this may be true for buildings that already have access to natural gas, it may not be the case when considering the costs of gas pipeline expansion (see Principle 5). This is especially so if one remembers that gas pipeline expansion would never occur if the plan weren’t to use that infrastructure for many decades.
102 See, for example, Nemec, R. (2018, January 25). RNG, electrification pushed by California utilities. NGI’s Daily Gas Price Index. Retrieved from http://www.naturalgasintel.com/articles/113158-rng-electrification-pushed-by-california-utilities
than for end uses relying on natural gas.101 It is still advisable,
however, for states to explicitly consider incorporating equip-
ment investment lifetimes into their planning and analysis. As
electric technologies continue to improve and decline in price,
the economics of all fossil fuel-based investments over their
useful lives are likely to face competitiveness challenges.
For new natural gas system expansions, regulators may
need to require life-cycle cost analysis recognizing whatever
state carbon goals apply. For example, in states with a
commitment to very low carbon emissions by 2050, newly
expanded natural gas service may not be viable unless, for
example, natural gas industry “green gas” efforts produce
adequate results.102
52 | BENEFICIAL ELECTRIFICATION: ENSURING ELECTRIFICATION IN THE PUBLIC INTEREST REGULATORY ASSISTANCE PROJECT
This paper is intended to stimulate
discussion about how to characterize
and implement BE, one of the major
innovation opportunities in the power sector.
Recent technological advances and increases
in the efficiency of end-use equipment are for
the first time making possible the economic
electrification of uses that have traditionally been
powered by fossil fuels like natural gas, propane,
fuel oil, gasoline, and diesel.
BE reflects a collection of strategies designed to identify
and overcome barriers; take advantage of technology trends
and related power sector opportunities; connect consumers
with more affordable and cleaner resources; help utilities
better manage the grid; and reduce the environmental impacts
of powering energy end uses.
By establishing BE principles and suggesting goals and
models for organizing effective public engagement processes,
we offer regulators an analytical framework to improve energy
productivity in their own states through BE. This principles
paper is the first in a series of four reports; three companion
pieces will examine the implementation of BE for specific
applications in transportation, space heating, and water
heating.
For electrification to be considered beneficial, it must meet one or more of the following conditions, without adversely affecting the other two: 1. Saves consumers money over the long run;2. Enables better grid management; and3. Reduces negative environmental impacts.
Conclusion

BENEFICIAL ELECTRIFICATION: ENSURING ELECTRIFICATION IN THE PUBLIC INTEREST | 53 REGULATORY ASSISTANCE PROJECT
Appendix: Beneficial Electrification and Carbon Management
More than 30 US states have
adopted climate action plans,
greenhouse gas reduction
targets, or carbon markets. The goals of
beneficial electrification (BE) are consis-
tent with these extensive and long-stand-
ing state- and regional-level efforts to
use energy more efficiently and reduce the carbon intensity
of the economy.103 In support of climate goals, policymakers
have conducted studies to identify critical levers for managing
the transition to a low-carbon economy. Two approaches
these studies consistently identify are electrification and the
achievement of energy savings through investment in energy
efficiency. For example, the European Climate Foundation, in
a 2010 study outlining a pathway for reducing the EU’s green-
house gas emissions at least 80 percent from 1990 levels by
2050, recognizes:
The most cost-effective pathways to achieve this objective
depend critically in the shorter term on the deployment
of more aggressive energy efficiency measures and,
particularly post 2020, on a large-scale switch of heat and
transport sectors to the use of decarbonised electricity.104
In 2015, California’s Air Resources Board, Independent
System Operator, Public Utilities Commission, and Energy
Commission sought to evaluate the feasibility and cost of a
range of greenhouse gas reduction scenarios to meet their
goals.105 Looking economywide and across the state, the
PATHWAYS project concluded that certain actions are crit-
ical to meeting greenhouse gas reduction goals, including a
significant increase in energy efficiency and conservation in
buildings, vehicles and industry, and switching away from
fossil fuels in buildings and vehicles.106
“We focus on electrification here because we view it as the current, most obvious feasible pathway, requiring fewer technological/cost developments and potentially less infrastructure development than other options.”
Electrification: Emerging Opportunities for Utility Growth, The Brattle Group (2017)
103 Center for Climate and Energy Solutions. Climate action plans [Webpage]. Retrieved from https://www.c2es.org/us-states-regions/policy-maps/climate-action-plans; see also https://www.c2es.org/us-states-regions. Mason, M., and Megerian, C. (2017, July 17). California Legislature extends state’s cap-and-trade program in rare bipartisan effort to address climate change. Los Angeles Times. Retrieved from http://www.latimes.com/politics/la-pol-ca-california-climate-change-vote-republicans-20170717-story.html; and Gusting, G. (2017, August 23). 9 Eastern states agree to cut power plant emissions an extra 30%. Inside Climate News. Retrieved from https://insideclimatenews.org/news/23082017/rggi-northeast-states-tighten-power-plant-emissions
104 European Climate Foundation. (2010). Roadmap 2050: A practical guide to a prosperous, low-carbon Europe, p. 6. Retrieved from http://www.roadmap2050.eu/attachments/files/Volume2_Policy.pdf. See also Wei, M., Greenblatt, J.B., Nelson, J.H., Mileva, A., Johnston, J., et al. (2013). Scenarios for meeting California’s 2050 climate goals. Berkeley, CA: University of California and Lawrence Berkeley National Laboratory. Retrieved from http://www.energy.ca.gov/2014publications/CEC-500-2014-108/CEC-500-2014-108.pdf; and Wei, M., et al. (2013). Scenarios for deep carbon emission reductions from electricity by 2025 in western North America using the SWITCH electric power sector planning model. Berkeley, CA: University of California. Retrieved from http://www.energy.ca.gov/2014publications/CEC-500-2014-109/CEC-500-2014-109.pdf. The authors identify elements critical to the achievement of the 2050 goal of 80 percent greenhouse gas reductions from 1990 levels, including “widespread electrification
of passenger vehicles, building heating and industry heating.” They also write that “moving away from oil and natural gas and towards electricity is a key decarbonization strategy.” In 2015 the World Bank reached similar conclusions. Meeting climate goals will require “transforming how the world uses energy”; “the work starts with a shift from relying on fossil fuels for electricity to using clean energy that decarbonizes electricity”; and “with increasing amounts of clean energy following, a massive shift to electrification can then increase access to clean energy and displace polluting fuels.” World Bank. (2015 ). 3 steps to decarbonizing development for a zero-carbon future. Retrieved from http://www.worldbank.org/en/news/feature/2015/05/11/decarbonizing-development-zero-carbon-future
105 Mahone, A., Hart, E., Haley, B., Williams, J., Borgeson, S., et al. (2015). California PATHWAYS: GHG scenario results. San Francisco, CA: Energy and Environmental Economics. Retrieved from http://www.ethree.com/wp-content/uploads/2017/02/E3_PATHWAYS_GHG_Scenarios_Updated_April2015.pdf
106 Mahone et al., 2015. These actions include significantly increasing energy efficiency and conservation in buildings, vehicles, and industry; switching away from fossil fuels in buildings and vehicles; sustaining the pace of low-carbon electricity development (i.e., about 50 percent renewables in 2030 in California); decarbonizing liquid or gas fossil fuels with sustainable biofuels or synthetic decarbonized fuels; and reducing non-energy greenhouse gases (methane and fluorinated gases).
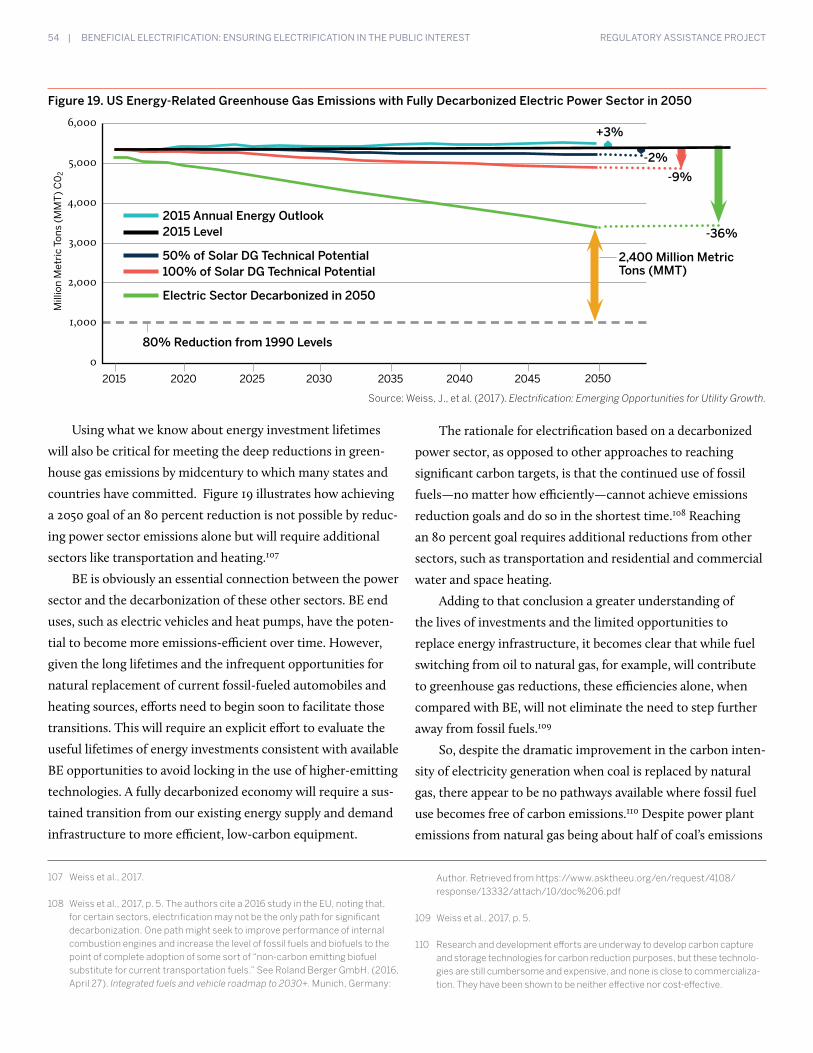
54 | BENEFICIAL ELECTRIFICATION: ENSURING ELECTRIFICATION IN THE PUBLIC INTEREST REGULATORY ASSISTANCE PROJECT
Using what we know about energy investment lifetimes
will also be critical for meeting the deep reductions in green-
house gas emissions by midcentury to which many states and
countries have committed. Figure 19 illustrates how achieving
a 2050 goal of an 80 percent reduction is not possible by reduc-
ing power sector emissions alone but will require additional
sectors like transportation and heating.107
BE is obviously an essential connection between the power
sector and the decarbonization of these other sectors. BE end
uses, such as electric vehicles and heat pumps, have the poten-
tial to become more emissions-efficient over time. However,
given the long lifetimes and the infrequent opportunities for
natural replacement of current fossil-fueled automobiles and
heating sources, efforts need to begin soon to facilitate those
transitions. This will require an explicit effort to evaluate the
useful lifetimes of energy investments consistent with available
BE opportunities to avoid locking in the use of higher-emitting
technologies. A fully decarbonized economy will require a sus-
tained transition from our existing energy supply and demand
infrastructure to more efficient, low-carbon equipment.
107 Weiss et al., 2017.
108 Weiss et al., 2017, p. 5. The authors cite a 2016 study in the EU, noting that, for certain sectors, electrification may not be the only path for significant decarbonization. One path might seek to improve performance of internal combustion engines and increase the level of fossil fuels and biofuels to the point of complete adoption of some sort of “non-carbon emitting biofuel substitute for current transportation fuels.” See Roland Berger GmbH. (2016, April 27). Integrated fuels and vehicle roadmap to 2030+. Munich, Germany:
Author. Retrieved from https://www.asktheeu.org/en/request/4108/response/13332/attach/10/doc%206.pdf
109 Weiss et al., 2017, p. 5.
110 Research and development efforts are underway to develop carbon capture and storage technologies for carbon reduction purposes, but these technolo-gies are still cumbersome and expensive, and none is close to commercializa-tion. They have been shown to be neither effective nor cost-effective.
Figure 19. US Energy-Related Greenhouse Gas Emissions with Fully Decarbonized Electric Power Sector in 2050
6,000
5,000
4,000
3,000
2,000
1,000
0
2015 Annual Energy Outlook2015 Level
50% of Solar DG Technical Potential100% of Solar DG Technical Potential
Electric Sector Decarbonized in 2050
2015 2020 2025 2030 2035 2040 2045 2050
Mill
ion
Met
ric
Tons
(M
MT
) C
02
80% Reduction from 1990 Levels
2,400 Million Metric Tons (MMT)
-36%
-9%
-2%
+3%
Source: Weiss, J., et al. (2017). Electrification: Emerging Opportunities for Utility Growth.
The rationale for electrification based on a decarbonized
power sector, as opposed to other approaches to reaching
significant carbon targets, is that the continued use of fossil
fuels—no matter how efficiently—cannot achieve emissions
reduction goals and do so in the shortest time.108 Reaching
an 80 percent goal requires additional reductions from other
sectors, such as transportation and residential and commercial
water and space heating.
Adding to that conclusion a greater understanding of
the lives of investments and the limited opportunities to
replace energy infrastructure, it becomes clear that while fuel
switching from oil to natural gas, for example, will contribute
to greenhouse gas reductions, these efficiencies alone, when
compared with BE, will not eliminate the need to step further
away from fossil fuels.109
So, despite the dramatic improvement in the carbon inten-
sity of electricity generation when coal is replaced by natural
gas, there appear to be no pathways available where fossil fuel
use becomes free of carbon emissions.110 Despite power plant
emissions from natural gas being about half of coal’s emissions
BENEFICIAL ELECTRIFICATION: ENSURING ELECTRIFICATION IN THE PUBLIC INTEREST | 55 REGULATORY ASSISTANCE PROJECT
111 Littell, D. (2016). Natural gas: Bridge or wall in transition to low-carbon econ-omy? Natural Gas & Electricity, 33(6). Retrieved from http://onlinelibrary.wiley.com/doi/10.1002/gas.21953/full
112 Millstein et al., 2017.
113 Over the life of electrification, utilities will retire today’s power plants and build new capacity. It is the emissions of those replacement units—likely to
be a mix of wind, solar, natural gas, nuclear, and other resources—that will supply the incremental electricity in the future. The short-term impacts are relevant but unlikely to control the analysis.
114 For example, if a natural gas-fired combined cycle turbine is the marginal unit at most peak evening periods (approximately 5 to 8 p.m.) then the marginal rate might be 700 to 1,200 pounds per MWh for those hours.
footprint on a per-energy-unit basis, the Achilles’ heel in the
bridge-fuel hypothesis may be that overinvestment in natural
gas infrastructure could actually undercut the transition to
even lower-emitting and more cost-effective technologies.111
Assessing Emissions Effects of Electrification
As noted earlier, although overall power sector emissions
are declining, this is occurring at different speeds around the
country.112 Consequently, it is important for decision-makers
to be able to credibly determine the emissions reductions
associated with incremental electrification activities in their
specific regions.
Identifying Marginal EmissionsHourly data, available in some regional transmission
organizations, would provide reasonable granularity and could
be used to assess how emissions are changing over the hours of
a year and from year to year. This won’t reflect the emissions
of the specific unit used for frequency regulation, often a very
flexible unit on automatic generation control, but rather the
emissions of the unit that would be started up or shut down in
response to a large step change in load. Here we consider three
methods for obtaining marginal carbon dioxide emissions
rates, listed in descending order of accuracy:
1. Marginal emissions analysis: This shows, in aggregate,
the emissions from the generation resource on the margin
in a specific balancing area, meaning the emissions that
would be produced to meet an additional increment
of load. This should be hourly data, available from
the system operator, that can be used to assess how
emissions will vary over all the hours of the year and from
year to year in response to permanent load changes.113
This approach provides the most accurate and useful
information for policymakers to determine a system’s
marginal emissions and the impacts of electrification.
2. Deemed savings model: In the absence of an accurate
resource load shape and a marginal emissions analysis,
something analogous to a deemed savings approach
(commonly used in evaluating energy efficiency programs)
could support a reasonable characterization of marginal
emissions for each power system. With this approach,
electrification measures of all kinds could be listed and
characterized with a reasonable estimate of annual carbon
and other emissions reductions they would provide, ideally
in at least quarterly increments. Accumulating all known
electrification measures in a utility’s service territory or
a power system during a year would quickly produce a
“deemed emissions reduction database.” This approach
is applicable in the context of BE, reflecting emissions
reductions typical of converting fossil-fueled end uses to
electricity-powered ones.
3. Emissions estimation: A system operator or state agency
could review available historic data to identify the likely
marginal unit at different times in a year and use emissions
information from that facility, or generic emissions
factors, to estimate the marginal emissions at various
times.114 This approach provides a way to at least offer
some information to regulators and the public. Generic
system data that help characterize hours and seasons when
electrification is likely to be beneficial for vehicles or other
end uses can aid utilities in developing smart charging
programs that minimize emissions. Regulators could
require additional data tracking to improve the programs’
accuracy.
Other approaches for characterizing marginal emissions
are being developed. For example, WattTime, a subsidiary of
the Rocky Mountain Institute, has developed an approach
that applies various algorithms to continuous emissions
monitoring data from generating facilities and from Open
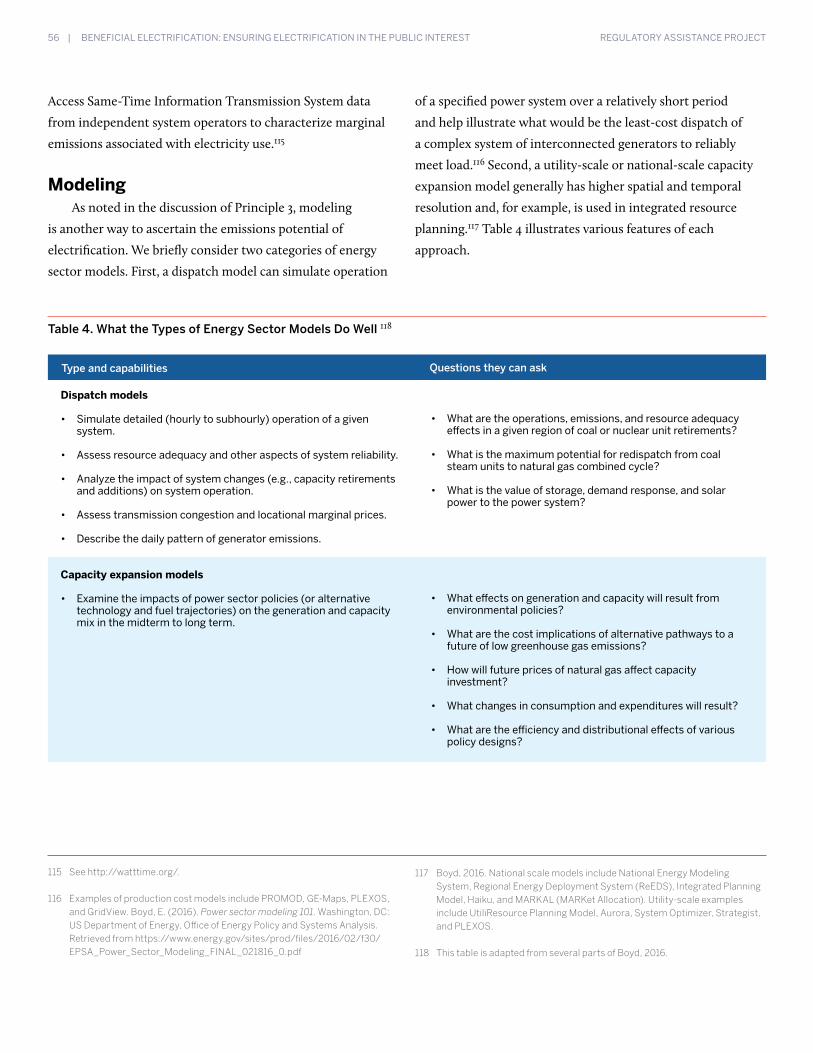
56 | BENEFICIAL ELECTRIFICATION: ENSURING ELECTRIFICATION IN THE PUBLIC INTEREST REGULATORY ASSISTANCE PROJECT
Access Same-Time Information Transmission System data
from independent system operators to characterize marginal
emissions associated with electricity use.115
Modeling As noted in the discussion of Principle 3, modeling
is another way to ascertain the emissions potential of
electrification. We briefly consider two categories of energy
sector models. First, a dispatch model can simulate operation
115 See http://watttime.org/.
116 Examples of production cost models include PROMOD, GE-Maps, PLEXOS, and GridView. Boyd, E. (2016). Power sector modeling 101. Washington, DC: US Department of Energy, Office of Energy Policy and Systems Analysis. Retrieved from https://www.energy.gov/sites/prod/files/2016/02/f30/EPSA_Power_Sector_Modeling_FINAL_021816_0.pdf
117 Boyd, 2016. National scale models include National Energy Modeling System, Regional Energy Deployment System (ReEDS), Integrated Planning Model, Haiku, and MARKAL (MARKet Allocation). Utility-scale examples include UtiliResource Planning Model, Aurora, System Optimizer, Strategist, and PLEXOS.
118 This table is adapted from several parts of Boyd, 2016.
of a specified power system over a relatively short period
and help illustrate what would be the least-cost dispatch of
a complex system of interconnected generators to reliably
meet load.116 Second, a utility-scale or national-scale capacity
expansion model generally has higher spatial and temporal
resolution and, for example, is used in integrated resource
planning.117 Table 4 illustrates various features of each
approach.
Table 4. What the Types of Energy Sector Models Do Well 118
Dispatch models
• Simulate detailed (hourly to subhourly) operation of a given system.
• Assess resource adequacy and other aspects of system reliability.
• Analyze the impact of system changes (e.g., capacity retirements and additions) on system operation.
• Assess transmission congestion and locational marginal prices.
• Describe the daily pattern of generator emissions.
Capacity expansion models
• Examine the impacts of power sector policies (or alternative technology and fuel trajectories) on the generation and capacity mix in the midterm to long term.
• What are the operations, emissions, and resource adequacy effects in a given region of coal or nuclear unit retirements?
• What is the maximum potential for redispatch from coal steam units to natural gas combined cycle?
• What is the value of storage, demand response, and solar power to the power system?
• What effects on generation and capacity will result from environmental policies?
• What are the cost implications of alternative pathways to a future of low greenhouse gas emissions?
• How will future prices of natural gas affect capacity investment?
• What changes in consumption and expenditures will result?
• What are the efficiency and distributional effects of various policy designs?
Type and capabilities Questions they can ask


The Regulatory Assistance Project (RAP)®
Belgium · China · Germany · India · USA
802-223-8199
raponline.org
50 State Street, Suite 3
Montpelier, Vermont
USA