anaerobic digestion of source segregated domestic …...anaerobic digestion, food waste, energy,...
TRANSCRIPT

Page 1 of 18
This is a revised personal version of the text of the final journal article, which is made available for scholarly purposes only, in accordance with the journal's author permissions. The full citation is: Charles J. Banks, Michael Chesshire, Sonia Heaven, Rebecca Arnold, Anaerobic digestion of source-segregated domestic food waste: Performance assessment by mass and energy balance, Bioresource Technology, Volume 102, Issue 2, January 2011, Pages 612-620, ISSN 0960-8524, 10.1016/j.biortech.2010.08.005. (http://www.sciencedirect.com/science/article/pii/S0960852410013404) _________________________________________________________________________
Anaerobic digestion of source segregated domestic food waste: performance assessment
by mass and energy balance
Author names and affiliations
Charles J Banksa*
, Michael Chesshireb, Sonia Heaven
a, Rebecca Arnold
b
a School of Civil Engineering and the Environment, University of Southampton,
Southampton SO17 1BJ, UK b BiogenGreenfinch, The Business Park, Coder Road, Ludlow SY8 1XE, UK
Abstract
An anaerobic digester receiving food waste collected mainly from domestic kitchens was
monitored over a period of 426 days. During this time information was gathered on the waste
input material, the biogas production, and the digestate characteristics. A mass balance
accounted for over 90% of the material entering the plant leaving as gaseous or digestate
products. A comprehensive energy balance for the same period showed that for each tonne of
input material the potential recoverable energy was 405 kWh. Biogas production in the
digester was stable at 642 m3 tonne
-1 VS added with a methane content of around 62%. The
nitrogen in the food waste input was on average 8.9 kg tonne-1
. This led to a high ammonia
concentration in the digester which may have been responsible for the accumulation of
volatile fatty acids that was also observed.
Keywords
Anaerobic digestion, food waste, energy, biogas, methane, mass balance
1 Introduction
Many examples exist of the use of anaerobic digestion (AD) to treat the mechanically
separated biodegradable fraction of municipal waste. Both ‘wet’ and ‘dry’ anaerobic
technologies have been used as part of mechanical-biological treatment (MBT) (Mata-
Alvarez, 2003). There are also examples of the processing of mixed source segregated
biodegradable wastes such as kitchen and garden wastes (Archer et al., 2005); but there are
few reports of AD plants operating entirely on source segregated household food waste.
* Corresponding author: Tel +44 (0)2380 594650, fax 677519, email [email protected]

Page 2 of 18
Interest in this approach is growing within Europe due to rising energy costs associated with
the processing of wet waste, the requirement to meet the diversion targets of the EU Landfill
directive (99/31/EC), and the need to comply with regulations for the disposal of animal by-
products (EC 1774/2002). When AD is used to process source segregated waste it not only
produces biogas, but also presents an opportunity to recover additional value from the waste
material, in the form of a quality assured nutrient-rich fertiliser product that can applied to
agricultural land used in food production. If the waste is not source segregated and the
organic fraction is recovered through a MBT plant, regulations in many European countries
do not permit the digestate product to be used on land in this way (Stretton-Maycock and
Merrington, 2009). Consequently, there is strong interest from government and industry in
methods of processing source segregated household food waste by the anaerobic digestion
route.
There are, however, reasons why food waste has not been popular in the past as a single
substrate, since digestion of this energy-rich material can lead to operational problems. The
protein content of food waste typically gives a high nitrogen content on hydrolysis, which
leads to elevated concentrations of ammonia or ammonium ion in the digester. The
distribution of the two species and their relative toxicity is pH dependent, with the more toxic
form dominating at higher pH (Mata-Alvarez, 2003). There is still uncertainty concerning the
concentration at which ammonia becomes inhibitory to methanogenesis, and this is reflected
in the various limit values given in recent literature. According to Mata-Alvarez (2003),
inhibition occurs at total ammonia concentrations of 1200 mg l-1
and above. Hartmann and
Ahring (2005) showed ammonia inhibition begins at free ammonia concentrations above 650
mg l-1
NH3-N, whereas Angelidaki et al. (2005) in a study of 18 full-scale biogas plants in
Denmark co-digesting manure and organic waste only found decreases in efficiency when
total ammonia was above 4000 mg NH3-N l-1
. El Hadj et al. (2009) found that methane
generation in batch tests with a high-protein synthetic biowaste under mesophilic conditions
fell by 50% at ammonium ion concentrations of 3860 mg NH4+-N l
-1. Although ammonia has
been shown to create operational difficulties in anaerobic digesters, it is also recognised that
populations can acclimate, making it difficult to predict the exact concentration at which
process instability or failure may occur (Fricke et al., 2007). It has been reported on a number
of occasions that digestion at high ammonia concentrations can give stable biogas production
at alkaline pH over extended periods of time under continuous loading conditions. In
digesters treating food waste these conditions can also lead to operation at elevated levels of
volatile fatty acids in the digestate (Banks et al., 2008, Neiva Correia et al., 2008). Similar
conditions have been reported in thermophilic cattle slurry digesters (Neilsen and Angelidaki,
2008), and in other nitrogen rich substrates such as slaughterhouse waste (Banks and Wang,
1999, Wang and Banks 2003).
The current work presents the results of a mass and energy balance over a 14-month period
for a full-scale food waste digester operating at high ammonia and VFA concentrations.
During the study period the digester was fed mainly on food waste collected from domestic
properties mixed with small amounts of commercial food waste and municipal green waste.
Since the study was completed the plant has continued to operate successfully as a
commercial facility processing food waste.
2 Materials and Methods
2.1 Digestion plant

Page 3 of 18
The plant was commissioned in March 2006 and for the first 9 months of operation was fed
on mixed kitchen and garden waste collected from domestic properties. From January 2007
the feed was gradually switched to source segregated food waste only. The study period
began on 1 June 2007 (day 0), and data for the mass and energy balances was collected for
426 days. During the study 3,936 tonnes of waste were processed of which 95.5% was
source-segregated domestic food waste, with the remainder consisting of commercial food
waste from restaurants and local businesses (2.9%) including a small amount of whey, and
grass cuttings (1.6%). The food waste received at the plant was first shredded in a rotary
counter-shear shredder to reduce the particle size, then passed to a feed preparation vessel
where it was mixed with recirculated whole digestate and macerated to give a particle size
less than 12 mm. The feed to the digester was via a buffer storage tank providing 3 days'
storage, to allow continuous feeding over weekends and public holidays. The digester itself
was a 900 m3 tank that was completely mixed by continuous gas recirculation and maintained
at 42 oC by external heat exchangers: the choice of temperature was based on the previous
experience and preference of the plant operator. The digestate was passed batch-wise to a
pasteurisation tank (60 m3) where it was heated to 70
oC for a minimum of 1 hour.
Pasteurised digestate was transferred to the digestate storage tank (900 m3), where it was kept
until being exported to local farms for use on agricultural land as either separated fibre, liquor
or whole digestate. The biogas generated was used to produce electricity using a 195 kW
MAN Combined Heat and Power (CHP) unit with an assumed electrical conversion
efficiency of 32% at full load and a potential for 53% recovery of heat via the jacket and
exhaust cooling water streams. Electricity produced by the CHP and imports and exports to
the grid were all metered. The power requirements of the plant were calculated from (CHP
generator meter + grid import meter – grid export meter). Some of the heat produced by the
CHP was fed back into the process. Temperatures in all tanks were recorded continuously
using a SCADA. More detailed descriptions of individual components of the plant are given
in Chesshire (2007) and Arnold et al. (2010).
2.2 Sampling, measurement and analysis
Quantification of input waste and other materials. All vehicles delivering waste to the plant
were weighed on a weighbridge before and after discharging their load. The origin and type
of waste was recorded. Water usage was monitored by separate meters, one for the industrial
process water and another for staff facilities (e.g. toilets and washrooms).
Biogas sampling analysis and quantification. A biogas sample was taken daily from the gas
holder feeding the CHP and analysed for methane and carbon dioxide content using a
GA2000 portable infrared gas analyser (Geotechnical instruments, Leamington Spa, UK).
Biogas volumes were recorded on an industrial gas flow meter, and readings were manually
adjusted for water vapour content and expressed at standard temperature and pressure (STP)
of 273.15 K and 101.325 kPa.
Waste input sampling and analysis. Daily composite samples of the shredded feedstock were
taken for analysis of the total solids (TS) and volatile solids (VS) content according to
Standard Method 2540 G (APHA, 2005). Further composites were prepared from the daily
composites over 2-week periods for determination of Total Kjeldahl Nitrogen (N),
phosphorus (P), and potassium (K). Total Kjeldahl N was determined using a Kjeltech block
digestion and steam distillation unit according to the manufacturer's instructions (Foss Ltd,
Warrington, UK). Samples for Potassium and Phosphorus were extracted using concentrated
HNO3 in a CEM Microwave Accelerated Reaction System for Extraction (MARSX) (CEM

Page 4 of 18
Corporation, North Carolina, USA). Potassium was quantified using a Varian Spectra AA-
200 atomic absorption spectrophotometer (Varian, Australia) according to the manufacturers'
instructions. Phosphorus was measured spectrophotometrically by the ammonium molybdate
method (ISO 6878: 2004).
Digester and digestate sampling and analysis. Samples of digestate were taken on a regular
basis for analysis. Total and volatile solids were measured as above. Ammonia was
determined using a Kjeltech steam distillation unit according to the manufacturer's
instructions (Foss Ltd, Warrington, UK). VFA were quantified in a Shimazdu GC-2010 gas
chromatograph, using a flame ionization detector and a capillary column type SGE BP-21
with helium as the carrier gas at a flow of 190.8 ml min-1
, with a split ratio of 100 giving a
flow rate of 1.86 ml min-1
in the column and a 3.0 ml min-1
purge. The GC oven temperature
was programmed to increase from 60 to 210 oC in 15 min, with a final hold time of 3 min.
The temperatures of injector and detector were 200 and 250 oC, respectively. Samples were
prepared by acidification in 2% formic acid. A standard solution containing acetic, propionic,
iso-butyric, n-butyric, iso-valeric, valeric, hexanoic and heptanoic acids, at three dilutions
giving individual acid concentrations of 50, 250 and 500 mg l-1
respectively, was used for
calibration. Alkalinity was measured by titration using 0.25 N H2SO4 to endpoints of 5.7 and
4.3 (Ripley et al., 1986). Digestate pH was measured using a combination glass electrode and
meter calibrated in buffers at pH 4, 7 and 9.
3 Results and discussion
3.1 Feedstock characteristics, organic loading rate and retention time
Figure 1 shows values for TS and VS throughout the study period for the domestic food
waste and the commercial food waste (not including whey) components of the feedstock. The
average solids content was similar for domestic food waste (TS 27.7%, VS 24.4%) and
commercial food waste (TS 27.8%, VS 24.3%). As can be seen in Figures 1a and b, there was
some variation in the TS and VS content of individual samples of domestic food waste but no
strong evidence of seasonal variation and the VS:TS ratio remained fairly constant. Figure 1c
shows the TS and VS values for commercial food waste: these spanned a greater range than
for the domestic food waste, reflecting greater differences in moisture content, but again the
ratio of VS:TS was consistent.
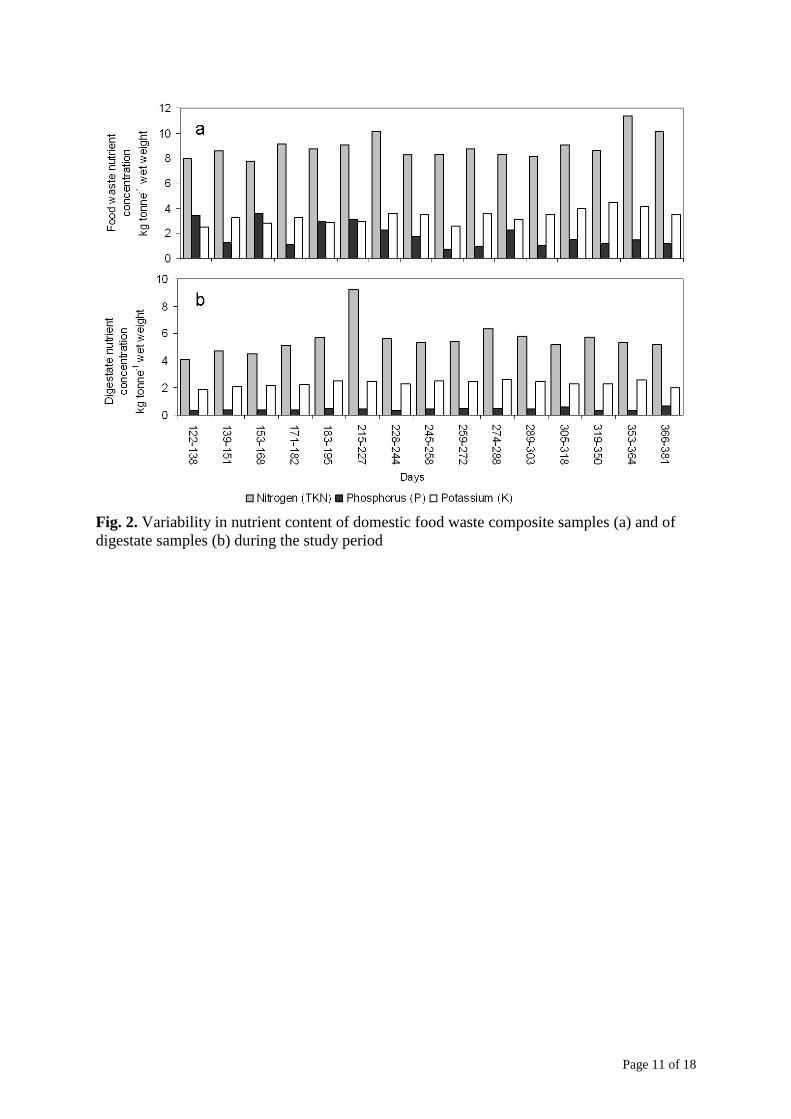
The average nutrient content of the domestic food waste during the study period was 8.9, 1.9
and 3.3 kg tonne-1
on a wet weight (WW) basis for Total Kjeldahl Nitrogen (TKN),
Phosphorus (P) and Potassium (K) respectively, while the equivalent values for commercial
food waste were 8.7, 1.8 and 3.4 kg tonne-1
WW. Figure 2a shows the variability in
fortnightly composite samples of domestic food waste. The variations between consecutive
samples may reflect the fact that only a small amount of material is ultimately used in
laboratory analysis, and however much effort is made to prepare representative composites,
subsamples may show slight non-homogeneity due to unavoidable scale factors.
The average organic loading rate during the study period was 2.5 kg VS m-3
day-1
based on
the nominal digester volume of 900 m3, or 2.7 kg VS m
-3 day
-1 based on the average volume
of digester contents. The maximum and minimum weekly average loadings based on actual
volume were 3.46 and 0.91 kg VS m-3
day-1
respectively, with the minimum corresponding to
a Christmas closure period. The average hydraulic retention time was 80 days, based on the
Page 5 of 18
nominal digester volume divided by the mass input on a wet weight basis. More detailed
information on day-to-day variations in feedstock quantities is given in Arnold et al. (2010).
3.2 Digestate characteristics
Values for TS and VS content of digestate and fibre throughout the study period are shown in
Figure 3. The average solids content was TS 4.5%, VS 2.9% for the digestate and TS 23.8%,
VS 17.9% for the fibre. As can be seen in Figure 3, there was some variation in the TS and
VS content of individual samples of digestate but the VS:TS ratio remained fairly constant.
The average nutrient content of the digestate during the study period was 5.6, 0.4 and 2.3 kg
tonne-1
WW for TKN, P and K respectively. Figure 2b shows the variability between
fortnightly composite samples. As expected the values were more consistent than those for
feedstock, apart from one high value for nitrogen in day 215-227. A nutrient mass balance
taking into account water additions showed outputs equal to 86.1%, 32.8% and 96.4% of the
input values of TKN, P and K respectively. The lower recovery of TKN and particularly of P
may indicate losses by precipitation e.g. of struvite (NH4MgPO4·6H2O) within the digester
system.
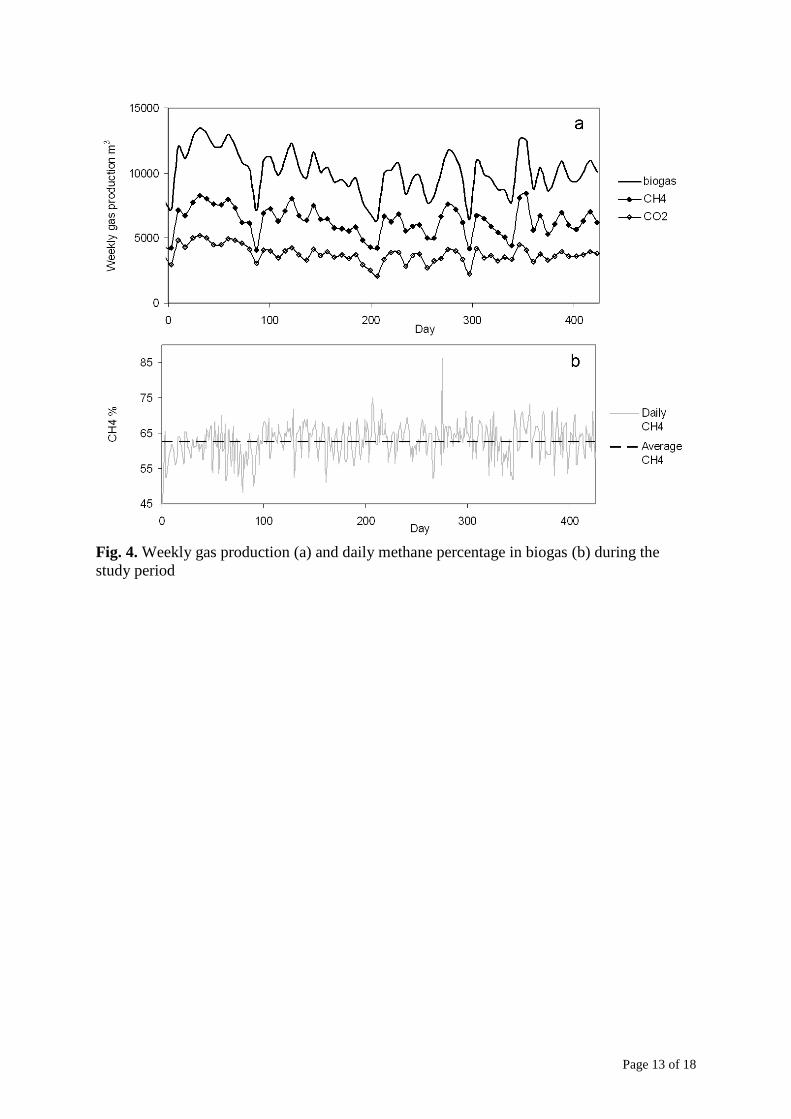
3.3 Biogas output and variability
Table 1 shows the total biogas production and the proportion of methane and carbon dioxide
based on daily measurements. The specific biogas and methane yields are given on both a wet
weight and a VS basis, and show the food waste has a high methane potential in comparison
to typical municipal residual waste streams. The high moisture content means, however, that
the biogas production per tonne of imported material is similar to typical values reported for
municipal solid waste (MSW). Volumetric gas production is calculated based on the volume
of the digester only.
Variability in the biogas production and composition is shown by reference to the weekly
values for methane, carbon dioxide and biogas in Figure 4a. Total biogas production over a 1-
week period varied from a minimum 6,364 m3 to a maximum of 13,438 m
3, although some of
the peaks and troughs can be explained by differences in the incoming load (e.g. suspension
of some deliveries during the Christmas - New Year period in 2007). Figure 4b shows the
variability in methane concentration based on daily readings, compared to the calculated
average for the whole study period.
3.4 Digestion parameters
Digestion parameters are reported from day 0 corresponding to the start of the mass and
energy balance study, although measurement of VFA and ammonia only began some time
after this.
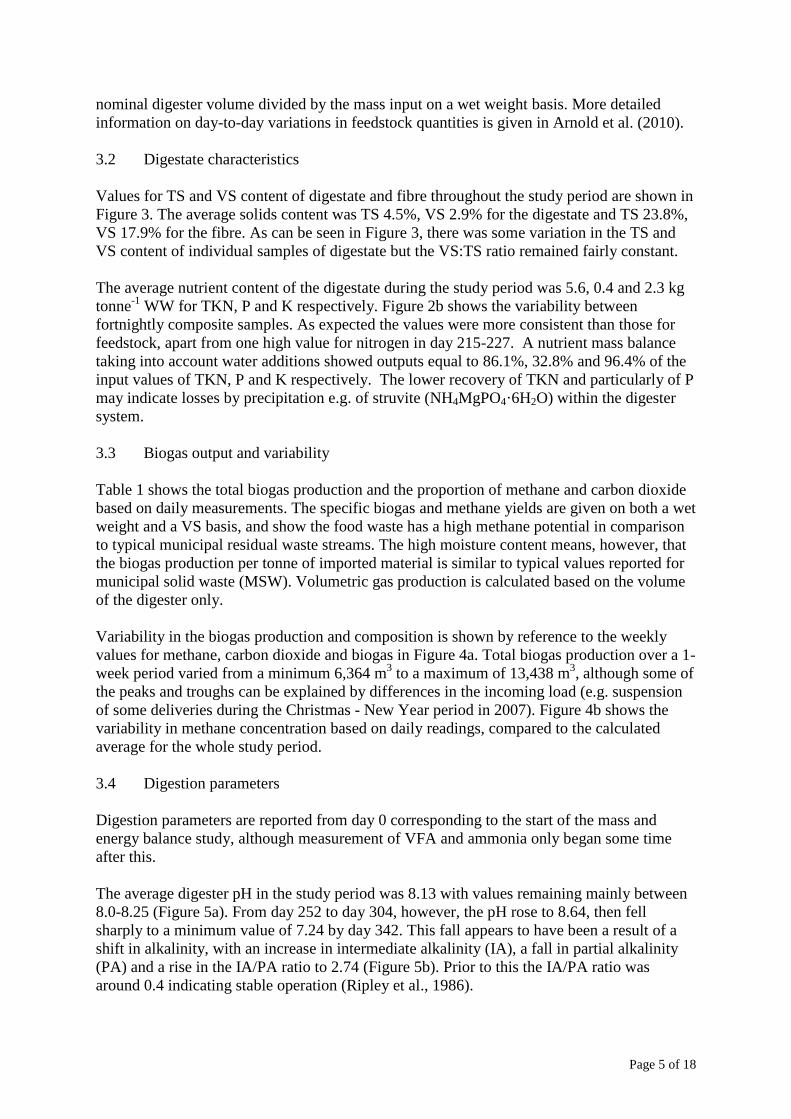
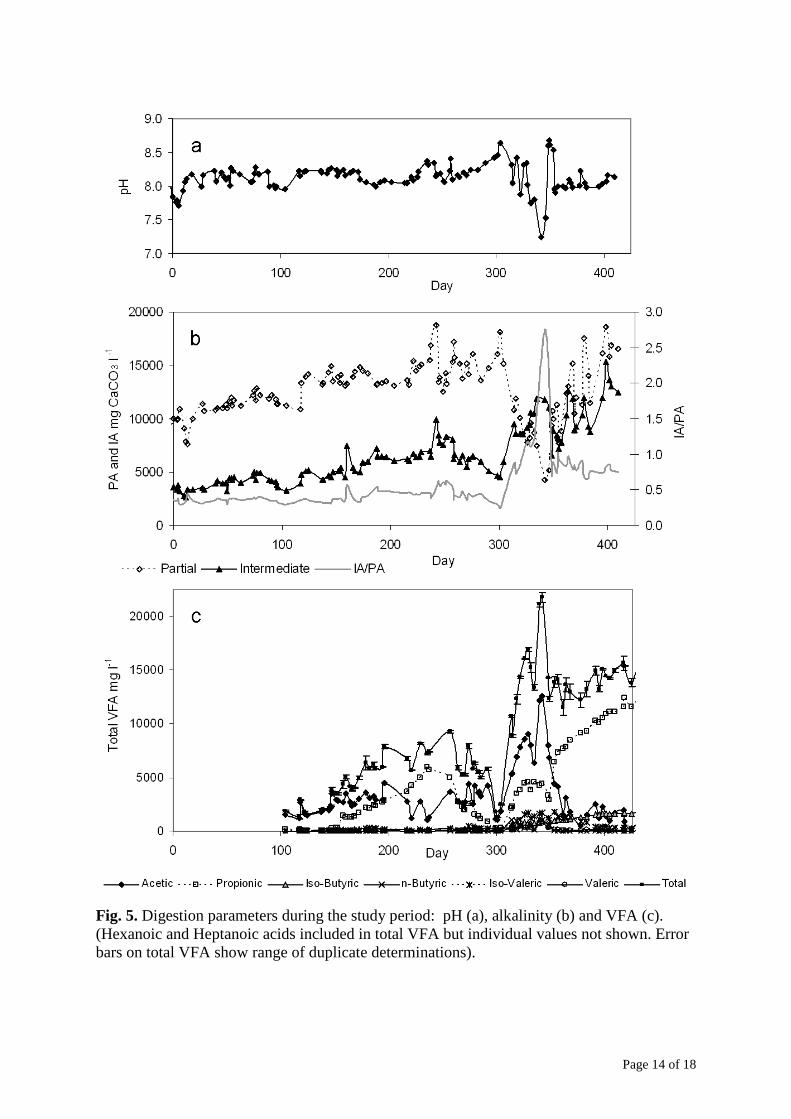
The average digester pH in the study period was 8.13 with values remaining mainly between
8.0-8.25 (Figure 5a). From day 252 to day 304, however, the pH rose to 8.64, then fell
sharply to a minimum value of 7.24 by day 342. This fall appears to have been a result of a
shift in alkalinity, with an increase in intermediate alkalinity (IA), a fall in partial alkalinity
(PA) and a rise in the IA/PA ratio to 2.74 (Figure 5b). Prior to this the IA/PA ratio was
around 0.4 indicating stable operation (Ripley et al., 1986).
Page 6 of 18
The major factor affecting the intermediate alkalinity is the concentration of undissociated
VFA. This fell between day 250-300, with a decrease in the propionic acid concentration,
followed by a rapid increase after day 300 in both acetic and propionic acid and a slower rise
in the concentration of butyric etc (Figure 5c). The reasons for this change are not clear but
the ammonia concentration in the digesters had been increasing steadily and reached around
5000 mg l-1
at this time. Subsequent work in laboratory-scale digesters has suggested that
high ammonia concentrations may cause a shift in the biochemical pathways leading to
methane formation (Banks and Zhang, 2010). A slight decrease in biogas methane
concentration can be seen before day 342 followed by recovery. Total VFA concentrations
continued to increase and approached 15000 mg l-1
by the end of the monitoring period, of
which propionic acid made up 11,500 mg l-1
. Despite the high VFA values the specific and
volumetric biogas yields remained unaffected (Figure 6).
3.5 Overall mass balance
The mass balance around the plant was calculated in two ways: by wet weight (Table 2) and
on a VS basis (Table 3). In the wet weight balance water additions from both the process and
facilities supplies were included as inputs. Methane and carbon dioxide volumes were
corrected to STP and it was assumed that the spot values for methane concentration are
representative of a 24-hour period. Weights of digestate, fibre and rejects were taken from
weighbridge data for materials leaving site. Stored materials are based on tank volumes and
estimated quantities of fibre in the digestate hall. Weight data on all wastes generated by the
operation (including canteen wastes and litter as well as feedstock contamination) was only
collected from April 2008, and therefore underestimates the total weight of material leaving
the plant by this route. Contamination of the feedstock itself, assessed by hand sorting of
samples (not reported here), was minimal. Evaporative water losses from the gas mixing
system due to supersaturation followed by condensation in the gas holder were not taken into
account. Calculations also did not consider fugitive emissions of gas or liquid from the site.
For the VS mass balance, the VS of input food waste, digestate and fibre was based on the
average of all laboratory determinations for each parameter. The VS of the reject stream was
taken as equal to that of the incoming food waste. The amount of material stored in tanks was
based on tank volumes and an assumed VS equal to the digestate storage. Calculations using
a 21-day rolling average of VS values for input food waste and digestate gave similar results,
with only a slight change in the overall mass balance from 90.3% (Table 3) to 90.6%.
The method for determination of VS leads to volatilisation and loss of intermediate soluble
metabolites such as VFA and ammonia. If concentrations of these in the liquid digestate are
taken into account and assumed to be vaporised during the standard analytical procedure, the
VS mass balance increases to 95.7%.
Considering the difficulties of obtaining representative samples from very heterogeneous
materials, the results of the mass balance are considered to be acceptable for a full-scale
plant.
Figures 6a and b show the mass balance plotted on a weekly and cumulative weekly basis.
On a weekly basis (Figure 6a) there is some variability, a proportion of which can be
attributed to the problem of estimating the quantities of digestate and fibre stored on site.
From Figure 6b it can be seen that at the point when materials were last taken off site and

Page 7 of 18
accurate weights recorded, the difference between input and output weights without
consideration of storage was only 190 tonnes out of a total input of 4,823 tonnes (4%).
3.6 Gross electricity and heat outputs from the CHP unit
Values for electricity and heat outputs during the study period from the CHP unit only are
shown in Table 4. There was no way of to measure directly the heat output associated with
the CHP or the amount of this heat that used to maintain the temperature of the digestion
plant. The calculated gross energy output of the CHP plant was 2,781 MWh which at a
recovery value of 53% would provide a further 1,474 MWh of energy in the form of
extractable heat, in addition to the electrical energy output.
When starting the CHP unit, a small amount of natural gas was used before switching to
biogas. During the study period this totalled 1,534 m3 (0.4% of the total methane production
of the plant). No electricity was generated as a result and this component is therefore not
included in Table 5, but is taken into account in the overall energy balance.
At the time when the CHP unit is not generating electricity, due to scheduled maintenance,
breakdown, or gas quality below the threshold limit, the biogas is burnt in a separate boiler
unit to produce hot water.
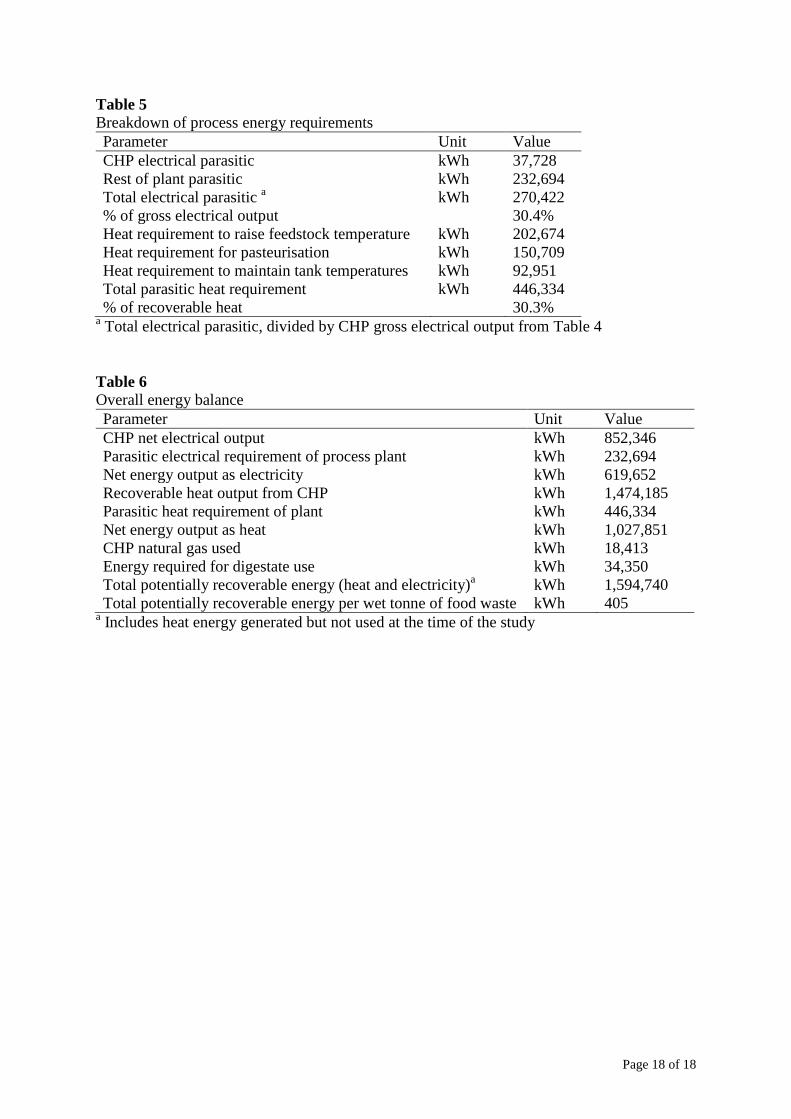
3.7 Electricity and heat requirements of the process plant
Electrically-powered equipment involved in operation of the plant included the raw waste
shredder, macerators, feed pumps, biogas compressor pumps, CHP and boiler water feed
pumps, belt press, air filtration and minor ancillary equipment such as conveyors. The
primary consumers of electricity included the heat dumping fans, gas mixing compressors, air
filtration unit for reception hall, air filtration biofilter for digestate hall, raw waste shredder,
and pasteurisation heating pump. Intermediate consumers were the feed and discharge
pumps, gas holder inflation fans and the CHP water pump. There were no individual
electricity meters on these and the power taken depends upon the equipment load, so cannot
be calculated directly from hours run and plate capacity. Parasitic energy is therefore given as
an overall figure representing the total number of kWh consumed on site (Table 5).
The energy required to raise the temperature of the feedstock, pasteurise the digestate and
maintain the temperature of the heated tanks was calculated based on input volumes, tank
dimensions and insulation values, and is given in Table 5. Temperature differentials between
tanks and ambient were taken from average monthly values for the UK Meteorological Office
station at Lyonshall. Feedstock materials were considered to be at ambient temperatures. It
was assumed that the buffer tank, digester and pasteuriser were always full and maintained at
operating temperatures.
3.8 Energy used in digestate transport and application
The energy required for transport and application of the digestate to land was 34350 kWh and
was calculated from actual vehicle trips made, taking into account the vehicle types used and
mileages covered. Vehicle fuel efficiencies were based on emissions factors from the EU
Environment Agency’s Corinair database (EEA, 2002). Energy used in application of the
digestate to land was calculated using tractor power efficiency conversions and estimated
hours run and gave a value of 17 MJ tonne-1
, which agrees with that quoted in Berglund and

Page 8 of 18
Borjesson (2006). More detail on the land application calculations is given in Banks et al. (in
review).
3.9 Overall energy balance
Table 6 summarises the overall energy balance for the processing of feedstock, including
delivery to the recipient sites and application to land during the study period based on the
above data.
4 Conclusions
The specific methane yield of food waste was 98 m3 tonne
-1 wet weight or 402 m
3 tonne
-1 VS,
and productivity remained high throughout the study period. The nitrogen content led to high
ammonia concentrations that buffered VFA accumulation. Net recoverable energy was 405
kWh tonne-1
wet weight, including digestate transport and utilisation. The mass balance was
90.4% (wet weight), and 95.7% (VS basis) allowing for loss of volatile components. Since
study ended the plant has continued in successful commercial operation and provides a
sustainable route for recovery of products from domestic food waste.
Acknowledgements
Funding for this project was provided by Advantage West Midlands and by Defra from the
New Technologies Demonstrator Programme. The authors also gratefully acknowledge the
support and assistance of Biocycle South Shropshire Ltd.
References
APHA, 2005. Standard Methods for the Examination of Water and Wastewater. 21st edition,
American Public Health Association, American Water Works Association, Water
Environment Federation, Washington, USA.
Angelidaki, I., Boe, K, Ellegaard, L., 2005. Effect of operating conditions and reactor
configuration on efficiency of full-scale biogas plants. Water Sci. Technol. 52(1-2), 189-
194.
Archer, E., Baddeley, A., Klein, A., Schwager, J., and Whiting, K., 2005. MBT: A Guide for
Decision Makers - Processes, Policies and Markets. Juniper Consulting Ltd, Uley,
Gloucestershire, UK.
Arnold, R., Banks C.J., Chesshire, M., Foxall, M., Stoker, A., 2010. Defra Demonstration
Project: Biocycle South Shropshire Biowaste Digester. Defra New Technologies
Programme. Final Report.
www.defra.gov.uk/environment/waste/residual/newtech/demo/documents/Biocycle-
final.pdf. Accessed 1 July 2010.
Banks, C.J., Chesshire, M., Heaven, S., Arnold, R., Lewis, L., in review. Biocycle anaerobic
digester: performance and environmental benefits. Proceedings of the Institution of Civil
Engineers - Waste and Resource Management.
Banks, C.J., Chesshire, M., Stringfellow, A., 2008. A pilot-scale trial comparing mesophilic
and thermophilic digestion for the stabilisation of source segregated kitchen waste. Water
Sci. Technol. 58(7), 1475-1480.
Banks C.J., Wang, Z., 1999. Development of a two phase anaerobic digester for the treatment
of mixed abattoir wastes. Water Sci. Technol. 40(1), 69-76.
Banks, C.J. and Zhang, Y., 2010. Technical Report: Optimising inputs and outputs from
anaerobic digestion processes. Defra project Code WR0212.
Page 9 of 18
http://randd.defra.gov.uk/Document.aspx?Document=WR0212_8890_FRP.pdf. Accessed
1 July 2010.
Berglund, M. and Borjesson, P., 2006. Assessment of energy performance in the life-cycle of
biogas production. Biomass Bioenerg. 30(3), 254-266.
Chesshire, M., 2007. The South Shropshire biowaste digester, UK. Proceedings of the
Institution of Civil Engineers - Waste and Resource Management. 160(1), 19-26.
EEA, 2002. European Environment Agency EMEP/CORINAIR Emission Inventory
Guidebook (third edition). Technical Report No. 30. EEA.
El Hadj, T.B., Astals, S., Gali, A., Mace, S. Mata-Alvarez, J., 2009. Ammonia influence in
anaerobic digestion of OFMSW. Water Sci. Technol. 59(6), 1153–1158.
Fricke, K., Santen, H., Wallmann, R., Hüttner, A., Dichtl, N. (2007). Operating problems in
anaerobic digestion plants resulting from nitrogen in MSW. Waste Manage. 27(1), 30–43.
Hartmann, H., and Ahring, B. K., 2005. A novel process configuration for anaerobic
digestion of source-sorted household waste using hyper-thermophilic post-treatment.
Biotechnol. Bioeng. 90(7), 830-837.
Mata-Alvarez, J., 2003. (Ed). Biomethanization of the Organic Fraction of Municipal Solid
Wastes. IWA Publishing, London.
Neilsen, H.B., and Angelidaki, I., 2008. Strategies for optimizing recovery of the biogas
process following ammonia inhibition. Bioresource Technol. 99(17), 7995–8001. Neiva Correia, C., Vaz, F., Torres, A., 2008. Anaerobic digestion of biodegradable waste –
operational and stability parameters for stability control. 5th IWA International Symposium on AD
of Solid Wastes and Energy Crops, Tunisia.
Stretton-Maycock, D., Merrington, G., 2009. The use and application to land of MBT
compost-like output - review of current European practice in relation to environmental
protection. Science Report – SC030144/SR3. Environment Agency, Bristol, UK.
Ripley, L.E., Boyle, W.C., Converse, J.C., 1986. Improved alkalimetric monitoring for
anaerobic digestion of high strength wastes. Journal of the Water Pollution Control
Federation. 58(5), 406-411.
Wang Z.J, Banks C. J., 2003. Evaluation of a two stage anaerobic digester for the treatment
of mixed abattoir wastes. Process Biochem. 38 (9), 1267-1273.

Page 10 of 18
Fig. 1. TS and VS content of domestic (a and b) and commercial (c) food waste during the
study period (points show average value for triplicate determinations; lines show rolling 21-
day averages).
Page 11 of 18
Fig. 2. Variability in nutrient content of domestic food waste composite samples (a) and of
digestate samples (b) during the study period

Page 12 of 18
Fig. 3. TS and VS content of digestate (a and b) and fibre (c) during the study period (points
show average value for triplicate determinations; note different scales for digestate and fibre)
Page 13 of 18
Fig. 4. Weekly gas production (a) and daily methane percentage in biogas (b) during the
study period
Page 14 of 18
Fig. 5. Digestion parameters during the study period: pH (a), alkalinity (b) and VFA (c).
(Hexanoic and Heptanoic acids included in total VFA but individual values not shown. Error
bars on total VFA show range of duplicate determinations).

Page 15 of 18
Fig. 6. Mass balance (wet weight) during the study period: weekly (a) and cumulative (b)

Page 16 of 18
Table 1
Gas production parameters during mass and energy balance period
Item Unit Value %
Methane m3 STP 385,488 62.6
Carbon dioxide m3 STP 229,984 37.4
Biogas m3 STP 615,472 100.0
Food waste input
kg WW 3,936,504 -
kg VS 959,209 -
Specific biogas yield
m3 tonne
-1 WW 156 -
m3 tonne
-1 VS 642 -
Specific methane yield
m3 tonne
-1 WW 98 -
m3 tonne
-1 VS 402 -
Volumetric biogas yielda m
3 m
-3 reactor 1.59 -
Volumetric methane yielda m
3 m
-3 reactor 1.00 -
a Based on volume of digester only
Table 2
Mass balance for study period (wet weight)
Parameter Unit Value
Food waste input kg 3,936,504
Water input (washwater) kg 1,490,000
Total input kg 5,426,504
Methane kg 275,177
Carbon Dioxide kg 451,473
Water vapour kg 12,526
Digestate a kg 3,969,080
Fibre a kg 39,240
All waste leaving site kg 35,820
Total output kg 4,783,315
Wet tanks kg 92,433
Stored material kg 30,000
Total storage kg 122,433
Balance accounted for kg 520,756
% 90.4% a Any liquid digestate produced is recirculated through the process and leaves the site as
whole digestate

Page 17 of 18
Table 3
Mass balance for study period (VS)
Parameter Unit Value
Food waste input kg WW 3,936,504
Food waste VS kg VS kg-1
WW 0.244
Total input kg VS 959,209
Methane kg VS 275,177
Carbon Dioxide kg VS 451,473
Digestate (includes separated
and whole digestate) kg WW 3,969,080
kg VS kg-1
WW 0.029
kg VS 115,521
Fibre kg WW 39,240
kg VS kg-1
WW 0.179
kg VS 7,040
Reject kg WW 35,820
kg VS kg-1
WW 0.244
kg VS 8,728
Total output kg VS 857,938
Wet tanks kg WW 92,433
kg VS kg-1
WW 0.029
kg VS 2,690
Stored material kg WW 30,000
kg VS kg-1
WW 0.179
kg VS 5,382
Total storage kg VS 8,072
Balance kg VS 93,198
% 90.3%
Table 4
Electrical and heat outputs from the CHP plant during the study period
Parameter Unit Value %
CHP gross energy a kWh 2,781,481 100.0%
CHP gross electrical output kWh 890,074 32.0%
CHP parasitic electrical requirement kWh 37,728 1.4%
CHP net electrical output kWh 852,346 30.6%
CHP gross heat output kWh 1,891,407 68.0%
CHP recoverable heat output kWh 1,474,185 53.0%
CHP waste heat kWh 417,222 15.0% a Calculated as electrical output divided by conversion efficiency taken as 32%
Page 18 of 18
Table 5
Breakdown of process energy requirements
Parameter Unit Value
CHP electrical parasitic kWh 37,728
Rest of plant parasitic kWh 232,694
Total electrical parasitic a kWh 270,422
% of gross electrical output 30.4%
Heat requirement to raise feedstock temperature kWh 202,674
Heat requirement for pasteurisation kWh 150,709
Heat requirement to maintain tank temperatures kWh 92,951
Total parasitic heat requirement kWh 446,334
% of recoverable heat 30.3% a Total electrical parasitic, divided by CHP gross electrical output from Table 4
Table 6
Overall energy balance
Parameter Unit Value
CHP net electrical output kWh 852,346
Parasitic electrical requirement of process plant kWh 232,694
Net energy output as electricity kWh 619,652
Recoverable heat output from CHP kWh 1,474,185
Parasitic heat requirement of plant kWh 446,334
Net energy output as heat kWh 1,027,851
CHP natural gas used kWh 18,413
Energy required for digestate use kWh 34,350
Total potentially recoverable energy (heat and electricity)a kWh 1,594,740
Total potentially recoverable energy per wet tonne of food waste kWh 405 a Includes heat energy generated but not used at the time of the study