an examination of initial shareholdings in tender offer bids
TRANSCRIPT
Review of Quantitative Finance and Accounting, 12 (1999): 171–188© 1999 Kluwer Academic Publishers, Boston. Manufactured in The Netherlands.
An Examination of Initial Shareholdings in TenderOffer Bids
DANIEL ASQUITHDeloitte & Touche, 1000 Wilshire Blvd, Los Angeles, CA 90017, email: [email protected]
ROBERT KIESCHNICKFederal Communications Commission, 2000 M Street N.W., Washington, D.C. 20554, email:[email protected],(Corresponding Author)
Abstract. We examine the initial shareholdings taken by bidders prior to making tender offer bids (“toe-holds”) in order to test predictions of selected models of tender offers. Our data suggest a significantly negativerelationship between first bidder premia and toeholds, which is consistent with the models of Shleifer and Vishny(1986) and Hirshleifer and Titman (1990), but inconsistent with the models of Harrington and Prokop (1993),Chowdhry and Jagadeesh (1994), and Burkart (1995).
Key words: Toeholds, tender offers, beta regression analysis
1. Introduction
The initial shareholding of a bidder in the target firm prior to bidding for the firm (the“toehold”) is a critical variable in a number of theoretical papers (e.g. Chowdhry andJagadeesh (1994)). The bidder is likely able to acquire the toehold at a substantially lowerprice per share than necessary to acquire the remaining shares in a takeover. Therefore,absent other considerations, the failure to acquire a sizable toehold would appear to beforgoing a profitable opportunity. However, in practice, we observe a wide range oftoeholds, with a substantial fraction of bidders acquiring no shares in the target prior totheir bidding.
The ability of bidders to acquire toeholds is limited by legal and market constraints. Theprimary legal constraint is the Williams Act. The Williams Act requires that anyone whopurchases a beneficial interest of 5% or more of the shares of a company has to file a form13d with the Securities and Exchange Commission (SEC) disclosing his holdings andintentions within 10 business days.1 Any substantial increase or decrease in these hold-ings, or change in intentions, require the prompt filing of an amended 13d. In practice, a1% change in holdings is considered substantial. Under the Williams Act, the initiation ofa tender offer requires the filing of a form 14d, which is the original source of toehold dataused in this paper. Once the form 14d is filed, no additional shares may be purchased onthe market. The Williams Act requires that tender offers remain open for at least 20business days, during which time shareholders may reverse their decision to tender. Fur-
Kluwer Journal@ats-ss2/data11/kluwer/journals/requ/v12n2art5 COMPOSED: 01/13/99 1:35 pm. PG.POS. 1 SESSION: 14
ther, shares tendered in an over-subscribed offer are accepted on a pro-rata basis, and anyincrease in offer price is given to all lendering shareholders.
Market constraints on a bidder’s acquisition of a toehold include the increase in pricethat large buying may cause and the ability to keep such buying secret before the threshold5% is reached and disclosure under the Williams Act is required. Bagwell (1992), in workon Dutch auction repurchase tender offers, has estimated that on average, for a firm topurchase 15% of its own shares, the firm must offer a premium of 9.1%. Bagwell’s workis consistent with an upward sloping supply curve for shares. Under this presumption,purchases by a potential bidder might increase the firm’s share price and thereby reveal thefirm to be a takeover target. If the firm is suspected to be a takeover target, any stockpurchased would have to incorporate expectations about the potential takeover bid pre-mium. On the other hand, Kyle and Vila (1991) have discussed how the presence of noisetraders may enable a bidder to acquire an initial shareholding without fully revealing theintention to bid, strengthening the theoretical argument for large initial shareholdings.
This paper examines whether or not selected theories of bidding strategy in tenderoffers are consistent with publicly available data by focusing on bidder toeholds in asample of filed tender offers. Previous research has included the toehold acquired as anindependent variable in studies of the success of a tender offer (Walkling (1985)), thepremium paid in a tender offer (Walkling and Edmister (1985)), whether the offer wasresisted by target management (Walkling and Long (1984)), and on the increase in targetstock price prior to the offer being filed (Jarrell and Poulsen (1989)). However, unlikeprior research, we examine influences on the distribution of first bidder toeholds andtherefore treat first bidder toeholds as endogenously determined. Such a presumption isconsistent with Chowdhry and Jegadeesh’s (1994) model of takeovers.
To examine influences on the distribution of first bidder toeholds, we are confrontedwith an interesting statistical problem that is shared by a number of empirical studies infinance. Specifically, the toehold is a proportion of a total that by definition ranges over theinterval [0,1].2 Prior regression analyses of such dependent variates have been conductedby either assuming that the conditional distribution is a normal distribution or by assum-ing that the conditional distribution is a censored normal distribution. Neither of thesedistributional assumptions are conceptually appropriate.
A toehold, before scaling, is only defined over the interval [0,1]. Therefore a toehold isneither normally distributed, nor the result of censoring. At best, the results of applyingregression strategies based upon these distributional assumptions to these data are that theestimators are inefficient. At worst, the estimators are biased and inconsistent.3 In eithercase, the results of applying these regression strategies to such data are potentially mis-leading. Consequently, in order to examine influences on first bidder toeholds, we mustdevelop an appropriate statistical model for bidder toeholds.
To accomplish this and address the research issues of interest, we organize the paper asfollows. In Section 2, we set out salient features of the models to be tested. In Section 3,we describe our sample and the data. In Section 4, we present univariate statistical tests ofkey hypotheses. In Section 5, we develop a regression model for toehold data based uponthe beta distribution and report the results from applying this model to our data. Finally,in Section 6, we provide a summary of our results and conclusions.
172 DANIEL ASQUITH, ROBERT KIESCHNICK
Kluwer Journal@ats-ss2/data11/kluwer/journals/requ/v12n2art5 COMPOSED: 01/13/99 1:35 pm. PG.POS. 2 SESSION: 14
Our study suggests two important results. First, we find a significantly negative uncon-ditional and conditional correlation between first bidder premiums and first bidder toe-holds, which is inconsistent with the implications of the models of Harrington and Prokop(1993), Chowdhry and Jagadeesh (1994), and Burkart (1995). Such results are, however,consistent with the models of Shleifer and Vishny (1986) and Hirshleifer and Titman(1990), and the results reported in Walking and Long (1984) and Betton and Eckbo(1994).
Second, we find evidence that the relationship between first bidder toeholds and premiamay be more complex than captured in the models of Shleifer and Vishny (1986) orHirshleifer and Titman (1990). Specifically, we find that target firm size moderates therelationship between first bidder toeholds and premia. One explanation for this effect isthe influence of firm size on bidder competition. However, we find evidence that biddercompetition does not influence first bidder toeholds in a manner consistent with thisexplanation. Consquently, additional research is required to explain the influence of firmsize on the relationship between first bidder toeholds and premia.
2. Theories related to toeholds
Grossman and Hart (1980) formulated a free rider problem in tender offers by modelinga bidder who requires control of the firm to improve the value of the firm.4 To induceshareholders to tender their shares the bidder must offer a premium over the currentmarket price. However, the shareholders know that in order for the bidder to profit, thisoffer price must be less than the value of the firm under the bidder’s control. The choicefacing an individual shareholder is whether to tender his shares at a premium over themarket price represented by the offer or to retain his shares. If the offer fails, the share-holder retains his shares, whether he tenders them or not. If the offer succeeds and hetenders, then he receives the offer price. If the offer succeeds and the shareholder retainshis shares (does not tender), he will have shares worth more than the offer price. If theshareholder is small enough that his individual decision to tender does not affect thesuccess of the offer, then not tendering is a weakly dominant strategy. However, if allshareholders individually follow the strategy of retaining their shares, then the offer willfail, despite the fact that all shareholders would be better off if the offer succeeds.Grossman and Hart suggested that to mitigate the free rider problem, shareholders ofpotential targets could allow a successful bidder to dilute the value of minority share-holders. This would enable bidders to induce shareholders to tender and resolve the freerider problem.
Shleifer and Vishny (1986) modeled a means for the bidder to profit on a tender offerdespite the free rider problem and without dilution. The bidder cannot expect to profit onthe shares acquired in the tender offer because of the free rider problem. The bidder can,however, profit on the increase in value of the shares the bidder owns prior to making theoffer (the toehold). Shleifer and Vishny assume that the value of the improvement thebidder can make to the firm is private knowledge of the bidder, but that other shareholderscan infer the expected dollar value of this improvement from the size of the bidder’s
AN EXAMINATION OF INITIAL SHAREHOLDINGS 173
Kluwer Journal@ats-ss2/data11/kluwer/journals/requ/v12n2art5 COMPOSED: 01/13/99 1:35 pm. PG.POS. 3 SESSION: 14

toehold and the fact that a bid is made. Shleifer and Vishny assume all other shareholderswill tender their shares if the bid is at least as great as the expected share value. Inequilibrium, because of the assumption that indifferent shareholders always tender, theexpected value is determined by the marginal bidder who will lose the same amount onthe shares acquired in the bid as he gains on his toehold. The bidder always bids thisexpected value (which, conditional on a bid being made and the toehold, is a constant), sothe expected profit on these shares is zero, the shareholders always tender, and all bidssucceed.
While the bidder toehold is an essential variable in Shleifer and Vishny’s model, it is nota strategic variable. In their model, a bidder with a smaller toehold requires a largerminimum dollar improvement to bid. Consequently, Shleifer and Vishny’s model impliesthat bidder toeholds should be negatively correlated with bidder premia in observed tenderoffers. Further, in Shleifer and Vishny’s model, a bidder with a zero toehold would haveto bid the maximum premium to convince existing shareholders to tender. Thus, a bidderwith zero toehold can not profit, and so will not bid. However, a large percentage of tenderoffers have a zero toehold: 62% in Bradley, Desai, and Kim (1988) and 28.82% for all firstbidders in this study.5 These data suggest a problem with Shleifer and Vishny’s model.
Hirshleifer and Titman (1990) do not assume that indifferent shareholders tender withprobability one in their model. As a result, in their mixed strategy equilibrium, offerssometimes fail. A higher bid increases the probability of the offer succeeding; thus, theamount of the premium bid becomes a signal of the bidder’s valuation of the firm undernew ownership. In equilibrium, the bidder bids the true dollar value of his expectedimprovement, conditional on a bid being made, and the amount bid is independent of thesize of the toehold. As in Shleifer and Vishny’s model, the toehold is an essential, but nota strategic variable. Larger toeholds, nevertheless, allow bidders with smaller improve-ments to profit on their bid. Consequently one should expect larger toeholds to be corre-lated with smaller premia in observed tender offers. However, Hirshleifer and Titman’smodel implies a smaller negative correlation than Shleifer and Vishny’s model does,because within their model, for a given offer, the premium is independent of the toehold.So one would expect a more dispersed pattern of premia relative to toeholds.
In contrast to the above models, Chowdhry and Jegadeesh (1994) make the toehold astrategic variable of the bidder. They make the same basic assumptions as Hirshleifer andTitman, but assume that the bidder can secretly acquire a toehold. They argue that theacquisition of a toehold will change the price at which shareholders will tender theirshares if the size of the toehold affects the shareholders’ beliefs about the value they willreceive if they retain their shares. Chowdhry and Jegadeesh derive an equilibrium inwhich acquiring a smaller toehold credibly signals a smaller improvement, which inducesshareholders to accept a lower offer price. Similarly, in equilibrium, bidders with a largerimprovement will both acquire a larger toehold and bid higher. A bidder with a largerimprovement does not try to acquire a smaller toehold and bid lower, because this in-creases the probability the offer will fail. A bidder with a smaller improvement does notacquire a larger toehold because this increases the necessary bid causing him to lose onthe acquired shares. Therefore, their model predicts smaller toeholds are associated withsmaller premia, a larger toeholds are associated with larger premia.
174 DANIEL ASQUITH, ROBERT KIESCHNICK
Kluwer Journal@ats-ss2/data11/kluwer/journals/requ/v12n2art5 COMPOSED: 01/13/99 1:35 pm. PG.POS. 4 SESSION: 14
The models of Harrington and Prokop (1993) and Burkart (1995) also predict a positiverelationship between bidder toeholds and premia, but are structured quite differently thanthe above models and do not focus on first bidder strategies. Rather, Burkart (1995)focuses upon the bidding strategies of two bidders competing for a target. Burkart showsthat the greater a bidder’s toehold, the greater a bidder’s tendency to “overbid” for the firmand thereby dissipate gains on the toehold. In contrast, Harrington and Prokop (1993)model a multistage bidding process, whereby a bidder revises his or her bid after failingto buy enough shares to acquire the firm. Thus a bidder’s toehold alternatively influencesand is influenced by a bidder’s premia.
3. Description of the data
3.1 Sample selection and data sources
The sample for this study was based upon the 1980–1986 Tender Offer Statistics collectedby Douglas Austin & Associates, Inc. This consists of 827 records of tender offers filedwith the Securities and Exchange Commission on form 14d. A 14d filing contains detailsof the offer including the bidder’s shareholding in the target firm on the filing date. Byusing this source, we are only using those tender offers actually filed.
The distinction between a bid and a filed tender offer is an important one. There is noformal definition of what constitutes a takeover bid. If a “raider” approaches a target andoffers a specific dollar amount per share to target management for the firm, this wouldprobably constitute a bid. If the management refused and the raider threatened to take hisoffer directly to the shareholders, this is still a bid. Such bids frequently appear in the WallStreet Journal as “proposed a tender offer” or “threatened a hostile tender offer.” Until theoffer is actually made to the shareholders and filed with the SEC, it is not legally a tenderoffer and does not appear in this sample.
There is a selection bias in measuring toeholds and other variables for only those tenderoffers filed. Tender offers that were considered but not actually filed are not represented.For example, many targets in this sample have only one tender offer filed, but havemultiple bidders when a bid is defined as above. A possible way for correcting for this biaswould be to start with 13d filings. However, since approximately 50% of the filed offershave less than a 5% toehold on the 14d filing date, no 13d would be filed on these offers.Additionally, the 10-day window for filing a 13d means that the 14d filing will sometimesprecede the 13d filing. Consequently, while there are problems with using filed tenderoffers to identify bids, we do not know of a better alternative that would also allow us tomeasure bidder toeholds.
Of the original 827 filed offers, 30 could not be used for the following reasons. Nine-teen offers were removed because they were not independent offers, but simply themultiple filing of forms for the same contest or data errors. Three were defensive offers bythe target firm or a party controlled by the target firm. Four were for a unit of the target
AN EXAMINATION OF INITIAL SHAREHOLDINGS 175
Kluwer Journal@ats-ss2/data11/kluwer/journals/requ/v12n2art5 COMPOSED: 01/13/99 1:35 pm. PG.POS. 5 SESSION: 14
firm only, and therefore more similar to buying a unit than a takeover. Four were recurringpartial tender offers for a single firm, Life Investors, by a Dutch firm, that acquired controlin a 1981 offer. The original offer is included but the follow-up offers are not.
Additional filed offers were deleted from our sample due to a lack of data. Specifically,to calculate premia, prices are taken from the Center for Research in Security Prices(CRSP) tapes. 103 events were lost because a CUSIP could not be identified for the targetfirm; 31 were lost because, although a CUSIP was identified, no prices were found on theCRSP tapes for the relevant time period; 2 were lost because they began trading less than60 trading days before the offer; and 52 of the remaining offers were removed because, asprimarily cash offers, their premia could not be reliably computed. The above exclusionsreduced our sample to 609 offers.
Finally, for this sample of 609 tender offers, we excluded those filed tender offers thatwere by management (19) or represented a second or subsequent bidder (129).6 Our finalsample represents 461 tender offers made by first bidders from 1980 through 1986. Weexclude management buyout offers because the models we are testing focus on the bid-ding strategy of an outside bidder for a firm. Thus, management’s shareholdings in thetarget prior to the bid, would be determined by factors other than those considered in themodels we are testing. Similarly, we exclude filed offers of second bidders from oursample because the models we are testing focus primarily upon first bidder strategies.7
Whether a filed offer was made by the first bidder or a subsequent bidder was determinedby examination of the Wall Street Journal Index, and in some cases, the Wall StreetJournal for stories about the target firms.
3.2 Classification of tender offers
We define an “opposed” offer as an offer where, at any point in the process, the targetmanagement announced that the offer was not in the best interests of shareholders and/ortook defensive steps against the offer. All other offers are classified as “not opposed.” Aproblem in the tender offer data is that while the typical discussion of tender offers is ofhostile tender offers, the majority of offers are not opposed (289 out of 461 in our sample).Further, the opposed/not opposed dichotomy may be empirically misleading. Offers clas-sified as “not opposed” range from a way of implementing an agreed merger to an offerwhere the target management announces they are taking no official position on the offer.Opposed offers range from the offer is inadequate (often changed to support for anincreased offer) to definite action against the bidder, including lawsuits under securitiesand anti-trust laws, “poison pills” and “Pac-man” defenses, and searches for whiteknights. Furthermore, it is incorrect to assume that all negotiated tender offers arefriendly. Negotiation may vary from an amicable exchange of information to bitter dis-agreements where the target acquiesces only because of pressure exercised by the bidder.Thus, negotiated and friendly may not be synonymous.
Walkling and Long (1984) recognized the problems with this dichotomy and defined as“acquiescent” offers those that were originally opposed but later agreed to by managementwhen a higher premium was offered. They found no major difference in their results when
176 DANIEL ASQUITH, ROBERT KIESCHNICK
Kluwer Journal@ats-ss2/data11/kluwer/journals/requ/v12n2art5 COMPOSED: 01/13/99 1:35 pm. PG.POS. 6 SESSION: 14
these offers were included as either opposed or not opposed. However, acquiescent offersalso run the gamut of opposition. The wide range and often bidder-specific nature ofdefensive tactics, combined with difficulty of predicting the effectiveness of tactics asevidenced by the range of tactics used in acquiescent offers, makes improving on theopposed/not opposed dichotomy difficult. Further, relying on a finer distinction may alsobe subject to reporting biases.
3.3 Measurement of the tender offer premium
We measure the tender offer premium as the initial offer price (PIOP) minus the stock pricebefore the offer (PB-60) divided by the stock price before the offer (PB-60). We use as ourmeasure of the target’s stock price before the offer, PB-60, the stock price of the target 60trading days prior to a “base” date (defined below). We use the initial price proposed bythe bidder as the offer price because we feel it to be more conceptually consistent withsome of the models we are testing. However, we also computed premiums based upon thefinal offer price and found no change in the inferences drawn.8
The “base” date used in this paper to calculate premiums is the earlier of the trading daybefore news of a potential offer first appeared in the Wall Street Journal or the 14d filingdate. A potential problem with adjusting this date for earlier news or rumors is that rumorsmay be false. While most of the market reaction will occur when the rumor arises, somemay occur afterwards. Pound and Zeckhauser (1990) found that takeover rumors in theWall Street Journal’s “Heard on the Street Column” often proved false and that buyingrumored targets produced significantly positive returns in those firms subsequently takenover, but zero returns overall.
Previous research has used a shorter window for calculating premia. Walkling (1985)and Walkling and Edmister (1985) used a premium based on the target stock price 14 days(10 trading days) before the offer was filed with the SEC. Both papers also corrected thedate for prior announcements in Wall Street Journal, but again used a 14-day window.Walkling and Long (1985) use only the corrected 14 day premium. Walkling, Walklingand Edmister, and Walkling and Long are based on Austin Data from 1972–1977. Com-ment and Jarrell (1987) and Jarrell and Poulsen (1989) used 20 trading days, but Jarrelland Poulson used a special news-adjusted event date which was prior to the usual WallStreet Journal announcement date.
We chose a combination of a news-adjusted “base” date and a long window to capturethe full premium offered. Since we used a long period, we have adjusted the premium forchanges in the market over this period. For NYSE and AMEX we have subtracted the S&P500 index change over this period; for NASDAQ firms we used the NASDAQ compositeindex. All stock prices and stock indices were taken from the CRSP tapes, and so S&P 500index and NASDAQ composite index returns do not include dividends. Since targetreturns reflect changes in target share prices, an adjustment for market wide price changeswas deemed appropriate. For the total sample of 461 first bidder tender offers, the mean
AN EXAMINATION OF INITIAL SHAREHOLDINGS 177
Kluwer Journal@ats-ss2/data11/kluwer/journals/requ/v12n2art5 COMPOSED: 01/13/99 1:35 pm. PG.POS. 7 SESSION: 14
premium (in %) was 44.14 with a standard deviation of 35.57. For the subsample of firstbidders opposed by management, the mean premium was 40.61% with a standard devia-tion of 28.46.
3.4 Measurement of target size
We also used data from the CRSP tapes to calculate for each sample tender offer the targetfirm size, which we defined as total share value of common shares 60 days before the basedate (PB-60 x common shares outstanding). One reason we consider this variable is that itproxies for a bidder’s cost of acquiring a toehold, which is why we measure firm size bythe market value of its equity rather than by the market value of its debt and equity. Fora given percent toehold, the larger the market value of the firm the greater the cost ofacquiring that toehold. Thus, if the cost of acquiring a toehold influences the size of thefirst bidder’s toehold, then target size should be a determinant of first bidder toeholds.Because of skewness in the distribution of target sizes, we use the natural logarithm offirm size (LNSIZE) in subsequent statistical analysis. For the sample of 461 first bidders,the mean LNSIZE was 11.15 with a standard deviation of 1.77. For the subsample of firstbidders opposed by management, the mean LNSIZE was 11.65 with a standard deviationof 1.89.
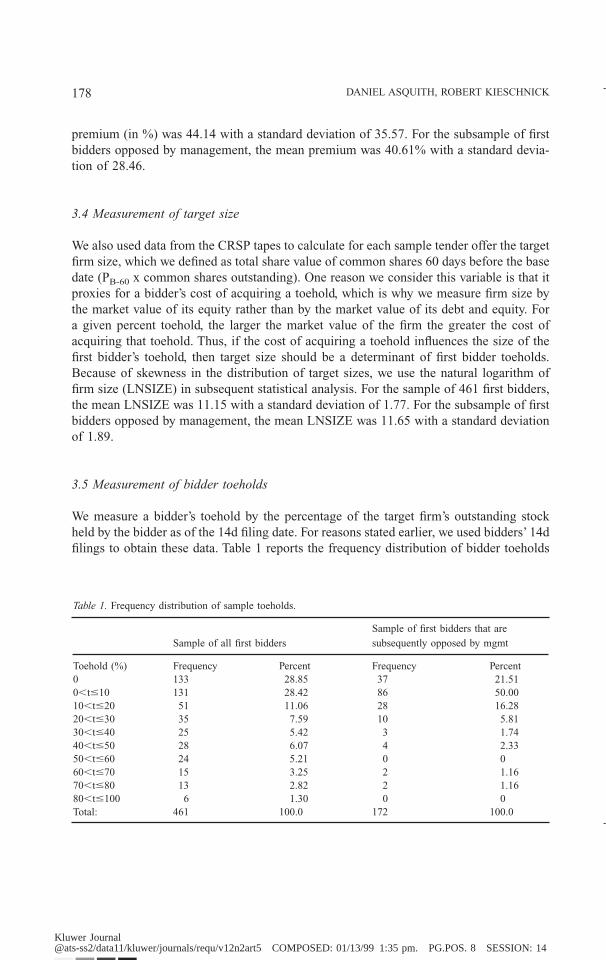
3.5 Measurement of bidder toeholds
We measure a bidder’s toehold by the percentage of the target firm’s outstanding stockheld by the bidder as of the 14d filing date. For reasons stated earlier, we used bidders’ 14dfilings to obtain these data. Table 1 reports the frequency distribution of bidder toeholds
Table 1. Frequency distribution of sample toeholds.
Sample of all first bidders
Sample of first bidders that are
subsequently opposed by mgmt
Toehold (%) Frequency Percent Frequency Percent0 133 28.85 37 21.510,t#10 131 28.42 86 50.0010,t#20 51 11.06 28 16.2820,t#30 35 7.59 10 5.8130,t#40 25 5.42 3 1.7440,t#50 28 6.07 4 2.3350,t#60 24 5.21 0 060,t#70 15 3.25 2 1.1670,t#80 13 2.82 2 1.1680,t#100 6 1.30 0 0Total: 461 100.0 172 100.0
178 DANIEL ASQUITH, ROBERT KIESCHNICK
Kluwer Journal@ats-ss2/data11/kluwer/journals/requ/v12n2art5 COMPOSED: 01/13/99 1:35 pm. PG.POS. 8 SESSION: 14
for the sample of first bidder tender offers and for the subsample of opposed first biddertender offers. Separate from the issues discussed earlier with the use of these data, wewish to draw the reader’s attention to three other aspects of these data revealed in Table 1.
First, these frequency distributions are highly skewed and include a large number ofzero toehold observations. Thus these data do not appear to be drawn from a normaldistribution. A Shapiro-Wilk’s W test confirms this impression for both samples at the 1%level. Consequently we must recognize the non-normality of the distribution of toeholddata in testing hypotheses about these data.
Second, there are substantial number of zero toeholds in both the full first bidder tenderoffer sample and the opposed first bidder tender offer subsample. Consequently, even inopposed offers, some first bidders are choosing to forgo potential profit on a toehold in thetarget in exchange for some other benefit, presumably strategic.
Third, there are a number of observations in both samples for which the first bidderpossesses a toehold in excess of 40% on the 14d filing date. While some of these obser-vations may not represent the kinds of transactions the models we are testing weredesigned to address, we can not say a priori which observations. Thus, we choose not todelete them for concern over introducing another source of sample selection bias into ourtests. Further, these observations may simply reflect the point made earlier that a biddercan acquire a significant number of additional shares in the target within the 13d’s 10-daywindow, and end up filing a 14d before filing a 13d.
4. Univariate tests of hypotheses
We first conduct two simple tests of the ideas set out above by examining the uncondi-tional correlations between bidder toeholds and premia, and between bidder toeholds andtarget sizes.
4.1 The relationship between toeholds and tender offer premia
Shelifer and Vishny (1986) and Hirshleifer and Titman (1990) predict that larger toeholdsare associated with smaller premia. However, since the premium bid in Hirshleifer andTitman’s model is not directly linked to the toehold, the bid premia may vary more for agiven toehold. On the other hand, larger toeholds are associated with larger premia inHarrington and Prokop (1993), Chowdhry and Jegadeesh (1994), and Burkart (1995).
To test these conflicting predictions, we examine the Kendall’s Tau-b correlation coef-ficient between toeholds and tender offer premia. We use this nonparametric measure ofcorrelation since we have shown that the assumption (i.e., bivariate normality) underlyingtests using the Pearson correlation coefficient are violated by these data. For our fullsample of 461 first bidder tender offers, the Kendall’s Tau-b coefficient between toeholdsand tender offer premia is -0.056 which is significantly different for zero at the 7% level.For our opposed first bidder subsample, Kendall’s Tau-b coefficient between toeholds andtender offer premia is -0.057 which is significantly different from zero at a level less than
AN EXAMINATION OF INITIAL SHAREHOLDINGS 179
Kluwer Journal@ats-ss2/data11/kluwer/journals/requ/v12n2art5 COMPOSED: 01/13/99 1:35 pm. PG.POS. 9 SESSION: 14
7%.9 Consequently, the unconditional correlations between first bidder toeholds and pre-mia are more consistent with the models of Shleifer and Vishny (1986) and Hirshleiferand Titman (1990) than with Harrington and Prokop (1993), Chowdhry and Jagadeesh(1994), and Burkart (1995). Further, the low correlations may suggest that the data aremore consistent with Hirshleifer and Titman’s model than with Shleifer and Vishny’smodel.
4.2 The relationship between toeholds and firm size
As mentioned earlier, the cost of acquiring a given percent toehold will go up with firmsize. Further, firm size can also influence bidder competition by limiting the set of firmsthat could reasonably get financing and make a bid. For these reasons we expect that thelarger the firm size the smaller the toehold. To test for such a relationship, we examineKendall’s Tau-b coefficient between toeholds and firm size (where firm size is proxied byLNSIZE) for our two samples. For the sample of first bidders, this coefficient is -0.063and for the subsample of opposed first bidders this coefficient is -0.091, both of whichdiffer significantly from zero with p-values less than 4%.10 Thus, as expected, we inferthat first bidder toeholds are negatively correlated with target size.
5. Multivariate tests of hypotheses
One obvious criticism of the above tests is that they fail to account for other influences onthe relationships in question, and particularly the joint variation of variables. Conse-quently we turn to multivariate tests of the conditional relationship between first bidderpremia and toeholds.
5.1 Regression model
We showed earlier that the data reject the hypothesis that first bidder toeholds, the de-pendent variable in our analysis, are normally distributed. Thus a normal regressionmodel, whether linear or nonlinear, is inappropriate for studying influences on first biddertoeholds.11 Further, since first bidder toeholds are only defined over the interval [0,1]rather than being observationally censored to range over this interval, the two limit Tobitregression model, which has been applied to regression analysis of other proportionalvariables in finance, is inappropriate for the analysis of these data.12
One of the standard models assumed for random variables on the interval [0,1] is thebeta distribution. Johnson, Kotz, and Balakrishnan (1995) provide over dozen examplesfrom different social and physical sciences in which the beta distribution was found to bea better fitting distribution for the continuously measured proportional data under studythan considered alternatives. Consequently, there is precedent in the literature for usingthe beta distribution as a distributional model for continuously measured proportionaldata.
180 DANIEL ASQUITH, ROBERT KIESCHNICK
Kluwer Journal@ats-ss2/data11/kluwer/journals/requ/v12n2art5 COMPOSED: 01/13/99 1:35 pm. PG.POS. 10 SESSION: 14
To develop a regression model based upon a distributional assumption that biddertoeholds are distributed as beta random variates we use concepts from the generalizedlinear model literature.13 A generalized linear model typically comprises three compo-nents:
(1) Independent response variables y1, y2, …, yn which share the same form of parametricdistribution from the exponential family.
(2) A qx1 vector of parameters b and an nxq model matrix X.(3) A monotone and differentiable link function g(.) that defines the relationship between
E(yi) 5 µi and xi • b, i.e. g(µi) 5 xi • b.
Most generalized linear models presume that y is distributed as:
ƒ(y i ; u i, f) 5 exp F(y i u i 2 b(u i))
a i (f)1 c(y i, f)G (1)
When f is known, then equation (1) is an instance of the class of linear exponentialmodels. When is f unknown, then equation (1) is an instance of the class of exponentialdispersion models.
While the beta distribution is a member of the exponential family of distributions, it isnot a member of either of the above exponential classes and so does not fit the typicalgeneralized linear model assumptions. Rather, the beta distribution is an instance of theclass of exponential models that fit the following form:
ƒ(y i; u) 5 exp @a(u)b(y i) 1 c(y i) 1 d(u)# (2)
More specifically, the two parameter beta distribution expressed in exponential form is:
ƒ(y i ; u) 5 exp F(b 2 1) 1n (y i) 1 1nSy ia 2 1
G (a) D 1 ln SG (a 1b)G(b) DG (3)
Thus we must turn to extensions of the generalized linear model framework profiled inGay and Welsch (1988) to develop an estimable regression model based upon the assump-tion that bidder toeholds are conditionally distributed as two parameter beta randomvariates.
We begin by assuming that the yi are i.i.d. for i 5 1, …, n and that the conditionalexpectation of yi can be expressed as:
E (y i ? X i) 5 µ i. (4)
AN EXAMINATION OF INITIAL SHAREHOLDINGS 181
Kluwer Journal@ats-ss2/data11/kluwer/journals/requ/v12n2art5 COMPOSED: 01/13/99 1:35 pm. PG.POS. 11 SESSION: 14
Since the model matrix, X, and the parameter vector, b, are determined by the specificapplication under consideration we defer specification of these elements of a beta regres-sion model to section 5.2 below. The next elements we need to specify are:
µ i 5 h(hi) 5 h(x i • b) where hi 5 xi • b , and (5)
hi 5 g(µi). (6)
The response function, h (.), is a one-to-one and sufficiently smooth function, and the linkfunction, g(.), its inverse. One possibility is to follow a traditional linear regressionspecification and use the identity response and link functions. Unfortunately, such anapproach is inappropriate because of the implied conditional mean can take values over R,rather than over [0,1], the proper range for these data. This is the same kind of problemfaced by applying the linear probability model to the analysis of binary data.14
Consequently we need to specify a nonlinear response function and a nonlinear linkfunction. We use the logit link specification because it is consistent with prior researchpractice and because it provides a flexible functional relationship that we can exploit inspecifying the estimated model.15 Specifically, we use the following re-expression forequation (5):
µ i 5 h(hi) 51
1 1 exp(2hi)5
11 1 exp(2xi • b)
. (7)
This equation then implies the following re-expression of equation (6) as :
hi 5 g(µi) 5 1nS µ i
1 2 µiD. (8)
Note that this specification restricts the conditional mean of a beta distributed regressandto the interval (0,1), which is appropriate.
In order to derive an estimable regression model using the maximum likelihood prin-ciple, we must now relate the above relationships to the parameters of the beta distribu-tion. Specifically, for the beta distribution defined in (6), we have:
E(yi) 5p
p 1 q. (9)
We now must map h́i to either p or q, i.e. we must treat one or the other parameter as afunction of xi, in order to develop a log-likelihood function for the beta regression model.
We will map xi • b into q for two important reasons. First, q is the shape parameter forthe beta distribution. Second, a priori considerations may force the researcher to specifya particular value for p. For example, if one is to allow zero proportions for finite valuedregressors, then one will need to assume that p 5 1.
182 DANIEL ASQUITH, ROBERT KIESCHNICK
Kluwer Journal@ats-ss2/data11/kluwer/journals/requ/v12n2art5 COMPOSED: 01/13/99 1:35 pm. PG.POS. 12 SESSION: 14
Given this assumed mapping, we develop the following expression for q that is con-sistent with equation (9) above:
q(xi) 5 p exp (2xi • b ). (10)
We then substitute this expression for q into the following expression of the conditionaldistribution of beta distributed random variate:
ƒ(yi ? Xi) 5 F G (p 1 q(Xi))
G (p) G (q(Xi))G yi
p21 (1 2 yi)q(Xi) 2 1. (11)
To estimate the effect of the different conditioning variables (x1, …, xr) we use themaximum likelihood estimation principle to derive estimates of the vector b by maximiz-ing the above log-likelihood function with respect to the parameters b and p. Again, forproblems which must allow for zero valued proportions, p must equal 1, and we need onlyestimate b in these cases.
Thus the appropriate log-likelihood function will depend upon any a priori restrictionswe place on p. For the general case, we have (ignoring constant terms):
1n ƒ(y i ? x i) 5 1n G (p 1 p e 2xi • b) 21n G (p) 2 1n G (p e 2xi • b )1 (p 2 1) 1n (y i) 1 (pe 2xi •b 2 1) 1n (1 2 y i).
(12)
We will use the above log-likelihood expression to estimate a beta regression model forour first bidder toehold data. Because the beta distribution is a member of the exponentialclass of distributions, these maximum likelihood estimators have all the mathematical andstatistical properties established for maximum likelihood estimators for this class of dis-tributions.16
5.2 Regression results
Using the above statistical model (equations 10 and 11), we test the influence of firstbidder premia (PREM) and target firm size (LNSIZE) on bidder toeholds in tender offersusing the following specification:
x i • b 5 b 1 (Premium) 1 b 2 (Firm Size) 1 b 3 (Premium , Firm Size). (13)
We have already pointed out reasons why first bidder premia and target firm size mayconceptually influence bidder toeholds, and we have presented evidence of significantunconditional correlations between these variables and first bidder toeholds. We includean interaction term between first bidder premia and target firm size for two reasons.
AN EXAMINATION OF INITIAL SHAREHOLDINGS 183
Kluwer Journal@ats-ss2/data11/kluwer/journals/requ/v12n2art5 COMPOSED: 01/13/99 1:35 pm. PG.POS. 13 SESSION: 14
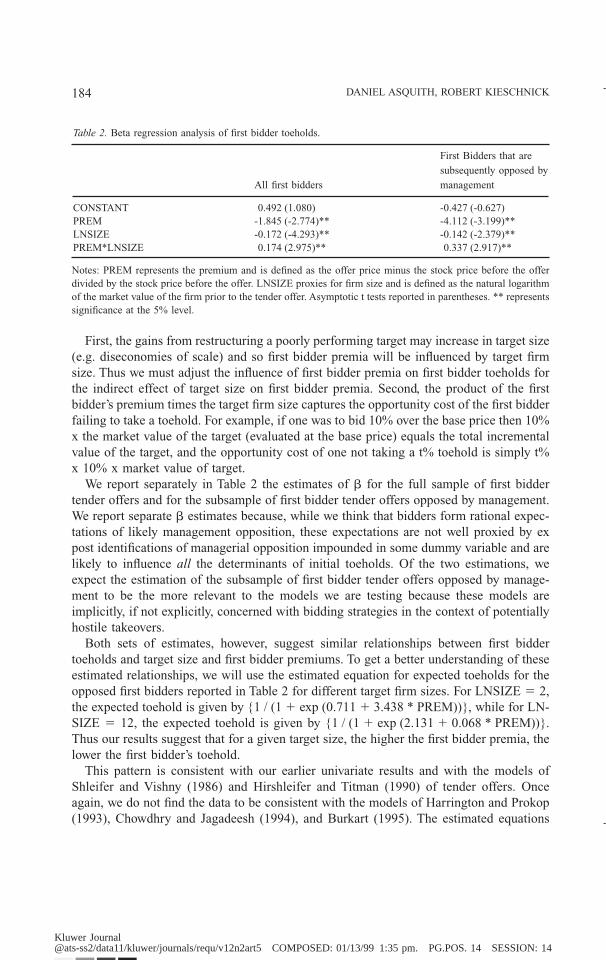
First, the gains from restructuring a poorly performing target may increase in target size(e.g. diseconomies of scale) and so first bidder premia will be influenced by target firmsize. Thus we must adjust the influence of first bidder premia on first bidder toeholds forthe indirect effect of target size on first bidder premia. Second, the product of the firstbidder’s premium times the target firm size captures the opportunity cost of the first bidderfailing to take a toehold. For example, if one was to bid 10% over the base price then 10%x the market value of the target (evaluated at the base price) equals the total incrementalvalue of the target, and the opportunity cost of one not taking a t% toehold is simply t%x 10% x market value of target.
We report separately in Table 2 the estimates of b for the full sample of first biddertender offers and for the subsample of first bidder tender offers opposed by management.We report separate b estimates because, while we think that bidders form rational expec-tations of likely management opposition, these expectations are not well proxied by expost identifications of managerial opposition impounded in some dummy variable and arelikely to influence all the determinants of initial toeholds. Of the two estimations, weexpect the estimation of the subsample of first bidder tender offers opposed by manage-ment to be the more relevant to the models we are testing because these models areimplicitly, if not explicitly, concerned with bidding strategies in the context of potentiallyhostile takeovers.
Both sets of estimates, however, suggest similar relationships between first biddertoeholds and target size and first bidder premiums. To get a better understanding of theseestimated relationships, we will use the estimated equation for expected toeholds for theopposed first bidders reported in Table 2 for different target firm sizes. For LNSIZE 5 2,the expected toehold is given by {1 / (1 1 exp (0.711 1 3.438 * PREM))}, while for LN-SIZE 5 12, the expected toehold is given by {1 / (1 1 exp (2.131 1 0.068 * PREM))}.Thus our results suggest that for a given target size, the higher the first bidder premia, thelower the first bidder’s toehold.
This pattern is consistent with our earlier univariate results and with the models ofShleifer and Vishny (1986) and Hirshleifer and Titman (1990) of tender offers. Onceagain, we do not find the data to be consistent with the models of Harrington and Prokop(1993), Chowdhry and Jagadeesh (1994), and Burkart (1995). The estimated equations
Table 2. Beta regression analysis of first bidder toeholds.
All first bidders
First Bidders that are
subsequently opposed by
management
CONSTANT 0.492 (1.080) -0.427 (-0.627)PREM -1.845 (-2.774)** -4.112 (-3.199)**LNSIZE -0.172 (-4.293)** -0.142 (-2.379)**PREM*LNSIZE 0.174 (2.975)** 0.337 (2.917)**
Notes: PREM represents the premium and is defined as the offer price minus the stock price before the offerdivided by the stock price before the offer. LNSIZE proxies for firm size and is defined as the natural logarithmof the market value of the firm prior to the tender offer. Asymptotic t tests reported in parentheses. ** representssignificance at the 5% level.
184 DANIEL ASQUITH, ROBERT KIESCHNICK
Kluwer Journal@ats-ss2/data11/kluwer/journals/requ/v12n2art5 COMPOSED: 01/13/99 1:35 pm. PG.POS. 14 SESSION: 14
also suggest, however, that this relationship diminishes as the target firm size grows. Inessence, the larger the target firm size the smaller the toehold a first bidder can beexpected to take for all expected premia.
One reasonable explanation for this pattern is that target firm size influences biddercompetition, and thereby the relationship between first bidder toeholds and premia. If theobserved pattern is due to the effect of target firm size on bidder competition, then ourresults are inconsistent with Hirshleifer and Titman’s model of tender offers, becausetypically, the larger the firm the less competition there is for it. Further, in Hirshleifer andTitman’s model, if a first bidder expects competition, then the first bidder should take azero toehold.
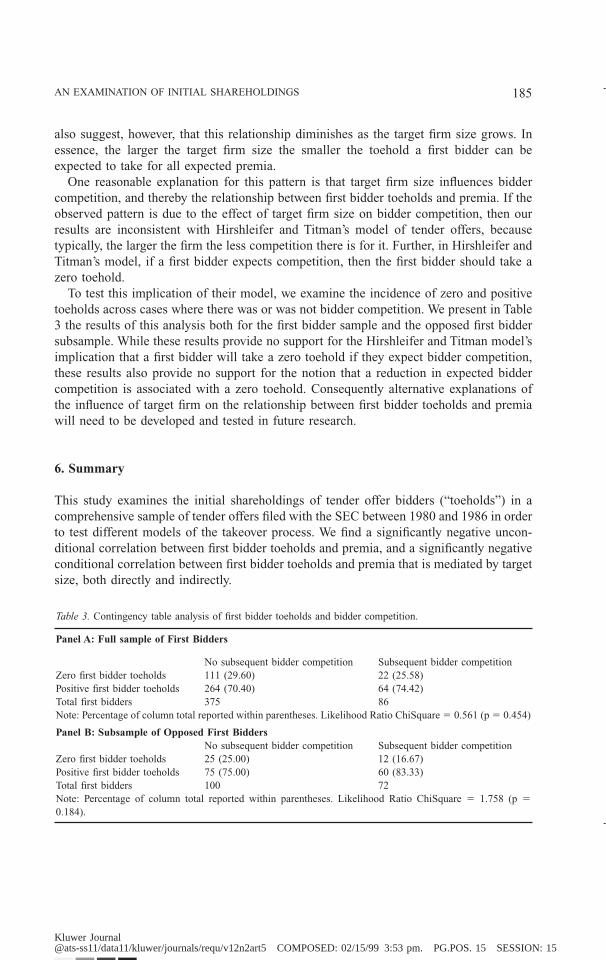
To test this implication of their model, we examine the incidence of zero and positivetoeholds across cases where there was or was not bidder competition. We present in Table3 the results of this analysis both for the first bidder sample and the opposed first biddersubsample. While these results provide no support for the Hirshleifer and Titman model’simplication that a first bidder will take a zero toehold if they expect bidder competition,these results also provide no support for the notion that a reduction in expected biddercompetition is associated with a zero toehold. Consequently alternative explanations ofthe influence of target firm on the relationship between first bidder toeholds and premiawill need to be developed and tested in future research.
6. Summary
This study examines the initial shareholdings of tender offer bidders (“toeholds”) in acomprehensive sample of tender offers filed with the SEC between 1980 and 1986 in orderto test different models of the takeover process. We find a significantly negative uncon-ditional correlation between first bidder toeholds and premia, and a significantly negativeconditional correlation between first bidder toeholds and premia that is mediated by targetsize, both directly and indirectly.
Table 3. Contingency table analysis of first bidder toeholds and bidder competition.
Panel A: Full sample of First Bidders
No subsequent bidder competition Subsequent bidder competitionZero first bidder toeholds 111 (29.60) 22 (25.58)Positive first bidder toeholds 264 (70.40) 64 (74.42)Total first bidders 375 86Note: Percentage of column total reported within parentheses. Likelihood Ratio ChiSquare 5 0.561 (p 5 0.454)
Panel B: Subsample of Opposed First BiddersNo subsequent bidder competition Subsequent bidder competition
Zero first bidder toeholds 25 (25.00) 12 (16.67)Positive first bidder toeholds 75 (75.00) 60 (83.33)Total first bidders 100 72Note: Percentage of column total reported within parentheses. Likelihood Ratio ChiSquare 5 1.758 (p 50.184).
AN EXAMINATION OF INITIAL SHAREHOLDINGS 185
Kluwer Journal@ats-ss11/data11/kluwer/journals/requ/v12n2art5 COMPOSED: 02/15/99 3:53 pm. PG.POS. 15 SESSION: 15
These findings have several important implications. First, the significantly negativeunconditional and conditional correlations between first bidder premiums and first biddertoeholds are consistent with the models of Shleifer and Vishny (1986) and Hirshleifer andTitman (1990) and inconsistent with the models of Harrington and Prokop (1993),Chowdhry and Jagadeesh (1994), and Burkart (1995). Further, our evidence is consistentwith findings in Walking and Long (1984) and Betton and Eckbo (1994). This consistencyof evidence is especially interesting because these alternative studies model the statisticalrelationship between bidder premiums and bidder toeholds differently than we do. Walk-ing and Long (1984) model first bidder toeholds as exogenous and first bidder premiumsas endogenous. Betton and Eckbo (1994) model first bidder toeholds and premia asexogenous to event transition probabilities and state-contingent payoffs.
Second, while our results are generally consistent with the models of Shleifer andVishny (1986) and Hirshleifer and Titman (1990), we find evidence that the relationshipbetween first bidder toeholds and premia is more complex than captured in these models.Specifically, we find that target firm size significantly influences this relationship. Oneexplanation for this complexity is the influence of target firm size on bidder competition.The data we examine, however, do not provide support for this explanation. Consequently,future research is required to explain this complexity and better understand the choice oftoehold taken in a target.
Acknowledgments
We would like to thank Jim Brandon, David Hirshleifer, Andrew Dick, William Klein,Bruce McCullough, Tim Opler, Ivan Png, Maggie Queen, Eric Rasmussen, SheridanTitman, J. Fred Weston, and the anonymous reviewers for helpful comments. HalehNaimi, Jessica Iversen, Kee Foong, Scott Newman, and Vicky Tang provided excellentresearch assistance. Financial support from the Research Program in Competition andBusiness Policy at UCLA and General Motors and ALCOA Foundation Doctoral Fellow-ships is gratefully acknowledged. The views expressed in this paper are neither those ofDeloitte & Touche LLP nor those of the Federal Communications Commission.
Notes
1. It is important to recognize that a potential bidder can continue to purchase stock during the 10 day periodbefore they file the 13d and thus they are not limited to a 5% holding. Further, they can accumulate a ratherlarge shareholding before filing a 14D statement simply by continuing to file amended 13d statements.
2. Or the interval [0,100], depending upon scaling. This same attribute is shared by a number of studies of afirm’s capital structure (e.g. Bradley, Jarrell, and Kim (1984) or Titman and Wessels (1988)), the firm’s mixof private versus public debt (e.g. Easterwood and Kadapakkam (1991)), and the firm’s dividend policy (e.g.Dempsey and Laber (1992)).
3. See Amemiya (1985) for further discussion of these issues.4. For much more detailed discussions of the free rider problem and various “solutions”, see Weston, Chung
and Hoag (1990) (Appendix A & B) or Hirshleifer (1992).
186 DANIEL ASQUITH, ROBERT KIESCHNICK
Kluwer Journal@ats-ss2/data11/kluwer/journals/requ/v12n2art5 COMPOSED: 01/13/99 1:35 pm. PG.POS. 16 SESSION: 14
5. Bradley, Desai, and Kim’s data is for the period 1963–1984 and only includes successful bids.6. Of the 609 filed offers, 475 were made by the first bidder. Of the 134 filed offers not made by the first bidder,
5 were made by management and 35 were opposed.7. Including filed offers of second or subsequent bidders does not change any inferences drawn in this paper.
Interestingly, the conditional and unconditional negative correlations reported between bidder premia andtoeholds are larger for both opposed and unopposed offers when we include filed offers of second biddersin the sample.
8. In fact, our empirical inferences are strengthened, especially the negative correlation between bidder toe-holds and premia, when we use this second measure of premiums. This second premium measure is similarto the premium measure in Schwert (1996), which focused upon premiums paid.
9. Using our second premium measure, the Kendall Tau-b between toeholds and premia is -0.11 for the fullsample and -0.12 for the opposed first bidder subsample. Each of these correlations is significantly differentfrom zero at the 1% level.
10. The correlation between bidder toeholds and target firm sizes for the sample of all bidders (first andsubsequent) less management buyouts (590 filed offers) is -0.082 which is significantly different from zeroat the 1% level.
11. The estimators of a normal, linear or nonlinear, regression model when applied to the present data can bebiased and inefficient. See Ameniya (1985), Chapter 2, for a discussion of the effects of applying the normalregression model to non-normally distributed dependent variables.
12. See Rajan and Zingales (1995) for an example of the application of the two limit Tobit regression model tothe analysis of a proportional random variate. See Maddala (1991) for a discussion of the inapplicability ofthe two limit Tobit regression model for proportional data.
13. See McCullagh and Nelder (1989) or Fahrmeir and Tutz (1994) for surveys of this literature.14. See Greene (1997), page 873 for further discussion of this and other problems with the linear probability
model.15. Ramanathan (1993) presents the logit model for regression analysis of proportional data. This model, which
is a nonlinear normal regression model, is roughly consistent with a logistic response function and a logitlink function. However, as shown earlier, the distributional assumption underlying this model is inappro-priate for the bidder toehold data. This conclusion is reinforced by the number of zero toeholds in thesamples under study.
16. See Fahrmeir and Tutz (1994) for further discussion of these issues.
References
Amemiya, T., Advanced Econometrics. Cambridge: Havard University Press, (1985).Douglas Austin & Associates, Inc., 1980–86 Tender Offer Statistics, (1988).Bagwell, Laurie Simon, “Dutch Auction Repurchases: An Analysis of Shareholder Heterogeneity.” Journal of
Finance 47, 71–106, (1992).Betton, Sandra and B. Espen Eckbo, “Toeholds, Competition, and State-Contingent Payoffs in Tender Offers.”
unpublished working paper presented at the 1995 AFA meetings, (1994).Bradley, Michael, G. Jarrell, and E. Han Kim, “On the Existence of an Optimal Capital Structure: Theory and
Evidence.” Journal of Finance 39, 857–880, (1984).Bradley, Michael, A. Desai, and E. Han Kim, “Synergistic gains from corporate acquisition and their division
between the stockholders of target and acquiring firms.” Journal of Financial Economics 21, 3–40, (1988).Burkart, Mike, “Initial Shareholdings and Overbidding in Takeover Contests.” Journal of Finance 50,
1491–1515, (1995).Center for Research in Security Prices. Stock Files. 1990.Chowdhry, B. and N. Jagadeesh, “Pre-Tender Offer Share Acquisition Strategy in Takeovers.” Journal of Finan-
cial and Quantitative Analysis 29, 117–129, (1994).
AN EXAMINATION OF INITIAL SHAREHOLDINGS 187
Kluwer Journal@ats-ss2/data11/kluwer/journals/requ/v12n2art5 COMPOSED: 01/13/99 1:35 pm. PG.POS. 17 SESSION: 14
Comment, Robert and Gregg A. Jarrell, “Two Tier and Negotiated Tender Offers: The Imprisonment of Free-Riding Shareholders.” Journal of Financial Economics 19, 283–310, (1987).
Dempsey, S.J. and G. Laber, “Effects of Agency and Transaction Costs on Dividend Payout Ratios: FurtherEvidence of the Agency-Transaction Cost Hypothesis.” Journal of Financial Research 40, 317–321, (1992).
Easterwood, J.C. and P. Kadapakkam, “The Role of Private and Public Debt in Corporate Capital Structures.”Financial Management 20, 49–57, (1991).
Fahrmeir, L. and G. Tutz, Multivariate Statistical Modelling Based on Generalized Linear Models, New York:Springer-Verlag, (1994).
Gay, David M. and Roy E. Welsch, “Maximum Likelihood and Quasi-Likelihood for Nonlinear ExponentialFamily Regression Models.” Journal of the American Statistical Association 83, 990–998, (1988).
Grossman, Sanford J. and Oliver D. Hart, “Takeover Bids, the Free Rider Problem and the Theory of theCorporation.” Bell Journal of Economics 11, 42–64, (1980).
Greene, William, Econometric Analysis, Upper Saddle River: Prentice-Hall, Inc., (1997).Harrington, Joseph E. (Jr) and Jacek Prokop, “The Dynamics of the Free-Rider Problem in Takeovers.” Review
of Financial Studies 6, 851–882, (1993).Hirshleifer, David, “Mergers and Acquisitions: Strategic and Informational Issues.” Working Paper # 16–92,
AGSM—UCLA, (1992).Hirshleifer, David and Sheridan Titman, “Share Tendering Strategies and the Success of Hostile Takeover Bids.”
Journal of Political Economy 98, 295–324, (1990).Jarrell, Gregg A. and Annette B. Poulsen, “Stock Trading Before the Announcement of Tender Offers: Insider
Trading or Market Anticipation?” Journal of Law, Economics and Organization 5, 225–248, (1989).Johnson, N.L., S. Kotz, N. Balakrishnan, 1995, Continuous Univariate Distributions, Volumes 1 and 2, NY: John
Wiley & Sons, Inc.Kyle, Albert S. and Jean-Luc Vila, “Noise Trading and Takeovers.” Rand Journal of Economics 22, 54–71,
(1991).Maddala, G.S., “A Perspective on the Use of Limited-Dependent and Qualitative Variables Models in Accounting
Research.” The Accounting Review 66, 788–807, (1991).McCullagh, P. and J.A. Nelder, Generalized Linear Models, New York: Chapman & Hall, (1989).Pound, John and Richard Zeckhauser, “Clearly Heard on the Street: The Effect of Takeover Rumors on Stock
Prices.” Journal of Business 63, 291–308, (1990).Rajan, Raghuram and Luigi Zingales, “What Do We Know about Capital Structure? Some Evidence from
International Data.” Journal of Finance 50, 1421–1460, (1995).Ramanathan, Ramu, Statistical Methods in Econometrics, New York: Academic Press, Inc., 1993.Schwert, G. William, “Markup pricing in mergers and acquisitions.” Journal of Financial Economics 41,
153–192, (1996).Shleifer, Andrei and Robert W. Vishny, “Large Shareholders and Corporate Control.” Journal of Political
Economy 94, 461–488, (1986).Titman, S. and R. Wessels, “The Determinants of Capital Structure Choice.” Journal of Finance 43, 1–19,
(1988).Walkling, Ralph A., “Predicting Tender Offer Success: A Logistic Analysis.” Journal of Financial and Quanti-
tative Analysis 20, 461–478, (1985).Walkling, Ralph A. and Robert O. Edmister, “Determinants of Tender Offer Premiums.” Financial Analysts
Journal 15, 27–37, (1985).Walkling, Ralph A. and Michael S. Long, “Agency Theory, Managerial Welfare, and Takeover Bid Resistance.”
Rand Journal of Economics 15, 54–68, (1984).Wall Street Journal Index, 1979–87, Princeton, N.J.: Dow Jones Books.Weston, J. Fred, Kwang S. Chung, and Susan E. Hoag, Mergers, Restructuring and Corporate Control, Engle-
wood Cliffs, N.J.: Prentice-Hall, (1990).
188 DANIEL ASQUITH, ROBERT KIESCHNICK
Kluwer Journal@ats-ss2/data11/kluwer/journals/requ/v12n2art5 COMPOSED: 01/13/99 1:35 pm. PG.POS. 18 SESSION: 14