allergen immunotherapy products -...
TRANSCRIPT

FINAL REPORT 1
September 2015
Study Team: Tara Gomes, Diana Martins, Kimberly Fernandes Samantha Singh, Mina Tadrous, Nikita Arora, David Juurlink, Mike Paterson, Muhammad Mamdani
Allergen Immunotherapy Products
FINAL PHARMACOEPIDEMIOLOGY REPORT
FINAL REPORT
2
September 2015 odprn.ca Ontario Drug Policy Research Network
Executive Summary National and Provincial Trends in Allergen Immunotherapy Utilization Annual dispensing of prescriptions for allergen immunotherapies in pharmacies (excluding patient-specific subcutaneous allergen immunotherapy) across Canada has nearly doubled (92%) over the past 5 years, from 6,423 prescriptions dispensed in 2010 (18.8 prescriptions per 100,000 population) to 12,311 prescriptions dispensed in 2014 (34.6 prescriptions per 100,000 population). This increase is attributable to the introduction of novel sublingual immunotherapies (SLIT) in 2013 and 2014. The introduction of these drugs to the Canadian market caused a 32% increase in costs from $5.6 million in 2013 to $7.4 million in 2014. In 2014, Pollinex-R was the most utilized immunotherapy (46%; 5,629 prescriptions) in Canada, followed by Oralair (33%; 4,099 prescriptions), Grastek (13%; 1,577 prescriptions), and Ragwitek (8%; 1,006 prescriptions). The vast majority of these prescriptions (94.8%; 11,676 prescriptions) were paid for by non-publicly funded drug coverage (private insurers, cash, noninsured health benefits) in 2014. Ontario was found to have the highest rate of prescriptions dispensed for allergen immunotherapies in Canada, which increased almost 33% from 45 prescriptions per 100,000 population in 2010 to 60 prescriptions per 100,000 population in 2014. Ontario’s rates were found to be much higher in comparison than the average national rates during the same time period (19 prescriptions per 100,000 population in 2010 to 34 prescriptions per 100,000 population in 2014). Ontario had the second highest rate of non-publicly funded allergen immunotherapy prescriptions (10.3 prescriptions per 100,000 population compared to the national average of 4.8 prescriptions per 100,000 population). Alberta was found to have the highest rate of non-publicly funded utilization with 15.1 prescriptions per 100,000 population. Ontario had the highest rate of publicly funded allergen immunotherapy prescriptions (15.5 prescriptions per 100,000 eligible population compared to the national average of 2.2 prescriptions per 100,000 eligible population) which may be due to the less restrictive listing of this drug class on the provincial formulary. Regional variations in non-publicly funded allergen immunotherapy prescribing were observed across Canada, which is likely related to the variation of environmental allergens available and prescribing habits. Oralair was the most commonly prescribed non-publicly funded allergen immunotherapy product in the western provinces (Alberta, British Colombia, and Manitoba) in 2014. In the same year, Pollinex-R had the highest rate of prescriptions in Ontario and Quebec, Grastek use was highest in the Maritime Provinces (Newfoundland and Labrador and Nova Scotia), with exception of New Brunswick where Oralair was most common.
Utilization of Allergen Immunotherapy in Ontario Overall, Ontario has seen an increase in the use of allergen immunotherapies over time, with the number of prescriptions dispensed, regardless of payer, having increased by 38%, from 5,903 prescriptions (27 prescriptions per 100,000 population) in 2010 to 8,141 prescriptions (28 prescriptions per 1,000 population) in 2014. Consequently, costs have increased by approximately 21%, from $5.1 million in 2010 to $6.2 million in 2014. A small proportion (6%; 501 prescriptions) of all allergen immunotherapy prescriptions were paid by publicly-funded programs in Ontario. The vast majority of publicly-funded prescriptions (92%; 462 prescriptions) were for Pollinex-R in 2014. In contrast, among
FINAL REPORT
3
September 2015 odprn.ca Ontario Drug Policy Research Network
privately insured medications and those paid for in cash, only 61% and 67%, respectively, were for Pollinex-R in 2014. This is likely because the public programs have not listed all SLIT therapies within our window of observation.
Characteristics and Utilization of Publicly -funded Allergen Immunotherapy Users within Ontario Claims to the Ontario Public Drug Program (OPDP) allergen program for immunotherapies (patient-specific subcutaneous allergen extracts and Pollinex-R) ranged from 19,308 prescriptions dispensed in fiscal year (FY) 2010/11 to 16,947 prescriptions dispensed in fiscal year FY2013/14. The majority of publicly-funded immunotherapy claims were for allergen extracts (98% in FY2010/11, 97% in FY2012/13, and 96% in FY2013/14). The cost of publicly-funded immunotherapy claims ranged from $3,222,863 in FY2011/12 to $3,789,385 in FY2013/14. The governmental cost per claim increased between FY2010/11 to FY2013/14 for both the non-pollen allergen extracts ($181 to $211 per claim; 16% increase) and Pollinex-R ($372 to $392 per claim; 5.4% increase). The number of publicly-funded users of immunotherapy in Ontario decreased over time, ranging from 8,660 users in FY2010/11 to 8,116 users in FY2013/14.
Characteristics of a Sample of Publicly -funded Allergen Immunotherapy Users within Ontario In 2013, we were able to explore the characteristics of a sample (n=4,818) of publicly-funded allergen immunotherapy users in Ontario. The majority of users were treated with non-pollen allergen extracts (88%; N=4,239). Users of allergen immunotherapy in Ontario were found to be on average 65 years of age, approximately two-thirds were female (60%; N=2,880), they used an average of 9 medications in the last year, and nearly half (46%; N=2,204) had a diagnosis of asthma. Most prescriptions were written by either an immunologist (33%; N=1,590), pediatrician (30%; N=1,456), or a general practitioner (25%; N=1,204). We found that 10% of prescribers (N=74) accounted for 88% of allergen extract claims (N=16,221) submitted for public reimbursement and less than 6 prescribers accounted for 53% of all claims in our sample.
Characteristics of a Sample of Publicly -funded Allergen Immunotherapy Claims within Ontario From a sample (n=100) of submitted allergen extract claims to the OPDP in 2015, the majority of claims were for environmental allergens (87%), compared to venom allergens (10%) and mixed (environmental and food) (3%). Venom serums claims were more likely to be made with a single allergen (90%) while environmental serum claims were more likely to have more than one allergen (2-5 allergens (52%) and 6+ allergens (10%)). Environmental serum claims had the highest total cost (81%), costing $19,466 out of the total $23,973. Venom and Mixed allergens cost the most per claim when compared to environment allergens ($336.85, $379.60, $223.75 per claim, respectively); yet these do not make up a large proportion of the total cost due to their lower utilization. Moreover, 13% of allergen serums were characterized as possibly unstable and 7% were risky based on evidence-based guidelines for immunotherapy mixtures. All but one of these unstable and risky mixtures contained environmental allergens.
FINAL REPORT
4
September 2015 odprn.ca Ontario Drug Policy Research Network
Conflict of Interest Statement
Muhammad Mamdani was a member of an advisory board for Hoffman La Roche, Pfizer, Novartis, GlaxoSmithKline and Eli Lilly Canada. Tara Gomes received grant funding from the Ministry of Health and Long-term Care. No other study members report any affiliations or financial involvement (e.g., employment, consultancies, honoraria, stock options, expert testimony, grants or patents received or pending, or royalties) that may present a potential conflict of interest in the Allergen Immunotherapy Drug Class Review.
Acknowledgments
This review was supported by the Ontario Drug Policy Research Network which is funded by grants from the Ontario Ministry of Health and Long-Term Care Health System Research Fund. This study was also supported by the Institute for Clinical Evaluative Sciences (ICES), which is funded by an annual grant from the Ontario Ministry of Health and Long-Term Care (MOHLTC). The opinions, results and conclusions reported in this paper are those of the authors and are independent from the funding sources. No endorsement by ICES or the Ontario MOHLTC is intended or should be inferred. Parts of this material are based on data and information compiled and provided by CIHI. However, the analyses, conclusions, opinions and statements expressed herein are those of the author, and not necessarily those of CIHI. Datasets provided by ICES were linked using unique encoded identifies and analyzed at ICES. The statements, findings, conclusions, views, and opinions contained and expressed in the report are based in part on data obtained under license from IMS Health Canada Inc. concerning the following information service(s): Geographic Prescription Monitor (GPM12), data period January 1 2010 – March 31 2015. All Rights Reserved. The statements, findings, conclusions, views, and opinions expressed herein are not necessarily those of IMS Health Canada Inc. or any of its affiliated or subsidiary entities.
Study Team
Pharmacoepidemiology Team: Tara Gomes, Diana Martins, Kimberly Fernandes, Samantha Singh, Mina Tadrous, Nikita Arora, David Juurlink, Mike Paterson, Muhammad Mamdani
FINAL REPORT
5
September 2015 odprn.ca Ontario Drug Policy Research Network
Contents Executive Summary .................................................................................................................................. 2
National and Provincial Trends in Allergen Immunotherapy Utilization ............................................ 2 Utilization of Allergen Immunotherapy in Ontario ............................................................................. 2 Characteristics and Utilization of Publicly -funded Allergen Immunotherapy Users within Ontario . 3 Characteristics of a Sample of Publicly -funded Allergen Immunotherapy Users within Ontario ..... 3 Characteristics of a Sample of Publicly -funded Allergen Immunotherapy Claims within Ontario ... 3
Conflict of Interest Statement ............................................................................................................... 4 Acknowledgments ................................................................................................................................. 4 Study Team ........................................................................................................................................... 4
Introduction ............................................................................................................................................... 7 Data Sources ............................................................................................................................................ 7
IMS Geographic Prescription Monitor (GPM12) ................................................................................... 7 Ontario Public Drug Program Allergen Program Data ......................................................................... 7 Administrative Databases in Ontario .................................................................................................... 8
Ontario Drug Benefit Database ......................................................................................................... 8 Other Health Administrative Databases ............................................................................................ 8
Methods .................................................................................................................................................... 8 National Trends in Utilization of Allergen Immunotherapy ................................................................... 8
Population Adjustment – Overall Utilization ...................................................................................... 8 Characteristics of Publicly-Funded Allergen Immunotherapy Users in Ontario ............................... 8 Ontario Public Drug Program Allergen Program Information ........................................................... 9
Overview of Analyses ............................................................................................................................. 10 Exhibits and Findings ........................................................................................................................... 11
National Trends in Utilization of Allergen Immunotherapy ................................................................. 11 Exhibit 1: Total utilization and cost of immunotherapy dispensed in Canada, by drug and quarter ......................................................................................................................................................... 11 Exhibit 2: Utilization of non-publicly funded immunotherapy prescriptions in Canada, by product and year ........................................................................................................................................... 13 Exhibit 3: Utilization of publicly funded immunotherapy prescriptions in Canada, by product and year .................................................................................................................................................. 14
Population-Adjusted Rates of Allergen Immunotherapy Utilization, by Funding Type ...................... 15 Exhibit 4: Population-adjusted utilization of immunotherapy (prescriptions per 100,000 population) in Canada, by province and year .................................................................................................... 15 Exhibit 5: Population-adjusted utilization rates of non-publicly funded immunotherapy (prescriptions per 100,000 population) across Canada, by province and product in 2014 ............ 17

FINAL REPORT
6
September 2015 odprn.ca Ontario Drug Policy Research Network
Exhibit 6: Population-adjusted utilization of publicly funded immunotherapy (prescriptions per 100,000 population) across Canada, by province and product in 2014 ......................................... 18
Utilization of Allergen Immunotherapy in Ontario ............................................................................... 20 Exhibit 7: Total utilization and cost of immunotherapy dispensed in Ontario, by drug and quarter 20 Exhibit 8: Total utilization of immunotherapy dispensed in Ontario, by payer and drug in 2014 ... 21 Exhibit 9: Total utilization and cost of publicly-funded immunotherapy in Ontario, by drug and fiscal year ........................................................................................................................................ 22 Exhibit 10: Total number of users of publicly-funded immunotherapy in Ontario, by drug and fiscal year .................................................................................................................................................. 23
Characteristics of Publicly-Funded Immunotherapy Users in Ontario ................................................... 24 Exhibit 11: Baseline characteristics of a subset of patients treated with publicly-funded immunotherapy in Ontario from April 1 2012 to March 31 2014, by therapy .................................. 24 Characteristic .................................................................................................................................. 24 Overall ............................................................................................................................................. 24 Pollinex-R ........................................................................................................................................ 24 Allergen Extract ............................................................................................................................... 24 Exhibit 12: Lorenz curve of number of prescribers of publicly-funded immunotherapy by the number of prescriptions in Ontario .................................................................................................. 26 Exhibit 13: Number of allergens and type of allergens in sample of submitted SCIT Allergen Claims Ontario in 2015 .................................................................................................................... 27 Exhibit 14: Cost of SCIT allergen serum from a sample of Submitted Claims in Ontario in 2013, by type of allergen ................................................................................................................................ 28 Exhibit 15: Stability of Allergen Mixtures from a sample of Submitted Claims in Ontario in 2013 . 29
Health Equity .......................................................................................................................................... 30 Limitations ............................................................................................................................................... 30
Data Availability .................................................................................................................................. 30 Overall Conclusion ................................................................................................................................. 30 Reference List ......................................................................................................................................... 32 Review of the Observational Literature .................................................................................................. 33
Objectives ........................................................................................................................................... 33 Methods .............................................................................................................................................. 33 Results ................................................................................................................................................ 33
Conclusions ............................................................................................................................................ 37 References .......................................................................................................................................... 37
Appendix A: Public Plan Listings for Allergen Immunotherapies in Canada, by Province .................... 39 Appendix B: Medline Search Strategy ................................................................................................. 40 Appendix C: Summary of Included Studies ............................................................................................ 41

FINAL REPORT
7
September 2015 odprn.ca Ontario Drug Policy Research Network
Introduction
Allergen Immunotherapies are a class of therapies used to help decrease symptoms related to allergies for a variety of allergens. Allergen immunotherapy can be divided into two forms of therapy, which consist of sublingual immunotherapy (SLIT) and subcutaneous immunotherapy (SCIT). Three SLITs are currently available in Canada (Oralair, Ragwitek, and Grastek), but only two are currently available on the Ontario drug formulary (Oralair and Ragwitek). SCITs are more complex, with only one specific product that is available as a commercially formulated product (Pollinex-R). All other SCIT therapies are uniquely compounded for each patient. Currently in Ontario, all publicly-funded SCITs (both Serums and Pollinex-R) are paid for through the Allergy Products Program. The objectives of this report are to describe national and provincial trends in the use of allergen immunotherapies and to identify patterns of use. Specifically, this report aims to:
1. To examine national and provincial trends in use of allergen immunotherapy across Canada 2. To perform cross-provincial comparisons of the trends in allergen immunotherapy utilization in
public drug programs 3. To describe characteristics of individuals prescribed publicly-funded allergen immunotherapy
in Ontario among a subset of publicly-funded users 4. To describe the details and stability of a sample of submissions for public drug funding for
allergen immunotherapy serums in Ontario
Data Sources
IMS Geographic Prescription Monitor (GPM12) IMS Geographic Prescription Monitor (GPM12) is a premium source of sales intelligence on retail prescription activity in Canada. Data is obtained from a representative sample of 65% of all Canadian pharmacies and is projected monthly by province or customized geography. Projections incorporate the number of pharmacies in a given area, the distance between IMS-captured and uncaptured pharmacies, and the size of the pharmacies. Projections are representative of provincial and national sales volumes. Data available through IMS Geographic Prescription Monitor (GPM12) includes prescription volumes and units (e.g. tablets, patches) dispensed, and are stratified by payer type (e.g. public drug plan, private drug plan, cash, Non-Insured Health Benefits). Data from IMS Geographic Prescription Monitor (GPM12) is available from the fourth quarter of 2009 to the first quarter of 2015.
Ontario Public Drug Program Allergen Program Data We were supplied information on spending of Allergen Extracts and Pollinex-R from the OPDP allergen program. This data included claim summary information from April 1, 2010 to March 31, 2015. This information included total cost paid, number of claims, and number of users by fiscal year. Additionally, we received a random sample of 100 allergen extract claim submissions that were de-identified. These claims contained information related to the cost of the allergen extracts, dose and type of extract, number of extracts, and date of claim.
FINAL REPORT
8
September 2015 odprn.ca Ontario Drug Policy Research Network
Administrative Databases in Ontario
Ontario Drug Benefit Database The Ontario Drug Benefit (ODB) database contains individual-level claims data for all prescription drugs dispensed to Ontario residents eligible for public drug funding. Eligibility criteria include unemployment, disability, high prescription drug costs relative to net household income, receipt of home care services, residence in a long-term care facility, or age 65 years or older. This database is of high quality, with an error rate of <1% and can be linked to other health administrative databases to obtain patient demographic information.1 We analyzed data from the ODB between April 1, 2013 and March 31, 2014. ODB database is only able to capture a sample of claims which are submitted to the OPDP Allergy program electronically.
Other Health Administrative Databases We used data from the Ontario Registered Persons Database (RPDB), Canadian Institute for Health Information Discharge Abstract Database (CIHI-DAD) and National Ambulatory Care Reporting System (CIHI-NACRS), Ontario Health Insurance Plan (OHIP) claims and the ICES Physician Database (IPDB) to obtain patient vital statistics, describe health care utilization and other patient comorbidities and characteristics. These datasets were linked using unique, encoded identifiers and analyzed at the Institute for Clinical Evaluative Sciences.
Methods
All analyses using administrative databases in Ontario available through the Institute for Clinical Evaluative Sciences were approved by the Research Ethics Board of Sunnybrook Health Sciences Centre, Toronto, Ontario.
National Trends in Utilization of Allergen Immunotherapy We used data from IMS Geographic Prescription Monitor (GPM12) to examine overall trends in the prescribing volumes of allergen immunotherapies (both SCIT and SLIT) that are dispensed in pharmacies, at both national and provincial levels. We examined the number of prescriptions dispensed for products between January 2010 and December 2014. Analyses were stratified by payer of the prescription, by province, and by product. All cross-provincial analyses compared population-adjusted rates.
Population Adjustment – Overall Utilization For measures examining publicly-funded utilization, we used the number of individuals eligible for provincial drug coverage in 2014 to standardize utilization rates. We obtained estimates of eligible populations from the annual reports of each public drug program or previous patient-level estimates and projected these to current years. IMS analysis of non-publicly funded payers and for total utilization was adjusted for total populations. Provincial population estimates were obtained from Statistics Canada for each year from 2010 to 2014 and used to adjust the overall utilization rates (per 100,000 population) across different provinces and nationally.
Characteristics of Publicly-Funded Allergen Immunotherapy Users in Ontario We used claims data from ODB to perform analyses of utilization of allergen immunotherapy among patients in Ontario. Users were defined as individuals who received at least one prescription for an
FINAL REPORT
9
September 2015 odprn.ca Ontario Drug Policy Research Network
allergen immunotherapy over the period of interest. We examined baseline characteristics of patients dispensed an allergen immunotherapy using linked administrative databases housed at ICES, including the CIHI-DAD (to identify inpatient hospitalizations and Charlson comorbidity score), the CIHI NACRS (to identify emergency department visits), the RPDB (to determine demographic information such as age, gender, and income quintile), the OHIP claims database (to identify outpatient physician visits), the ODB database (to identify past medication use), and the IPDB (to determine physician characteristics such as visits to specialists).
Ontario Public Drug Program Allergen Program Information Since not all allergen claims are submitted electronically, administrative data would not allow for estimates of total public drug program spending in Ontario. We leveraged fiscal year claim summaries from the OPDP and reported total spending and total number of claims by fiscal year from 2010-2011 to 2014-2015. Additionally, we received a random sample of 100 de-identified hand-written claim submissions for allergen extracts which contained the following information: type of allergen therapy, number of allergen extracts, cost of claim, year of claim, and age of claimant. Stability of the components included in each serum were assessed for possible instability based on current recommendations.2-4 Based on this evidence, mixtures that are classified as stable retain target activity levels when mixed. Risky mixtures may have proteases that degrade each other if glycerin/diluent levels are not increased substantially. Unstable mixtures are allergen combinations that cannot be stabilized by any conditions and do not retain target activity levels.2-4 Stability was defined as stable, risky, and unstable.

FINAL REPORT
10
September 2015 odprn.ca Ontario Drug Policy Research Network
Overview of Analyses The reimbursement of allergen immunotherapy products is atypical, with a large proportion of prescriptions for immunotherapy dispensed and/or administered directly from physician offices and thus information is often unavailable through pharmacy claims data. Moreover, a large proportion of claims for the allergen program are submitted in hand-written forms, rather than electronically, as is most common with traditional drug claims captured in the ODB database. These written claims contain the details of the components of the allergen immunotherapy but are all collected through a single general claim code (Product Identification Number (PIN)). Due to the complexity of allergen reimbursement it was essential to leverage multiple data sources to better understand the utilization and cost of allergen immunotherapy in Ontario. Firstly, IMS GPM12 data allowed insight into the utilization of allergen immunotherapies dispensed from pharmacies; this would include all SLITs and Pollinex-R. These claims only comprise a small but growing proportion of current allergen immunotherapy paid for by the OPDP. Next, we leveraged annual summaries of spending for the OPDP allergy program. This information allows us to better understand the overall spending on both non-pollen serum immunotherapy and Pollinex-R, as well as the number of users whose claims were submitted both electronically and hand-written. Thirdly, to assess the patient characteristics and prescriber trends we used ICES data holdings to explore a sample of patients whose claims for Pollinex-R and non-pollen serum immunotherapy were submitted electronically. Lastly, since all non-pollen serum immunotherapy claims are submitted with a general PIN, we assessed a random sample of 100 de-identified written claims to describe and explore their composition. By combining these four distinct sources we were able to gain insight into current utilization and practices in the use of allergen immunotherapy in Ontario. Further information on each of these data sources can be found in the Methods section of this report.

FINAL REPORT
11
September 2015 odprn.ca Ontario Drug Policy Research Network
Exhibits and Findings
National Trends in Utilization of Allergen Immunotherapy Exhibit 1: Total utilization and cost of immunotherapy dispensed in Canada, by drug and quarter
Methodological Note: The following exhibits (1 to 8) leverage IMS GPM12 data. This data is derived from prescription claims that are dispensed from pharmacies across Canada (See data section for further detail).
These analyses only capture single allergen products with associated DIN numbers (SLITs and Pollinex-R) dispensed from pharmacies. These claims were found to comprise a small but growing proportion of allergen immunotherapy utilization. The majority of allergen immunotherapy comprises of non-pollen serum immunotherapy which is often dispensed in physician offices and not captured in IMS GPM12 data.
Prescriptions and cost of allergen immunotherapy products dispensed in pharmacies have increased 92% and 31%, respectively, over the last 5 years, with the largest increase observed between 2013 and 2014 with the introduction of new sublingual agents (Oralair, Ragwitek, Grastek) to the market.
FINAL REPORT
12
September 2015 odprn.ca Ontario Drug Policy Research Network
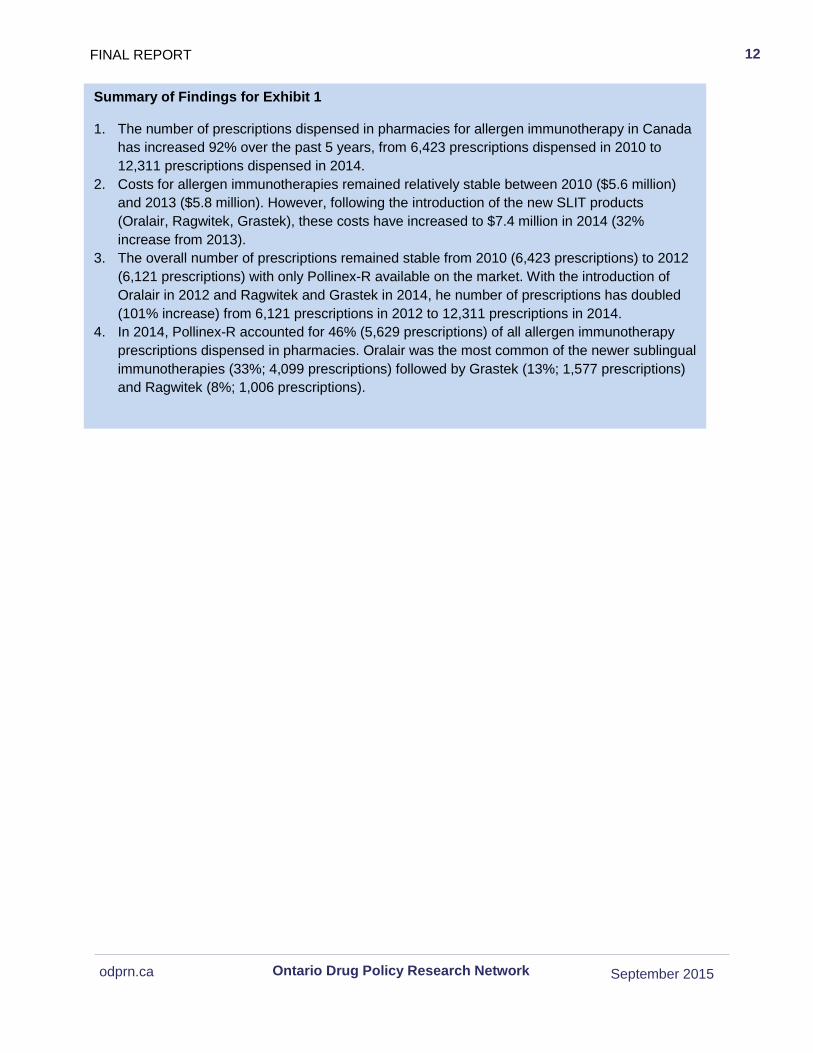
Summary of Findings for Exhibit 1
1. The number of prescriptions dispensed in pharmacies for allergen immunotherapy in Canada has increased 92% over the past 5 years, from 6,423 prescriptions dispensed in 2010 to 12,311 prescriptions dispensed in 2014.
2. Costs for allergen immunotherapies remained relatively stable between 2010 ($5.6 million) and 2013 ($5.8 million). However, following the introduction of the new SLIT products (Oralair, Ragwitek, Grastek), these costs have increased to $7.4 million in 2014 (32% increase from 2013).
3. The overall number of prescriptions remained stable from 2010 (6,423 prescriptions) to 2012 (6,121 prescriptions) with only Pollinex-R available on the market. With the introduction of Oralair in 2012 and Ragwitek and Grastek in 2014, he number of prescriptions has doubled (101% increase) from 6,121 prescriptions in 2012 to 12,311 prescriptions in 2014.
4. In 2014, Pollinex-R accounted for 46% (5,629 prescriptions) of all allergen immunotherapy prescriptions dispensed in pharmacies. Oralair was the most common of the newer sublingual immunotherapies (33%; 4,099 prescriptions) followed by Grastek (13%; 1,577 prescriptions) and Ragwitek (8%; 1,006 prescriptions).

FINAL REPORT
13
September 2015 odprn.ca Ontario Drug Policy Research Network
Exhibit 2: Utilization of non-publicly funded immunotherapy prescriptions in Canada, by product and year
The number of allergen immunotherapy prescriptions paid for by non-publicly funded payers has increased 96% over the last 5 years, with the largest increase from 2013 to 2014 with the introduction of new sublingual agents to the market.

FINAL REPORT
14
September 2015 odprn.ca Ontario Drug Policy Research Network
Summary of Findings for Exhibit 2 and Exhibit 3
1. In 2014, a total of 12,311 prescriptions for allergen immunotherapy were dispensed at pharmacies in Canada. The vast majority of these (94.8%; 11,676 prescriptions) are paid for by non-publicly funded drug coverage.
2. Among publicly-funded allergen immunotherapy prescriptions dispensed in Canada in 2014, Pollinex-R was the most commonly dispensed product (73%; 464 prescriptions) followed by Oralair (27%; 169 prescriptions). Only 2 prescriptions (0.3%) for Grastek and no Ragwitek prescriptions were paid for by publicly-funded payers in 2014, likely due to their recent approval and addition to formularies in 2015.
3. Nationally, among non-publicly covered allergen immunotherapy prescriptions, Pollinex-R was the most commonly prescribed product in 2014 (44%; 5,165 prescriptions) followed by Oralair (34%; 3,930 prescriptions), Grastek (14%; 1,575 prescriptions) and Ragwitek (9%;1,006 prescriptions).
Exhibit 3: Utilization of publicly funded immunotherapy prescriptions in Canada, by product and year
The number of allergen immunotherapy prescriptions paid for by publicly funded payers has increased 32% over the last 5 years, with the largest increase from 2013 to 2014 with the introduction of new sublingual agents to the Canadian market.
FINAL REPORT
15
September 2015 odprn.ca Ontario Drug Policy Research Network
Population-Adjusted Rates of Allergen Immunotherapy Utilization, by Funding Type
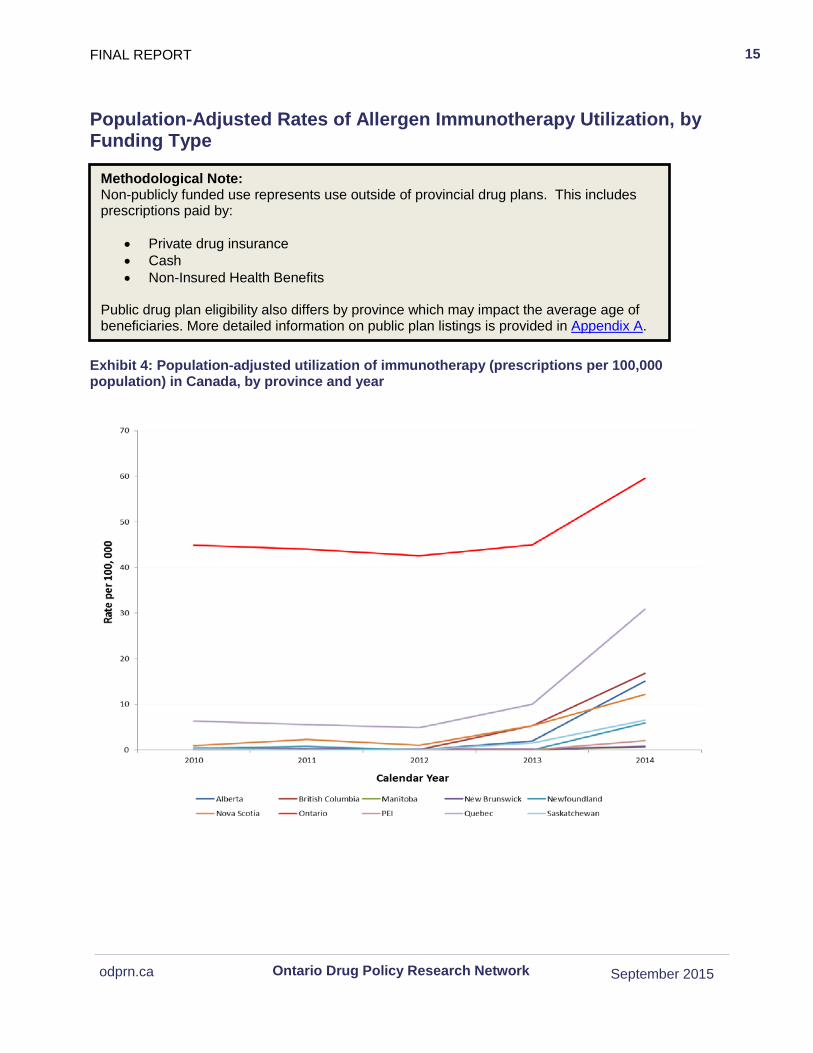
Exhibit 4: Population-adjusted utilization of immunotherapy (prescriptions per 100,000 population) in Canada, by province and year
Methodological Note: Non-publicly funded use represents use outside of provincial drug plans. This includes prescriptions paid by:
• Private drug insurance • Cash • Non-Insured Health Benefits
Public drug plan eligibility also differs by province which may impact the average age of beneficiaries. More detailed information on public plan listings is provided in Appendix A.
FINAL REPORT 16
September 2015 odprn.ca Ontario Drug Policy Research Network
Summary of Findings for Exhibit 4
1. Ontario’s rate of allergen immunotherapy prescribing (45 prescriptions per 100,000 population in 2010 to 60 prescriptions per 100,000 population in 2014) was substantially higher than the national average (19 prescription per 100,000 population in 2010 to 34 prescriptions per 100,000 population in 2014).
2. Quebec had the second highest rate of allergen immunotherapy prescriptions (6 prescriptions per 100,000 population in 2010 to 31 prescriptions per 100,000 population in 2014).
3. All provinces saw an increase in the rate of allergen immunotherapy use between 2012 and 2014 with the national average rate of prescriptions increasing by 94% (18 prescriptions per 100,000 population in 2012 to 35 prescriptions per 100,000 population in 2014).
Ontario had the highest rate of allergen immunotherapy prescriptions dispensed in Canada over the past 5 years.
17
September 2015 odprn.ca Ontario Drug Policy Research Network
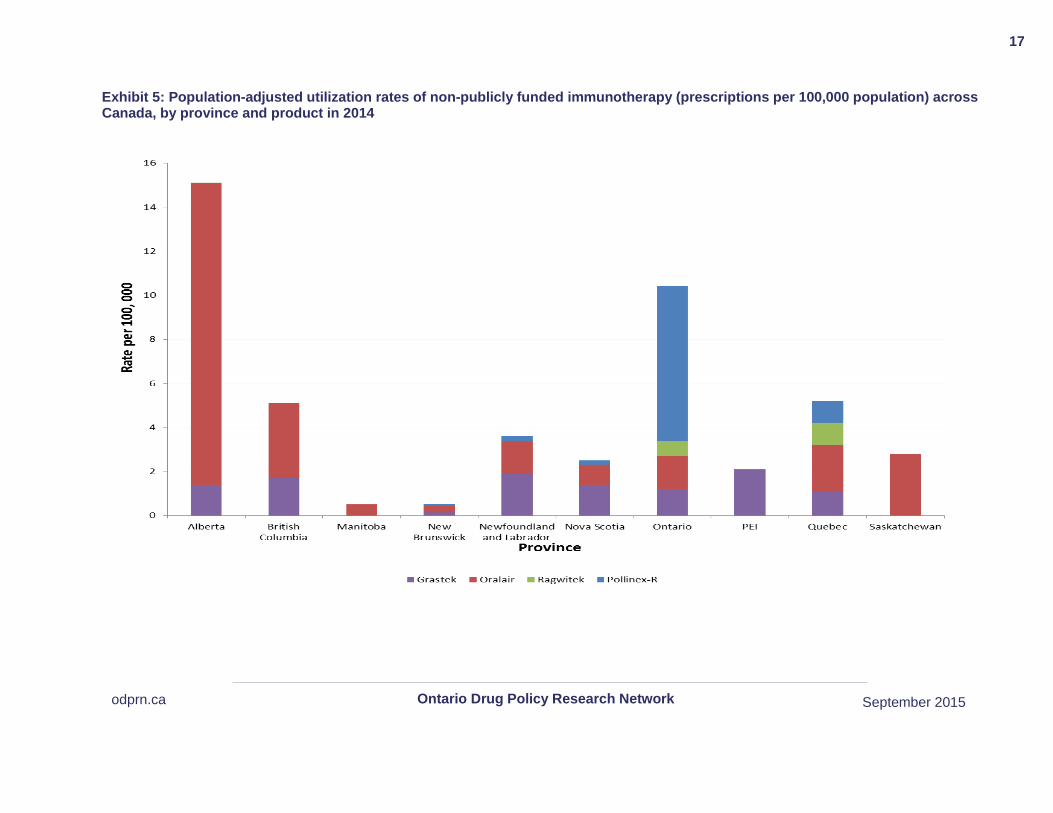
Exhibit 5: Population-adjusted utilization rates of non-publicly funded immunotherapy (prescriptions per 100,000 population) across Canada, by province and product in 2014
18
September 2015 odprn.ca Ontario Drug Policy Research Network
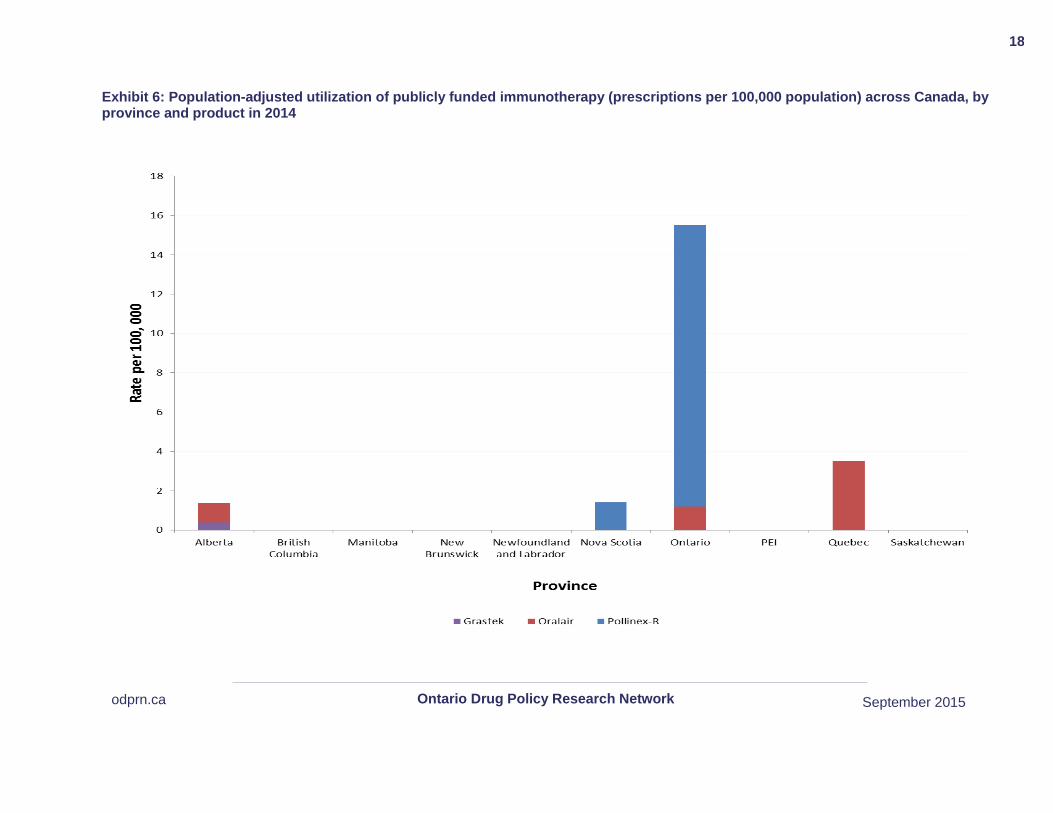
Exhibit 6: Population-adjusted utilization of publicly funded immunotherapy (prescriptions per 100,000 population) across Canada, by province and product in 2014

FINAL REPORT 19
September 2015 odprn.ca Ontario Drug Policy Research Network
Summary of Findings for Exhibit 5 and 6
1. In 2014, Ontario had the second highest rate of non-publicly funded allergen immunotherapy prescriptions (10.3 prescriptions per 100,000 population compared to the national average of 4.8 prescriptions per 100,000 population) and the highest rate of publicly funded allergen immunotherapy prescriptions (15.5 prescriptions per 100,000 eligible population compared to the national average of 2.2 prescriptions per 100,000 eligible population).
2. The majority (92.2%) of publicly funded prescriptions dispensed in Ontario were for Pollinex-R (14 prescriptions per 100,000 eligible population) followed by Oralair (7.8%; 1 prescription per 100,000 eligible population).
3. There was wide variation in the rate of non-publicly funded allergen immunotherapy prescriptions dispensed between provinces in 2014 (from 0.5 [Manitoba] to 15 [Alberta] prescriptions per 100,000 eligible population).
4. Among non-publicly funded allergen immunotherapy prescriptions, Oralair had the highest rate of prescriptions in the western provinces (Alberta, British Colombia, and Manitoba). Polinex-R had the highest rate of prescriptions in Ontario and Quebec. Grastek was found to have the highest rate of prescriptions among the Maritime Provinces (Newfoundland and Labrador and Nov Scotia), with exception of New Brunswick where Oralair was most commonly prescribed.
5. There were no publicly funded allergen immunotherapy prescriptions dispensed in British Columbia, Manitoba, New Brunswick, Newfoundland and Labrador, Prince Edward Island or Saskatchewan during 2014. Cross-provincial variations were noted among the remaining provinces, with Ontario exhibiting the highest rate of prescriptions dispensed (from 1.4 [Alberta] to 16 [Ontario] prescriptions per 100,000 eligible population).
In 2014, Ontario had the highest rate of publicly funded prescriptions for allergen immunotherapy products among all provinces in Canada and the second highest (behind Alberta) rate of non-publicly funded allergen immunotherapy prescriptions.
FINAL REPORT 20
September 2015 odprn.ca Ontario Drug Policy Research Network
Summary of Findings for Exhibit 7
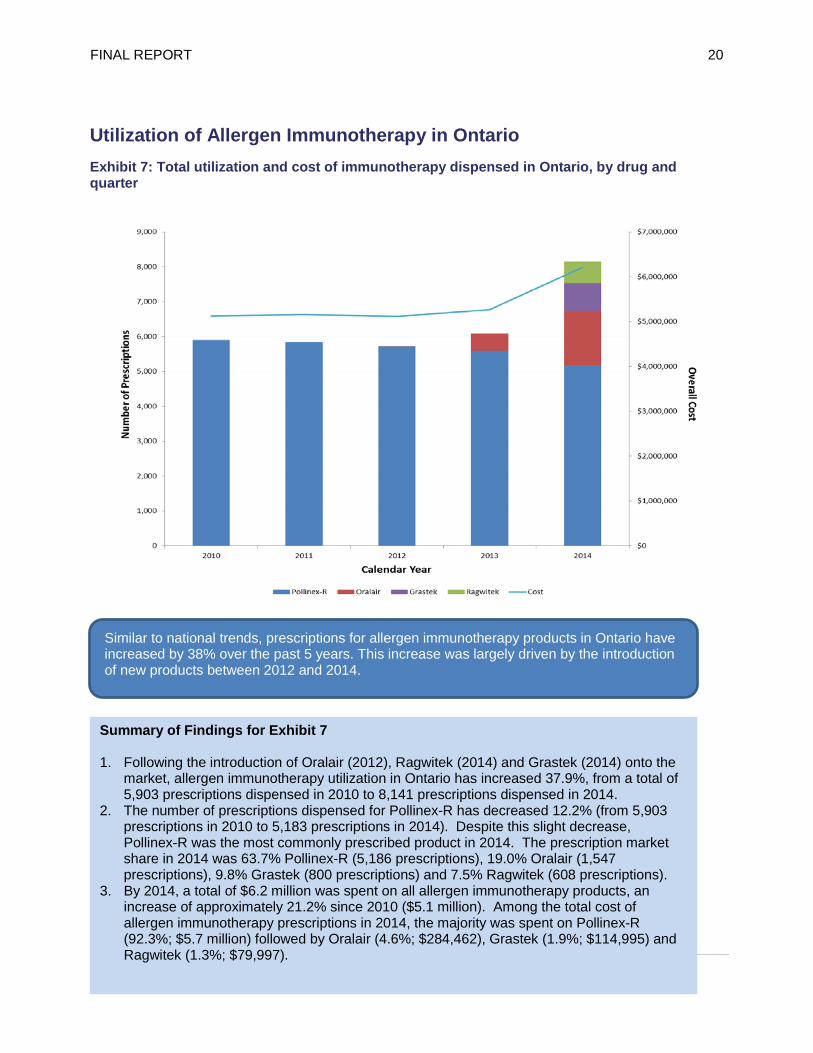
1. Following the introduction of Oralair (2012), Ragwitek (2014) and Grastek (2014) onto the market, allergen immunotherapy utilization in Ontario has increased 37.9%, from a total of 5,903 prescriptions dispensed in 2010 to 8,141 prescriptions dispensed in 2014.
2. The number of prescriptions dispensed for Pollinex-R has decreased 12.2% (from 5,903 prescriptions in 2010 to 5,183 prescriptions in 2014). Despite this slight decrease, Pollinex-R was the most commonly prescribed product in 2014. The prescription market share in 2014 was 63.7% Pollinex-R (5,186 prescriptions), 19.0% Oralair (1,547 prescriptions), 9.8% Grastek (800 prescriptions) and 7.5% Ragwitek (608 prescriptions).
3. By 2014, a total of $6.2 million was spent on all allergen immunotherapy products, an increase of approximately 21.2% since 2010 ($5.1 million). Among the total cost of allergen immunotherapy prescriptions in 2014, the majority was spent on Pollinex-R (92.3%; $5.7 million) followed by Oralair (4.6%; $284,462), Grastek (1.9%; $114,995) and Ragwitek (1.3%; $79,997).
Utilization of Allergen Immunotherapy in Ontario Exhibit 7: Total utilization and cost of immunotherapy dispensed in Ontario, by drug and quarter
Similar to national trends, prescriptions for allergen immunotherapy products in Ontario have increased by 38% over the past 5 years. This increase was largely driven by the introduction of new products between 2012 and 2014.
FINAL REPORT 21
September 2015 odprn.ca Ontario Drug Policy Research Network
Summary of Findings for Exhibit 8
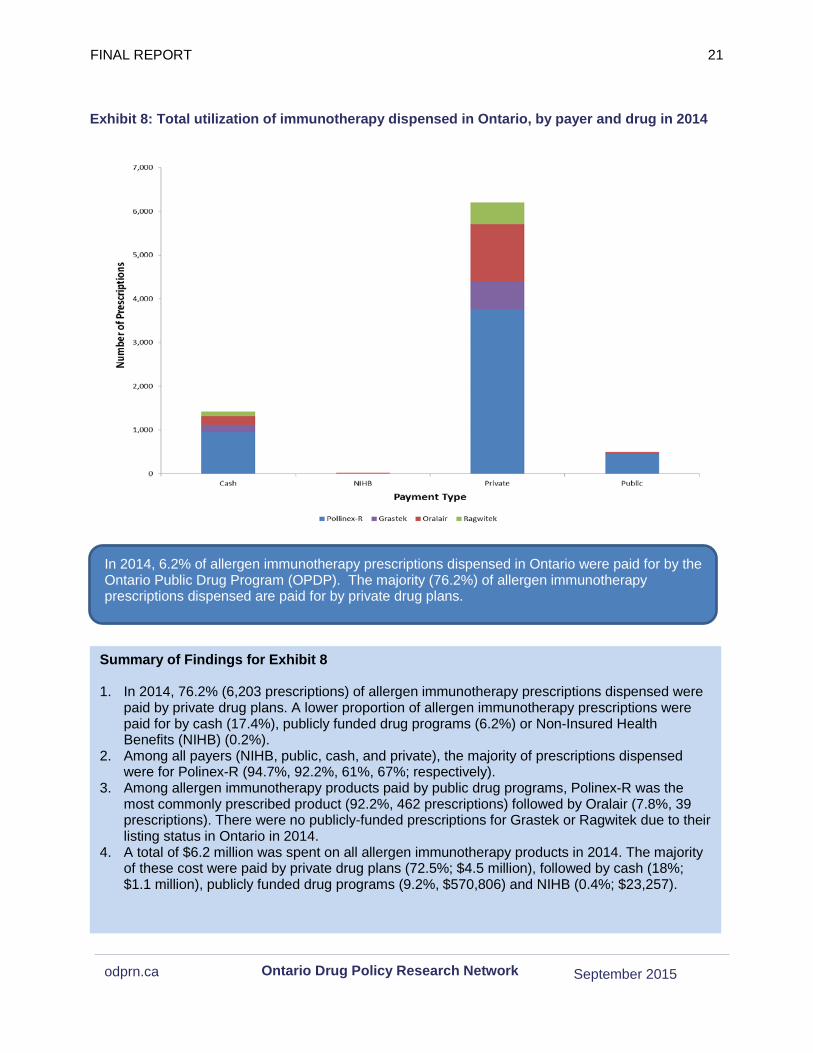
1. In 2014, 76.2% (6,203 prescriptions) of allergen immunotherapy prescriptions dispensed were paid by private drug plans. A lower proportion of allergen immunotherapy prescriptions were paid for by cash (17.4%), publicly funded drug programs (6.2%) or Non-Insured Health Benefits (NIHB) (0.2%).
2. Among all payers (NIHB, public, cash, and private), the majority of prescriptions dispensed were for Polinex-R (94.7%, 92.2%, 61%, 67%; respectively).
3. Among allergen immunotherapy products paid by public drug programs, Polinex-R was the most commonly prescribed product (92.2%, 462 prescriptions) followed by Oralair (7.8%, 39 prescriptions). There were no publicly-funded prescriptions for Grastek or Ragwitek due to their listing status in Ontario in 2014.
4. A total of $6.2 million was spent on all allergen immunotherapy products in 2014. The majority of these cost were paid by private drug plans (72.5%; $4.5 million), followed by cash (18%; $1.1 million), publicly funded drug programs (9.2%, $570,806) and NIHB (0.4%; $23,257).
Exhibit 8: Total utilization of immunotherapy dispensed in Ontario, by payer and drug in 2014
In 2014, 6.2% of allergen immunotherapy prescriptions dispensed in Ontario were paid for by the Ontario Public Drug Program (OPDP). The majority (76.2%) of allergen immunotherapy prescriptions dispensed are paid for by private drug plans.
FINAL REPORT 22
September 2015 odprn.ca Ontario Drug Policy Research Network
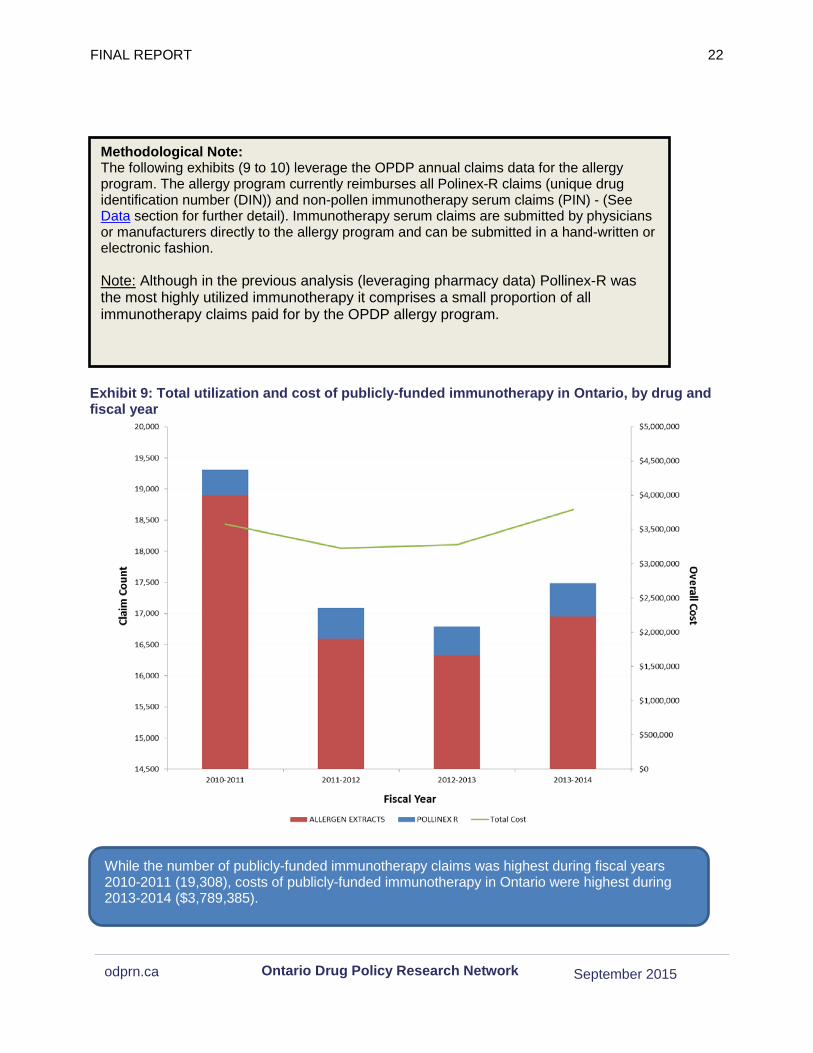
Exhibit 9: Total utilization and cost of publicly-funded immunotherapy in Ontario, by drug and fiscal year
Methodological Note: The following exhibits (9 to 10) leverage the OPDP annual claims data for the allergy program. The allergy program currently reimburses all Polinex-R claims (unique drug identification number (DIN)) and non-pollen immunotherapy serum claims (PIN) - (See Data section for further detail). Immunotherapy serum claims are submitted by physicians or manufacturers directly to the allergy program and can be submitted in a hand-written or electronic fashion.
Note: Although in the previous analysis (leveraging pharmacy data) Pollinex-R was the most highly utilized immunotherapy it comprises a small proportion of all immunotherapy claims paid for by the OPDP allergy program.
While the number of publicly-funded immunotherapy claims was highest during fiscal years 2010-2011 (19,308), costs of publicly-funded immunotherapy in Ontario were highest during 2013-2014 ($3,789,385).
FINAL REPORT 23
September 2015 odprn.ca Ontario Drug Policy Research Network
Summary of Findings for Exhibit 9 and Exhibit 10
1. The number of publicly-funded immunotherapy claims ranged from 19,308 in FY2010/11 to 17,484 in FY2013/14.
2. The majority of publicly-funded immunotherapy claims were for non-pollen allergen extracts (98% in 2010-2011, 94% in 2011-2012, 97% in 2012-2013, and 96% in 2013-2014), with the proportion of Pollinex-R claims slightly increasing over time.
3. The cost of publicly-funded immunotherapy claims have remained relatively stable with the lowest spending in FY2011/12 of $3,222,863 to the highest in FY2013/14 of $3,789,385.
4. The publicly funded cost per claim increased between 2010-2011 and 2014-2015 for both the non-pollen allergen extracts ($181 to $235 per claim; 30% increase) and Pollinex-R ($372 to $392 per claim; 5.4% increase).
5. The number of publicly-funded users of immunotherapy (extracts and Pollinex-R) in Ontario remained relatively stable over time, ranging from 8,660 users in FY2010/11 to 8,116 users in FY2013/14.
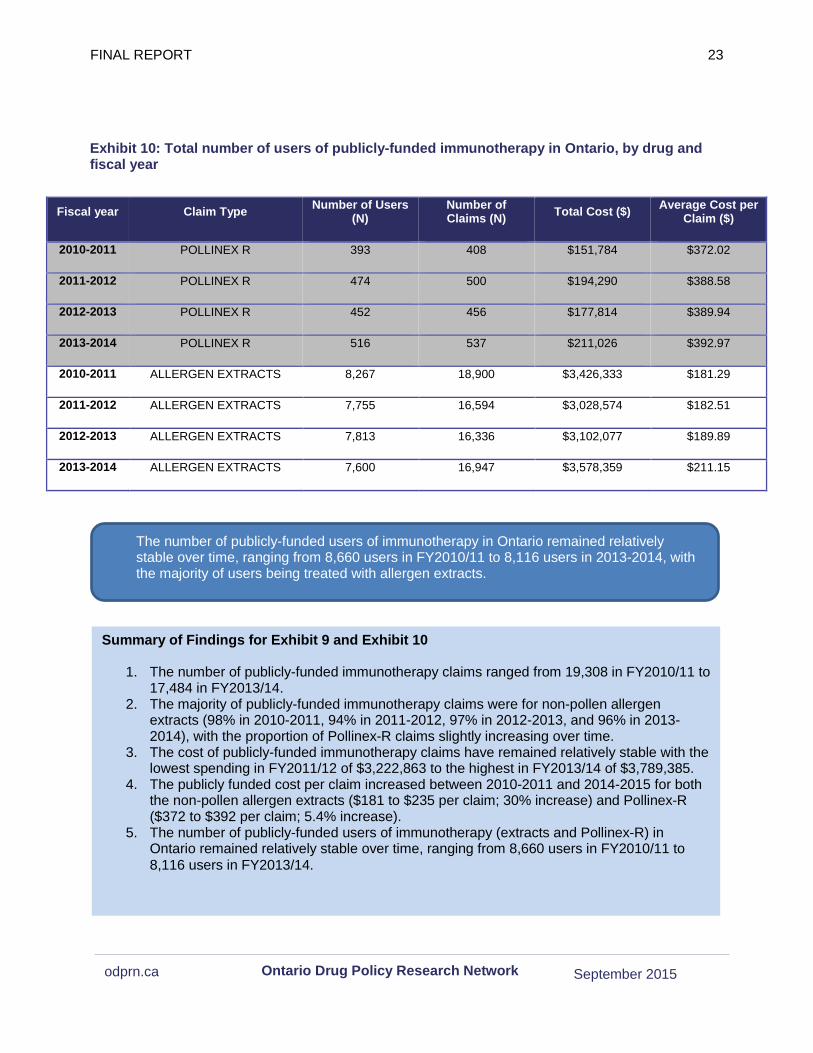
Exhibit 10: Total number of users of publicly-funded immunotherapy in Ontario, by drug and fiscal year
Fiscal year Claim Type Number of Users (N)
Number of Claims (N) Total Cost ($) Average Cost per
Claim ($)
2010-2011 POLLINEX R 393 408 $151,784 $372.02
2011-2012 POLLINEX R 474 500 $194,290 $388.58
2012-2013 POLLINEX R 452 456 $177,814 $389.94
2013-2014 POLLINEX R 516 537 $211,026 $392.97
2010-2011 ALLERGEN EXTRACTS 8,267 18,900 $3,426,333 $181.29
2011-2012 ALLERGEN EXTRACTS 7,755 16,594 $3,028,574 $182.51
2012-2013 ALLERGEN EXTRACTS 7,813 16,336 $3,102,077 $189.89
2013-2014 ALLERGEN EXTRACTS 7,600 16,947 $3,578,359 $211.15
The number of publicly-funded users of immunotherapy in Ontario remained relatively stable over time, ranging from 8,660 users in FY2010/11 to 8,116 users in 2013-2014, with the majority of users being treated with allergen extracts.
FINAL REPORT 24
September 2015 odprn.ca Ontario Drug Policy Research Network
Characteristics of Publicly-Funded Immunotherapy Users in Ontario
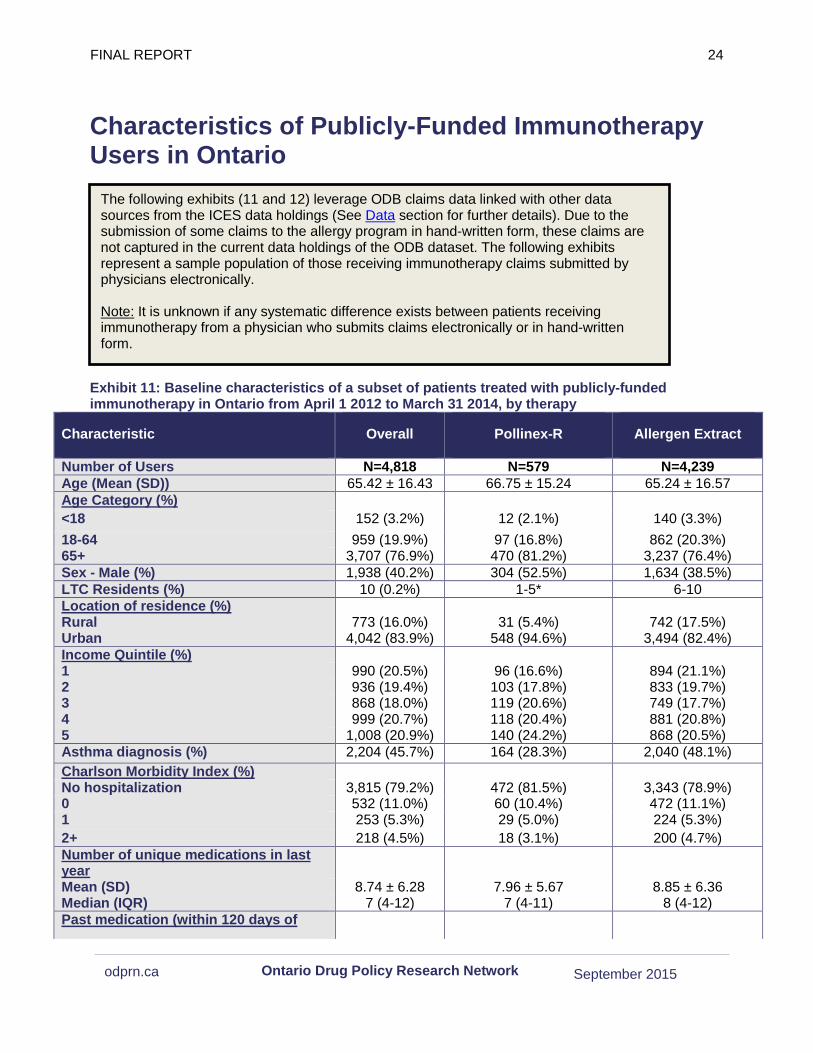
Exhibit 11: Baseline characteristics of a subset of patients treated with publicly-funded immunotherapy in Ontario from April 1 2012 to March 31 2014, by therapy
Characteristic Overall Pollinex-R Allergen Extract
Number of Users N=4,818 N=579 N=4,239 Age (Mean (SD)) 65.42 ± 16.43 66.75 ± 15.24 65.24 ± 16.57 Age Category (%) <18 152 (3.2%) 12 (2.1%) 140 (3.3%) 18-64 959 (19.9%) 97 (16.8%) 862 (20.3%) 65+ 3,707 (76.9%) 470 (81.2%) 3,237 (76.4%) Sex - Male (%) 1,938 (40.2%) 304 (52.5%) 1,634 (38.5%) LTC Residents (%) 10 (0.2%) 1-5* 6-10 Location of residence (%) Rural 773 (16.0%) 31 (5.4%) 742 (17.5%) Urban 4,042 (83.9%) 548 (94.6%) 3,494 (82.4%) Income Quintile (%) 1 990 (20.5%) 96 (16.6%) 894 (21.1%) 2 936 (19.4%) 103 (17.8%) 833 (19.7%) 3 868 (18.0%) 119 (20.6%) 749 (17.7%) 4 999 (20.7%) 118 (20.4%) 881 (20.8%) 5 1,008 (20.9%) 140 (24.2%) 868 (20.5%) Asthma diagnosis (%) 2,204 (45.7%) 164 (28.3%) 2,040 (48.1%) Charlson Morbidity Index (%) No hospitalization 3,815 (79.2%) 472 (81.5%) 3,343 (78.9%) 0 532 (11.0%) 60 (10.4%) 472 (11.1%) 1 253 (5.3%) 29 (5.0%) 224 (5.3%) 2+ 218 (4.5%) 18 (3.1%) 200 (4.7%) Number of unique medications in last year
Mean (SD) 8.74 ± 6.28 7.96 ± 5.67 8.85 ± 6.36 Median (IQR) 7 (4-12) 7 (4-11) 8 (4-12) Past medication (within 120 days of
The following exhibits (11 and 12) leverage ODB claims data linked with other data sources from the ICES data holdings (See Data section for further details). Due to the submission of some claims to the allergy program in hand-written form, these claims are not captured in the current data holdings of the ODB dataset. The following exhibits represent a sample population of those receiving immunotherapy claims submitted by physicians electronically.
Note: It is unknown if any systematic difference exists between patients receiving immunotherapy from a physician who submits claims electronically or in hand-written form.

FINAL REPORT 25
September 2015 odprn.ca Ontario Drug Policy Research Network
Summary of Findings for Exhibit 11
1. In 2013, a total of 4,818 patients utilized publicly funded allergen extracts in Ontario. Only 12% (N=579) were Pollinex-R users whereas the majority (88%; N=4,239) used non-pollen allergen extracts.
2. The majority of Pollinex-R (81%; N=470) and non-pollen allergen extract (76%; N=3,237) beneficiaries were older adults (65+). About half of Pollinex -R beneficiaries (N=304; 53%) and 39% (N=1,634) of non-pollen allergen extract beneficiaries were male.
3. Only 13 beneficiaries (<1%) had been hospitalized or had an emergency department visit for anaphylaxis within the last year.
4. Less than one third of Pollinex-R users (28%; N=164) and less than one half of non-pollen allergen extract users (48%; N=2,040) had an asthma diagnosis.
5. The median number of medications used in the past year was 7 (IQR 4-12). Non-pollen allergen extract beneficiaries were more likely than Pollinex-R users to have used intranasal corticosteroids (18% vs. 12%), inhaled corticosteroids (8% vs. 6%), and ICS+LABA combination products (16% vs. 12%) within the past four months. Few beneficiaries had received leukotriene receptor antagonists or omalizumab within the past four months.
6. The majority (76%; N=439) of Pollinex-R beneficiaries received their first prescription in 2013 from a general practitioner, whereas the majority of non-pollen allergen extract beneficiaries received their first prescription in 2013 from an immunologist (36%; N=1,540) or paediatrician (34%; N=1,442). This is likely due to the specialized and heterogeneous nature of the non-pollen allergen extract therapy.
Characteristic Overall Pollinex-R Allergen Extract
cohort entry) (%)
Intranasal corticosteroids 838 (17.4%) 72 (12.4%) 766 (18.1%) Leukotriene Receptor Antagonists 1-5* 0 (0.0%) 1-5* Inhaled corticosteroids 389 (8.1%) 32 (5.5%) 357 (8.4%) ICS+LABA combination products 745 (15.5%) 57 (9.8%) 688 (16.2%) Omalizumab 1-5* 0 (0.0%) 1-5* Prescriber of Initial prescriptions (%) Immunologist Paediatrics Other Specialty General Practitioner Unknown
1,590 (33.0%) 1,456 (30.2%)
445 (9.2%) 1,204 (25.0%)
123 (2.6%)
50 (8.6%) 14 (2.4%) 53 (9.2%)
439 (75.8%) 23 (4.0%)
1,540 (36.3%) 1,442 (34.0%)
392 (9.2%) 765 (18.0%) 100 (2.4%)
Any Hospitalizations or emergency visits for anaphylaxis within the last year (%)
13 (0.3%) 0 (0.0%) 13 (0.3%)
Physician office visits within the last year
Median (IQR) 11 (6-19) 10 (6-16) 12 (6-20) *In accordance with the ICES privacy policy, in cases where the number of total users is less than 6, this number has been suppressed to ensure confidentiality. In cases where there is only one record being suppressed, another record has been suppressed (by providing a range in values) as well in order to avoid residual disclosure issues.
Among a sample of 4,818 patients treated with publicly funded allergen extracts in Ontario in 2013, the majority (88%) were treated with non-pollen allergen extracts.

FINAL REPORT 26
September 2015 odprn.ca Ontario Drug Policy Research Network
Summary of Findings for Exhibit 12
1. During FY 2013 f, 743 unique prescribers submitted 18,433 allergen extract claims for public reimbursement.
2. 10% of prescribers (N=74) accounted for 88% of allergen extract claims (N=16,221) submitted for public reimbursement. This likely reflects that a small number of specialized physicians, such as allergists and immunologists are initially prescribing these therapies. Less than 6 prescribers accounted for over half (53%) of all prescriptions in this sample.
Exhibit 12: Lorenz curve of number of prescribers of publicly-funded immunotherapy by the number of prescriptions in Ontario
During FY2013, 10% of prescribers (N=74) accounted for 88% of all allergen extract claims (N=16,221) submitted for public reimbursement.
FINAL REPORT 27
September 2015 odprn.ca Ontario Drug Policy Research Network
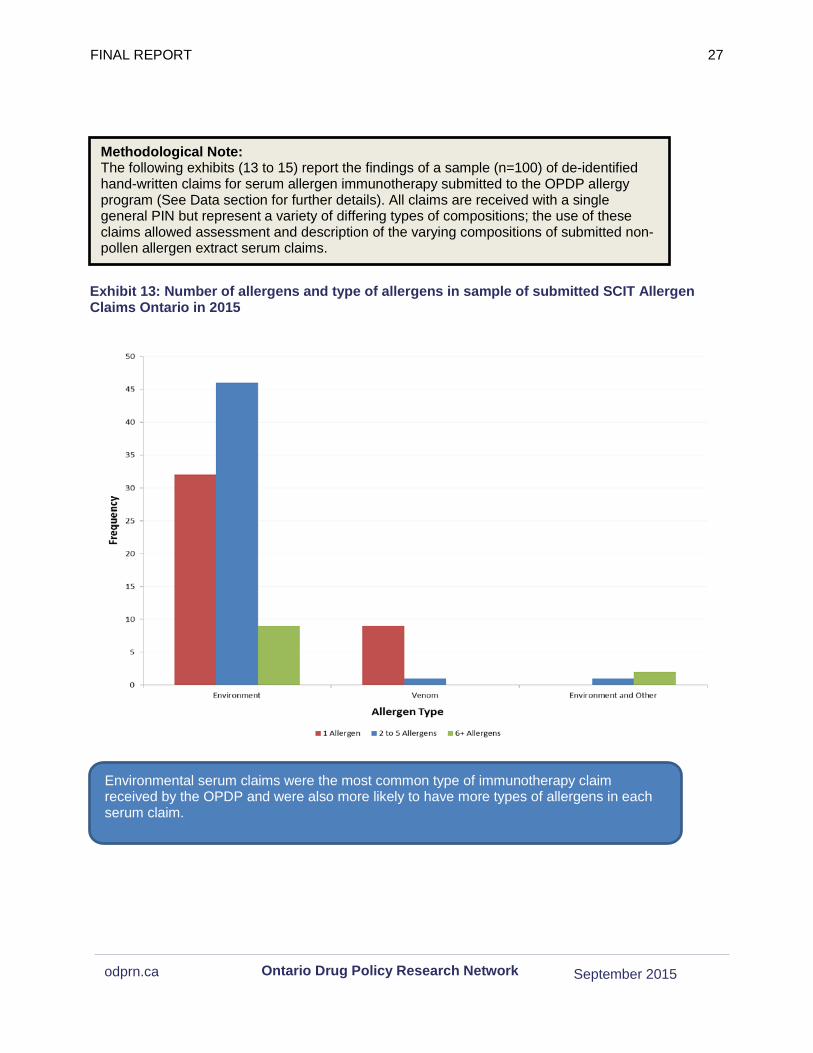
Exhibit 13: Number of allergens and type of allergens in sample of submitted SCIT Allergen Claims Ontario in 2015
Methodological Note: The following exhibits (13 to 15) report the findings of a sample (n=100) of de-identified hand-written claims for serum allergen immunotherapy submitted to the OPDP allergy program (See Data section for further details). All claims are received with a single general PIN but represent a variety of differing types of compositions; the use of these claims allowed assessment and description of the varying compositions of submitted non-pollen allergen extract serum claims.
Environmental serum claims were the most common type of immunotherapy claim received by the OPDP and were also more likely to have more types of allergens in each serum claim.
FINAL REPORT 28
September 2015 odprn.ca Ontario Drug Policy Research Network
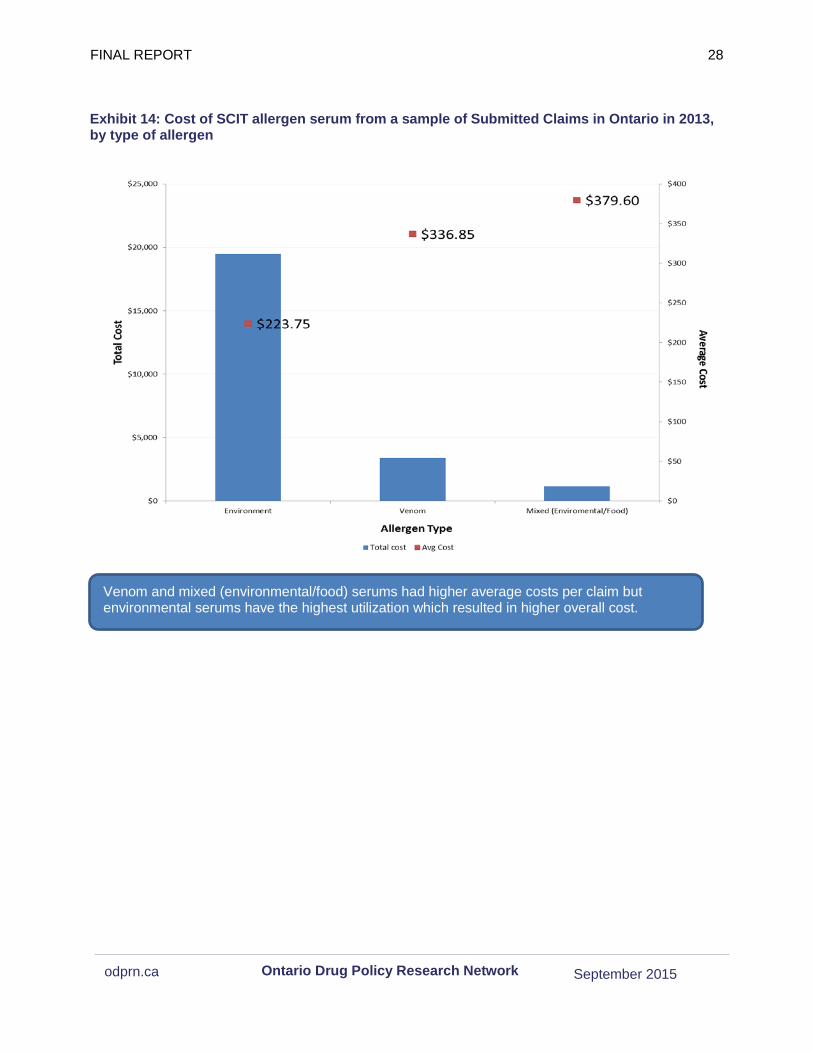
Exhibit 14: Cost of SCIT allergen serum from a sample of Submitted Claims in Ontario in 2013, by type of allergen
Venom and mixed (environmental/food) serums had higher average costs per claim but environmental serums have the highest utilization which resulted in higher overall cost.

FINAL REPORT 29
September 2015 odprn.ca Ontario Drug Policy Research Network
Summary of Findings for Exhibit 13 to 15
1. Environmental allergen serums had the highest number of claims (87%), followed by venom (10%) and mixed (environmental/food) (3%) claims.
2. Venom serums were more likely to have a single allergen (90%) while environmental serums were more likely to have more than one allergen (52% with 2-5 allergens and 10% with 6+ allergens).
3. Environmental serum claims constituted the highest total cost, representing 81% of the total cost ($19,465.88 of a total $23,973.18)
4. Venom and environmental/other allergens cost the most per claim when compared to environment allergens ($336.85 (95% CI $244.26 – $429.44), $379.60 (95% CI $379.60 – $379.60), and $223.75 (95% CI $203.90 – $243.60) per claim, respectively), yet do not make up a large proportion of the total cost due to their lower utilization.
5. Assessment of the stability of this sample of serum claims, according to evidence-based mixture guidelines, found that 13% of claims contained unstable mixtures, and 7% contained risky mixtures.
Exhibit 15: Stability of Allergen Mixtures from a sample of Submitted Claims in Ontario in 2013
Guidelines and studies published regarding mixtures of allergens provide specific direction as to allergen mixture protocol. Based on this evidence, mixtures that are classified as stable retain target activity levels when mixed. Risky mixtures may have proteases that degrade each other if glycerin/diluent levels are not increased substantially. Unstable mixtures are allergen combinations cannot be stabilized by any conditions and do not retain target activity levels2-4
Stability of Serum Stable Risky Unstable
Number of Claims 80 7 13

FINAL REPORT 30
September 2015 odprn.ca Ontario Drug Policy Research Network
Health Equity Given the passive nature of the restricted listing of these products on the Ontario public drug formulary, rates of use among those eligible for drug coverage in Ontario are among the highest in Canada. This suggests that there are no considerable barriers to access of these products. Access to specialist may be the only factor limiting access as we found that the majority of claims were received from a small number of specialists.
Limitations Data Availability Several limitations to the availability of data warrant discussion:
1. No data is available for the Territories, and therefore all analyses are restricted to inter-provincial comparisons.
2. IMS Geographic Prescription Monitor (GPM12) does not collect patient-level data, and therefore information on privately funded prescriptions is only available at the prescription and unit (e.g. tablet) level.
3. IMS Geographic Prescription Monitor (GPM12) only collects prescriptions dispensed from pharmacies. A large amount of prescriptions for immunotherapy is dispensed and/or administered directly from doctors’ offices and thus would not be captured.
4. Data on the number of active beneficiaries eligible for public drug coverage was estimated based on active prescriptions in each quarter and annually. Therefore, these may slightly underestimate the true size of the public beneficiary population; however, this does reflect the number of active beneficiaries (e.g. those filling at least one prescription over a given year) each year.
5. All data presented are based on prescriptions filled. We are unable to confirm whether a patient actually took the medication.
6. Findings based on ICES drug claims are not representative since it only includes electronically submitted claims. We assumed this type of submission was random but it is unknown if perhaps specific types of claims and/or prescribers may use electronic submissions.
Overall Conclusion Since the introduction of newer SLIT agents there is an apparent market expansion that is ongoing nationally and in Ontario. We expect to see continued growth in the utilization and cost of these agents in the future. Current use of SCIT therapy remains the main driver of spending in this drug class for the Ontario Public Drug Program, but these costs have remained relatively stable over the last few years. Within the non-pollen allergy serum claims there is apparent

FINAL REPORT 31
September 2015 odprn.ca Ontario Drug Policy Research Network
heterogeneity in the costs and therapies submitted, for which harmonization may be an appropriate next-step. Evidence of possibly inappropriate mixtures of allergens that may lead to subtherapeutic unstable serums warrants attention to improve quality.
FINAL REPORT 32
September 2015 odprn.ca Ontario Drug Policy Research Network
Reference List 1. Levy AR, O'Brien BJ, Sellors C, Grootendorst P, Willison D. Coding accuracy of administrative
drug claims in the Ontario Drug Benefit database. Can J Clin Pharmacol 2003;10(2):67-71. 2. Kim H, Moote W, Waserman S. Immunotherapy Manual. 2010:12. 3. Esch RE, Grier TJ. Allergen Compatibilities in Extract Mixtures. Immunol Allergy Clin North
Am. 2011;31(2):227-239. doi:10.1016/j.iac.2011.02.009. 4. Grier TJ, Lefevre DM, Duncan E a., Esch RE, Coyne TC. Allergen stabilities and
compatibilities in mixtures of high-protease fungal and insect extracts. Ann Allergy, Asthma Immunol. 2012;108(6):439-447. doi:10.1016/j.anai.2012.04.012
.
FINAL REPORT 33
September 2015 odprn.ca Ontario Drug Policy Research Network
Review of the Observational Literature Objectives A review of the observational literature on adherence of allergen immunotherapy will help provide real-world estimates for these products.
Methods Search Strategy We conducted a rapid review of the observational literature to investigate the adherence of SCIT and SLIT immunotherapies. The search strategy performed can be found in Appendix B. The inclusion criteria for text screening are as below:
Inclusion Criteria: • English language • Published between 2000 and 2015 • Adherence outcome reported and is one of the objectives of the study • Environmental or venom allergies • Non-protocol driven, real-world studies • Sample Size: n>100 • Follow-up period: > 6 months • Full peer-reviewed articles (no letters to the editors etc.)
Results Overall, 1,323 abstracts were reviewed, and 65 potentially relevant articles were obtained in full text. 12 of these studies were identified for the final review by meeting the inclusion criteria (Appendix C). This review focused on SCIT and SLIT adherence rates, as well as potential differences in adherence between them, and factors that may contribute to variations in adherence rates.
Overview of Adherence Rates
Out of the 12 identified studies, four studies examined adherence to SLIT alone,1,2,3,4 three studies to SCIT alone5,6,7 and five studies examined both SCIT and SLIT.8,9,10,11,12 Adherence across studies for both SLIT and SCIT was quite variable, ranging from 7-99.3% for SLIT and 3.9-96.3% for SCIT. This variation is largely explained by the high level of heterogeneity in the identified studies. Similarly, safety outcomes were also reported with considerable heterogeneity.
SLIT only
The four studies that examined SLIT only reported adherence ranging from 69.0- to 99.3%. Large variation among studies was observed in terms of variations in adherence definitions, type of allergen and age of patients. The highest adherence was found by Agostinis et al. reporting a 99.3% (n=433) adherence among pediatric patients with a follow-up ranging from 6 to 24 months.1 The authors of this study followed patients at 3-month intervals and defined adherence for each subject differently, meaning that some patients considered adherent only had two follow-up visits (6 months), possibly
FINAL REPORT 34
September 2015 odprn.ca Ontario Drug Policy Research Network
introducing bias to the findings and leading to the higher rate of reported adherence.
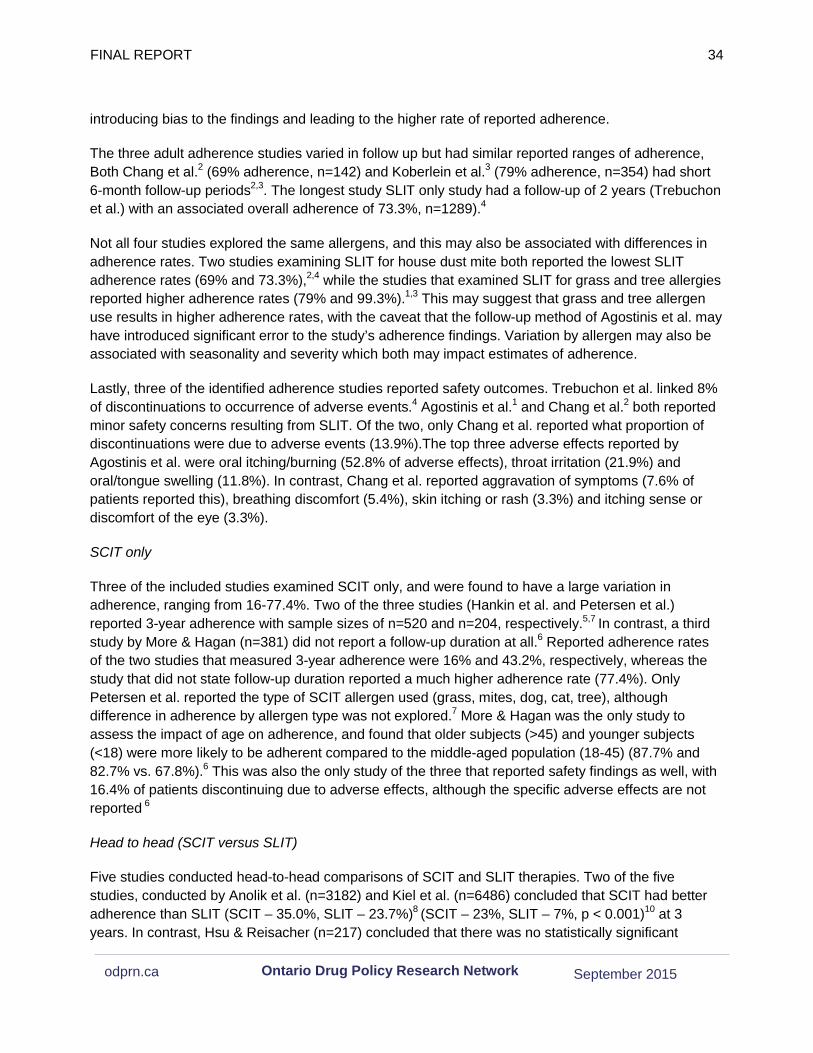
The three adult adherence studies varied in follow up but had similar reported ranges of adherence, Both Chang et al.2 (69% adherence, n=142) and Koberlein et al.3 (79% adherence, n=354) had short 6-month follow-up periods2,3. The longest study SLIT only study had a follow-up of 2 years (Trebuchon et al.) with an associated overall adherence of 73.3%, n=1289).4
Not all four studies explored the same allergens, and this may also be associated with differences in adherence rates. Two studies examining SLIT for house dust mite both reported the lowest SLIT adherence rates (69% and 73.3%),2,4 while the studies that examined SLIT for grass and tree allergies reported higher adherence rates (79% and 99.3%).1,3 This may suggest that grass and tree allergen use results in higher adherence rates, with the caveat that the follow-up method of Agostinis et al. may have introduced significant error to the study’s adherence findings. Variation by allergen may also be associated with seasonality and severity which both may impact estimates of adherence.
Lastly, three of the identified adherence studies reported safety outcomes. Trebuchon et al. linked 8% of discontinuations to occurrence of adverse events.4 Agostinis et al.1 and Chang et al.2 both reported minor safety concerns resulting from SLIT. Of the two, only Chang et al. reported what proportion of discontinuations were due to adverse events (13.9%).The top three adverse effects reported by Agostinis et al. were oral itching/burning (52.8% of adverse effects), throat irritation (21.9%) and oral/tongue swelling (11.8%). In contrast, Chang et al. reported aggravation of symptoms (7.6% of patients reported this), breathing discomfort (5.4%), skin itching or rash (3.3%) and itching sense or discomfort of the eye (3.3%).
SCIT only
Three of the included studies examined SCIT only, and were found to have a large variation in adherence, ranging from 16-77.4%. Two of the three studies (Hankin et al. and Petersen et al.) reported 3-year adherence with sample sizes of n=520 and n=204, respectively.5,7 In contrast, a third study by More & Hagan (n=381) did not report a follow-up duration at all.6 Reported adherence rates of the two studies that measured 3-year adherence were 16% and 43.2%, respectively, whereas the study that did not state follow-up duration reported a much higher adherence rate (77.4%). Only Petersen et al. reported the type of SCIT allergen used (grass, mites, dog, cat, tree), although difference in adherence by allergen type was not explored.7 More & Hagan was the only study to assess the impact of age on adherence, and found that older subjects (>45) and younger subjects (<18) were more likely to be adherent compared to the middle-aged population (18-45) (87.7% and 82.7% vs. 67.8%).6 This was also the only study of the three that reported safety findings as well, with 16.4% of patients discontinuing due to adverse effects, although the specific adverse effects are not reported 6
Head to head (SCIT versus SLIT)
Five studies conducted head-to-head comparisons of SCIT and SLIT therapies. Two of the five studies, conducted by Anolik et al. (n=3182) and Kiel et al. (n=6486) concluded that SCIT had better adherence than SLIT (SCIT – 35.0%, SLIT – 23.7%)8 (SCIT – 23%, SLIT – 7%, p < 0.001)10 at 3 years. In contrast, Hsu & Reisacher (n=217) concluded that there was no statistically significant
FINAL REPORT 35
September 2015 odprn.ca Ontario Drug Policy Research Network
difference (withdrawals after 3 years: SCIT – 45%, SLIT – 41%, p=0.67)9 and Sieber et al. (n=1409) concluded that SLIT was superior to SCIT (2-year adherence: SLIT – 51%, SCIT – 34%, p < 0.011).11 The fifth study, by Vance et al. (n=323) did not statistically test the difference but reported higher adherence for SLIT than for SCIT (withdrawals: SLIT – 2.5%, SCIT – 3.7%).12
The variations in head-to-head study results may be attributed to heterogeneity in definitions of adherence. For example, although all of the head-to-head studies examined three-year adherence, Sieber et al. examined two-year adherence only. Furthermore, Anolik et al. did not censor patients whose treatment was ongoing at the end of the observation window. In this way, this study concluded that SCIT was superior to SLIT. However, if the patients with ongoing therapy were censored and only patients who discontinued or completed therapy during the 3-year observation window were included, SLIT was found to be superior. Hence, no definitive conclusion can be made regarding the superiority of SCIT or SLIT due to the heterogeneity and low quality of the evidence available.
Explaining the variation – Population differences
The large variation of adherence estimates reported could be attributed to the considerable heterogeneity in methods of the identified studies. Duration of follow-up, age and type of allergen can influence adherence to allergen immunotherapy. Controlling for the effects of these variables is important to improve the quality of future studies.
Duration of follow-up
Much of the variance in reported adherence from the studies evaluated was due to differences in follow-up periods. If only examining the five studies that reported a three-year adherence rate5,7,8,9,10 (as this is the generally accepted minimum duration of time necessary to observe the effects of disease modification for immunotherapy), the reported adherence rates from all studies decreased, 7-59% for SLIT and 16-55% for SCIT. Only one study reported a five-year adherence rate for SCIT, which was even lower than the majority of 3-year adherence rates at 11.3%.7
Age
The range of ages in the studies identified was 3 to 44 years. Two studies consisted of only pediatric populations and reported extremely high adherence rates at 99.3%1 and 94.8%.12 However, it should be noted that both of these studies used atypical follow-period definitions. Agostinis et al.1 followed up patients for 6-24 months at 3-month intervals and Vance et al.12 reported adherence based on treatment cycles, not based on 3-year adherence for individual patients, and as such, both studies likely inflated their estimates. Neither of these studies provided useful information regarding adherence of children over a long period of time.
Five studies assessed the correlation of age and adherence, with all five finding some sort of relationship.4,6,8,10,11 Three out of five concluded that younger individuals are more likely to be adherent,4,8,10 while one study reported that older individuals are more adherent.11 When More & Hagan6 explored the variation in the relationship between age and adherence, the study found that those <18 and >45 demonstrated the best adherence (82.7% and 87.7% respectively), whereas the adult age group between the aged of 18 and 45 years demonstrated the worst adherence (67.8%).

FINAL REPORT 36
September 2015 odprn.ca Ontario Drug Policy Research Network
Evidence of a correlation between age and adherence seems apparent, yet five of the studies included in the review did not stratify or control for the age variable.2,3,5,7,9 As such, these studies may have confounded their adherence results, depending on the age distribution of each study’s sample.
Type of Allergen
Some evidence indicated that adherence may vary by allergen type. Although most of the identified studies examined patients with a variety of sensitivities, seven studies examined adherence to serums with specific allergens.1,2,3,4,7,10,11 These allergens included grass, tree and house dust mites. Only one study, by Kiel et al., compared adherence by allergen.10 The study found that median treatment duration for grass and tree allergen users was significantly (p <0.001) longer (1 year) than for dust mite allergen users (0.7 years). The study suggested that low adherence rates in those given house dust mite allergens may have been due to inadequate efficacy evidence for house dust mite SLIT compared to other immunotherapies. This finding validated the findings from the studies that evaluated SLIT only, where the highest adherence rates were found by the studies that examined grass and tree allergens as opposed to house dust mite allergens. This difference as well as differences in adherence between other allergens must be confirmed in future studies.
Factors influencing adherence
The identified studies also investigated reasons for discontinuation in order to ultimately provide better information to help improve adherence.
Five studies examined the relationship between safety and adherence and found that adverse events caused 6-100% of discontinuations.1,2,4,6,8 However, one of these studies by Agostinis et al.1 was likely inaccurate due to the variable follow-up period (6-24 months) reported. Excluding this outlier, the percentage of discontinuations attributed to adverse events was relatively low (6-16.4%). The specific adverse events that were reported were mostly minor and/or local, such as throat irritation or gastrointestinal issues.
Studies also explored other possible reasons for discontinuation, such as lack of efficacy,2,4,8,9 financial concerns,2,8,9 inability to follow treatment schedule,2 sex,2,3,11 regimen schedule (rush or conventional),3,6 inconvenience,2,6,9 and other unrelated medical conditions, such as pregnancy.2,6,9 These factors were assessed either by retrospective chart review3,4,8,11 or interviews with patients.2,6,9 Further research is needed to understand the extent of their effect on adherence and control for these effects. For example, although financial concerns are often cited as a reason for discontinuation, a study performed by Hankin et al. using a Medicaid database where treatment was publicly covered found that 3-year adherence was only 16%.5 As such, the degree to which these factors affect SCIT and SLIT must be further clarified, in order to better understand and improve adherence to allergen immunotherapy.
Limitations
The current review is a rapid review of observational evidence that used a broad range of search terms in order to be inclusive of all possibly eligible studies. However, it still may not have included all observational evidence of adherence to allergen immunotherapy. We leveraged published systematic
FINAL REPORT 37
September 2015 odprn.ca Ontario Drug Policy Research Network
reviews to further ensure the completeness of our review.13,14
Additionally, the literature included had limited generalizability based on location of study and industry sponsorship. Four of the included studies 5,6,8,9 were conducted in the US, with none of the studies conducted in Canada; however, we do not believe that this would greatly limit the generalizability of the information to the Ontario population. Lastly, all of the studies, with the exception of two studies,2,6 were, in some form, industry-funded, Therefore, the current literature on this therapeutic area appears to be heavily influenced and funded by industry sponsorship, and this should be taken into account when appraising results, specifically those with a comparative nature.
Conclusions Studies investigating the adherence of SCIT and SLIT therapies varied widely in their reported adherence rates and the study results are generally inconclusive. Results are heavily limited by the largely heterogeneity and confounding across studies. Although clinical consensus is that patients must adhere to immunotherapy for 3 years in order for disease modification to occur, studies demonstrated that the maximum adherence to allergen immunotherapy at 3 years may be half of the patients who initiated the therapy, if not lower. This is concerning considering that adherence is essential to treatment success in the case of allergen immunotherapy. Numerous reasons for discontinuation were explored, with adverse events found to be only a small factor contributing to discontinuation. Future research should further explore reasons for discontinuation for both SCIT and SLIT utilizing standardized 3-year study designs that longitudinally assess or control for the various factors influencing adherence in the real-world.
References
1. Agostinis F, Foglia C, Landi M, et al. The safety of sublingual immunotherapy with one or multiple pollen allergens in children. Allergy Eur J Allergy Clin Immunol. 2008;63(2):1637-1639. doi:10.1111/j.1398-9995.2008.01742.x.
2. Chang H, Han DH, Mo J-H, et al. Early compliance and efficacy of sublingual immunotherapy in patients with allergic rhinitis for house dust mites. Clin Exp Otorhinolaryngol. 2009;2(3):136-140. doi:10.3342/ceo.2009.2.3.136.
3. Köberlein J, Kothe AC, Sieber J, Mösges R. Determining factors of patient compliance to treatment in allergic rhinitis. Asian Pac J Allergy Immunol. 2013;31:148-156. doi:10.12932/AP0264.31.2.2013.
4. Trebuchon F, David M, Demoly P. MEDICAL MANAGEMENT AND SUBLINGUAL IMMUNOTHERAPY PRACTICES IN PATIENTS WITH HOUSE DUST MITE-INDUCED RESPIRATORY ALLERGY: A RETROSPECTIVE, OBSERVATIONAL STUDY. Al. Int J Immunopathol Pharmacol. 2012;25(1):193-206.
5. Hankin CS, Cox L, Lang D, et al. Allergy immunotherapy among Medicaid-enrolled children with allergic rhinitis: Patterns of care, resource use, and costs. J Allergy Clin Immunol. 2008;121:227-232. doi:10.1016/j.jaci.2007.10.026.

FINAL REPORT 38
September 2015 odprn.ca Ontario Drug Policy Research Network
6. More DR, Hagan LL. Factors affecting compliance with allergen immunotherapy at a military medical center. Ann Allergy Asthma Immunol. 2002;88(4):391-394. doi:10.1016/S1081-1206(10)62370-8.
7. Dam Petersen K, Gyrd-Hansen D, Kjaergaard S, Dahl R. Clinical and patient based evaluation of immunotherapy for grass pollen and mite allergy. Allergol Immunopathol (Madr). 2005;33(5):264-269. doi:10.1157/13080929.
8. Anolik R, Schwartz AM, Sajjan S, Allen-Ramey F. Patient initiation and persistence with allergen immunotherapy. Ann Allergy, Asthma Immunol. 2014;113(1):101-107. doi:10.1016/j.anai.2014.04.008.
9. Hsu NM, Reisacher WR. A comparison of attrition rates in patients undergoing sublingual immunotherapy vs subcutaneous immunotherapy. Int Forum Allergy Rhinol. 2012;2(4):280-284. doi:10.1002/alr.21037.
10. Kiel M a., Röder E, Gerth Van Wijk R, Al MJ, Hop WCJ, Rutten-Van Mölken MPMH. Real-life compliance and persistence among users of subcutaneous and sublingual allergen immunotherapy. J Allergy Clin Immunol. 2013;132. doi:10.1016/j.jaci.2013.03.013.
11. Sieber J, De Geest S, Shah-Hosseini K, Mösges R. Medication persistence with long-term, specific grass pollen immunotherapy measured by prescription renewal rates. Curr Med Res Opin. 2011;27(4):855-861. doi:10.1185/03007995.2011.559538.
12. Vance GHS, Goldring S, Warner JO, et al. A national audit of pollen immunotherapy for children in the United Kingdom: Patient selection and programme safety. Clin Exp Allergy. 2011;41:1313-1323. doi:10.1111/j.1365-2222.2011.03803.x.
13. Sieber J, Köberlein J, Mösges R. Sublingual immunotherapy in daily medical practice: effectiveness of different treatment schedules - IPD meta-analysis. Curr Med Res Opin. 2010;26(4):925-932. doi:10.1185/03007991003659483.
14. Dranitsaris G, Ellis AK. Sublingual or subcutaneous immunotherapy for seasonal allergic rhinitis: An indirect analysis of efficacy, safety and cost. J Eval Clin Pract. 2014;20:225-238. doi:10.1111/jep.12112.

FINAL REPORT 39
September 2015 odprn.ca Ontario Drug Policy Research Network
Appendix A: Public Plan Listings for Allergen Immunotherapies in Canada, by Province
Drug BC AB SK MB ON QC NB NS PEI NL YK NIHB/ NU/ NW
Sublingual allergen immunotherapy Oralair No No No Res Pas Pas No Res No No No No Ragwitek No No No No Pas No No No No No No No Grastek No No No No No Pas No No No No No No Subcutaneous allergen immunotherapy Pollinex R No No No No SDP No No Res No No No FB Allergen extracts
FB FB No No* SDP FB SA Res SA FB No FB
No=not listed Pas=restricted listing – passive (e.g., Limited Use in Ontario, Exceptional Medications in Quebec) Res=restricted listing – enforced FB=full benefit SDP=Special drug program SA=covered under Social Assistance program *Only cover stinging insect (Hymenoptera) immunotherapy Current as of July 6, 2015

FINAL REPORT 40
September 2015 odprn.ca Ontario Drug Policy Research Network
Appendix B: Medline Search Strategy Search Strategy: (immunotherapy) AND (adherence OR compliance OR dropout* OR discontinu* OR attrition OR withdraw* OR persistence) (1849)
Limit to English, Humans (1466)
Limit to not RCT (1323)
FINAL REPORT 41
September 2015 odprn.ca Ontario Drug Policy Research Network
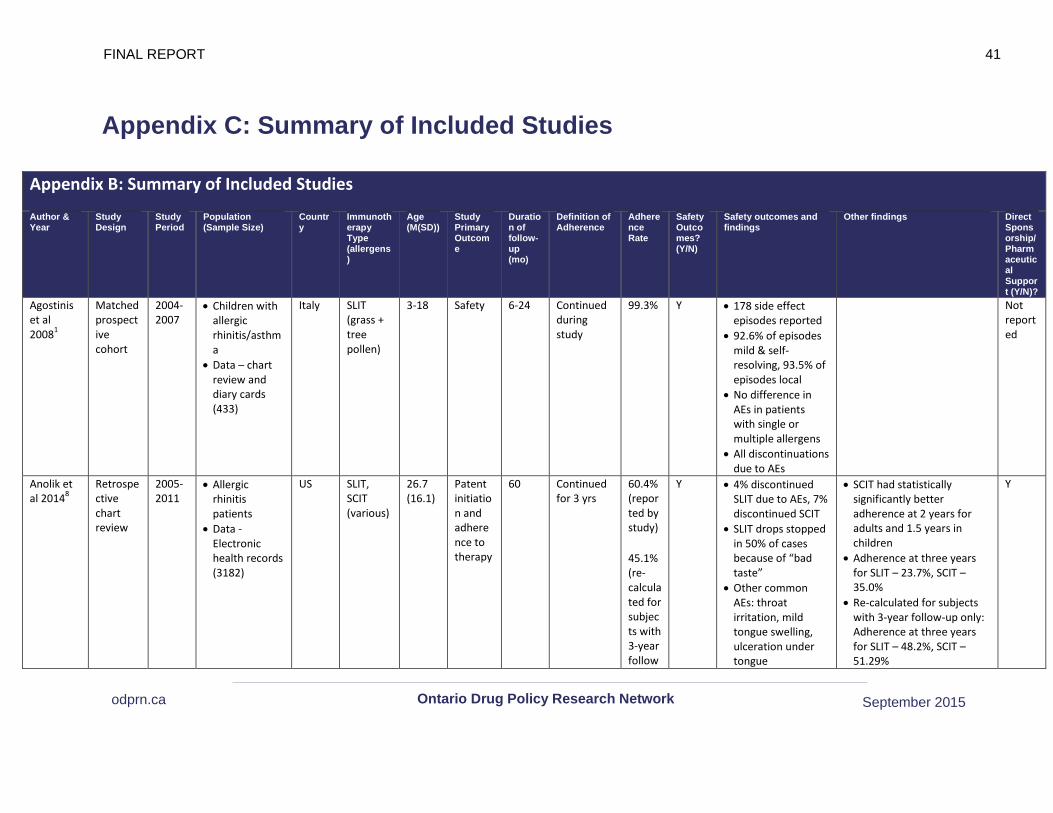
Appendix C: Summary of Included Studies
Appendix B: Summary of Included Studies
Author & Year
Study Design
Study Period
Population (Sample Size)
Country
Immunotherapy Type (allergens)
Age (M(SD))
Study Primary Outcome
Duration of follow-up (mo)
Definition of Adherence
Adherence Rate
Safety Outcomes? (Y/N)
Safety outcomes and findings
Other findings Direct Sponsorship/Pharmaceutical Support (Y/N)?
Agostinis et al 20081
Matched prospective cohort
2004-2007
• Children with allergic rhinitis/asthma
• Data – chart review and diary cards (433)
Italy SLIT (grass + tree pollen)
3-18 Safety 6-24 Continued during study
99.3% Y • 178 side effect episodes reported
• 92.6% of episodes mild & self-resolving, 93.5% of episodes local
• No difference in AEs in patients with single or multiple allergens
• All discontinuations due to AEs
Not reported
Anolik et al 20148
Retrospective chart review
2005-2011
• Allergic rhinitis patients
• Data - Electronic health records (3182)
US SLIT, SCIT (various)
26.7 (16.1)
Patent initiation and adherence to therapy
60 Continued for 3 yrs
60.4% (reported by study)
45.1% (re-calculated for subjects with 3-year follow
Y • 4% discontinued SLIT due to AEs, 7% discontinued SCIT
• SLIT drops stopped in 50% of cases because of “bad taste”
• Other common AEs: throat irritation, mild tongue swelling, ulceration under tongue
• SCIT had statistically significantly better adherence at 2 years for adults and 1.5 years in children
• Adherence at three years for SLIT – 23.7%, SCIT – 35.0%
• Re-calculated for subjects with 3-year follow-up only: Adherence at three years for SLIT – 48.2%, SCIT – 51.29%
Y

FINAL REPORT 42
September 2015 odprn.ca Ontario Drug Policy Research Network
-up only)
• 3% discontinued SLIT because of lack of efficacy, 4% for financial reasons, 20% for other reasons
• 1% discontinued SCIT because of lack of efficacy, 4% for financial, 21% for other reasons
Chang et al 20092
Prospective cohort
2007-2008
• Patients with allergic rhinitis to dust mites
• Data - Chart review and interviews (142)
Korea SLIT (Dp and Df dust mites)
16.3 (5-71)
Efficacy and safety
6 Continued throughout study
69% Y • Incidence of AEs after 6 months: 14.1%
• AEs causing discontinuation: aggravation of AR (n=2), fever (n=1), GI issues (n=1), skin rash (n=1)
• Reasons for discontinuation: difficulty following schedule (27.8%), ineffectiveness (22.2%), discomfort of visiting hospital regularly (16.7%), AEs (13.9%)
N/N
Hankin et al 20085
Retrospective claims data
1994-2004
• Allergic rhinitis patients receiving de novo IT
• Data – Florida Medicaid database (520)
US SCIT (various)
8.2 (3.1)
Patterns of care & resource use associated with immunotherapy
36 Adhered for 3+ years
16% N • Mean duration of treatment: 17 months (SD: 17.6)
N/Y
Hsu & Reisacher 20129
Retrospective chart
2007-2010
• Individuals who received immunotherapy
US SLIT/SCIT (various)
SCIT: 36.6 (8-82), SLIT:
Adherence
36 Adhered for 3+ years
56.68%
N • 45% of patients on SCIT withdrew, 41% on SLIT withdrew (no significant difference)
N/Y
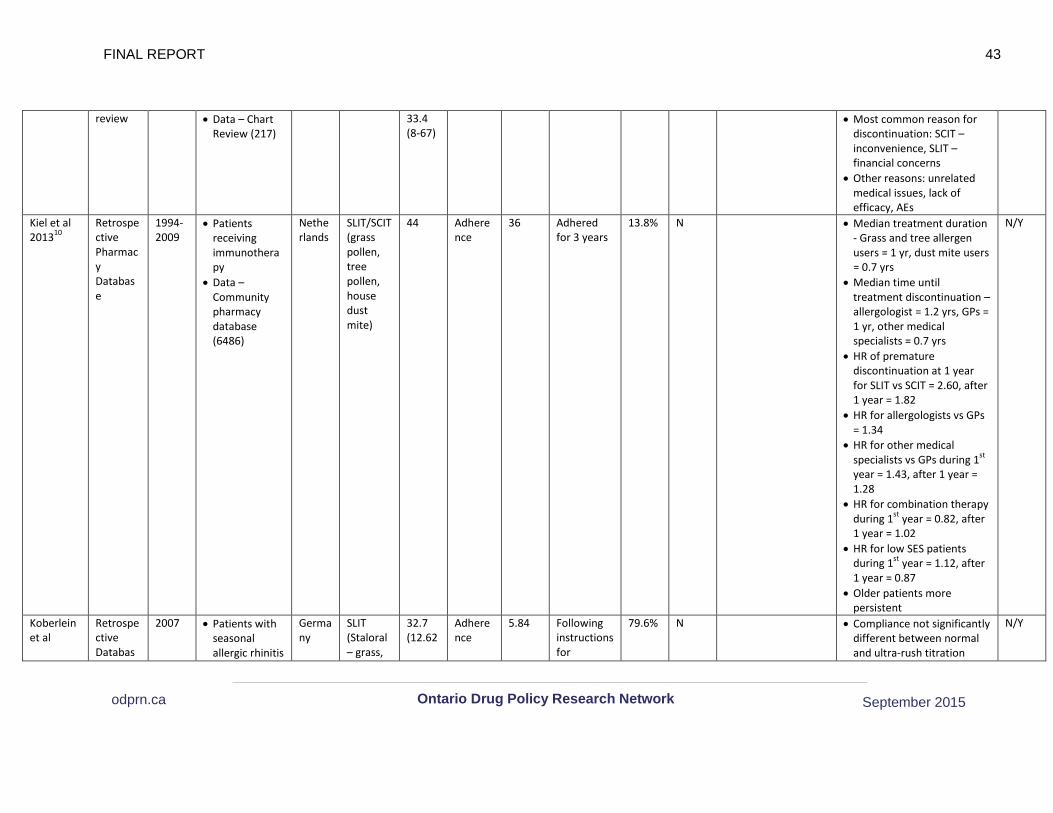
FINAL REPORT 43
September 2015 odprn.ca Ontario Drug Policy Research Network
review • Data – Chart Review (217)
33.4 (8-67)
• Most common reason for discontinuation: SCIT – inconvenience, SLIT – financial concerns
• Other reasons: unrelated medical issues, lack of efficacy, AEs
Kiel et al 201310
Retrospective Pharmacy Database
1994-2009
• Patients receiving immunotherapy
• Data – Community pharmacy database (6486)
Netherlands
SLIT/SCIT (grass pollen, tree pollen, house dust mite)
44 Adherence
36 Adhered for 3 years
13.8% N • Median treatment duration - Grass and tree allergen users = 1 yr, dust mite users = 0.7 yrs
• Median time until treatment discontinuation – allergologist = 1.2 yrs, GPs = 1 yr, other medical specialists = 0.7 yrs
• HR of premature discontinuation at 1 year for SLIT vs SCIT = 2.60, after 1 year = 1.82
• HR for allergologists vs GPs = 1.34
• HR for other medical specialists vs GPs during 1st year = 1.43, after 1 year = 1.28
• HR for combination therapy during 1st year = 0.82, after 1 year = 1.02
• HR for low SES patients during 1st year = 1.12, after 1 year = 0.87
• Older patients more persistent
N/Y
Koberlein et al
Retrospective Databas
2007 • Patients with seasonal allergic rhinitis
Germany
SLIT (Staloral – grass,
32.7 (12.62
Adherence
5.84 Following instructions for
79.6% N • Compliance not significantly different between normal and ultra-rush titration
N/Y
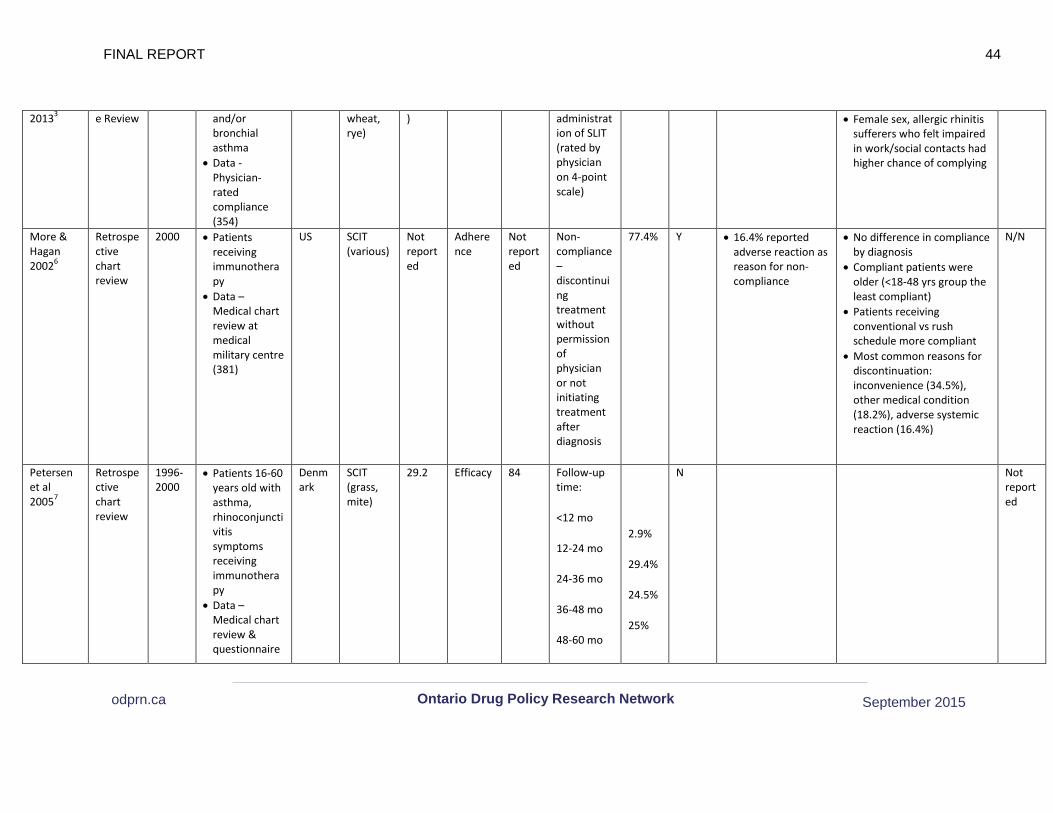
FINAL REPORT 44
September 2015 odprn.ca Ontario Drug Policy Research Network
20133 e Review and/or bronchial asthma
• Data - Physician-rated compliance (354)
wheat, rye)
) administration of SLIT (rated by physician on 4-point scale)
• Female sex, allergic rhinitis sufferers who felt impaired in work/social contacts had higher chance of complying
More & Hagan 20026
Retrospective chart review
2000 • Patients receiving immunotherapy
• Data – Medical chart review at medical military centre (381)
US SCIT (various)
Not reported
Adherence
Not reported
Non-compliance – discontinuing treatment without permission of physician or not initiating treatment after diagnosis
77.4% Y • 16.4% reported adverse reaction as reason for non-compliance
• No difference in compliance by diagnosis
• Compliant patients were older (<18-48 yrs group the least compliant)
• Patients receiving conventional vs rush schedule more compliant
• Most common reasons for discontinuation: inconvenience (34.5%), other medical condition (18.2%), adverse systemic reaction (16.4%)
N/N
Petersen et al 20057
Retrospective chart review
1996-2000
• Patients 16-60 years old with asthma, rhinoconjunctivitis symptoms receiving immunotherapy
• Data – Medical chart review & questionnaire
Denmark
SCIT (grass, mite)
29.2 Efficacy 84 Follow-up time:
<12 mo
12-24 mo
24-36 mo
36-48 mo
48-60 mo
2.9%
29.4%
24.5%
25%
N Not reported
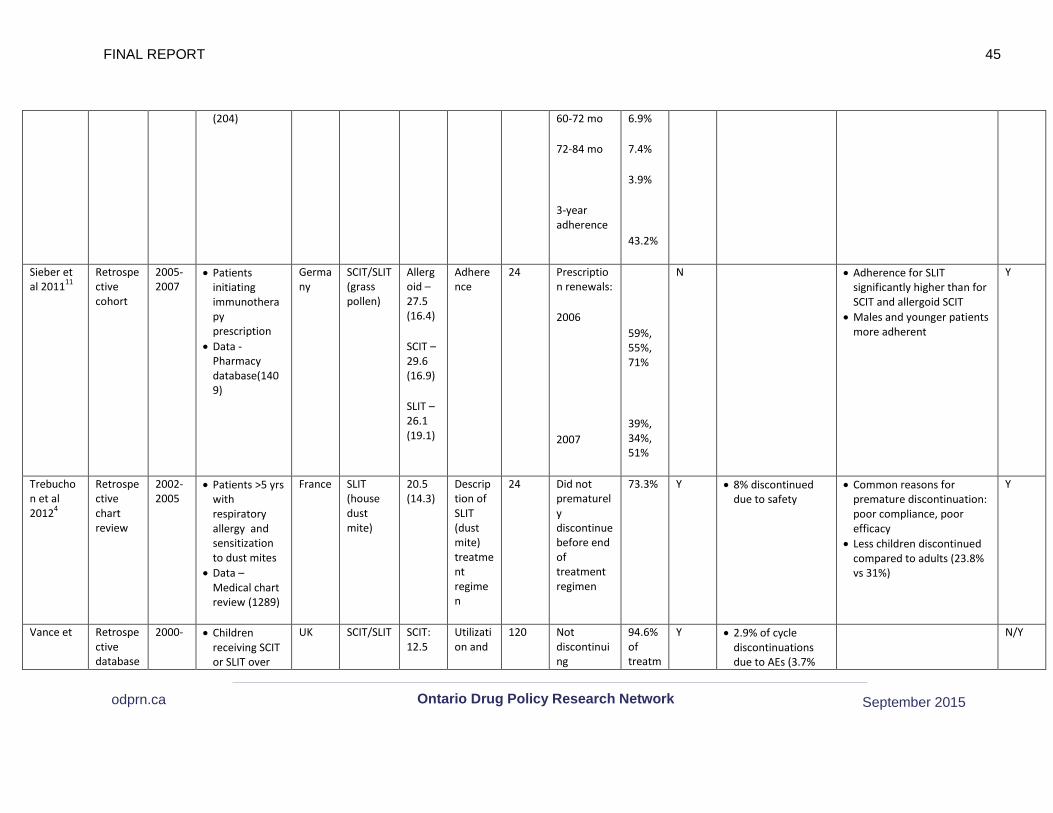
FINAL REPORT 45
September 2015 odprn.ca Ontario Drug Policy Research Network
(204) 60-72 mo
72-84 mo
3-year adherence
6.9%
7.4%
3.9%
43.2%
Sieber et al 201111
Retrospective cohort
2005-2007
• Patients initiating immunotherapy prescription
• Data - Pharmacy database(1409)
Germany
SCIT/SLIT (grass pollen)
Allergoid – 27.5 (16.4)
SCIT – 29.6 (16.9)
SLIT – 26.1 (19.1)
Adherence
24 Prescription renewals:
2006
2007
59%, 55%, 71%
39%, 34%, 51%
N • Adherence for SLIT significantly higher than for SCIT and allergoid SCIT
• Males and younger patients more adherent
Y
Trebuchon et al 20124
Retrospective chart review
2002-2005
• Patients >5 yrs with respiratory allergy and sensitization to dust mites
• Data – Medical chart review (1289)
France SLIT (house dust mite)
20.5 (14.3)
Description of SLIT (dust mite) treatment regimen
24 Did not prematurely discontinue before end of treatment regimen
73.3% Y • 8% discontinued due to safety
• Common reasons for premature discontinuation: poor compliance, poor efficacy
• Less children discontinued compared to adults (23.8% vs 31%)
Y
Vance et Retrospective database
2000- • Children receiving SCIT or SLIT over
UK SCIT/SLIT SCIT: 12.5
Utilization and
120 Not discontinuing
94.6% of treatm
Y • 2.9% of cycle discontinuations due to AEs (3.7%
N/Y

FINAL REPORT 46
September 2015 odprn.ca Ontario Drug Policy Research Network
al 201112 review 2010 past ten years • Data –
medical chart review (323)
(various) (4-18)
SLIT: 10.6 (3-16)
safety treatment during a cycle (one course of subcutaneous injections or daily oral administrations in 1 year)
ent cycles
SCIT, 2.5% SLIT) • 50.4% cycles had
AEs involved • AEs equally
common in SLIT and SCIT regimens
• AEs during SCIT cycles were local delayed (40.5%) and systemic delayed (28.3%)
• AEs during SLIT were local immediate (76%)