ad-a250 219 - dtic · reflector and two-axis positioner comprise the newer compact range (figure...
TRANSCRIPT
UNCLASSIFIEDSECURITY CLASSIFICATION OF THIS PAGE AD-A250 219
Forml Il li I IlT-1EPO1111TI li rf , J oeB No. o70-0 FU
Il il 111H11 11111111111 E xp Date Jun 30, 1986REPORT SECURITY CLSIFC TIN....
nClaS sified WE I
2a. SECURITY CLASSIFICATION AU 0 Y 3. DISTRIBUTIONAVAILABILITY OF REPORT
W__MAY_191992_Approved for public release;2b DECLASSIFICATION/DOWNG CHEDULE distribution unlimited.
4 PERFORMING ORGANIZATION RE T NUMBE~ 5. MONITORING ORGANIZATION REPORT NUMBER(S)
Test Operations Procedure (TOP) 6-2-604
6a. NAME OF PERFORMING ORGANIZATION 6b. OFFICE SYMBOL 7a. NAME OF MONITORING ORGANIZATIONUS Army Electronic Proving (If applicable) US Army Test and Evaluation CommandGround 1 STEEP-TS-R
6c. ADDRESS (City, State, and ZIPCode) 7b. ADDRESS (City, State, and ZIP Code)
Fort Huachuca, AZ 85613-7110 Aberdeen Proving Ground, MD 21005-5055
8a. NAME OF FUNDING i SPONSORING 8b OFFICE SYMBOL 9. PROCUREMENT INSTRUMENT IDENTIFICATION NUMBERORGANIZATION (If applicable)
Same as item 7a. AMSTE-TC-D
8c. ADDRESS (City, State, and ZIP Code) 10. SOURCE OF FUNDING NUMBERS
Same as item 7b. PROGRAM PROJECT TASK WORK UNITELEMENT NO. NO. NO- ACCESSION NO
AMCR 310-6 1A24RgpqL11 TITLE (Include Security Classification)Antenna Pattern Measurement Facilities (U)
-PERSONAL AUTHOR(S)
13a TYPE OF REPORT 13b TIME COVERED 14. DATE OF REPORT (Year, Month, Day) 15 PAGE COUNTFinal FROM TO 1992, April 15 52
16 SUPPLEMENTARY NOTATION
17 COSATI CODES 18. SUBJECT TERMS (Continue on reverse if necessary and identify by block number)
*ELD GROUP SUB-GROUP Outdoor Compact Range, Quiet Zone, Antenna Testing,
09 03 Arc Range, Near Field, Far Field
19 ABSTRACT (Continue on reverse if necessary and identify by block number)
The test operations procedure (TOP) is an overview of procedures for testing antennasusing the automated data acquisition and analysis system (ADAAS) at the Antenna TestFacility (ATF), US Army Electronic Proving Ground, Fort Huachuca, Arizona. The ATF hastwo test ranges: an outdoor compact range and an arc range. The Compact Range uses aparabolic reflector to collimate radio frequency energy in order to simulate far-fieldtesting. A large hydraulic positioner moves the test antenna through azimuth and ele-vation arcs to allow testing of an entire hemisphere of coverage. The Arc Range operatesin the near field using uncollimated RF. It uses a turntable to rotate the test itemthrough the desired range of azimuth; a probe antenna moving along the vertical arcstructure proviaes elevation coverage. The combination provides full hemisphericalcoverage. The TOP describes procedures for measuring antenna gain; locations of beams,
lobes, and nulls; and other antenna characteristics. It contrasts the capabilitiesof the two ranges and provides guidelines to help the user select the right range fora particular test.
2,0 DISTRIBUTION /AVAILABILITY OF ABSTRACT 21 ABSTRACT SECURITY CLASSIFICATION
CM UNCLASSI FIE DUNLIMITE D 0~ SAME AS RPT C3 DTIC USERS Unclassified
2a NAME OF RESPONSIBLE NDIVIDUAI_ 22b TELEPHONE (include Area Coe 7 2c, OFFICE SYMBOL
DD FORM 1473.84 MAR 83 APR c-iion -ay be used until exhausteo SECURIT- CLASSIFICATION OF THIS PAGEAll other editions are obsolete.
UNCLASSIFIED
The use of trade names in this report does not a6nstitute an officialendorsement or approval of the use gf such comnmercial,*ardware orsoftware. This report may not be cited for purposes,of., advertisement.
US ARMY TEST AND EVALUATION COMMANDTEST OPERATIONS PROCEDURE
AMSTE-RP 702Test Operations Procedure 6-2-604 15 April 1992AD No. A248964
ANTENNA PATTERN MEASUREMENT FACILITIES
Paragraph 1. SCOPE ............................................... 22. FACILITIES AND INSTRUMENTATION ...................... 2
2.1 FACILITIES ..................................... 22.2 INSTRUMENTATION ................................ 32.3 COMPARISON OF CAPABILITIES .................. 6
3. PREPARATION FOR TEST ............................... 84. TEST CONTROLS ....................................... 85. PERFORMANCE TESTS ................................... 8
5.1 ANTENNA RADIATION PATTERN MEASUREMENTS ...... 95.1.1 Automated Antenna Pattern Measurements .... 105.1.1.1 Methods .................................... 105.1 '.2 Data Required .............................. 115.1 - Manual Antenna Pattern Measurements ....... 115.1.2.1 Methods .................................... 115.1.2.2 *Data Required .............................. 115.2 ANTENNA GAIN MEASUREMENTS ...................... 145.2.1 Automated Antenna Gain Measurements ....... 145.2.1.1 Method ..................................... 145.2.1.2 Data Required .............................. 155.2.2 Manual Antenna Gain Measurements ........... 155.2.2.1 Method ..................................... 155.2.2.2 Data Required .............................. 165.2.3 Weather Effects on Antenna Gain Measurement 16
6. DATA REDUCTION, PRESENTATION, AND ANALYSES ....... 166.1 REDUCTION ...................................... 166.2 PRESENTATION ................................... 176.2.1 Rectangular Antenna Pattern Plots ......... 176.2.2 Polar Antenna Pattern Plots ............... 176.2.3 Three-Dimensional Antenna Pattern Plots ... 176.3 ANALYSES ....................................... 216.3.1 Gain ... ...................................... 216.3.2 Main Beam Location ........................... 216.3.3 Beamwidths ................................... 216.3.4 Sidelobe Levels and Locations ............. 216.3.5 Null Depths and Locations ................. 226.3.6 Secondary Peaks .............................. 226.3.7 Multiple Beams .............................. 22
Appendix A. Checklists ......................................... A-iB. Data Collection Sheets ........................... B-IC. Measurement Errors Due to Near-Field Effects ..... C-ID. Abbreviations ...................................... D-1
* 92-13194Approved Fo- public release; distribution
unlimited. 92-1319
9?L
TOP 6-2-604 15 April 1992
1. SCOPE
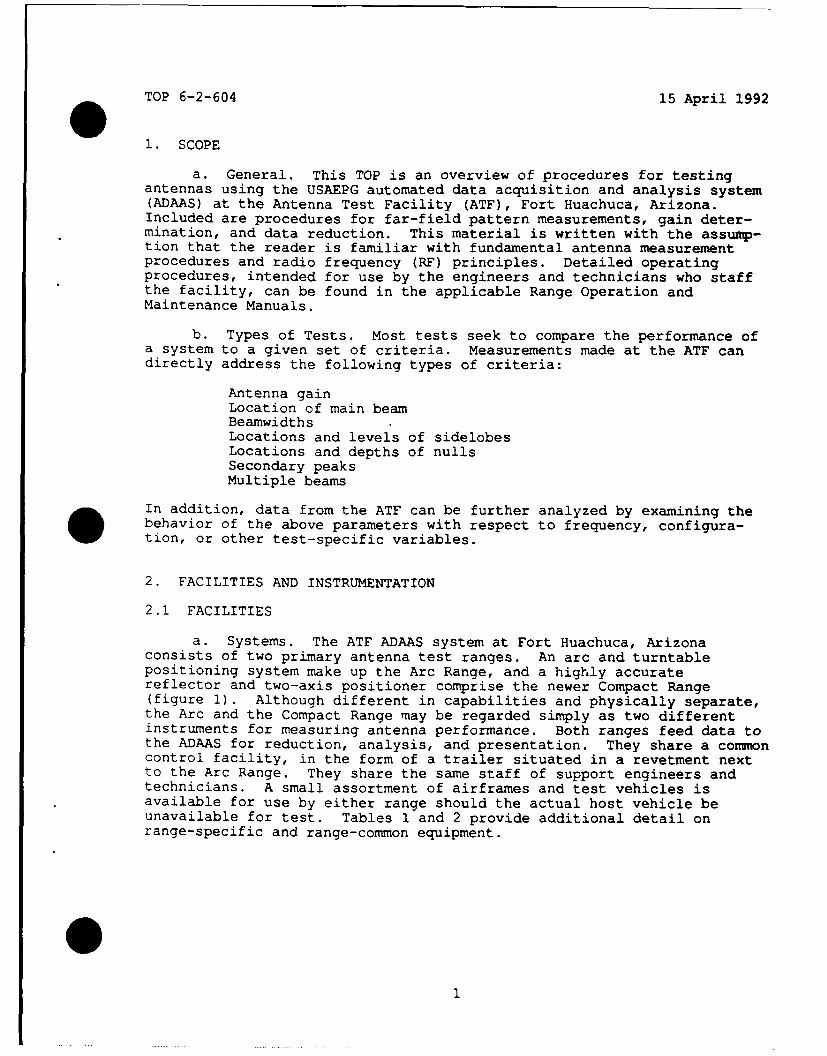
a. General. This TOP is an overview of procedures for testingantennas using the USAEPG automated data acquisition and analysis system(ADAAS) at the Antenna Test Facility (ATF), Fort Huachuca, Arizona.Included are procedures for far-field pattern measurements, gain deter-mination, and data reduction. This material is written with the assump-tion that the reader is familiar with fundamental antenna measurementprocedures and radio frequency (RF) principles. Detailed operatingprocedures, intended for use by the engineers and technicians who staffthe facility, can be found in the applicable Range Operation andMaintenance Manuals.
b. Types of Tests. Most tests seek to compare the performance ofa system to a given set of criteria. Measurements made at the ATF candirectly address the following types of criteria:
Antenna gainLocation of main beamBeamwidthsLocations and levels of sidelobesLocations and depths of nullsSecondary peaksMultiple beams. In addition, data from the ATF can be further analyzed by examining the
behavior of the above parameters with respect to frequency, configura-tion, or other test-specific variables.
2. FACILITIES AND INSTRUMENTATION
2.1 FACILITIES
a. Systems. The ATF ADAAS system at Fort Huachuca, Arizonaconsists of two primary antenna test ranges. An arc and turntablepositioning system make up the Arc Range, and a highly accuratereflector and two-axis positioner comprise the newer Compact Range(figure 1). Although different in capabilities and physically separate,the Arc and the Compact Range may be regarded simply as two differentinstruments for measuring antenna performance. Both ranges feed data tothe ADAAS for reduction, analysis, and presentation. They share a connoncontrol facility, in the form of a trailer situated in a revetment nextto the Arc Range. They share the same staff of support engineers andtechnicians. A small assortment of airframes and test vehicles isavailable for use by either range should the actual host vehicle beunavailable for test. Tables 1 and 2 provide additional detail onrange-specific and range-common equipment.
o1
TOP 6-2-604 15 April 1992
1. SCOPE
a. General. This TOP is an overview of procedures for testingantennas using the USAEPG automated data acquisition and analysis system(ADAAS) at the Antenna Test Facility (ATF), Fort Huachuca, Arizona.included are procedures for far-field pattern measurements, gain deter-mination, and data reduction. This material is written with the assumnp-tion that the reader is familiar with fundamental antenna measurementprocedures and radio frequency (RF) principles. Detailed operatingprocedures, intended for use by the engineers and technicians who staffthe facility, can be found in the applicable Range Operation andMaintenance Manuals.
b. Types of Tests. Most tests seek to compare the performance ofa system to a given set of criteria. Measurements made at the ATF candirectly address the following types of criteria:
Antenna gainLocation of main beamBeamwidthsLocations and levels of sidelobesLocations and depths of nullsSecondary peaksMultiple beams
O In addition, data from the ATF can be further analyzed by examining thebehavior of the above parameters with respect to frequency, configura-tion, or other test-specific variables.
2. FACILITIES AND INSTRUMENTATION
2.1 FACILITIES
a. Systems. The ATF ADAAS system at Fort Huachuca, Arizonaconsists of two primary antenna test ranges. An arc and turntablepositioning system make up the Arc Range, and a highly accuratereflector and two-axis positioner comprise the newer Compact Range(figure 1). Although different in capabilities and physically separate,the Arc and the Compact Range may be regarded simply as two differentinstruments for measuring antenna performance. Both ranges feed data tothe ADAAS for reduction, analysis, and presentation. They share a commoncontrol facility, in the form of a trailer situated in a revetment nextto the Arc Range. They share the same staff of support engineers andtechnicians. A small assortment of airframes and test vehicles isavailable for use by either range should the actual host vehicle beunavailable for test. Tables 1 and 2 provide additional detail onrange-specific and range-common equipment.
1
TOP 6-2-604 15 April 1992
b. Positioning Systems. Both ranges employ positioning systemsdesigned to allow sampling of the fields radiated by an antenna on thesurface of a sphere centered on the antenna. One hemisphere, eitherupper or lower, is measured at a time. The test vehicle is then turnedover, if required, to allow data collection for the remaininghemisphere. Specific characteristics of the ranges' positioners aredescribed below.
(1) Arc Range Positioner. The Arc Range provides hemi-spherical coverage by a combination of horizontal rotation of theantenna under test mounted on a turntable, and movement of a probeantenna along the vertical arc. The turntable has a maximum weightcapacity of 60 tons, allowing the Arc Range to test large and massivevehicles.
(2) Compact Range Positioner. The Compact Range positioningsystem consists of a tiltable turntable supported approximately 42 feethigh in the center of the quiet zone created by the reflector. The RFcharacteristics of this zone will be discussed later. The turntablerotates and tilts in order to provide hemispherical coverage. Theturntable has a maximum weight capacity of 70 tons. This capacityallows the Compact Range to test a wide variety of vehicles, includingthe Ml Abrams Main Battle Tank and OV-i Mohawk aircraft. Because theturntable tilts, test items must be securely mounted to it. Bracketsmust be specially designed for this physical requirement, as well as. provide for electrical interfacing needed for the antenna under test.
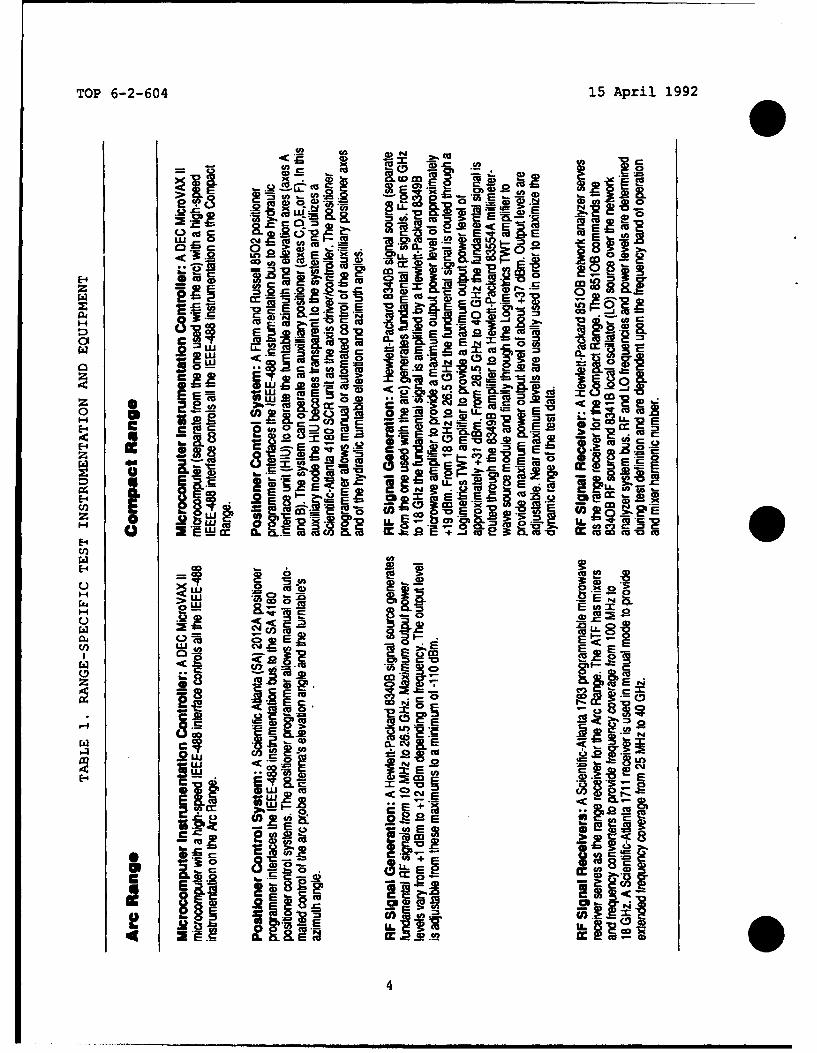
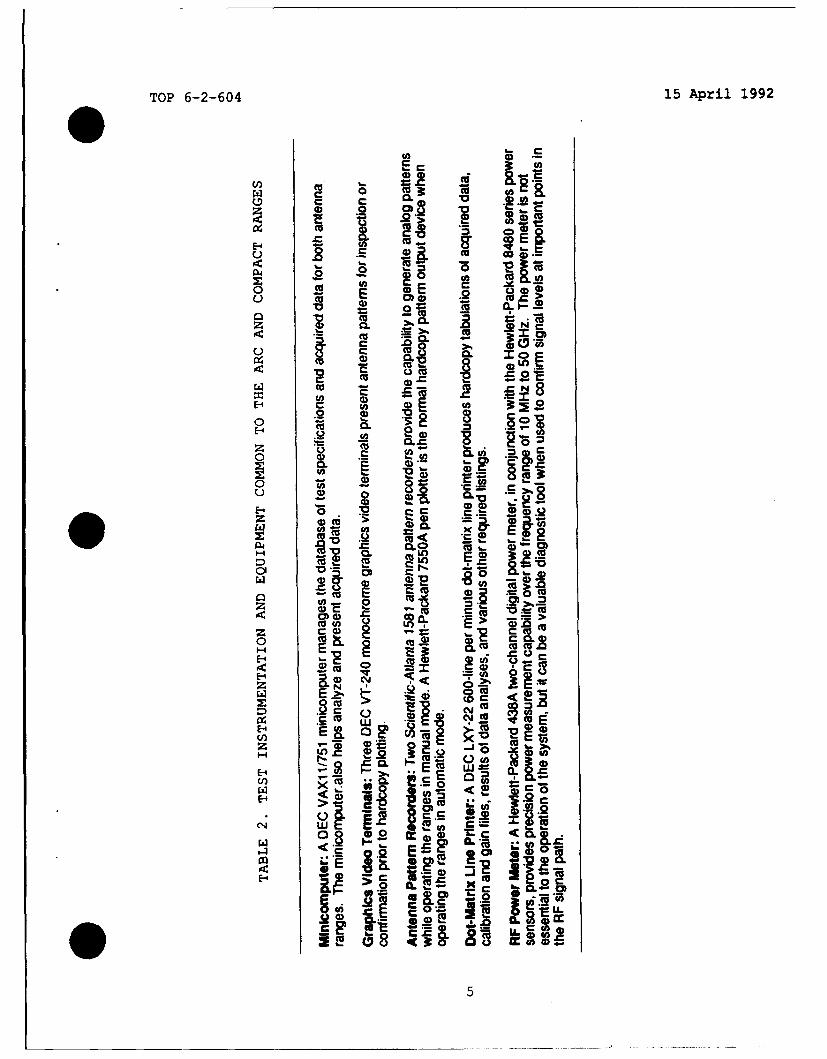
2.2 INSTRUMENTATION
Tables 1 and 2 list and describe the instrumentation used by eachrange and the equipment common to both ranges. Each range is controlledindependently, and each has its own RF system, but both feed a comnoncomputer for data reduction, analysis, and display.
Accesion For
NTIS CRA&IDTIC TAB 0Unrnnou, :cedJustiCatior ......................
By.................. --.-.--.............
D t. ib; N
A\
Di A
TOP 6-2-604 15 April 1992
two
E J(
e 22 tp to .e
-(U 4).M TAI .*e. Lu0 1tW :
.0~~~~~~ 14 at 6pmIEc
H w.k , RZ,
cc a am- ,E
0U E Cc E
c~ .9-an
H OgE'W- - -
LD~~b 8. cc 2a1a c
ZE. r f.9 32 -S t i 9!2-=LU ~ ~ ~ U _ . -R cc
-C I M 4
TOP 6-2-604 15 April 1992
0 C:c 0 LA
0 0
H 00c f
a 0
o0 (a .
o E Mw .2 9 =
om C a
.2.00 co
V 06
L? c
E 8
0 mC
o~00. CL 8.
C C
cm ME CO * o
E 0~za 0E-4
=Z CO r~
El t; 02
2~ mcQ 0 Uc, h..u Ica
0.0
FL 02E m C
TOP 6-2-604 15 April 1992
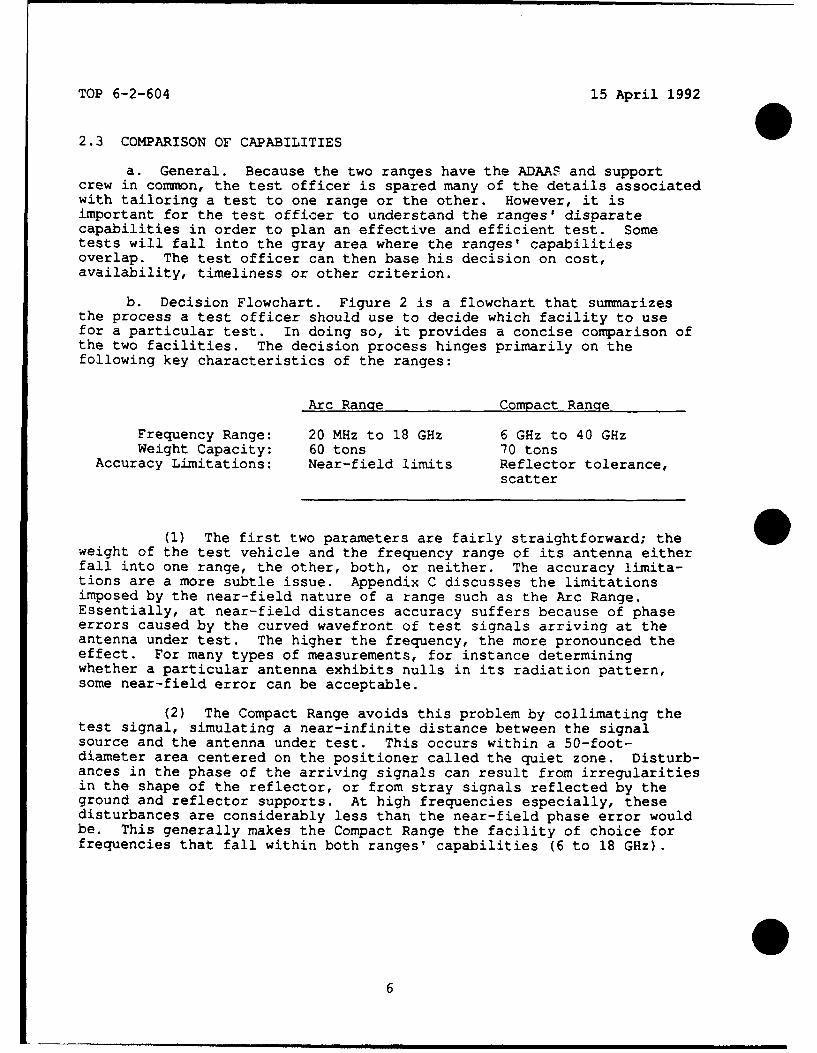
2.3 COMPARISON OF CAPABILITIES
a. General. Because the two ranges have the ADAAS and supportcrew in common, the test officer is spared many of the details associatedwith tailoring a test to one range or the other. However, it isimportant for the test officer to understand the ranges' disparatecapabilities in order to plan an effective and efficient test. Sometests will fall into the gray area where the ranges' capabilitiesoverlap. The test officer can then base his decision on cost,availability, timeliness or other criterion.
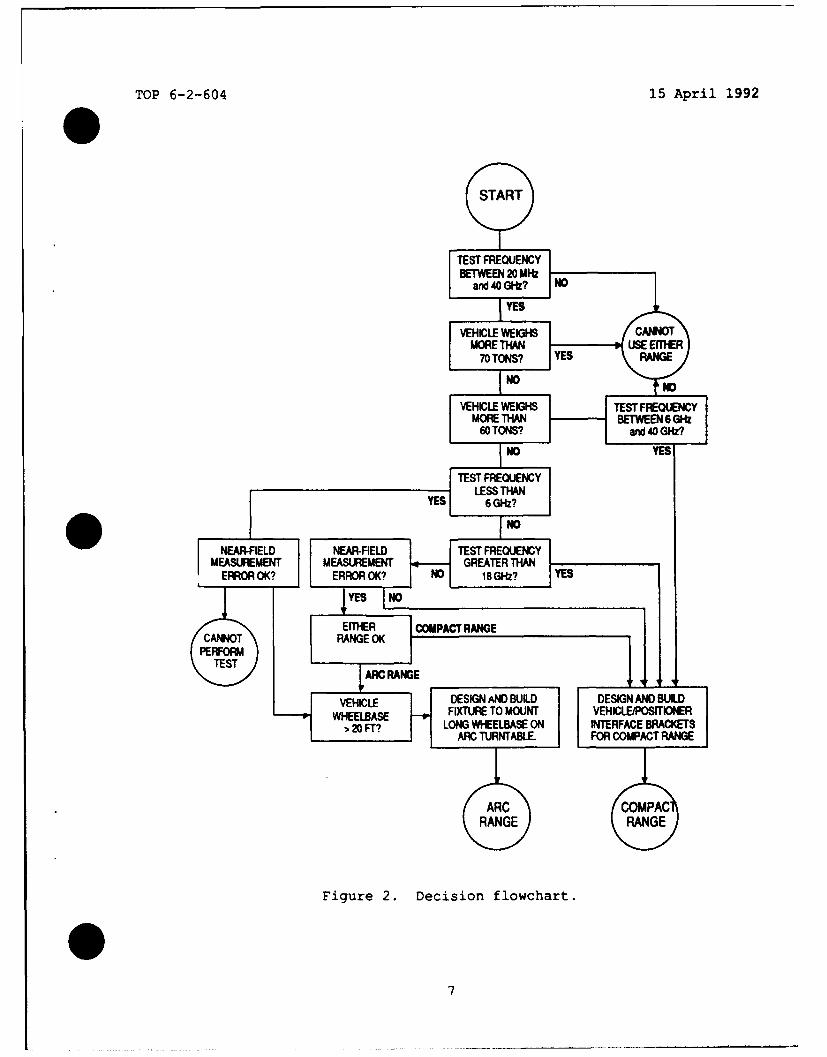
b. Decision Flowchart. Figure 2 is a flowchart that summarizesthe process a test officer should use to decide which facility to usefor a particular test. In doing so, it provides a concise comparison ofthe two facilities. The decision process hinges primarily on thefollowing key characteristics of the ranges:
Arc Range Compact Range
Frequency Range: 20 MHz to 18 GHz 6 GHz to 40 GHzWeight Capacity: 60 tons 70 tons
Accuracy Limitations: Near-field limits Reflector tolerance,scatter
(1) The first two parameters are fairly straightforward; theweight of the test vehicle and the frequency range of its antenna eitherfall into one range, the other, both, or neither. The accuracy limita-tions are a more subtle issue. Appendix C discusses the limitationsimposed by the near-field nature of a range such as the Arc Range.Essentially, at near-field distances accuracy suffers because of phaseerrors caused by the curved wavefront of test signals arriving at theantenna under test. The higher the frequency, the more pronounced theeffect. For many types of measurements, for instance determiningwhether a particular antenna exhibits nulls in its radiation pattern,some near-field error can be acceptable.
(2) The Compact Range avoids this problem by collimating thetest signal, simulating a near-infinite distance between the signalsource and the antenna under test. This occurs within a 50-foot-diameter area centered on the positioner called the quiet zone. Disturb-ances in the phase of the arriving signals can result from irregularitiesin the shape of the reflector, or from stray signals reflected by theground and reflector supports. At high frequencies especially, thesedisturbances are considerably less than the near-field phase error wouldbe. This generally makes the Compact Range the facility of choice forfrequencies that fall within both ranges' capabilities (6 to 18 GHz).
6
TOP 6-2-604 15 April 1992
START
TEST FREQUIENCY
VEHICLE WEIGHS CANNOTMORE THAN USE EITHER
70 TONS? YES RANGE
VEHICLE WEIGHS TEST FREOUENCYMORETHAN BTEN6Ct
60 TONS?an41Gz
TEST FREQUENCY
DESS ANIDDSGANBiD
NEAR-FELTONMOR-FIEED TEST ORErUENCRMEARCRTURNTAEASLE.EFOR-*COMPACTRTHRANGE
EITHER COPCOMPACG
ARIC RANGE
VIgCrE 2. DESIoN fN Lwchart.ND
----0FXUET OUTVHE'STOE
7
TOP 6-2-604 15 April 1992
3. PREPARATION FOR TEST 0a. Activate a project notebook to record all pertinent technical
information.
b. Prepare a checklist using appendix A as a guide.
c. Provide security precautions when required.
d. Prepare and review detailed test objectives, criteria, andplan. Verify that test specifications are within range capabilities.
e. Schedule and coordinate the availability of the test item andrange.
f. Ensure that all test personnel are familiar with the requiredtechnical and operational characteristics of the test item.
g. Inspect the test item for an- defects that may affect systemperformance.
h. Prepare adequate safety precautions and ensure that all safetyprocedures are observed throughout the test.
i. Verify proper operation of all test equipment in the ADAASsystem. All calibration stickers should be current.
4. TEST CONTROLS
a. Maintain constant temperature within ± 50 F for all trailer-housed instrumentation throughout the test.
b. Allow sufficient warm-up time for all equipment according tothe manufacturer's recommendations.
c. Intermediate frequency (IF) calibration checks should beperformed at periodic intervals. If desired, system software canperform these checks automatically at operator-specified intervals.
d. Perform daily pretest inspection of the test item, positionersystem, and all range instrumentation for obvious problems.
5. PERFORMANCE TESTS
The test procedures that follow may be modified to satisfy therequirements of a particular test, provided that the test results can beproven to be valid. These procedures should be applicable as presentedbelow for the majority of tests performed on the Arc and Compact Ranges.
88
TOP 6-2-604 15 April 1992
5.1 ANTENNA RADIATION PATTERN MEASUREMENTS
a. The primary function of the Arc and Compact Ranges is antennapattern measurement. Antenna patterns provide data on the radiationproperties of antennas as a function of direction. Typically this isaccomplished by sampling the amplitude and/or phase of the antenna'sradiation at points on a sphere centered on the test antenna.
b. Antenna performance parameters determined through antennapattern measurement include gain, main beam location, beamwidths,sidelobe levels and locations, null depths and locations, secondary beampeaks and locations, and multiple beam peaks and locations.
c. On the Arc Range, rovement of the probe antenna on the arc fromthe horizon (0 degrees elevation) to zenith (90 degrees elevation),combined with 360-degree azimuth rotation of the turntable, permitssampling of the radiation for all points on the upper hemisphere.Antenna pattern measurement of the lower hemisphere is accomplished byinverting the test item.
d. Due to the finite separation between the probe and testantennas on the Arc Range, there are errors due to phase contributionsassociated with direct and reflected radiation paths from the test icem.As the physical separation of the direct and reflected radiation pathsincreases, so do these errors, but for many systems these errors areacceptable. A more detailed discussion of these errors is included in
* appendix C.
e. On the Compact Range, hemispherical sampling of the antennaradiation is accomplished in a manner similar to that for the Arc Range.Movement of the turntable elevation axis from the horizon (0 degreeselevation) to zenith (90 degrees elevation), combined with 360-degreeazimuth rotation of the turntable, permits sampling of the radiation forall points on the upper hemisphere. Antenna pattern measurement of thelower hemisphere is accomplished by inverting the test item.
f. Because the test item is illuminated by a collimated field ofRF energy on the Compact Range, there are no errors due to phase contri-butions associated with direct and reflected radiation paths from thetest item, as on the Arc Range. The primary limitation on the accuracyof antenna pattern measurement on the Compact Range is the quality ofthe collimated RF energy within the area described by the test item.This area should fall within the 50-foot diameter quiet zone of therange. The quiet zone is the area around the Compact Range turntablewhere the RF energy is perfectly collimated in amplitude and phase. Theaccuracy of the quiet zone amplitude and phase collimation is measuredby probing the RF field within this zone.
9
TOP 6-2-604 15 April 1992
5.1.1 Automated Antenna Pattern Measurements
5.1.1.1 Methods
Most antenna pattern measurements performed on the Arc and CompactRanges can be done under the control of the automatic range controlsoftware. This relieves the operator of many routine measurement setuptasks.
a. On the Arc Range, position the test item so that the phasecenter of the test antenna is as near as possible to the center ofmeasurement sphere, as defined by the radial center (or focal point) ofthe arc. If the location of the phase center of the test antenna isunknown, as is typically the case, a good estimate of its location isusually the geometric center of the antenna.
b. On the Compact Range, the test item must be mounted on thepositioner platform with suitably designed brackets. The center ofgravity of the test item should be placed as low as possible over theazimuth axis center of rotation.
c. Using the minicomputer's database menu, define the parametersof the test such as measurement frequencies, antenna polarization, andspatial sampling set (the azimuth and elevation intervals at which tomeasure the antenna's radiation).
d. Load the test parameters into the range control microcomputer.
e. Request that the range control microcomputer calibrate theinstrumentation. This calibration procedure should not be confused withlong-term maintenance calibrations that must be performed periodically.This system calibration procedure checks system linearity and dynamicrange, and adjusts the IF stages if required.
f. This calibration corrects for short-term temperature drifts inthe system and should be repeated periodically during data acquisition.The recommended re-calibration interval is 30 minutes, but longer orshorter intervals may be selected based on individual test requirements.
g. The range control microcomputer will either perform thiscalibration automatically or recommend the calibration at regularintervals as specified by the operator. If "recommendations only" arespecified by the operator, it is up to the operator to initiatecalibration according to the software recommendations. In either casethe actual calibration procedure is performed via automatic softwareroutines.
h. Initiate data acquisition through the range controlmicrocomputer menu. All data collected are automatically stored foranalysis and presentation.
10
TOP 6-2-604 15 April 1992
5.1.1.2 Data Required
When an automatic antenna pattern measurement is performed, the datacollected are stored along with the test parameters in the databaseminicomputer. Analysis and presentation of these data are described inparagraph 6.
5.1.2 Manual Antenna Pattern Measurements
5.1.2.1 Methods
Throughout this description it is assumed that the receiver is operatingproperly so that the measured amplitude varies linearly with input powerlevel. If the input level is too great, the receiver can becomesaturated and measurement response can become non-linear. If the inputlevel is too low, noise can mask the desired signal response. Refer tothe receiver operating manual for direction regarding the appropriaterange of input signal levels. Use a calibrated attenuator to verifylinear response over this input signal range.
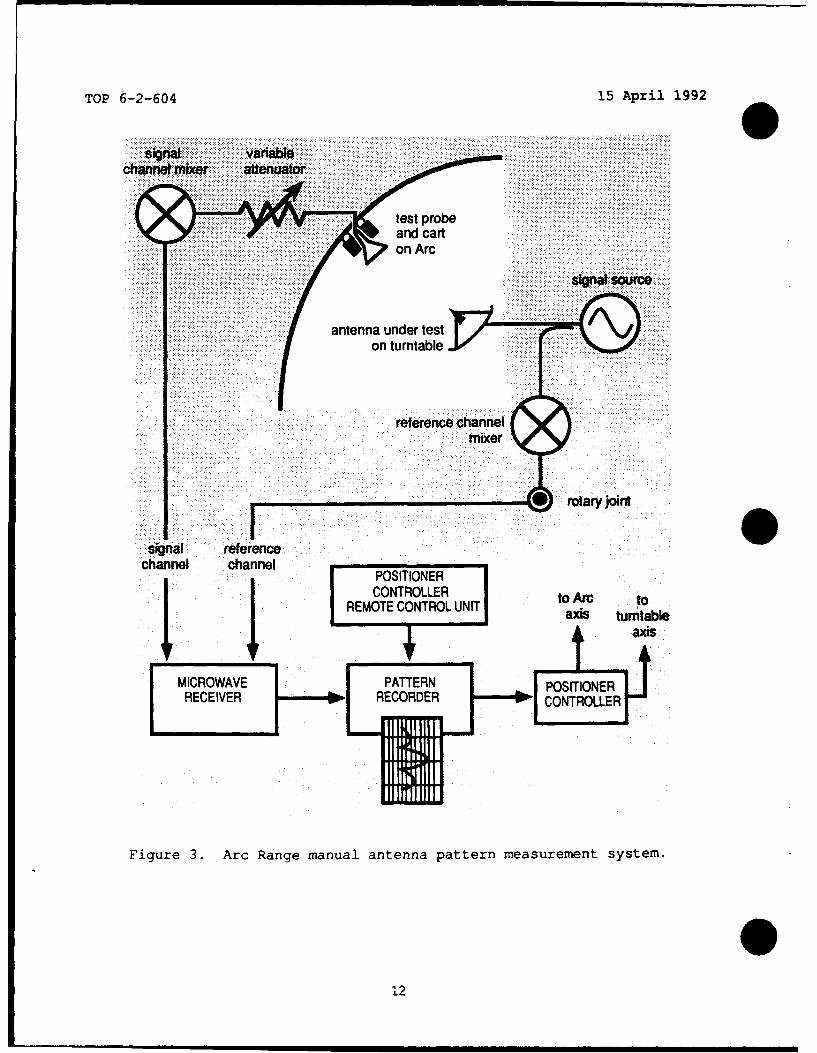
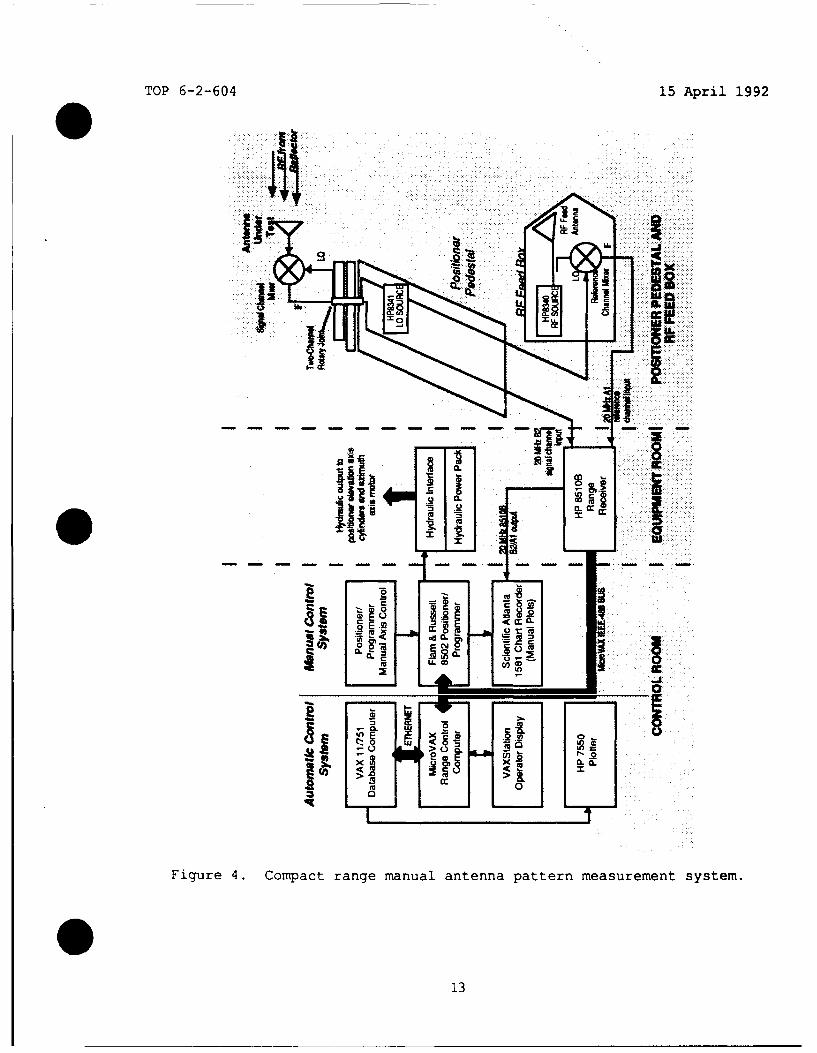
a. Configure the antenna pattern measurement instrumentation asshown in figure 3 for the Arc Range, and as shown in figure 4 for theCompact Range. Normally this configuration is identical to theautomatic antenna measurement system except that the instrumentation isunder manual control.
b. Perform the desired "cuts" through the antenna radiationpattern by positioning one axis to the desired angle and then scanningthe other axis through the desired range of angles. The chart axis ofthe antenna pattern recorder should correspond to the angular movementof the positioner. The pen axis will then correspond to the amplitudeoutput of the receiver. This configuration will produce graphs ofamplitude versus angle for each desired cut through the pattern.
5.1.2.2 Data Required
Each pattern recording should be labeled carefully to identify theantenna, measurement frequency, stationary axis position, angular scale(and offset, if applicable) of moving axis, amplitude scale (and offset,if applicable), and any other special comments. The required patternsshould be checked off the test plan as they are completed in order toensure that all required patterns are measured.
11
TOP 6-2-604 15 April 1992
channef mikem aftenuator
-oa source
antenna under teston turntable
reference channelmixer
signal referencechannel channel
ICONTROLLER to Arc toI REMOTE CONTROL UNIT axs Irnal
IF axis
REEVRRECORDER -- l.CONTROLLER
Figure 3. Arc Range manual antenna pattern measurement system.
12
TOP 6-2-604 15 April 1992
I -
A2 0
..2°
Figure 4. Compact range manual antenna pattern measurement system.
13
TOP 6-2-604 15 April 1992
5.2 ANTENNA GAIN MEASUREMENTS
a. Antenna gain is a measure of the strength of an antenna'sradiation in a particular direction as compared to an antenna thatradiates with equal strength in all directions (i.e., isotropically).According to the ANSI/IEEE Standard 100-1984, "IEEE Standard Dictionaryof Electrical and Electronic Terms," antenna gain is strictly defined asthe "ratio of the radiation intensity, in a given direction, to theradiation intensity that would be obtained if the power accepted by theantenna were radiated isotropically." If the direction is notexplicitly stated, it is understood to be the direction of maximumradiation strength (i.e., the peak of the main beam).
b. It is important to note that the definition of gain does notinvolve polarization or impedance mismatch losses, but it does includedissipative losses. This is implied by the use of the ward "accepted"in the definition above.
c. Because no real antenna radiates isotropically, it is morefeasible to measure an antenna's gain by comparing it to another antennawhose gain relative to isotropic has been computed by its geometry, ormeasured by a complicated three-antenna technique. These antennas arecalled standard gain antennas. In the microwave frequency region thesestandard gain antennas typically take the form of a pyramidal horn andare called standard gain horns. Each standard gain horn has associatedwith it a graph of gain versus frequency.
d. The technique of measuring the gain of an antenna by comparisonto another antenna of known gain is known as the gain comparison method,or more commonly, the gain transfer measurement method.
5.2.1 Automated Antenna Gain Measurements
The gain transfer technique is used in the case of automated gainmeasurements. Because of the need to replace the test antenna with astandard gain antenna, the process of gain measurement is not completelyautomated. The computer system will do the following automatically:recommend standard gain horns to use, compute an optimal reconnectionsequence to minimize operator intervention, compute the test antenna'sgain at each measurement frequency, and handle all record keeping tasks.
5.2.1.1 Methods
A gain measurement can be performed any time after a test definition hasbeen loaded into the range control microcomputer, and before that testhas been completed. The recommended time is immediately after loadingthe test definition. If a major problem exists with the test antenna,its interconnections with the instrumentation, or with the instrumenta-tion itself, a gain measurement may reveal the problem and save valuabletest time.
a. At any convenient time during a test, select a gain measurementon the range control microcomputer menu.
14
TOP 6-2-604 15 April 1992
b. Select the antennas, frequencies, and standard gain horns to beused for this set of gain measurements (all gain measurements do nothave to be performed at the same time). Note that if the operatorwishes to use a standard gain horn for which the computer has no data,he will need to enter the absolute gain at the test frequency and thenominal beamwidths for the main beam peak search algorithm.
c. Connect each standard gain horn to its corresponding RF outputas directed by the computer. As each gain is measured, the results areindicated on the range control microcomputer terminal.
5.2.1.2 Data Required
When automated gain measurements are requested, the computer stores thename of the standard gain horn used and the measured gain of the testantenna at each frequency. The data are presented on the range controlmicrocomputer terminal as the measurements are completed, and alsoduring analysis as described in paragraph 6.
5.2.2 Manual Antenna Gain Measurements
If for some reason automatic antenna gain measurement is inappropriate,unavailable, or invalid for a given test, manual gain measurements canbe performed.
5.2.2.1 Methods
a. Configure the antenna pattern measurement instrumentation asshown in figure 3 for the Arc Range, and as shown in figure 4 for theCompact Range.
b. Substitute an antenna of known gain (i.e., a standard gainhorn) for the test antenna.
c. Locate the direction of maximum received power (the location ofthe main beam peak) and adjust attenuations and offsets for a convenientreference amplitude. It is important for the standard gain antenna tobe at the same location as the test antenna when this is done.
d. Replace the standard gain antenna with the test antenna.
e. Again locate the direction of maximum received power andmeasure the difference in amplitude between this level and the level setfor the standard gain antenna. If the receiver is operating in a non-linear or excessively noisy region of input power level, attenuation maybe added or removed to bring the receiver back into its region of linearresponse.
f. The absolute gain of the test antenna (in dBi) is equal to thegain of the standard gain horn (in dBi) plus the measured gain dif-ference (in dB) plus any attenuation (in dB) that may have been added(subtract any attenuation that may have been removed).
025
TOP 6-2-604 15 April 1992
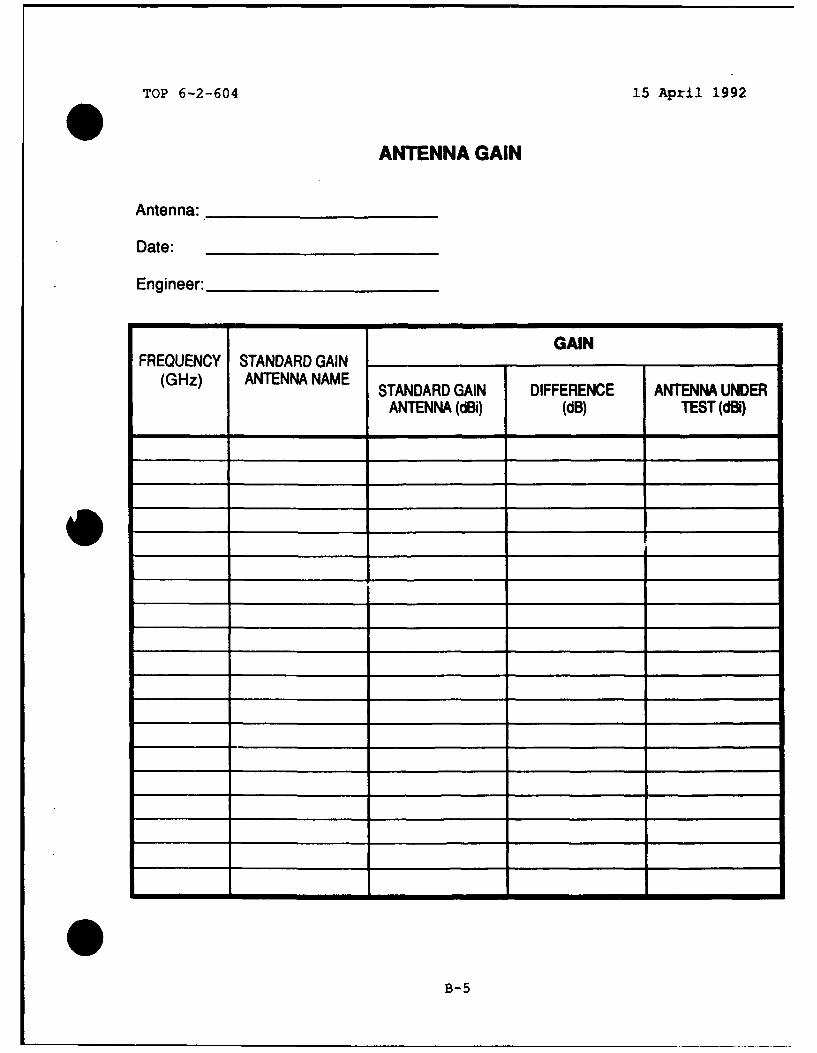
5.2.2.2 Data Reauired
Use the antenna gain data collection form in appendix B to record thegain difference, standard gain horn nomenclature and gain, and gain oftest antenna for each frequency and antenna for which the gainmeasurement is taken.
5.2.3 Weather Effects on Antenna Gain Measurements
a. Precipitation can significantly attenuate radio waves in themillimeter-wave portion of the electromagnetic spectrum. The degree ofattenuation is a complicated function of radiated wavelength and precipi-tation size, state (frozen or unfrozen), and rate. Attenuation due toboth scattering and absorption increases rapidly with increasing precip-itation rate and may affect test data during periods of heavy precipi-tation. Consider this effect when testing in the 10- to 40-GHzfrequency band in precipitation.
b. Meteorological support during antenna pattern measurements maybe requested from the respective meteorological support team.
6. DATA REDUCTION, PRESENTATION, AND ANALYSES
6.1 REDUCTION
a. Reduction of data collected on the ATF antenna ranges islimited primarily to the determination of the following antennaperformance parameters:
(1) Gain.
(2) Main beam location.
(3) Beamwidths.
(4) Sidelobe levels and locations.
(5) Null depths and locations.
(6) Secondary peaks.
(7) Multiple beams.
b. Further data reduction can be performed to examine the behaviorof the above parameters with respect to frequency, configuration, orwhatever variables may be relevant to a particular test.
c. Data reduction can be performed either manually or by thedatabase minicomputer. The parameters listed above are currentlyavailable through automatic pattern analysis programs. Any additionaldata reduction can be performed manually.
16
TOP 6-2-604 15 April 1992
. 6.2 PRESENTATION
a. Antenna pattern measurement data is usually provided in the formof graphical presentations of the antenna patterns, tables of the perform-ance parameters listed in paragraph 6.1, and occasionally by tabularlistings of raw data.
b. If the antenna pattern data are collected by the automaticsystem, presentations can be requested as outputs to the plotter, printer,and/or graphics terminals. If the data are collected manually, the datawill already be in the form of an antenna pattern, and tables of antennaperformance parameters can be manually generated.
c. Antenna Pattern Plots. Antenna pattern plots are graphicalpresentations of the radiation properties of antennas as a function ofdirection. The most common formats for antenna pattern plots arerectangular, polar, and three-dimensional.
6.2.1 Rlnts
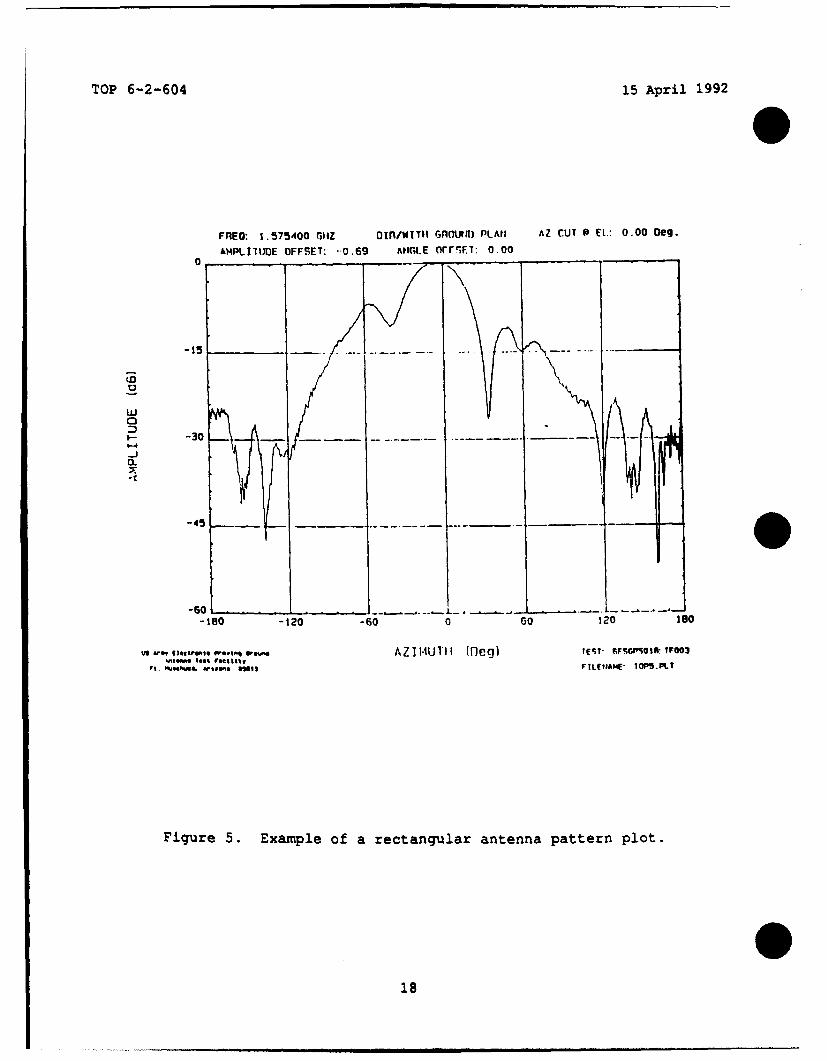
Rectangular antenna pattern plots are generated using an orthogonal coord-inate system. The abscissa (y-axis) represents the relative amplitude ofthe antenna radiation in decibels and the ordinate (x-axis) represents theazimuth or elevation axis angle. The pattern is a presentation of a cutthrough one axis of the antenna while the other axis is held stationary.Labelling of the stationary axis position as well as the ordinate andabscissa axes is performed automatically on computer generated patterns.Because the ordinate axis can be easily scaled to whatever angular rangeis desired, the rectangular format antenna pattern is probably the mostpopular. Figure 5 is an example of a rectangular antenna pattern plot.
6.2.2 P
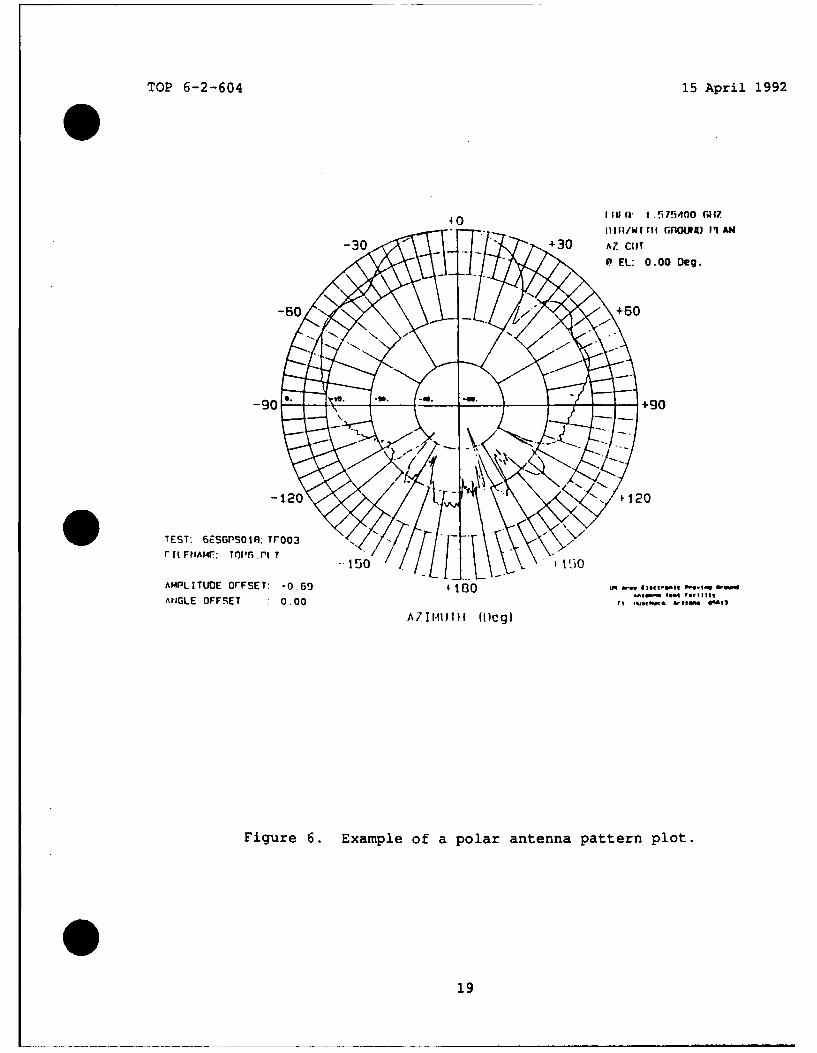
Polar antenna pattern plots are generated using a polar coordinate system.The radial axis represents the relative amplitude of the antenna radiationin decibels and the polar angle represents the azimuth or elevation axisangle. The pattern is a presentation of a cut through one axis of theantenna while the other axis is held stationary. Labelling of thestationary axis position is performed automatically on computer generatedpatterns. The polar axis scale is always a full 360 degrees and is notwell suited to narrow beamwidth antennas. However, polar plots provide avisually realistic presentation of the radiation pattern and are verypopular for wide beamwidth antennas. Figure 6 is an example of a polarantenna pattern plot.
6.2.3 Thre-DimnsonaASnnn _Pattern Plots
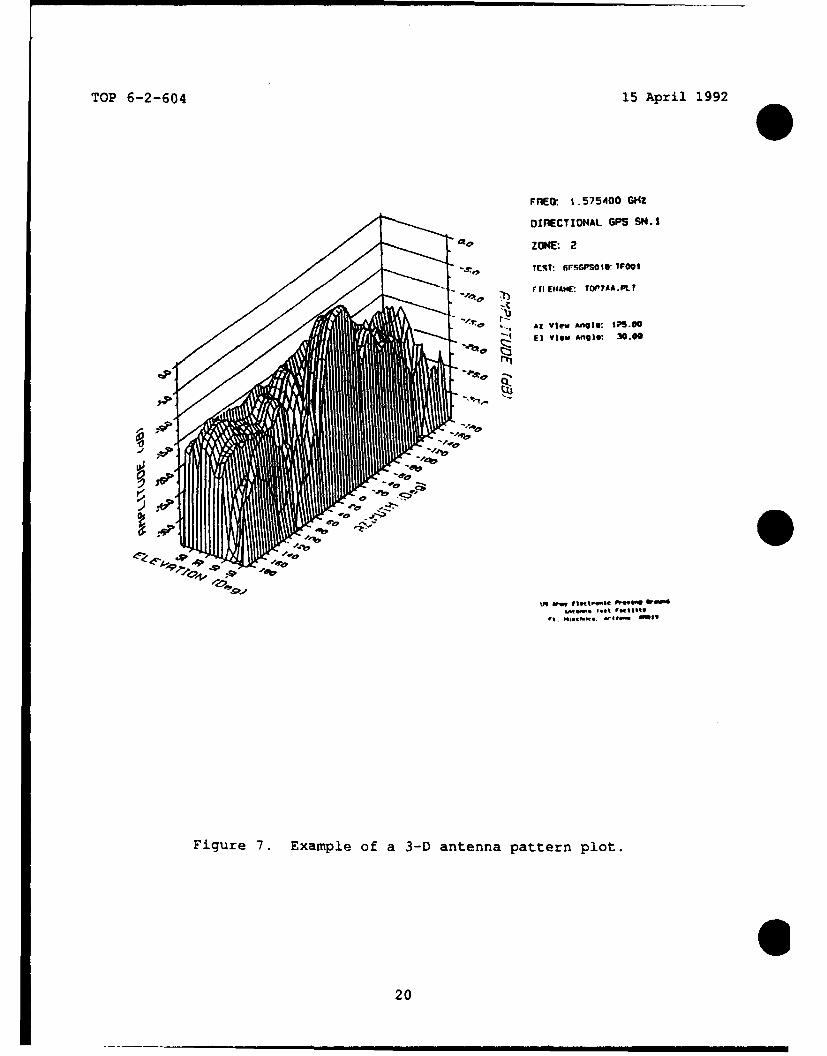
A three-dimensional antenna pattern plot represents a two-dimensionalprojection of a set of antenna patterns. The result is similar to anarchitectural perspective drawing where lines that would normally behidden behind another part of the surface are suppressed for clarity. Itis difficult to quantitatively evaluate an antenna's performance using athree-dimensional plot, however, this presentation is very effective forqualitative evaluations. Figure 7 is an example of a three-dimensionalantenna pattern plot.
17
TOP 6-2-604 15 April 1992
FREO: 1.575400 GIIZ OIif/WITI GfOUmII) PLAII AZ CUT P EL.: 0.00 Deg.
AMPLITODE OFFSET: -0.69 ANGLE orr",FT: 0.00O3-
C
-43 - . 0
-J~
-180 -120 -60 0 GO 120 180
.-.e,.. ,, Vi-it, AZ I I. U111 (Meg) fEIST: FSroson: IF003"atop.*I lost petits%#
Pt. tjo4w. wistete WI il FILEIDAME' TOPS.PLt
Figure 5. Example of a rectangular antenna pattern plot.
18
TOP 6-2-604 15 April 1992
40~~~ Ilf .571400 G117
P EL: 0.00 Deg.
-90 +90-.
TEST: GESGPS01A: Tr003
AMPLITUDE OrFSET: -0.69 ~1 toArIGLE OFFSET 0.00
AZII. I11I ([Cg)
Figure 6. Example of a polar antenna pattern plot.
19
TOP 6-2-604 15 April 1992
MfEG: 1.575400 GHZ
DIRECTIONAL GPS SN.1
TESlT: flrwsGPSO: IF001
rt lNE#A: TOP7AA.Ptf
-aU,
U9 jft , 41. f lfl
Figure 7. Example of a 3-D antenna pattern plot.
200
TOP 6-2-604 15 April 1992
. 6.3 ANALYSES
6.3.1 ain
a. The gain transfer method of gain measurement (see descriptionin paragraph 5.2) is recommended because of its simplicity. All that isrequired is to measure the difference between the gain of the testantenna and standard antenna of known gain at the test frequency. Thisdifference is then added to the known gain of the standard antenna todetermine the absolute gain of the test antenna.
b. If gain measurements are performed under automated computercontrol, the microcomputer will look up the gain data file for thestandard antenna in use and perform the computations automatically.
c. If gain measurements are performed under manual control, thegain of the standard antenna must be determined from the gain-versus-frequency curves supplied with the standard antenna, and the absolutegain calculations performed manually.
6.3.2 Main Beam Location
a. Main beam location is the azimuth and elevation angle wheremaximum radiation of the test antenna occurs. These angles are alwaysgiven relative to some reference position (i.e., the horizon directlyahead of the vehicle).
b. If the antenna pattern data are collected by the automaticsystem, the main beam location is determined by a search performedduring calibration for the test and stored for presentation in theanalysis report. If the antenna patterns are collected manually, thebeam location chart in Appendix B can be used to tabulate these values.
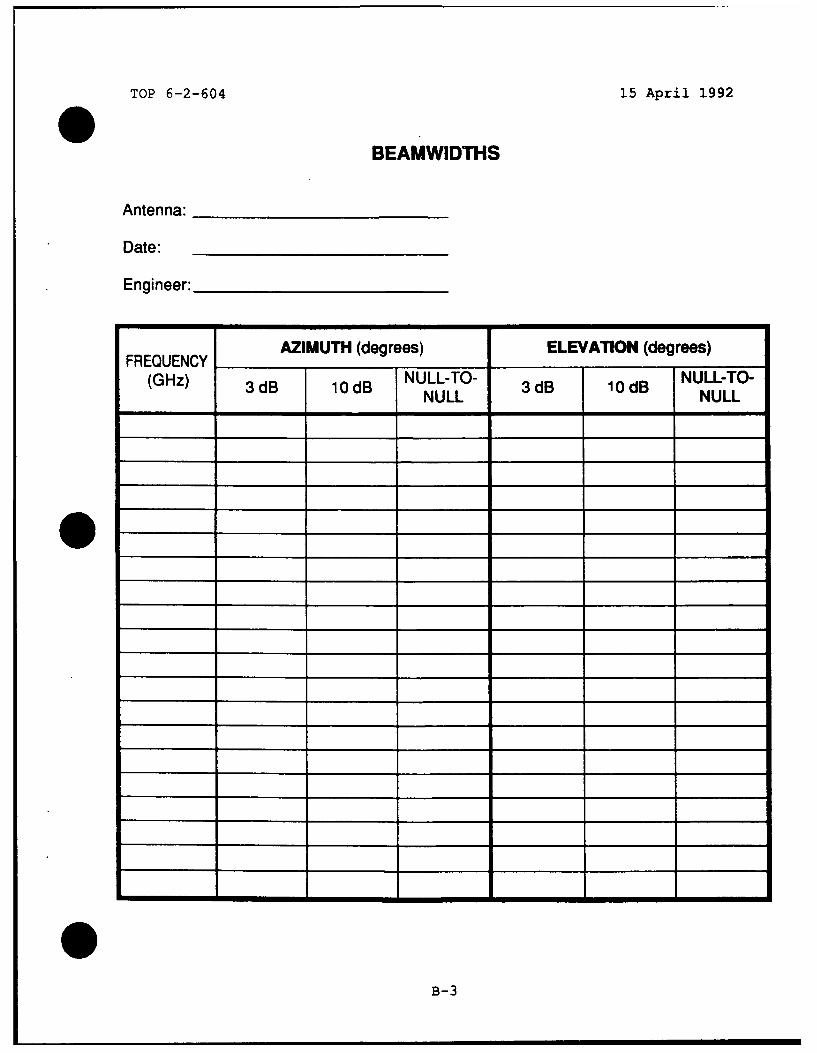
6.3.3 B idths
a. The half-power (3-dB) azimuth or elevation beamwidth of anantenna is defined as the angular separation between the two points oneither side of the main beam which lie 3 dB below the peak in thespecified plane. Null-to-null, 1/4-dB and 10-dB beamwidths may also beof interest for a particular test.
b. If the antenna pattern data are collected by the automaticsystem, the azimuth and elevation beamwidths are calculated by theminicomputer in response to an analysis request. If the antennapatterns are collected manually, the beamwidth chart in appendix B canbe used to tabulate these values.
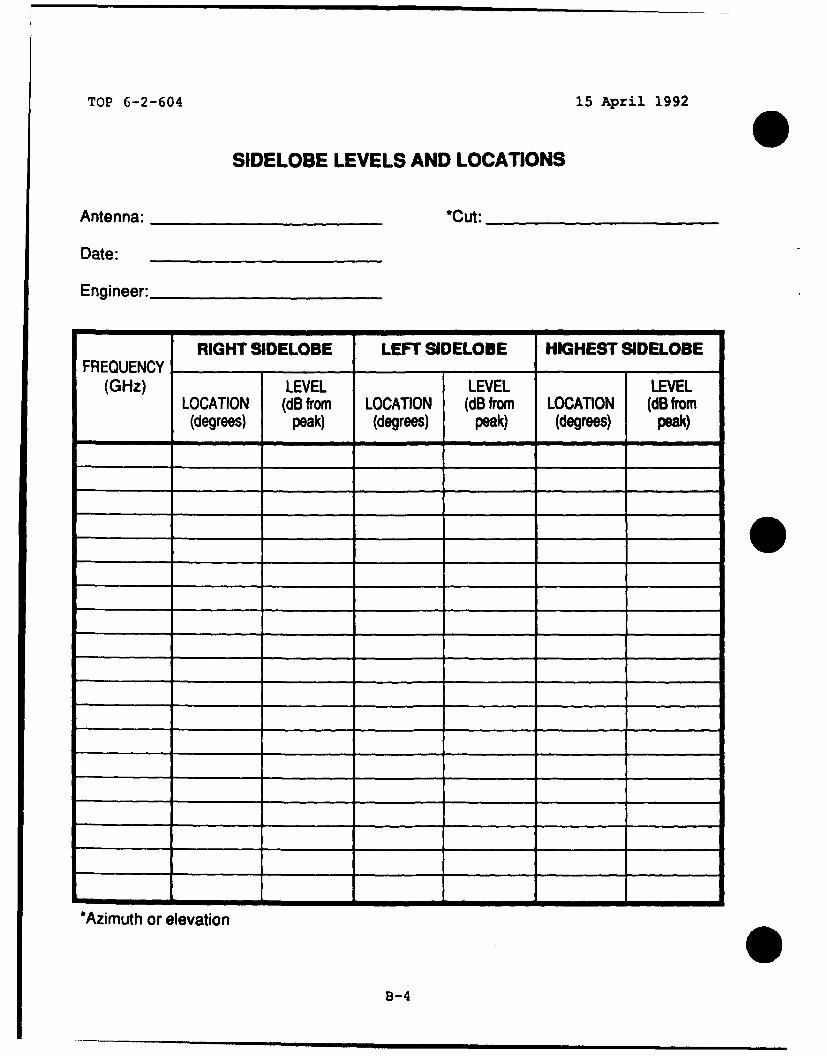
6.3.4 Sidelobe Levels and Locations
a. The levels and locations of sidelobe peaks are usually ofinterest to the antenna engineer. Typically the first sidelobe oneither side of the main beam and the highest sidelobe are of specialinterest. These levels are usually measured relative to the peak of themain beam.
21

TOP 6-2-604 15 April 1992
b. If the antenna pattern data are collected by the automaticsystem, the sidelobe levels and locations are calculated by theminicomputer in response to an analysis request. Quadratic interpolationof the data utilizing non-linear regression analysis is used to enhancethe accuracy of these computations. This method fits a quadratic curveto the data points of the antenna pattern and yields more accurateinterpolation of the data than linear regression techniques. If theantenna patterns are collected manually, the sidelobe level and locationchart in appendix B can be used to tabulate these values.
6.3.5 Null Depths and Locations
a. The levels and locations of null depths are usually of interestto the antenna engineer. Typically the first null on either side of themain beam is of special interest. These null levels are usuallymeasured relative to the peak of the main beam.
b. If the antenna pattern data are collected by the automaticsystem, the null levels and locations are calculated by theminicomputer in response to an analysis request. If the antennapatterns are collected manually, the beamwidth chart in appendix B canbe used to tabulate these values.
6.3.6 Secondary Peaks
a. If the antenna has multiple peaks on the main beam, it may beimportant to know where each secondary peak occurs and at what level.
b. If the antenna pattern data are collected by the automaticsystem, the secondary peak levels and locations are calculated by theminicomputer in response to an analysis request. Quadratic interpolationmethods as described in 6.3.4b above are used to enhance the accuracy ofthese computations. If the antenna patterns are collected manually, thebeam location chart in Appendix B can be used to tabulate these values.
6.3.7 Multiple Beams
a. Some antenna patterns exhibit multiple beams. The levels andlocations of these multiple beams are usually of interest to the antennaengineer.
b. If the antenna pattern data are collected by the automaticsystem, the multiple peak levels and locations are calculated by theminicomputer in response to an analysis request. Quadraticinterpolation methods as described in 6.3.4b above are used to enhancethe accuracy of these computations. If the antenna patterns arecollected manually, the beam location chart in appendix B can be used totabulate these values.
22
TOP 6-2-604 15 April 1992
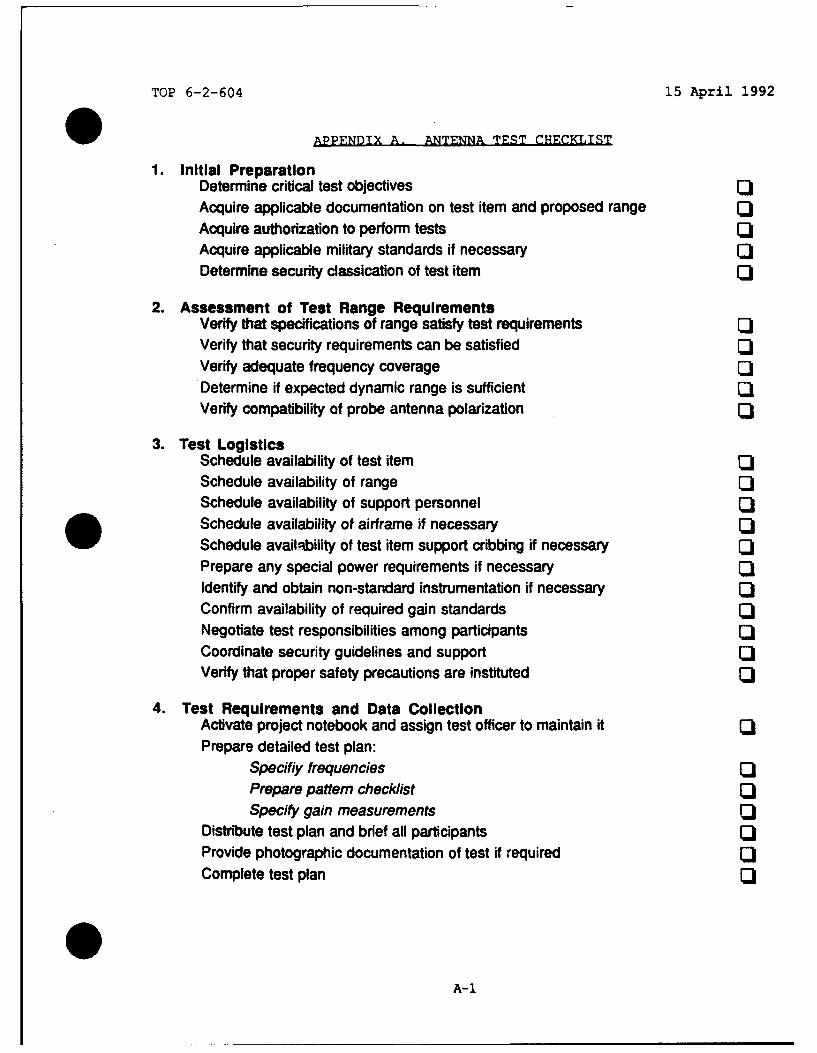
APPENDIX A. ANTENNA TEST CHECKLIST
1. Initial PreparationDetermine critical test objectives
Acquire applicable documentation on test item and proposed rangeAcquire authorization to perform tests iAcquire applicable military standards if necessary iDetermine security classication of test item i
2. Assessment of Test Range RequirementsVerify that specifications of range satisfy test requirements iVerify that security requirements can be satisfiedVerify adequate frequency coverage cIDetermine if expected dynamic range is sufficient cIVerify compatibility of probe antenna polarization
3. Test LogisticsSchedule availability of test item ciSchedule availability of range cSchedule availability of support personnelSchedule availability of airframe if necessary QSchedule availability of test item support cribbing if necessary iPrepare any special power requirements if necessary iIdentify and obtain non-standard instrumentation if necessaryConfirm availability of required gain standardsNegotiate test responsibilities among participants
Coordinate security guidelines and support [i
Verify that proper safety precautions are instituted
4. Test Requirements and Data CollectionActivate project notebook and assign test officer to maintain it iPrepare detailed test plan:
Specifly frequencies [iPrepare pattern checklist [i
Specify gain measurementsDistribute test plan and brief all participants iProvide photographic documentation of test if requiredComplete test plan c
0A-i
TOP 6-2-604 15 April 1992
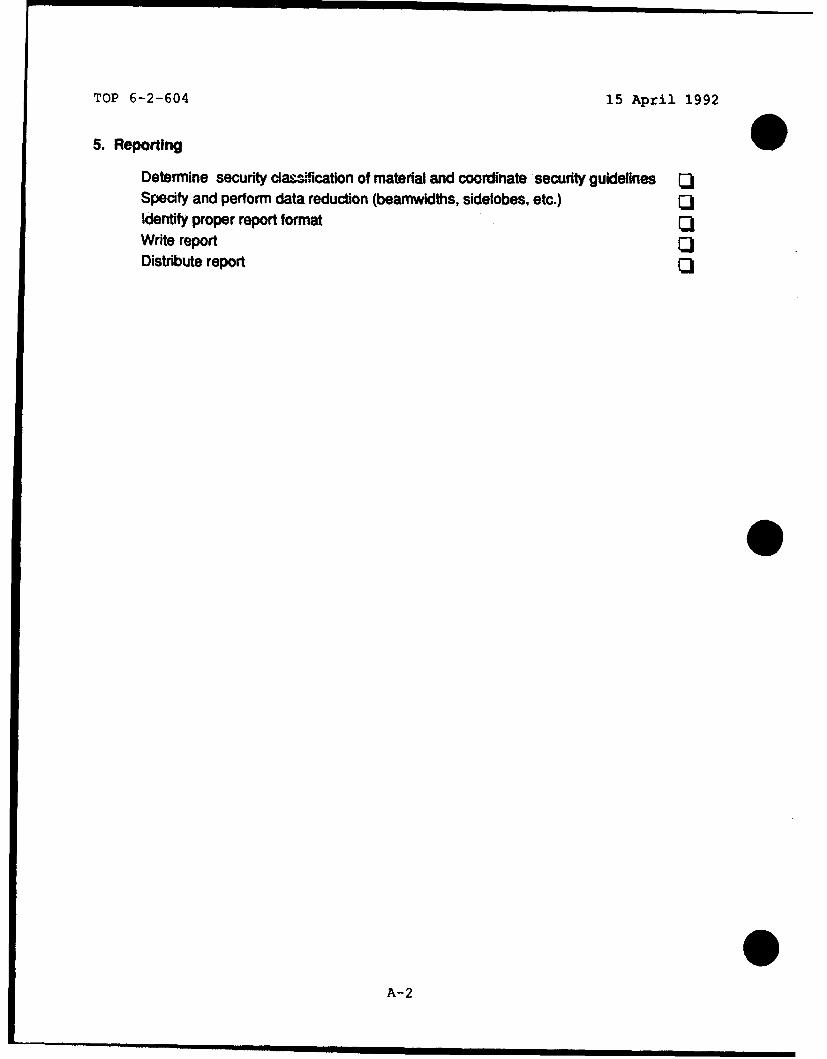
5. Reporting
Determine security claesification of material and coordinate security guidelinesSpecify and perform data reduction (beamwidths, sidelobes, etc.)Identify proper report formatWrite reportDistribute report
A-2
TOP 6-2-604 15 April 1992
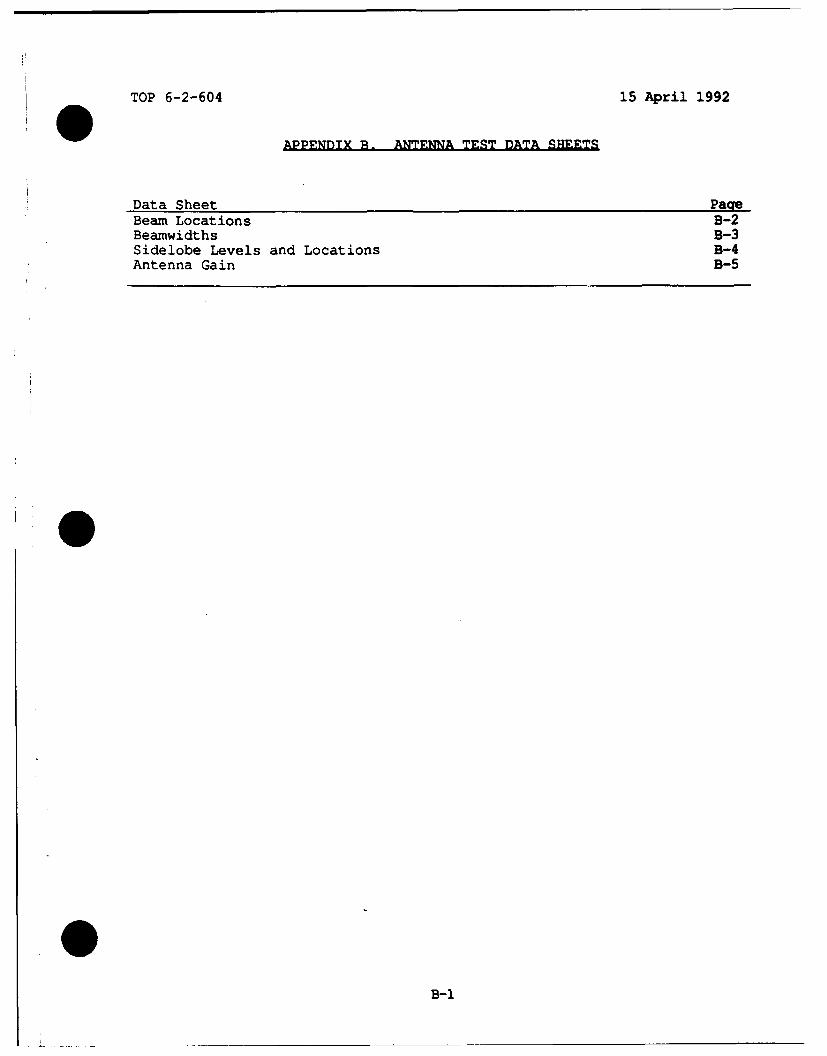
APPENDIXB ATNATS DATA SHEETS
Data Sheet PagreBeam Locations B-2Beamwidths B-3Sidelobe Levels and Locations B-4Antenna Gain B-5
B-1
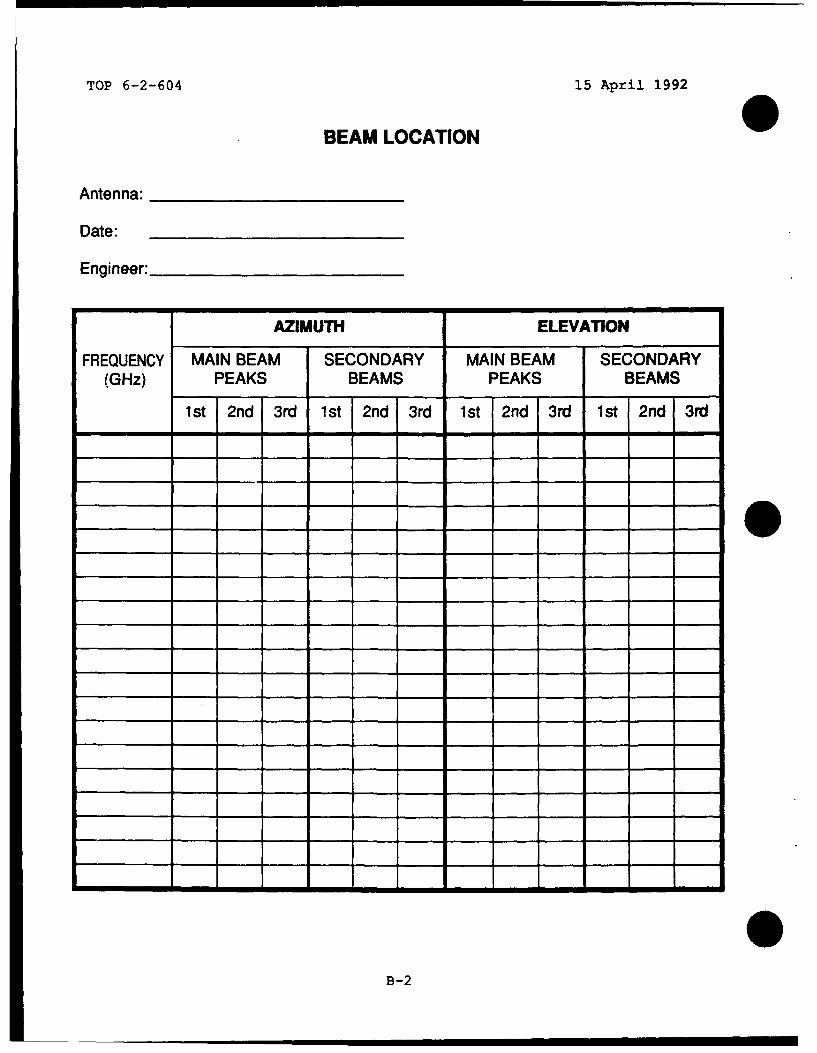
TOP 6-2-604 15 April 1992
BEAM LOCATION 0Antenna:
Date:
Engineer:
AZIMUTH ELEVATION
FREQUENCY MAIN BEAM SECONDARY MAIN BEAM SECONDARY(GHz) PEAKS BEAMS PEAKS BEAMS
1st 2nd 3rd 1st 2nd 3rd 1st 2nd 3rd 1st 2nd 3rd
B-2
TOP 6-2-604 1~5 April 1992
BEAM WIDTHS
Antenna:______________ ___
Date: _ _ _ _ _ _ _ _ _ _ _ _ _ _
Engineer:
AZIMUTH (degrees) ELIEVATION (degrees)FREQUENCY _________ ____________________________
(GHz) 3dB 10dB NULLO 3dB 10 dB NULL
B-3
TOP 6-2-604 15 April 1992 0SIDELOBE LEVELS AND LOCATIONS
Antenna: *Cut:
Date:
Engineer:
RIGHT SIDELOBE LEFT SIDELOBE HIGHEST SIDELOBEFREQUENCY
(GHz) LEVEL LEVEL LEVELLOCATION (dB from LOCATION (dB from LOCATION (dB from
(degrees) peak) (degrees) peak) (degrees) peak)
*Azimuth or elevation
B-4
TOP 6-2-604 15 April 1992
ANTENNA GAIN
Antenna:____________ ___
Date: _ _ _ _ _ _ _ _ _ _ _ _
Engineer:
GAINFREQUENCY STANDARD GAIN
(GHz) ANTENNA NAME STANDARD GAIN DIFFERENCE ANTENNA UNDERANTENNA (dBi) (dB) TEST (0~)
B-5
TOP 6-2-604 15 April 1992
(THIS PAGE IS INTENTIONALLY BLANK)
B-6
TOP 6-2-604 15 April 1992
APPENDIX C. ERRORS DUE TO FINITE RANGE LENGTH
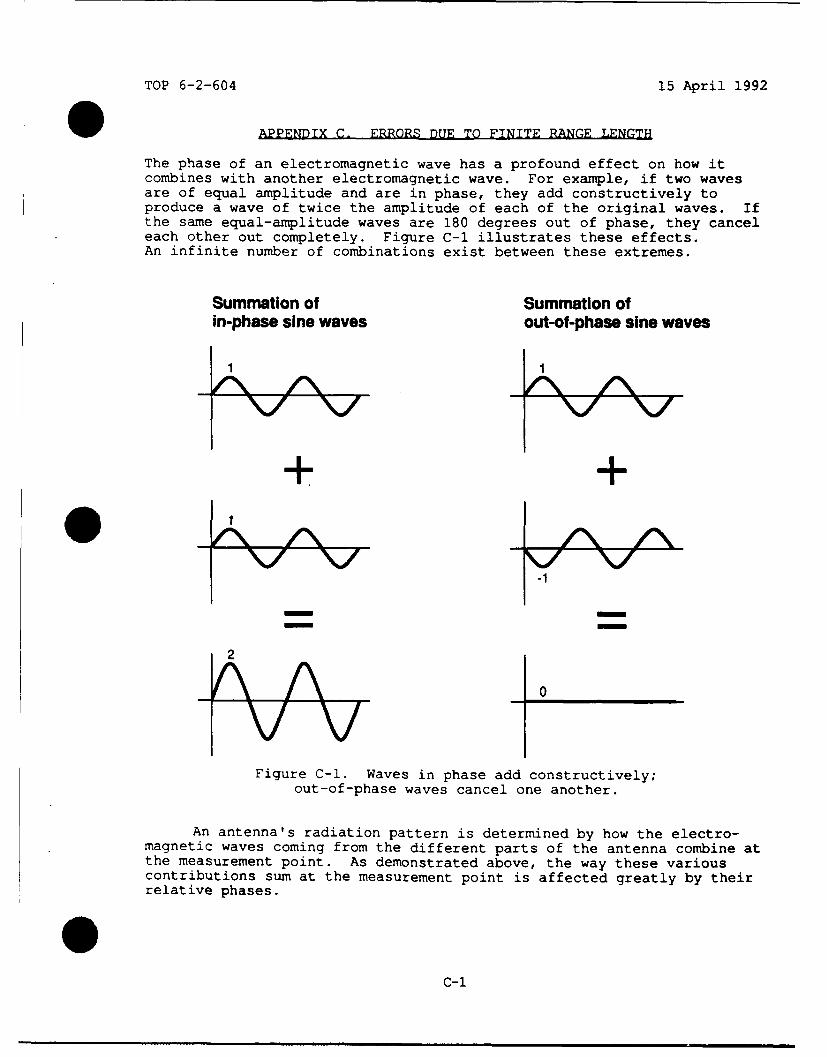
The phase of an electromagnetic wave has a profound effect on how itcombines with another electromagnetic wave. For example, if two wavesare of equal amplitude and are in phase, they add constructively toproduce a wave of twice the amplitude of each of the original waves. Ifthe same equal-amplitude waves are 180 degrees out of phase, they canceleach other out completely. Figure C-I illustrates these effects.An infinite number of combinations exist between these extremes.
Summation of Summation ofin-phase sine waves out-of-phase sine waves
+ +
2
-
0
Figure C-I. Waves in phase add constructively;out-of-phase waves cancel one another.
An antenna's radiation pattern is determined by how the electro-magnetic waves coming from the different parts of the antenna combine atthe measurement point. As demonstrated above, the way these variouscontributions sum at the measurement point is affected greatly by theirrelative phases.
C-1
TOP 6-2-604 15 April 1992
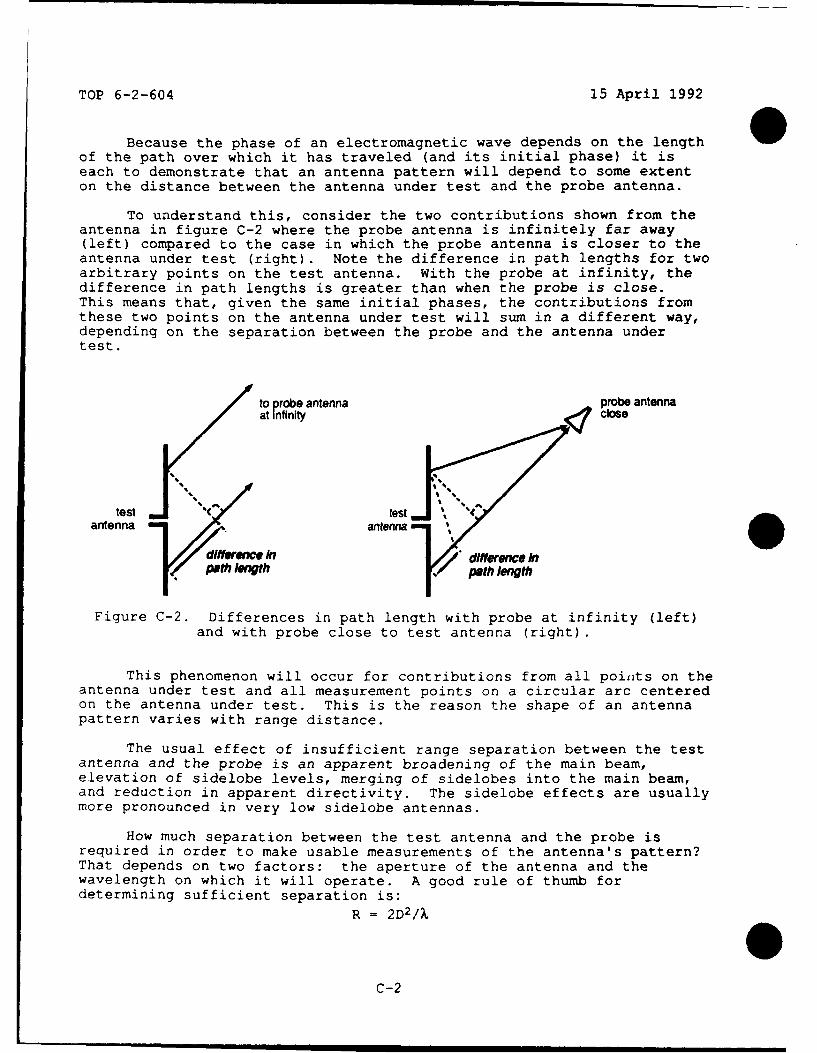
Because the phase of an electromagnetic wave depends on the lengthof the path over which it has traveled (and its initial phase) it iseach to demonstrate that an antenna pattern will depend to some extenton the distance between the antenna under test and the probe antenna.
To understand this, consider the two contributions shown from theantenna in figure C-2 where the probe antenna is infinitely far away(left) compared to the case in which the probe antenna is closer to theantenna under test (right). Note the difference in path lengths for twoarbitrary points on the test antenna. With the probe at infinity, thedifference in path lengths is greater than when the probe is close.This means that, given the same initial phases, the contributions fromthese two points on the antenna under test will sum in a different way,depending on the separation between the probe and the antenna undertest.
to probe antenna probe antennaat infinitycls
testJtest testantenna antenna
differee Inffere
pat l thPahw t
Figure C-2. Differences in path length with probe at infinity (left)and with probe close to test antenna (right).
This phenomenon will occur for contributions from all poinits on theantenna under test and all measurement points on a circular arc centeredon the antenna under test. This is the reason the shape of an antennapattern varies with range distance.
The usual effect of insufficient range separation between the testantenna and the probe is an apparent broadening of the main beam,elevation of sidelobe levels, merging of sidelobes into the main beam,and reduction in apparent directivity. The sidelobe effects are usuallymore pronounced in very low sidelobe antennas.
How much separation between the test antenna and the probe isrequired in order to make usable measurements of the antenna's pattern?That depends on two factors: the aperture of the antenna and thewavelength on which it will operate. A good rule of thumb fordetermining sufficient separation is:
R = 2D2/X
C-2
TOP 6-2-604 15 April 1992
. where: R is the range separation or range lengthD is the maximum aperture dimension of the test antenna1 is the wavelength
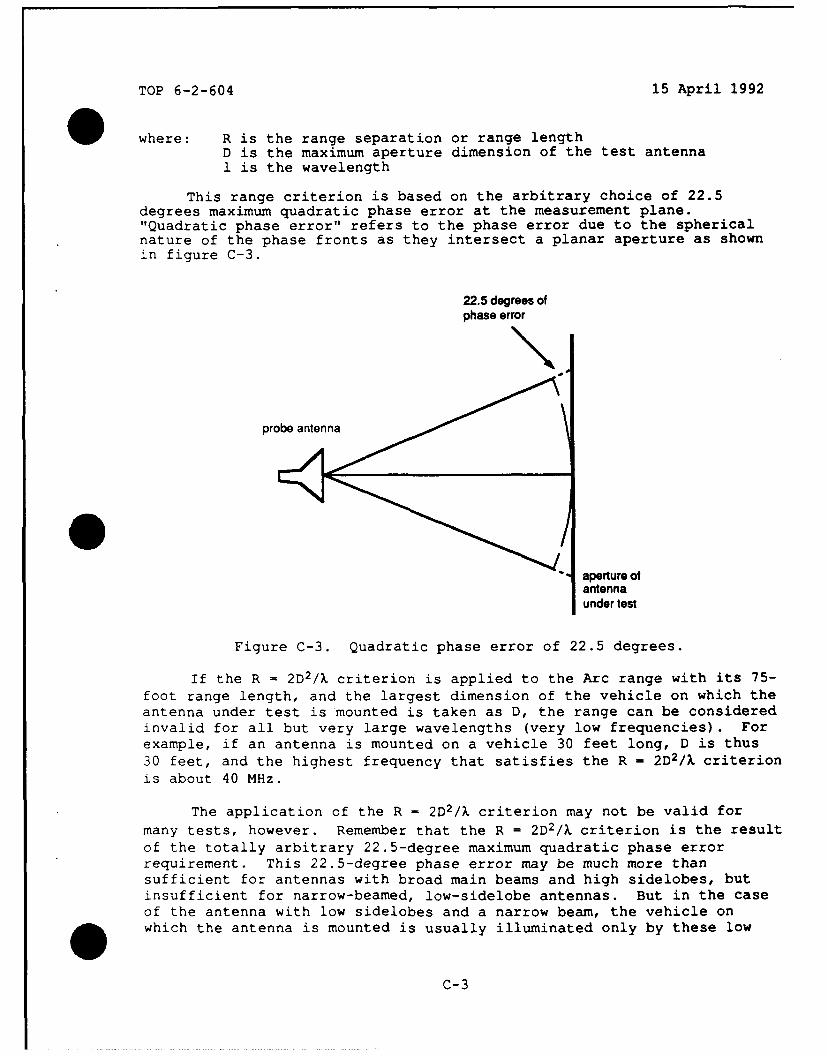
This range criterion is based on the arbitrary choice of 22.5degrees maximum quadratic phase error at the measurement plane."Quadratic phase error" refers to the phase error due to the sphericalnature of the phase fronts as they intersect a planar aperture as shownin figure C-3.
22.5 degrees ofphase error
probe antenna
~aperture of
antennaunder test
Figure C-3. Quadratic phase error of 22.5 degrees.
If the R = 2D2/X criterion is applied to the Arc range with its 75-foot range length, and the largest dimension of the vehicle on which theantenna under test is mounted is taken as D, the range can be consideredinvalid for all but very large wavelengths (very low frequencies). Forexample, if an antenna is mounted on a vehicle 30 feet long, D is thus30 feet, and the highest frequency that satisfies the R - 2D2/X criterionis about 40 MHz.
The application of the R = 2D2/X criterion may not be valid formany tests, however. Remember that the R = 2D2/X criterion is the resultof the totally arbitrary 22.5-degree maximum quadratic phase errorrequirement. This 22.5-degree phase error may be much more thansufficient for antennas with broad main beams and high sidelobes, butinsufficient for narrow-beamed, low-sidelobe antennas. But in the caseof the antenna with low sidelobes and a narrow beam, the vehicle on. which the antenna is mounted is usually illuminated only by these low
C-3
TOP 6-2-604 15 April 1992
sidelobes and should not affect the pattern much anyway. In such a caseit may be more realistic to take D as the largest dimension of theantenna itself. This argument typically leads to satisfaction of theR = 2D2/k criterion at much higher frequencies.
On the other hand, patterns of broad-beamed antennas such asdipoles, which may strongly illuminate the vehicle, are less affected bylarger phase errors, and again the measurements may be valid at higherfrequencies than those satisfying the R = 2D2/X criterion. Someadditional relaxation of this criterion may also be tolerable for testswhere the utmost accuracy is not necessary and only larger changes inthe antenna pattern are of concern.
In order to investigate these effects, a very simple model of theArc range was simulated on a computer. It must be emphasized that thissimulation represents a very simplified view of the Arc range. While itdemonstrates that, for some cases, taking the maximum vehicle dimensionas D is too conservative, it does not imply that there are no caseswhere the maximum vehicle dimension is a reasonable value for D.
In other words, each test item must be considered individually. Ifthe accuracy required in a test cannot reasonably be expected on the Arcrange, then either another test facility should be used (e.g., theCompact Range) or the accuracy requirements will have to be relaxed andthe resulting inaccuracies handled accordingly.
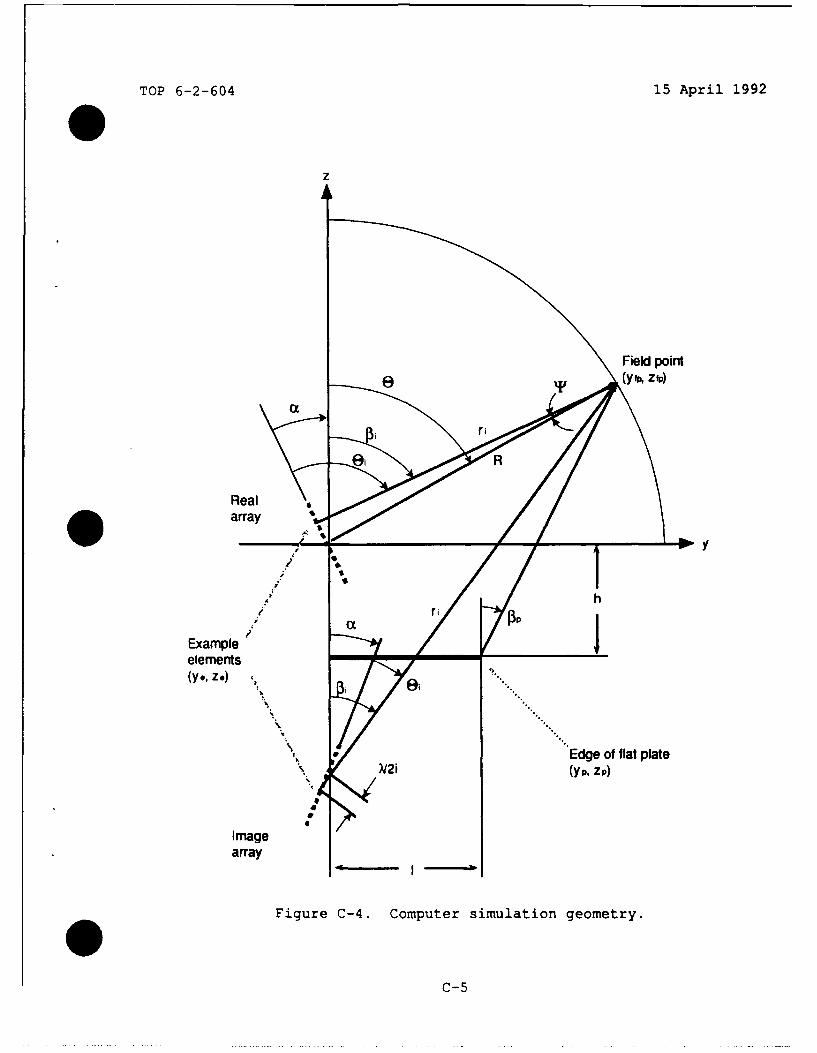
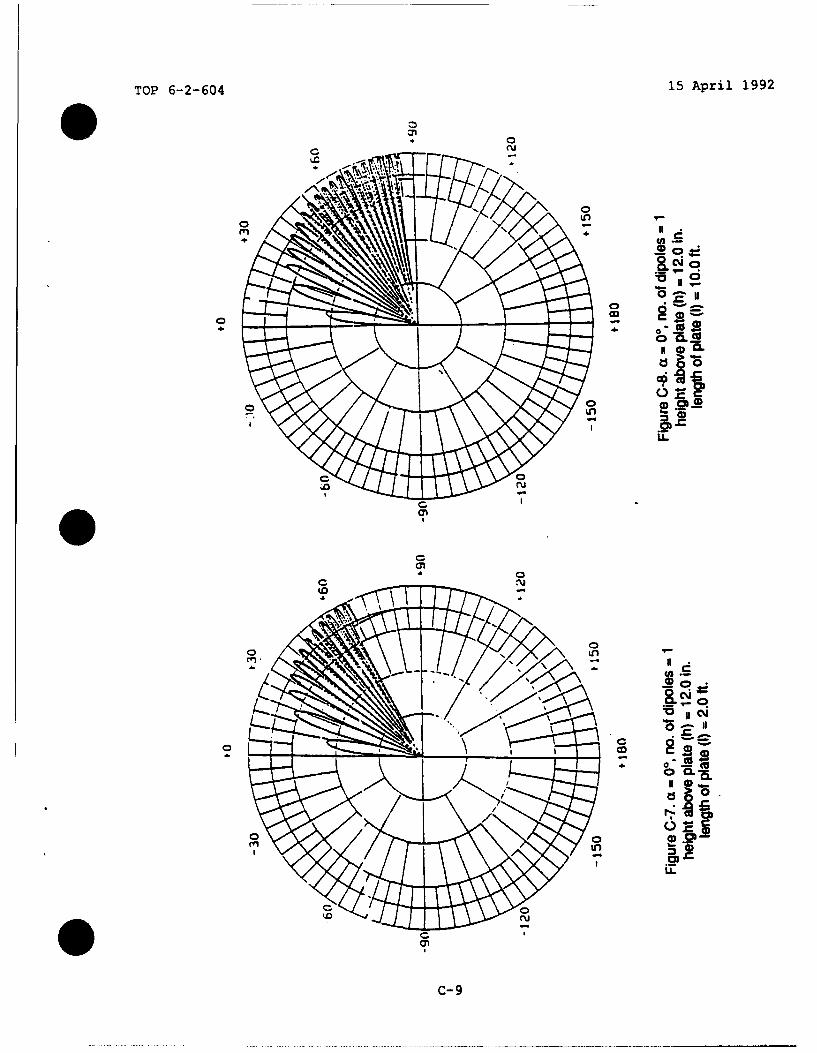
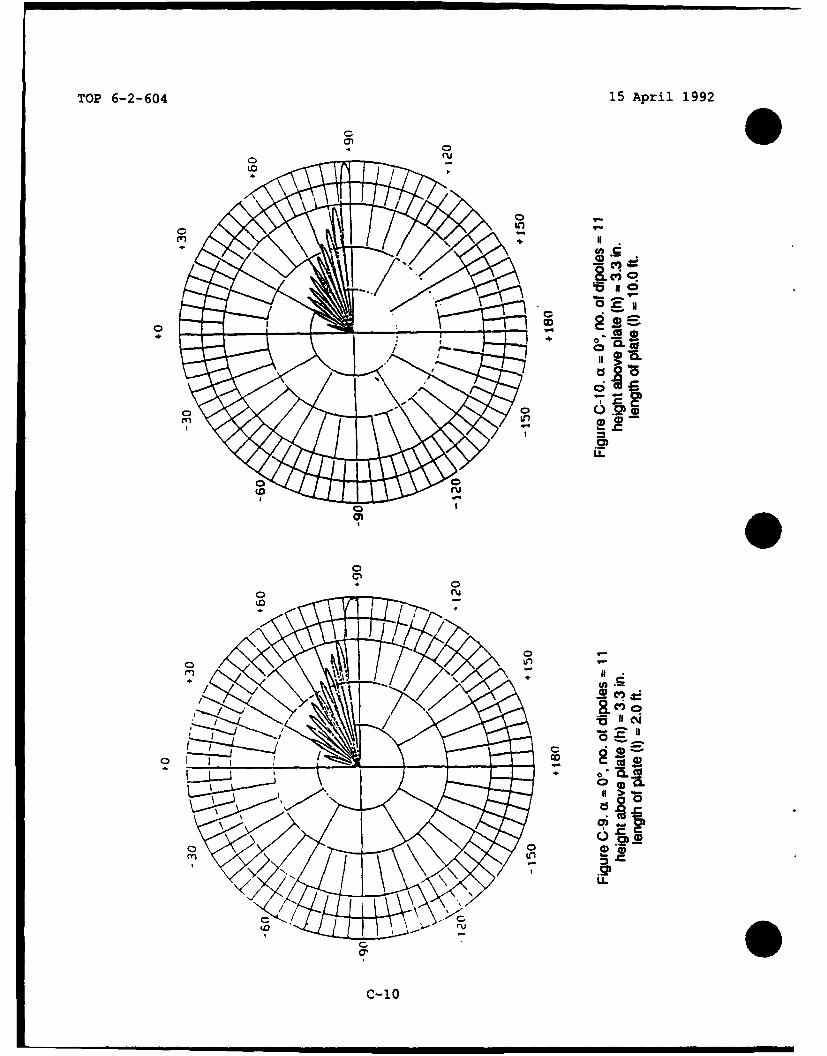
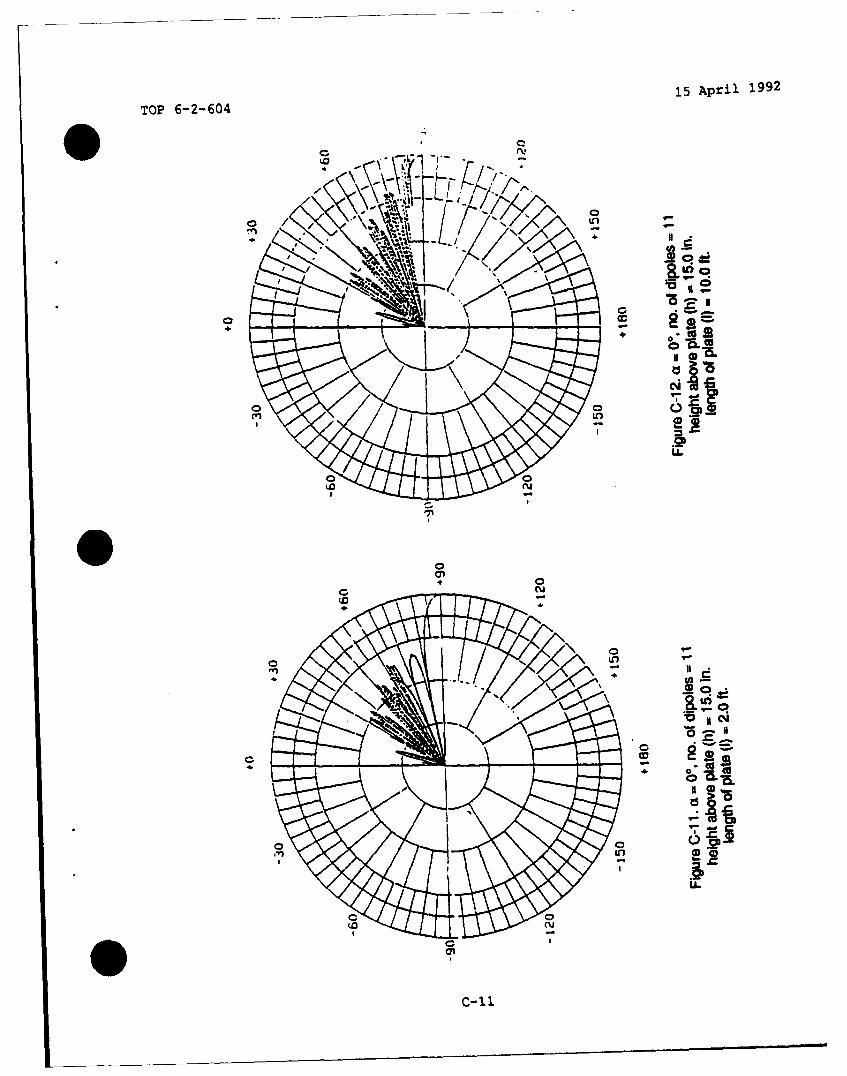
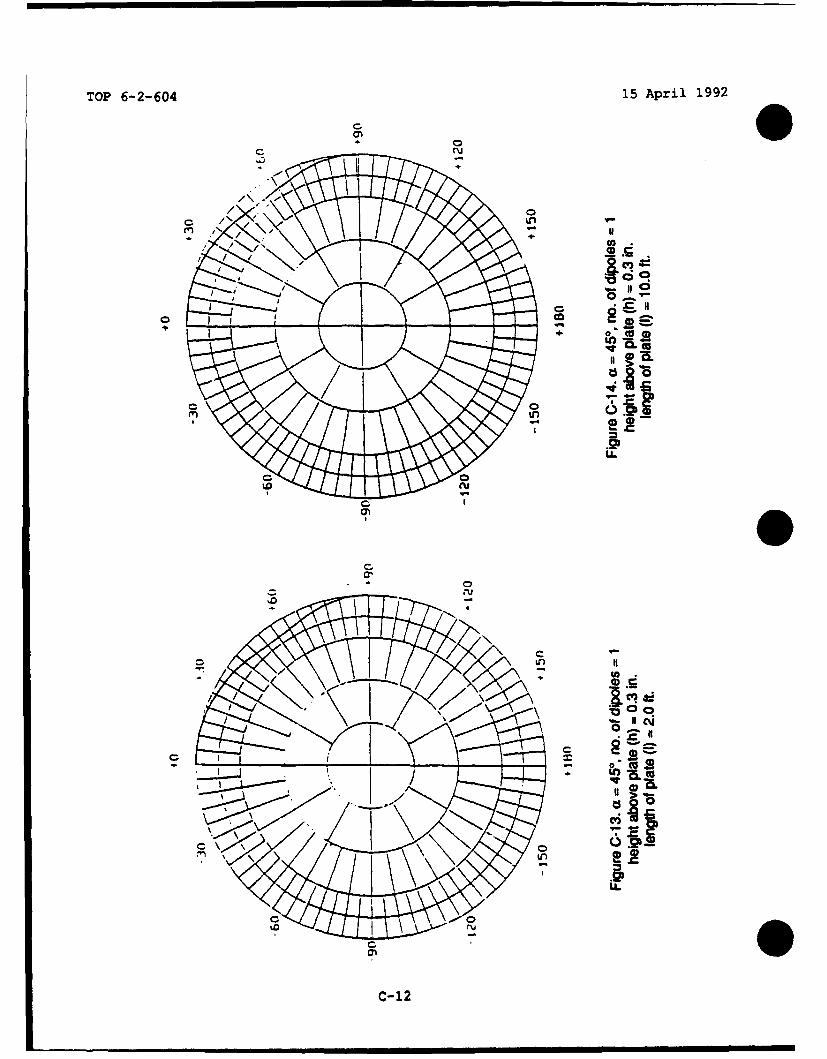
The geometry shown in figure C-4 was used for the simulation. Acolinear array of dipoles was used as the antenna so that both broadbeamed antennas (e.g., a simple dipole) and relatively narrow-beamedantennas could be simulated with the same software. A flat plate wasused to simulate the top surface of a vehicle on which the antenna wasmounted. This flat plate acted like a mirror to create an image dipolearray below it. The contributions of the actual dipoles and those ofthe image dipoles were summed at 900 points on a circular arc centeredon the real dipole array to create simulated antenna patterns.
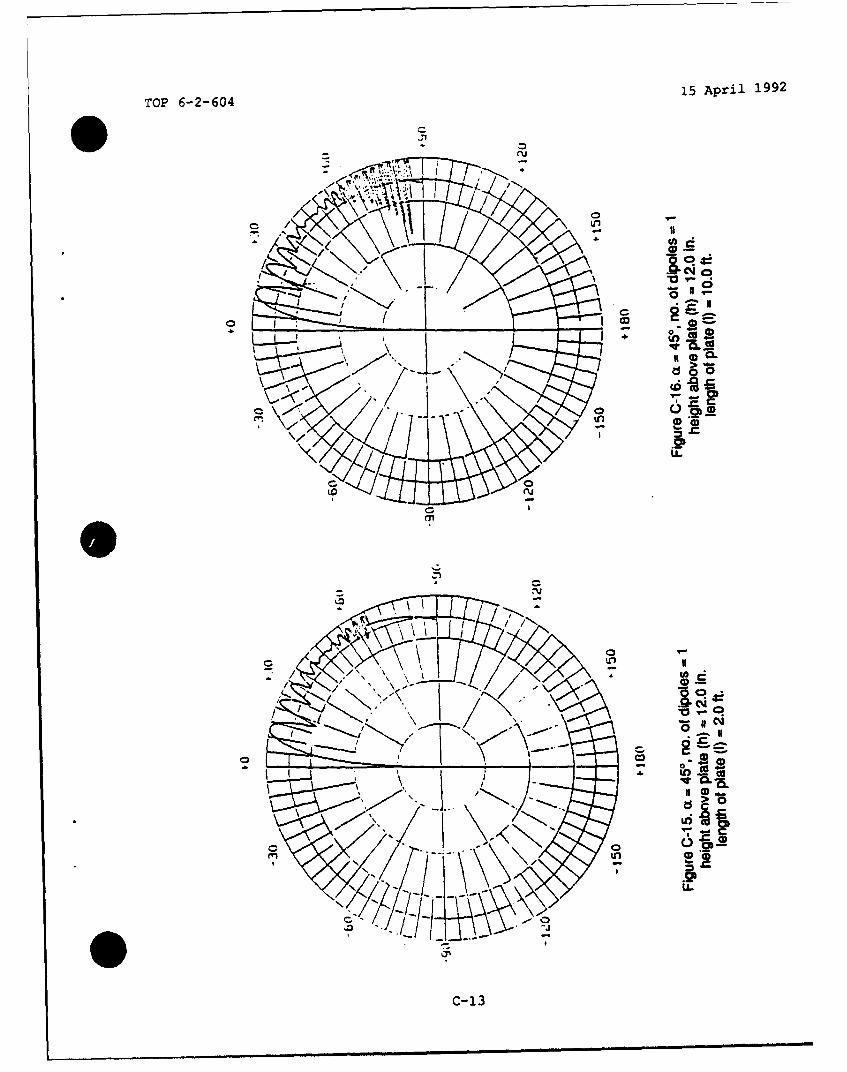
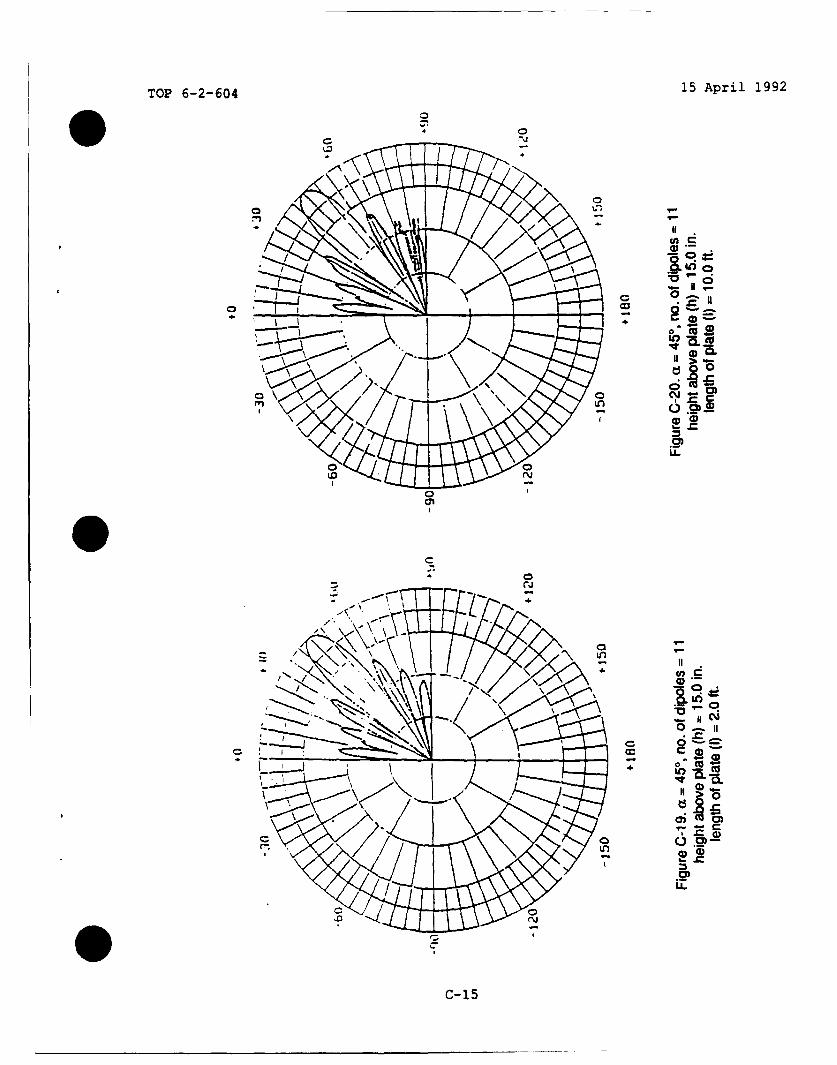
The analysis was carried out for two different radii for thecircular measurement arc, one of 15 feet and the other of 7500 feet (tomore closely approximate the infinite far field) for each antenna/vehicle configuration shown in table C-I. The parameters were chosen tosimulate a somewhat representative set of configurations.
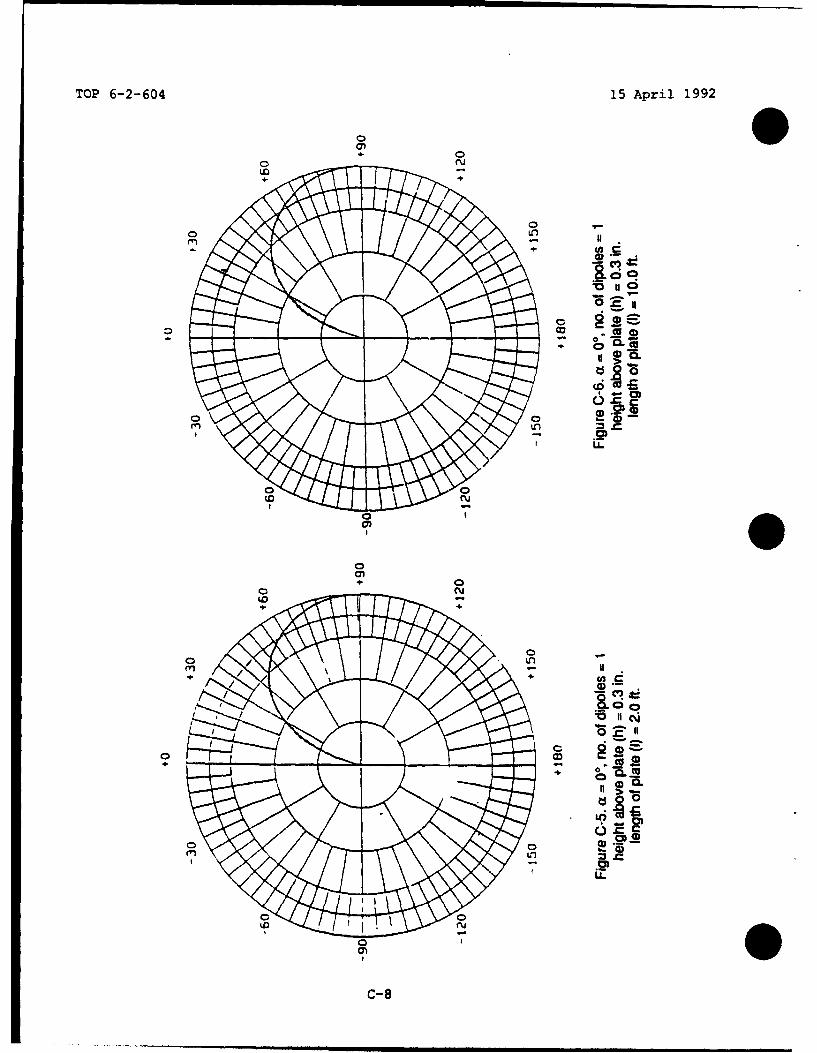
Figures C-5 through C-20 are plots that represent the outcome ofeach computer-simulated test. The important thing to note about eachfigure is not how many ripples, nulls, or peaks appear in the patterns,but the difference between the solid and dotted lines. The differencebetween the two patterns represents the measurement error due tomeasuring at 75 feet (the solid line) and 7500 feet (the dotted line).
i0C-4
TOP 6-2-604 15 April 1992
z
elementsin
( (y fa Z) P
array 0
Figre -4. Comute siulaion geoeftry.at
C-5
TOP 6-2-604 15 April 1992
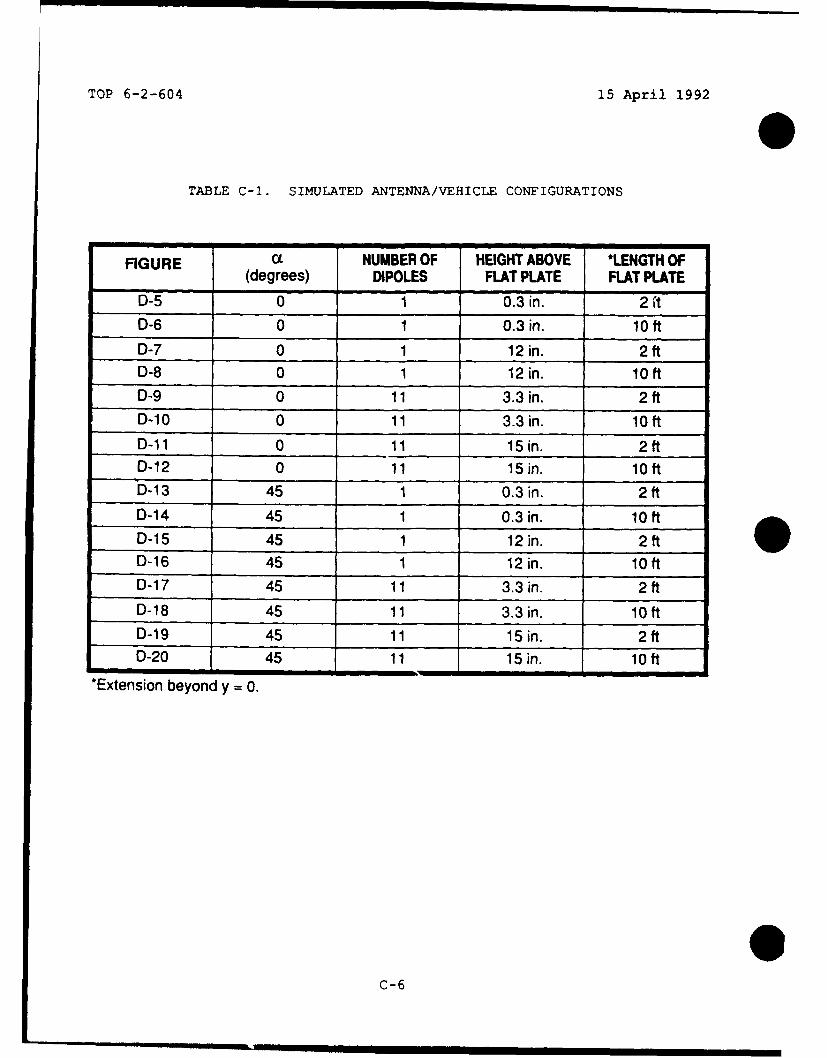
TABLE C-I. SIMULATED ANTENNA/VEHICLE CONFIGURATIONS
FIGURE aL NUMBER OF HEIGHT ABOVE *LENGTH OF(degrees) DIPOLES FLAT PLATE FLAT PLATE
D-5 0 1 0.3 in. 2 itD-6 0 1 0.3 in. 10ftD-7 0 1 12 in. 2 ftD-8 0 1 12 in. loftD-9 0 11 3.3 in. 2 ftD-10 0 11 3.3 in. 10ftD-11 0 11 15in. 2ftD-12 0 11 15in. 10ftb-13 45 1 0.3 in. 2 ftD-14 45 1 0.3 in. 10ftD-15 45 1 12 in. 2 ftD-16 45 1 12in. 10ffD-17 45 11 3.3 in. 2 ffD-18 45 11 3.3 in. 10ffD-19 45 11 15in. 2ftD-20 45 11 15 in. 10ft
*Extension beyond y = 0.
C-6
TOP 6-2-604 15 April 1992
Sevetal of the simulations exhibit what would normally beconsidered undesirable patterns as a result of poor design. Forexample, figure C-8 simulates a single dipole placed 10 wavelengthsabove the flat plate (normally a dipole would be placed either veryclose to or very far away from a conducting plane). Nevertheless, thesimulation reveals that the nulls actually exist and the only appreciableerror in the 75-foot measurement is in the null locations.
It cannot be overemphasized that this study is only a simulationand a very simplified one at that. Shortcomings of this simulationinclude:
" Edge effects have been ignored." The radial component of the electric field has been ignored." The flat plate is a poor approximation of the complex shape of avehicle.
" Radiation off the back of the dipole array has been assumed to bezero, when in fact there will always be some back lobe radiationfrom the reflector antenna this was intended to simulate.
" The receiving characteristics of the probe antenna have beenoversimplified.
" Multiple reflections have been ignored.• Mutual coupling effects have been ignored.
C-7
TOP 62-60415 April 1992
aa
LoT
aag
00*L
+4
CI kn
(n0+ (A
+- 8
TOP 6-2-604 15 April 1992
nCL
IIIc~
In.
U0
a CD
C- 9
TOP 6-2-604 15 April 1992
0
LLI.
0N
CC4
0 M
LIq. CI
c-i>a
TOP 62-60415 April 1992
To 6--0
00a'44
t 0
.4. ~u7
cm*
tL
C11
TOP 6-2-604 15 April 1992
o o
C ~ 1
44
* 0
oto
CILL
C 0C- 12
15 April 1992TOP 6-2-604
CC
CC
0-
CUa.
V00/ LCD
a 0
-0

TOP 6-2-604 15 April 1992
CD
00
c-i
TOP 6-2-604 15 April 1992
0q
In
Lo*C >
.0
0
if C I
o - if
00r~W)*(
c-i 5
TOP 6-2-604 15 April 1992 0
(THIS PAGE IS INTENTIONALLY BLANK)
0
0C-16
TOP 6-2-604 15 April 1992
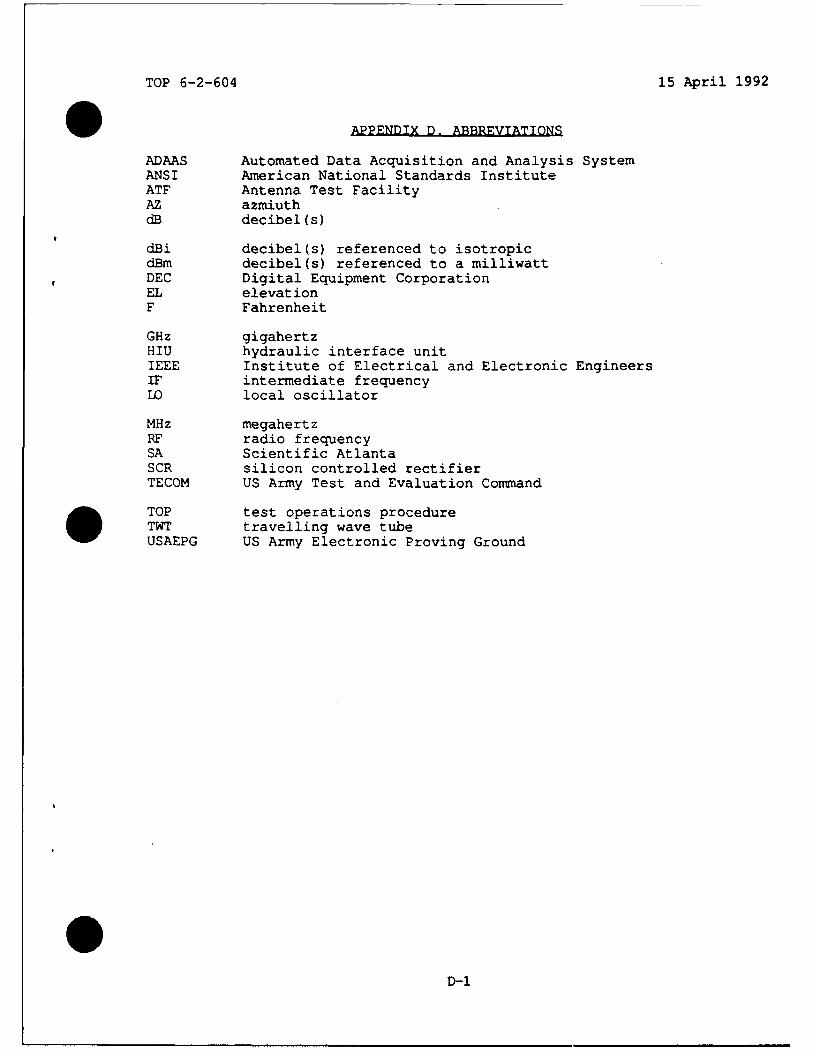
APPENDIX D. ABBREVIATIONS
ADAAS Automated Data Acquisition and Analysis SystemANSI American National Standards InstituteATF Antenna Test FacilityAZ azmiuthdB decibel(s)
dBi decibel(s) referenced to isotropicdBm decibel(s) referenced to a milliwattDEC Digital Equipment CorporationEL elevationF Fahrenheit
GHz gigahertzHIU hydraulic interface unitIEEE Institute of Electrical and Electronic EngineersIF intermediate frequencyIL local oscillator
MHz megahertzRF radio frequencySA Scientific AtlantaSCR silicon controlled rectifierTECOM US Army Test and Evaluation Command
TOP test operations procedureTWT travelling wave tubeUSAEPG US Army Electronic Proving Ground
D-1

TOP 6-2-604 15 April 1992
(THIS PAGE IS INTENTIONALLY BLANK)
D-2