re-examining cointegration, unit roots and efficiency in foreign exchange rates
TRANSCRIPT
RE-EXAMININGCOINTEGRATION, UNITROOTSANDEFFICIENCY IN FOREIGN EXCHANGERATES
John P. Lajaunie and Atsuyuki Naka
INTRODUCTION
Recent literature on the efficiency of foreign exchange markets makes use ofcointegration methods to test for the presence of a long-run equilibrium(Baillie and Bollerslev, 1989; Hakkio and Rush, 1989 and 1991; MacDonaldand Taylor, 1989; Sephton and Larsen, 1991; and Diebold, Gardeazabal andYilmaz, 1994). Given the mixed results of these studies with regard to theexistence of a cointegrating relationship among different currencies, adefinitive statement pertaining to foreign exchange market efficiency is notpossible. Furthermore, as Dwyer and Wallace (1992) demonstrate,interpreting cointegration in regard to efficiency is not straightforward.1 Thispaper shows that cointegration tests may indeed be sensitive to the choice oftest statistics, time trends, sample periods and the geography of currencieschosen.
Baillie and Bollerslev examine a set of seven daily exchange rates usingJohansen's (1988) full information maximum likelihood (FIML) methodand report the existence of a single cointegrating relationship for both spotand forward exchange rates. They conclude that the existence of cointegrationviolates the Efficient Market Hypothesis (EMH) based on Granger'simplications for integrated time series (Granger, 1986). However, Diebold,Gardeazabal and Yilmaz use the Johansen's (1991) method, which allows fora linear trend in the system, and do not find cointegration with the same dataset as Baillie and Bollerslev. Sephton and Larsen use both Johansen's (1988)procedure and Engle and Granger's (1987) single equation method to test forthe presence of a cointegrating relationship using the Baillie and Bollerslev'sdata.2 In their results, Sephton and Larsen find the number of cointegratingrelationships detected differs according to the sample period. This sensitivityto the test period chosen suggests a possible weakness of cointegration tests.Hakkio and Rush (1991) address the issue of longer versus shorter sampleswith different frequency and suggest that a longer period is more importantin testing for cointegration.
Journal of Business Finance&Accounting, 24(3) & (4), April 1997, 0306-686X
ß Blackwell Publishers Ltd. 1997, 108 Cowley Road, Oxford OX4 1JF, UKand 350Main Street, Malden, MA 02148, USA. 363
* The authors are respectively, Associate Professor of Finance in the Department of Economicsand Finance, Nicholls State University, Thiboduax, LA; and Associate Professor of Economicsand Finance, University of New Orleans. (Paper received September 1995, revised and acceptedJuly 1996).
Address for correspondence: Atsuyuki Naka, Associate Professor of Economics and Finance,Department of Economics and Finance, University of New Orleans, New Orleans, LA 70148,USA.

The purpose of this study is twofold. The first step is to examine thecointegrating relationships in the spot foreign exchangemarkets by employingthe Johansen's (1991) method for seven exchange rates for the sample periodfrom January 4, 1974 to April 30, 1991 and to test for the significance of alinear trend in the system. In addition to the entire sample period, threesubperiods are analysed to investigate the intertemporal stability of the resultsand compare the findings with those reported by Sephton and Larsen.3 Byusing the results from the longer sample period in conjunction with thesubperiods, we are able to address the sampling concerns raised by Hakkioand Rush (1991). Further, we conduct the tests using subgroups of the sevencurrencies to determine the consistency of the results with respect to differentdimensions in a system and exchange rate combinations.
The second step is to confirm the consistency of the results of cointegrationtests by examining the nonstationarity and stationarity of the cross-currencyrates. Dwyer andWallace (1992) state:
If the cross-currency rate has a unit root, the two exchange rates cannot be cointe-grated with a coefficient of unity (p.321).
We test for cointegration for twenty-one pairwise exchange rates using thePhillips and Ouliaris (1990) method. Then, the twenty-one cross-currencyrates for the corresponding exchange rates are tested for the presence of a unitroot using the Phillips and Perron (1988) method, as well as for thestationarity of the series using the method proposed by Kiwatkoski, Phillips,Schmidt and Shin (1992).
METHODOLOGY ANDDATA
We employ the Phillips and Perron (PP) (1988) test for the presence of a unitroot in each of the spot exchange rate series. The test is based on the followingequation:
Yt � �� ��t ÿ n=2� � �Ytÿ1 � ut ; �1�whereYt is the natural log of the exchange rate in period t, � is a constant term,(tÿn/2) is a time trend and ut is the error term which may exhibit weak serialdependence.
We apply Johansen's (1991) procedure to test for the number ofcointegrating relationships, r, in a p-dimensional system of exchange rates.The procedure uses the following error correction model (ECM):4
�Yt � �0 �Xkÿ1j�1
ÿj�Ytÿj � �Ytÿk � �t ; �2�
whereYt is a px1 vector and difference stationary,� is a difference operator,�0
364 LAJAUNIE ANDNAKA
ß Blackwell Publishers Ltd 1997
is a linear trend, and �t is a random error term. The test statistics for the Trace(TR) andmaximal eigenvalue (�-max) tests for cointegration are given in thefollowing form:5
TR � ÿTXpi�r�1
ln�1ÿ �i�; �3�
and:
�ÿmax � ÿT ln�1ÿ �r�1�: �4�The tests are for the null hypotheses of at most r cointegrating relationships.The distribution of the test statistics is a (pÿr) dimensional Brownian motionprocess and the critical values are found in Osterwald-Lenum (1992).We extend our analysis by using twenty-one cross-currency rates to
examine the consistency of the results from cointegration and unit root tests.First, each pair of exchange rates given in terms of the US dollar is tested for acointegrating relationship using the Phillips and Ouliaris (PO) (1990) singleequation cointegration test. The PO cointegration test is based on thefollowing equation:
Xt � a� bt �XNÿ1i�1
ciYi;t � et; �5�
whereN is the number of currencies (in this caseN=2), a is a constant term, ci isa cointegrating parameter, b is the parameter for the time trend componentand e is the error term.
Second, the cross-currency rates are tested for the presence of a unit rootusing the PP test. The PP procedure tests nonstationarity of time series dataas the null hypothesis. In addition to the PP test, we employ the Kiwatkoski,Phillips, Schmidt and Shin (KPSS) test for stationarity as the null hypothesisto analyse the cross-currency rates. The KPSS test statistic is based on aLagrange Multiplier (LM) principle and is calculated in the followingmanner:
LM � Tÿ2XTt�1
S2t =S2�k� �6�
where: St �Xti�1
ei; t � 1; 2; :::T :
St is the partial sum of regression residuals, ei.6 S2(k) is a consistent estimator of
the variance with a truncated lag parameter at k.7
The data, obtained from Data Resources Incorporated (DRI), arecomprised of the daily spot exchange rates spanning from January 4, 1974 to
COINTEGRATION, UNIT ROOTS AND FOREIGN EXCHANGE 365
ß Blackwell Publishers Ltd 1997
April 30, 1991 (4387 observations). The seven exchange rates considered are:Canadian dollar (CD), Deutschemark (DM), British pound (BP), Swiss franc(SF), French franc (FF), Japanese yen (JY) and Italian lira (IL), relative tothe US dollar.
The data are partitioned into three subperiods to check the intertemporalstability of the empirical results. The break points are determined by majorpolicy events that affect the exchange rates through the resulting impact onthe US dollar. The first subperiod covers January 1, 1974 to September 28,1979. The break point coincides with the change in the Federal Reserve Bankpolicy which targets a money supply aggregate in an effort to slow inflation.The second subperiod extends from October 1, 1979 to September 20, 1985.The relevant break for this subperiod is the Plaza Accord Agreement whichrepresents a concerted effort of the major industrialized countries to bring theUS dollar down from its record high levels against the other major currencies.The final subperiod extends from September 21, 1985 to the end of the sampleperiod, April 30, 1991.
EMPIRICAL RESULTS
Analysis of Unit Root and Cointegration Tests
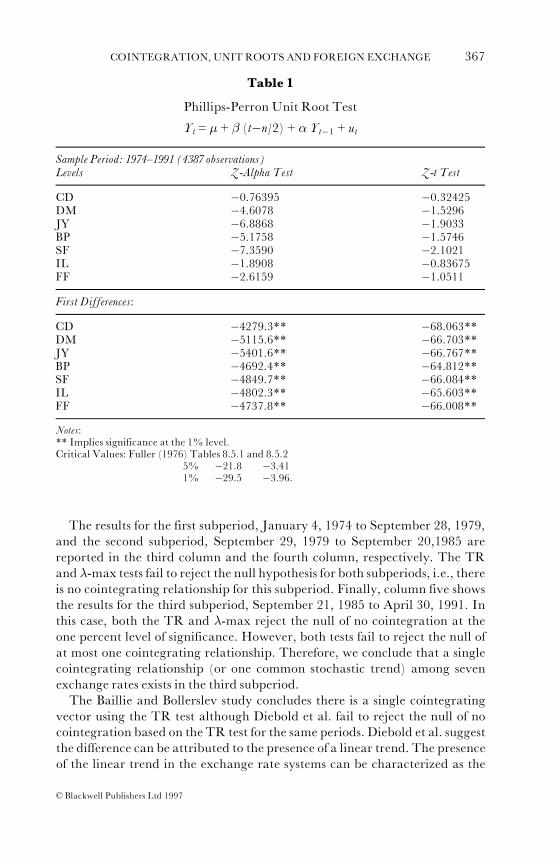
The results of the PP unit root tests in Table 1 show that each exchange rateseries is integrated of order one, i.e., first difference stationary for the fullsample period. The same results also hold for all three subperiods (notreported). These results are consistent with the findings of other studies.The results for the Johansen cointegration tests are reported in Table 2 for
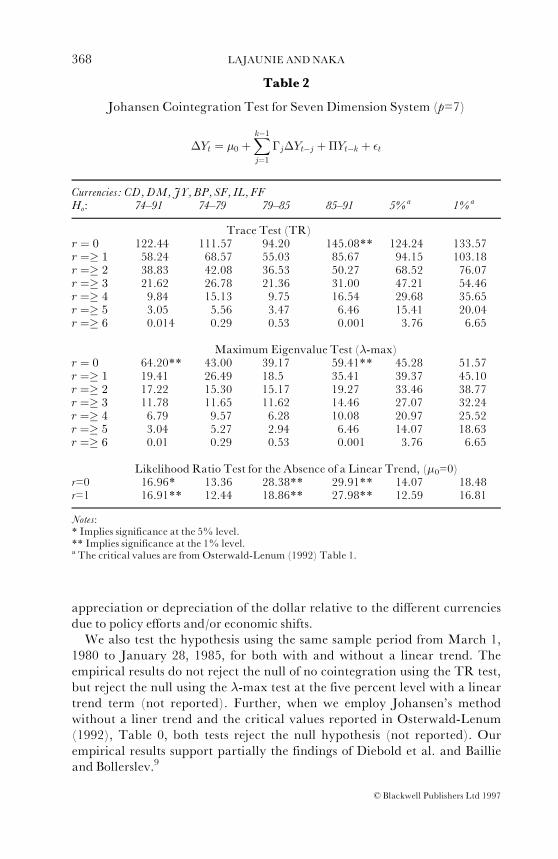
the seven-dimensional system (p=7) for the entire sample period as well aseach of the three subperiods. The table shows both the results of the Trace(TR) andMaximum Eigenvalue (�-max) test statistics. The last two columnsgive the critical values for the five and one percent significance levels.
Table 2 also presents the results of the Likelihood Ratio (LR) tests for thepresence of a linear trend in the ECM. The LR statistics are distributed as achi-square with degrees of freedom of 7 for the case of r=0 and 6 for r=1. TheLR tests reject the null hypothesis of no linear trend in the system in all casesexcept the 1974 to 1979 subperiod at the five percent significance level.Therefore, the critical values reported are based on an ECM which includesa linear trend.8
The second column reports the test results for the entire sample period. TheTR test fails to reject the null hypothesis of no cointegration, which isconsistent with the finding reported by Diebold et al. However, the �-max testrejects the null hypothesis at the one percent significance level. Therefore, theresults are mixed and we cannot confirm the presence of a cointegratingrelationship.
366 LAJAUNIE ANDNAKA
ß Blackwell Publishers Ltd 1997
The results for the first subperiod, January 4, 1974 to September 28, 1979,and the second subperiod, September 29, 1979 to September 20,1985 arereported in the third column and the fourth column, respectively. The TRand �-max tests fail to reject the null hypothesis for both subperiods, i.e., thereis no cointegrating relationship for this subperiod. Finally, column five showsthe results for the third subperiod, September 21, 1985 to April 30, 1991. Inthis case, both the TR and �-max reject the null of no cointegration at theone percent level of significance. However, both tests fail to reject the null ofat most one cointegrating relationship. Therefore, we conclude that a singlecointegrating relationship (or one common stochastic trend) among sevenexchange rates exists in the third subperiod.
The Baillie and Bollerslev study concludes there is a single cointegratingvector using the TR test although Diebold et al. fail to reject the null of nocointegration based on the TR test for the same periods. Diebold et al. suggestthe difference can be attributed to the presence of a linear trend. The presenceof the linear trend in the exchange rate systems can be characterized as the
Table 1
Phillips-Perron Unit Root Test
Yt = � + � (tÿn/2) + � Ytÿ1 + ut
Sample Period: 1974^1991 (4387 observations)Levels Z-Alpha Test Z-t Test
CD ÿ0.76395 ÿ0.32425DM ÿ4.6078 ÿ1.5296JY ÿ6.8868 ÿ1.9033BP ÿ5.1758 ÿ1.5746SF ÿ7.3590 ÿ2.1021IL ÿ1.8908 ÿ0.83675FF ÿ2.6159 ÿ1.0511First Differences:
CD ÿ4279.3** ÿ68.063**DM ÿ5115.6** ÿ66.703**JY ÿ5401.6** ÿ66.767**BP ÿ4692.4** ÿ64.812**SF ÿ4849.7** ÿ66.084**IL ÿ4802.3** ÿ65.603**FF ÿ4737.8** ÿ66.008**Notes:** Implies significance at the 1% level.Critical Values: Fuller (1976) Tables 8.5.1 and 8.5.2
5% ÿ21.8 ÿ3.411% ÿ29.5 ÿ3.96.
COINTEGRATION, UNIT ROOTS AND FOREIGN EXCHANGE 367
ß Blackwell Publishers Ltd 1997
appreciation or depreciation of the dollar relative to the different currenciesdue to policy efforts and/or economic shifts.
We also test the hypothesis using the same sample period from March 1,1980 to January 28, 1985, for both with and without a linear trend. Theempirical results do not reject the null of no cointegration using the TR test,but reject the null using the �-max test at the five percent level with a lineartrend term (not reported). Further, when we employ Johansen's methodwithout a liner trend and the critical values reported in Osterwald-Lenum(1992), Table 0, both tests reject the null hypothesis (not reported). Ourempirical results support partially the findings of Diebold et al. and Baillieand Bollerslev.9
Table 2
Johansen Cointegration Test for Seven Dimension System (p=7)
�Yt � �0 �Xkÿ1
j�1
ÿj�Ytÿj ��Ytÿk � �t
Currencies: CD, DM, JY, BP, SF, IL, FFHo: 74^91 74^79 79^85 85^91 5%a 1%a
Trace Test (TR)r � 0 122.44 111.57 94.20 145.08** 124.24 133.57r �� 1 58.24 68.57 55.03 85.67 94.15 103.18r �� 2 38.83 42.08 36.53 50.27 68.52 76.07r �� 3 21.62 26.78 21.36 31.00 47.21 54.46r �� 4 9.84 15.13 9.75 16.54 29.68 35.65r �� 5 3.05 5.56 3.47 6.46 15.41 20.04r �� 6 0.014 0.29 0.53 0.001 3.76 6.65
Maximum Eigenvalue Test (�-max)r � 0 64.20** 43.00 39.17 59.41** 45.28 51.57r �� 1 19.41 26.49 18.5 35.41 39.37 45.10r �� 2 17.22 15.30 15.17 19.27 33.46 38.77r �� 3 11.78 11.65 11.62 14.46 27.07 32.24r �� 4 6.79 9.57 6.28 10.08 20.97 25.52r �� 5 3.04 5.27 2.94 6.46 14.07 18.63r �� 6 0.01 0.29 0.53 0.001 3.76 6.65
Likelihood Ratio Test for the Absence of a Linear Trend, (�0=0)r=0 16.96* 13.36 28.38** 29.91** 14.07 18.48r=1 16.91** 12.44 18.86** 27.98** 12.59 16.81
Notes:* Implies significance at the 5% level.** Implies significance at the 1% level.a The critical values are from Osterwald-Lenum (1992) Table 1.
368 LAJAUNIE ANDNAKA
ß Blackwell Publishers Ltd 1997
Our findings support the study by Sephton and Larsen who conclude thatcointegration tests are sensitive to the time periods examined though theresults contradict in part their study reporting up to three possiblecointegrating relationships in some (much shorter) sample periods usingJohansen's 1988 method. We conjecture that the basis for the differences maybe attributable to the specification of the ECM, sample periods as well asdimensions of a system. The critical values from the Johansen (1988) paper,which do not account for the presence of a linear trend in the ECM,would leadto the rejection of the null hypothesis of, at most, r cointegrating relationships.
We extend the analysis of cointegration tests to specific subgroups for theentire time period and subperiods. The extension enables us to examine thesensitivity of the test procedures with respect to the choice of dimensions andthe currencies. The first subgroup is a five-dimensional system (p=5)comprised of the BP, DM, FF, IL and SF. The second subgroup is a four-dimensional system (p=4) using the DM, FF, IL and SF. The first and secondsubgroups are chosen by the close geographic and economic ties of Europeancountries. The final subgroup studied is another four-dimensional system(p=4) using the BP, CD, DM and JY. This group is selected to examine thesensitivity of the test results to the choice of different geographic locations.
The results for the first subgroup indicate that there is a single cointegratingrelationship for the entire period and the second subperiod. According to theLR tests, there is a linear trend for three periods except the 1979^1985subperiod. The results for the second subgroup are similar to those for the firstsubgroup. Since these exchange rates are from the European countries, it is notsurprising that similar results are obtained regardless of their dimensions.However, the third subgroup shows no cointegrating relationships for anysample periods.10 Thus, a choice of currency compositions is an importantfactor for detecting cointegrating relationships in foreign exchange markets.
Analysis for the Cross Currency Rates
This section examines the consistency between cointegraton for twenty-onepairs of exchange rates (in terms of the US dollar) and stationarity of thetwenty one corresponding cross-currency rates.11 Let SUS,i and SUS,j be theprice of country i's and j's currencies, respectively, in terms of US dollar,which contain a single unit root. Let the cointegrating equation be:
SUS; i � �� �SUS; j � Si; j �8�where Si,j is the resulting cross currency rate. Note when SUS,i and SUS,j arecointegrated (not cointegrated), Si,jmust be stationary (nonstationary).We employ the PP (1988) unit root test which sets nonstationarity as the
null hypothesis given a stated significance level (Type I error). Dejong andWhiteman (1991) address the shortcoming associated with a classical test forthe presence of a unit root based on a Bayesian point of view.12 Therefore, it is
COINTEGRATION, UNIT ROOTS AND FOREIGN EXCHANGE 369
ß Blackwell Publishers Ltd 1997
useful to test for stationarity as the null hypothesis based on the KPSS test inaddition to a conventional unit root hypotheses.
Since it is possible that the PP test and the KPSS test may give differentresults, there are four possible outcomes: (1) reject the null hypothesis by thePP test, but not reject the null by the KPSS test; (2) not reject the null by thePP test, but reject the null by the KPSS test; (3) reject the null by the PP test,but not reject the null by the KPSS test; and (4) not reject the null by the PPtest and not reject the null hypothesis by the KPSS test.
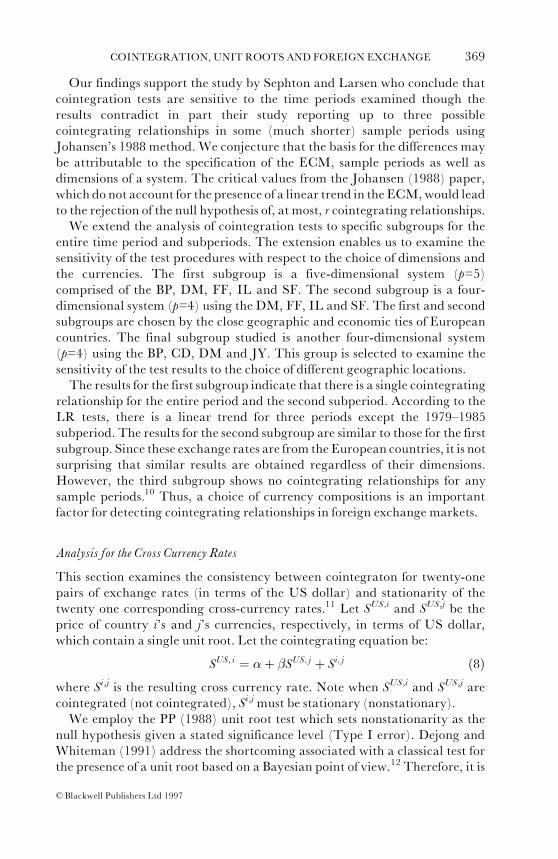
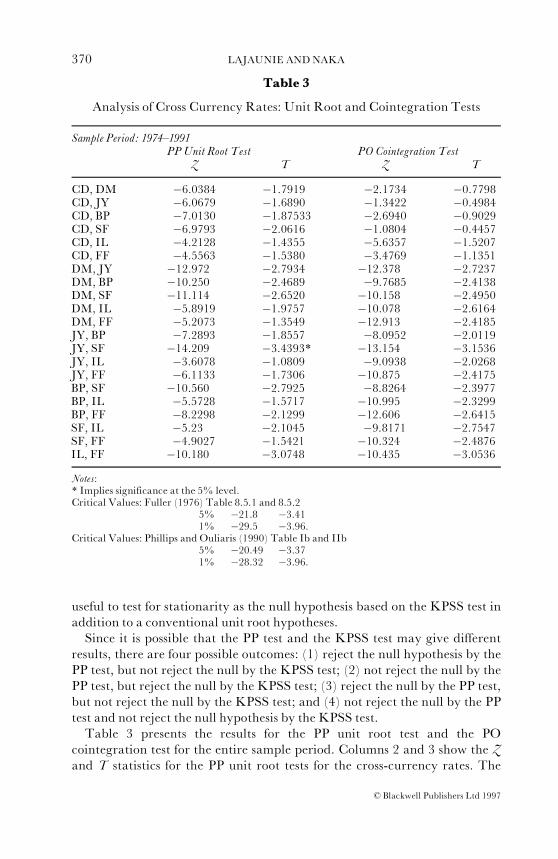
Table 3 presents the results for the PP unit root test and the POcointegration test for the entire sample period. Columns 2 and 3 show the Zand T statistics for the PP unit root tests for the cross-currency rates. The
Table 3
Analysis of Cross Currency Rates: Unit Root and Cointegration Tests
Sample Period: 1974^1991PPUnit Root Test PO Cointegration Test
Z T Z T
CD, DM ÿ6.0384 ÿ1.7919 ÿ2.1734 ÿ0.7798CD, JY ÿ6.0679 ÿ1.6890 ÿ1.3422 ÿ0.4984CD, BP ÿ7.0130 ÿ1.87533 ÿ2.6940 ÿ0.9029CD, SF ÿ6.9793 ÿ2.0616 ÿ1.0804 ÿ0.4457CD, IL ÿ4.2128 ÿ1.4355 ÿ5.6357 ÿ1.5207CD, FF ÿ4.5563 ÿ1.5380 ÿ3.4769 ÿ1.1351DM, JY ÿ12.972 ÿ2.7934 ÿ12.378 ÿ2.7237DM, BP ÿ10.250 ÿ2.4689 ÿ9.7685 ÿ2.4138DM, SF ÿ11.114 ÿ2.6520 ÿ10.158 ÿ2.4950DM, IL ÿ5.8919 ÿ1.9757 ÿ10.078 ÿ2.6164DM, FF ÿ5.2073 ÿ1.3549 ÿ12.913 ÿ2.4185JY, BP ÿ7.2893 ÿ1.8557 ÿ8.0952 ÿ2.0119JY, SF ÿ14.209 ÿ3.4393* ÿ13.154 ÿ3.1536JY, IL ÿ3.6078 ÿ1.0809 ÿ9.0938 ÿ2.0268JY, FF ÿ6.1133 ÿ1.7306 ÿ10.875 ÿ2.4175BP, SF ÿ10.560 ÿ2.7925 ÿ8.8264 ÿ2.3977BP, IL ÿ5.5728 ÿ1.5717 ÿ10.995 ÿ2.3299BP, FF ÿ8.2298 ÿ2.1299 ÿ12.606 ÿ2.6415SF, IL ÿ5.23 ÿ2.1045 ÿ9.8171 ÿ2.7547SF, FF ÿ4.9027 ÿ1.5421 ÿ10.324 ÿ2.4876IL, FF ÿ10.180 ÿ3.0748 ÿ10.435 ÿ3.0536Notes:* Implies significance at the 5% level.Critical Values: Fuller (1976) Table 8.5.1 and 8.5.2
5% ÿ21.8 ÿ3.411% ÿ29.5 ÿ3.96.
Critical Values: Phillips and Ouliaris (1990) Table Ib and IIb5% ÿ20.49 ÿ3.371% ÿ28.32 ÿ3.96.
370 LAJAUNIE ANDNAKA
ß Blackwell Publishers Ltd 1997
results fail to reject the null of a unit root for any of the twenty-one pairs ofexchange rates.13 The same results hold for the other three subperiods (notreported). Columns 4 and 5 report the Z and T-statistics for the POcointegration tests. The test results fail to reject the null hypothesis of nocointegration for the entire period, 1974^1991 and the same results hold forother subperiods (not reported).
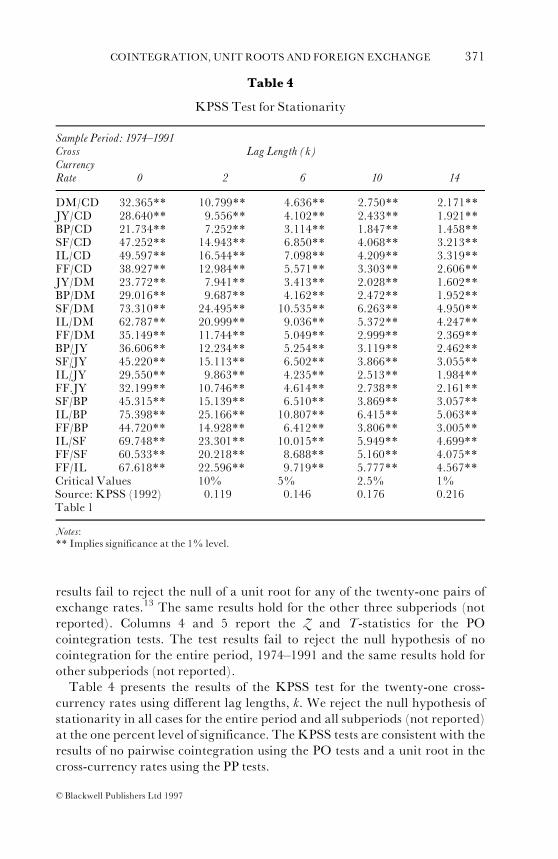
Table 4 presents the results of the KPSS test for the twenty-one cross-currency rates using different lag lengths, k. We reject the null hypothesis ofstationarity in all cases for the entire period and all subperiods (not reported)at the one percent level of significance. The KPSS tests are consistent with theresults of no pairwise cointegration using the PO tests and a unit root in thecross-currency rates using the PP tests.
Table 4
KPSS Test for Stationarity
Sample Period: 1974^1991Cross Lag Length (k)CurrencyRate 0 2 6 10 14
DM/CD 32.365** 10.799** 4.636** 2.750** 2.171**JY/CD 28.640** 9.556** 4.102** 2.433** 1.921**BP/CD 21.734** 7.252** 3.114** 1.847** 1.458**SF/CD 47.252** 14.943** 6.850** 4.068** 3.213**IL/CD 49.597** 16.544** 7.098** 4.209** 3.319**FF/CD 38.927** 12.984** 5.571** 3.303** 2.606**JY/DM 23.772** 7.941** 3.413** 2.028** 1.602**BP/DM 29.016** 9.687** 4.162** 2.472** 1.952**SF/DM 73.310** 24.495** 10.535** 6.263** 4.950**IL/DM 62.787** 20.999** 9.036** 5.372** 4.247**FF/DM 35.149** 11.744** 5.049** 2.999** 2.369**BP/JY 36.606** 12.234** 5.254** 3.119** 2.462**SF/JY 45.220** 15.113** 6.502** 3.866** 3.055**IL/JY 29.550** 9.863** 4.235** 2.513** 1.984**FF.JY 32.199** 10.746** 4.614** 2.738** 2.161**SF/BP 45.315** 15.139** 6.510** 3.869** 3.057**IL/BP 75.398** 25.166** 10.807** 6.415** 5.063**FF/BP 44.720** 14.928** 6.412** 3.806** 3.005**IL/SF 69.748** 23.301** 10.015** 5.949** 4.699**FF/SF 60.533** 20.218** 8.688** 5.160** 4.075**FF/IL 67.618** 22.596** 9.719** 5.777** 4.567**Critical Values 10% 5% 2.5% 1%Source: KPSS (1992) 0.119 0.146 0.176 0.216Table 1
Notes:** Implies significance at the 1% level.
COINTEGRATION, UNIT ROOTS AND FOREIGN EXCHANGE 371
ß Blackwell Publishers Ltd 1997
These results exhibit that the exchange rates in terms of any othercurrencies as well as in terms of the US dollar are not fixed and thusunpredictable. Note that these findings do not confirm or impeach the notionof market efficiency. Rather, evidence of cointegration merely implies pricepredictability which does not guarantee market inefficiencies. Dwyer andWallace point out that exchange rates can be cointegrated under thecondition of no arbitrage profits and they conclude that either the presence ofcointegration or the absence of cointegration can be consistent with marketefficiency (Dwyer andWallace, 1992, p.321).
CONCLUSION
This study finds mixed evidence of the existence of a cointegratingrelationship in the seven-dimensional exchange rate system. While the resultsdo not provide a definitive resolution to the issue of cointegrated exchangerate series, they do provide evidence of the sensitivity of the cointegrationtests to various factors. First, as pointed out by Sephton and Larsen (1991),cointegration tests do in fact appear sensitive to the sample periods chosen.Second, presence of a time trend can alter the test results. This may be partlydue to concerted policy efforts to effect the value of the US dollar relative toother currencies. Third, the investigation of the different subgroups indicatesthat cointegration tests are sensitive to the geography of currencies chosen.This finding is not surprising since it suggests that cointegrating exchangerates show possible strong ties to each other with trade and shared economicpolicies resulting in a long-term equilibrium relationship among theEuropean countries.
The examination of the cross-currency rates appear to be consistent withthe methods employed. The Phillips and Perron tests do not reject the nullhypothesis of nonstationarity across twenty one cross-currency rates and theKiwatkoski, Phillips, Schmidt and Shin tests reject the null of stationarity forthe same currency rates. Furthermore, the Phillips and Ouliaris tests do notfind any cointegrating relationships for all twenty-one combinations of twoexchange rates in terms of the common currency. The results of these threetests are consistent as expected.
NOTES
1 Granger (1986) claims that the prices of assets cannot be cointegrated in the efficient market.However, if efficiency is defined as absence of abnormal return, then presence of cointegrationdoes not violate the notion of efficiency (Dwyer andWallace, 1992).
2 Sephton and Larsen (1991) divided the Baillie and Bollerslev (1989) data into subperiods totest the intertemporal stability of the test results.
3 The Baillie and Bollerslev sample period was also analysed in this study.
372 LAJAUNIE ANDNAKA
ß Blackwell Publishers Ltd 1997
4 The FIMLmethod as a system of equations has several advantages over a single equation orpartial system of equations. See Johansen (1988).
5 The �-max test is considered more powerful than the Trace test. See Johansen and Juselius(1990).
6 For level stationarity, the time series is regressed on intercept only. For trend stationarity, thetime series is regressed on intercept and time.
7 This is a weighted variance estimator which assures non-negativity and is also used forcalculating the PP test statistics.
8 In the case for the 74^79 subperiod, where we fail to reject the null hypothesis of no lineartrend, the critical values for TR and �-max tests are based on no linear trend in the ECM(see Osterwald-Lenum, 1992, Table 1*).
9 Baillie and Bollerslev do not report the results using the �-max test statistics. However, the �-max test using their TR test statistics do not reject the null hypothesis.
10 The results of the cointegration tests for the subperiods are available upon request from theauthors.
11 The approach of this section is based on Dwyer andWallace (1992).12 Also, Schwert (1987) showed a possible misleading conclusion of trend and difference
stationarity with the ADF and PP tests when the moving average component is included inthe time series data.
13 The only exception is the combination of JY and SF usingT-statistics.
REFERENCES
Baillie, R. T. and T. Bollerslev (1989), `Common Stochastic Trends in a System of ExchangeRates', Journal of Finance, Vol. 44, No. 1 (March), pp. 167^88.
Dejong, D.N. and C.H. Whiteman (1991), `Reconsidering Trends and Random Walks inMacroeconomic Time Series', Journal of Monetary Economics, Vol. 28, No. 2 (October), pp.221^54.
Diebold, F.X., J. Gardeazabal and K. Yilmaz (1994), `On Cointegration and Exchange RateDynamics',The Journal of Finance, Vol. 49, No. 2 (June), pp. 727^35.
Dwyer, D. and M. Wallace (1992), `Cointegration and Market Efficiency', Journal ofInternational Money and Finance, Vol. 11, No. 4 (August), pp. 318^27.
Engle, R. and C.W.J. Granger (1987), `Cointegration and Error Correction: Representation,Estimation, and Testing', Econometrica, Vol. 55, No. 2 (March), pp. 251^76.
Fuller, Wayne A. (1976), Introduction to Statistical Time Series (John Wiley and Sons).Granger, Clive W.J. (1986), `Developments in the Study of Cointegrated Variables', Oxford
Bulletin of Economics and Statistics, Vol. 48, No. 3 (August), pp. 213^28.Hakkio, C.S. and M. Rush (1989), `Market Efficiency and Cointegration: An Application to the
Sterling and Deutschemark Exchange Markets', Journal of International Money and Finance,Vol. 8, No. 5 (October), pp. 571^81.
________________________ ________________________ (1991) `Cointegration: How Short is the Long-run?', Journal of InternationalMoneyand Finance, Vol. 10, No. 5 (December), pp. 571^81.
Johansen, S. (1988), `Statistical Analysis of Cointegration Vectors', Journal of Economic Dynamicsand Control, Vol. 12, No. 2 (June^September), pp. 231^54.
________________________ (1991), `Estimation and Hypothesis Testing of Cointegration Vectors in Gaussian VectorAutoregressive Models', Econometrica, Vol. 59, No. 6 (November), pp. 1551^80.
________________________ (1992), `Cointegration in Partial Systems and the Efficiency of Single-Equation Analysis',Journal of Econometrics, Vol. 52, No. 3 (June), pp. 389^402.
________________________ and K. Juselius (1990), `The Full Information Maximum Likelihood Procedure forInference on Cointegration with Applications', Oxford Bulletin of Economics and Statistics, Vol.52, No. 2 (May), pp. 169^210.
Kiwatkoski, D., P.C.B. Phillips, P. Schmidt and Y. Shin (1990), `Testing the Null Hypothesis ofStationarityAgainst the Alternative of aUnitRoot:HowSureAreWeThat Economic TimeSeries Have a Unit Root?', Journal of Econometrics, Vol. 54, No. 1 (October^December),pp.159^78.
MacDonald, R. and M.P. Taylor (1989), `Foreign Exchange Market Efficiency and
COINTEGRATION, UNIT ROOTS AND FOREIGN EXCHANGE 373
ß Blackwell Publishers Ltd 1997
Cointegration: Some Evidence From the Recent Float', Economics Letters, Vol. 29, No. 1, pp.63^8.
Osterwald-Lenum, M. (1992), `A Note with Quantiles of the Asymptotic Distribution of theMaximum Likelihood Cointegration Rank Test Statistics', Oxford Bulletin of Economics andStatistics, Vol. 54, No. 3 (August), pp. 461^71.
Phillips, P.C.B. and P. Perron (1988), `Testing for a Unit Root in Time Series Regression',Biometrika, Vol. 75, No. 2 (June), pp. 335^44.
________________________ and S. Ouliaris (1990), `Asymptotic Properties of Residual Based Tests ForCointegration', Econometrica, Vol. 58, No. 1 (January), pp. 165^93.
Sephton, P.S. and H.K. Larsen (1991), `Tests of the Exchange Market Efficiency: FragileEvidence From Cointegration Tests', Journal of International Money and Finance, Vol. 10, No.5 (October), pp. 561^70.
374 LAJAUNIE ANDNAKA
ß Blackwell Publishers Ltd 1997