rates and forms of erosion on intertidal platforms at kaikoura peninsula, south island, new zealand
TRANSCRIPT

This article was downloaded by: [Ohio State University Libraries]On: 06 December 2014, At: 23:33Publisher: Taylor & FrancisInforma Ltd Registered in England and Wales Registered Number: 1072954Registered office: Mortimer House, 37-41 Mortimer Street, London W1T 3JH,UK
New Zealand Journal ofGeology and GeophysicsPublication details, including instructions forauthors and subscription information:http://www.tandfonline.com/loi/tnzg20
Rates and forms of erosion onintertidal platforms at KaikouraPeninsula, South Island, NewZealandR. M. Kirk aa Department of Geography , Universiry ofCanterbury , Christchurch , New ZealandPublished online: 24 Jan 2012.
To cite this article: R. M. Kirk (1977) Rates and forms of erosion on intertidalplatforms at Kaikoura Peninsula, South Island, New Zealand, New Zealand Journal ofGeology and Geophysics, 20:3, 571-613, DOI: 10.1080/00288306.1977.10427603
To link to this article: http://dx.doi.org/10.1080/00288306.1977.10427603
PLEASE SCROLL DOWN FOR ARTICLE
Taylor & Francis makes every effort to ensure the accuracy of all theinformation (the “Content”) contained in the publications on our platform.However, Taylor & Francis, our agents, and our licensors make norepresentations or warranties whatsoever as to the accuracy, completeness,or suitability for any purpose of the Content. Any opinions and viewsexpressed in this publication are the opinions and views of the authors, andare not the views of or endorsed by Taylor & Francis. The accuracy of theContent should not be relied upon and should be independently verified withprimary sources of information. Taylor and Francis shall not be liable for anylosses, actions, claims, proceedings, demands, costs, expenses, damages,and other liabilities whatsoever or howsoever caused arising directly orindirectly in connection with, in relation to or arising out of the use of theContent.

This article may be used for research, teaching, and private study purposes.Any substantial or systematic reproduction, redistribution, reselling, loan,sub-licensing, systematic supply, or distribution in any form to anyone isexpressly forbidden. Terms & Conditions of access and use can be found athttp://www.tandfonline.com/page/terms-and-conditions
Dow
nloa
ded
by [
Ohi
o St
ate
Uni
vers
ity L
ibra
ries
] at
23:
33 0
6 D
ecem
ber
2014

N.z. Journal of Geology and Geophysics Vol. 20, No.3 (1977) : 571-613
RATES AND FORMS OF EROSION ON INTERTIDAL PLATFORMS AT KAIKOURA PENINSULA,
SOUTH ISLAND, NEW ZEALAND
R. M. KIRK
Department of Geography, Universiry of Canterbury, Christchurch, New Zealand
ABSTRACT
Shore platform development and processes are examined for Kaikoura Peninsula on the north-east coast of the South Island, New Zealand. The environment is exposed to high energy storm and swell waves, is mesotidal (mean range 1'36 m, maximum 2'57 m) and has a temperate climate with moderate rainfall (average 865 mm yr-I). Shore platforms range from 40 m to over 200 m wide and are cut in Tertiary mudstones and limestones. Most of the profiles display a prominent low water cliff, an outer rampart and channels developed along lines of structural weakness. The inner margins are extensively mantled in beach, hillslope, and lagoonal sediments which are being rapidly eroded except for three locations where there is an active marine cliff. Net tectonic uplift of the peninsula is thought to be of the order of 108 m during the Quaternary and 2 m during the last 1000 years. The shore platforms are thus clearly polycyclic and contain "inherited" morphological features but are being actively rejuvenated by removal of cover deposits.
Data on intertidal platform lowering rates are derived from 31 micro-erosion meter sites located on seven profiles around the peninsula margin. Each site produces three values per observation and they were measured at two monthly intervals for two years from 1973-1975 yielding 672 values for surface lowering, a 60%measurement repeatability. Mean lowering rate for the two years was 1'53 mm yr-I (minimum 0'38 mm yr-1, maximum 7'03 mm yr- \ standard deviation 1'45 mm yr-I) and rates were generally higher on mudstone than on limestone and where eroding cover deposits yield abundant abrasional materials.
Backwasting rates were estimated from analysis of air photographs over the period 1942-1974 for 41 sites on the peninsula and ranged up to 1.49 m yr-I for eroding beach complexes and between 0'24 and 0'33 m yr-I for active mudstone cliffs. Lowering rates were approximately 3% of backwasting rates. No data was obtained on either recession rates of the low water cliff or block disintegration of platform rock.
An approximate minimum littoral sediment budget revealed that the intertidal area of 0'72 km 2 contributes between 4-5000 m 3 of eroded material annually 34% of which is derived from the limited stretches of active marine cliff and 39% of which comes from platform lowering.
A parallel retreat model was applied to platform erosion rates with limited success and planation ages of between 10 2-10 3 years were estimated. Despite the short term nature of the erosion data both the rates and planation times are likely to be of order of magnitude accuracy. Both erosion rates and planation ages lie within the ranges of other studies and are consistent with dated shoreline events on the Kaikoura Peninsula. Four phases of activity are identified for the last 5-6000 years involving changing tectonic-eustatic levels, platform processes and erosion episodes in the hinterland. The platforms are thus rapidly evolving features which reflect both contemporary processes and recent history.
Analysis of variation in lowering rates across the shore revealed upper and lower zones of relatively more intense erosion separated by a central zone of lesser intensity. The upper zone is thought to be essentially sub-aerial and supra-littoral in character, while the lower one may be dominated by marine and sub-littoral processes. There is thus a gradient from sub-aerial processes to true marine processes across the shore so that it is unlikely that a single dominant mode controls platform development and morphology.
Received 11 August 1976, revised 24 March 1977.
Dow
nloa
ded
by [
Ohi
o St
ate
Uni
vers
ity L
ibra
ries
] at
23:
33 0
6 D
ecem
ber
2014

572 N.Z. JOURNAL OF GEOLOGY AND GEOPHYSICS VOL. 20
INTRODUCTION
Shore platforms are conspicuous features of much of the world's shorelines and have become the subject of a large international body of literature. The main aims of research have been to elucidate characteristic morphologies (Juts on 1939, 1950; Mii 1962; Wright 1967; Trenhaile 1971, 1972, 1974a, 1974b); processes of formation (Bartrum 1916, 1926; Wentworth 1938, 1939; Hills 1949; Edwards 1951); and, because they appear to be relatively durable features in the landscape, their relationships with past and present sea levels (Cotton 1963; Phillips 1970a, 1970b; Takahashi 1973, 1974).
In New Zealand shore platforms probably occur on 20-30% of our 10 000 km of coastline. They have been studied for over 60 years though the literature is not large. Bartrum (1916) pioneered local work and later hypothesised that platforms may be graded to the level of permanent saturation on the premise that weathering may be more rapid above than below that level. He argued that the "Old Hat" type of platform, an island ringed with platforms graded to mean sea level was produced in this way. Cotton (1963) considered levels of marine planation on differing types of platform and argued that the level of permanent saturation occurs at high water level. Cotton (1949, 1967) also attempted to account for extensive areas of hardrock shore, such as around Banks Peninsula, which lack extensive shore platforms. He introduced the term, "plunging cliffs", for such coastlines. Ongley (1940) described some coastal benches which were thought to have been produced by salt spray weathering.
More recently Healy (1968a, 1968b) has presented a detailed description of platforms around Whangaparaoa Peninsula and discussed the role of various agents of chemical and biological erosion in their formation. McLean & Davidson (1968) have investigated the role of sub-aerial mass movements on platform development in the Gisborne area. Other morphological aspects of New Zealand platforms have been discussed by Gill (1950) and by Wright (1967) who drew comparisons with apparently similar features on the English Channel Coast. McLean (1967) examined geometrical characteristics of shore platforms along the north-east coast of the South Island. Most recently Duckmanton (1974) has described the morphological and structural context of shore platforms around Kaikoura Peninsula, and Kirk (1975a) has described changes in coastal cliffs and backshore deposits over the last 32 years for the same area.
A distinctive feature of the literature both within New Zealand and overseas, especially of the earlier studies, is an emphasis on explanatorydescriptive writing with a corresponding lack of both quantitative description and analysis. As Mil (1962) noted processes have been inferred mostly from morphological detail, the "process" then being employed in the explanation of further morphologies. Arguments can thus easily become circular because morphology is a notoriously ambiguous indicator of process and of process rates.
There are relatively few published measurements of -either individual process rates or of gross wasting rates reflecting combinations of processes, This has occurred in part because of the difficulties of process measurement.
Dow
nloa
ded
by [
Ohi
o St
ate
Uni
vers
ity L
ibra
ries
] at
23:
33 0
6 D
ecem
ber
2014
No.3 KIRK - EROSION ON INTERTIDAL PLATFORMS 573
and because the explanatory-descriptive style engendered by W. M. Davis and D. W. Johnson through the cycle of coastal development did not lead to quantitative assessments of process or even of the morphology that was the focus of the work. Consequently, it has proven difficult to compare studies of one environment with another and there are few hard data against which to rigorously test alternative hypotheses for platform development.
In recent years, however, there has been some improvement in both quantitative description of morphology (Mii 1962; So 1965; Trenhaile 1971, 1972, 1974a, 1974b) and the appearance of data on erosion rates (e.g., Emery 1941; Revelle & Emery 1957; Hodgkin 1964; Neumann 1966; Evans 1968). However, most such studies relate to erosion by single processes or process groups (e.g., bio-erosion, chemical solution). There have also been an increasing number of studies dealing with recession rates of coastal cliffs (Horikawa & Sunamura 1967; Sunamura 1973; Trenhaile 1974b; Kirk 1975a), mainly by use of comparative air photography and ground surveys, but little is known about erosion rates on their associated shore platforms. There is, therefore, a need for quantitative studies of both shore platform and cliff retreat and to relate such data to the hypotheses of development which have been derived from morphological investigations.
As part of long term investigations of coastal processes and morphology in the Kaikoura area, the Coastal Group of the Department of Geography, University of Canterbury has undertaken studies of shore platforms around Kaikoura Peninsula with a view to resolving some of the problems described above. Such studies also have relevance to the programme of biological studies being carried out by members of the Department of Zoology at the University's Edward Percival Marine Laboratory in Kaikoura. In particular it is desirable to quantify base-line coastal erosion rates in relation to ecological studies of the Bull Kelp (Durvillea antarctica) which is being assessed for commercial harvesting potential (Hay & South 1974). Concern has been expressed elsewhere that removal of the kelp from the low tide cliffs of many platforms may lead to accelerated coastal erosion.
Accordingly, the main aim of this paper is to present the results of some experiments on platform surface lowering rates carried out over the twoyear period January 1973 to January 1975, and which are continuing. A second aim is to discuss the data in relation to platform morphology and structure and to rates of cliff and backshore recession reported in Kirk (1975a). A third aim is to interpret the data in terms of previous notions of shore platform development with particular emphasis on planation ages and patterns; and on an intertidal sediment budget. However, it is first necessary to review some of the major hypotheses of shore platform development.
Shore Platform Development
As noted by McLean & Davidson (1968) the term "shore platform" lacks precise definition but is generally applied to horizontal or near-horizontal benches, usually much less than 1 km wide, which occur around the tide levels of many rocky shores. Many platforms truncate the dip of local rock strata and thus are clearly erosional features. According to King (1972) platforms on tidal coasts slope gently seaward and may terminate
Dow
nloa
ded
by [
Ohi
o St
ate
Uni
vers
ity L
ibra
ries
] at
23:
33 0
6 D
ecem
ber
2014

574 N.Z. JOURNAL OF GEOLOGY AND GEOPHYSICS VOL. 20
near low water in a secondary cliff. However, there has been widespread debate on a number of aspects of morphological development, three of which have particular relevance to the present study. These are the "ultimate" elevation to which platforms are worked (relationship to sea level), mode of formation, and age and rate of development.
Relationship to sea level There are two distinct aspects to this problem, the first is concerned with
whether at a particular sea level there is one level of planation (and with what that elevation might be); and the second relates to platform history and the effects of eustatic and tectonic instability on the number and elevation of marine surfaces.
Trenhaile (1974b) noted that the classical concept of coastal development on a submerged coast proposed by Davis (1896) and extended by Johnson (1919) envisaged development of platforms through a sequence of forms as part of the general cycle of erosion. A single platform was thought to result from a given interval of cutting corresponding to a given sea level, the coastal cliff progressing landward essentially by parallel retreat maintaining an inclined and only slowly lowering platform graded to low water level. As extended by Challinor (1949), this concept implies maintenance of both slope and width in dynamic equilibrium as both the high-tide and low-tide cliffs retreat. Edwards (1941) considered that storm wave platforms are characterised by constant width during the youthful stage. Trenhaile (1974b, p. 139) noted, "If erosion of the high tide cliff became greater than the retreat of the low-tide cliff, increasing platform width •.. would reduce the rate of high tide erosion. Similarly, if the reverse was true, reduction of platform width would eventually intensify wave attack on the high tide cliff .... Retreat of a low tide cliff may effectively control platform extension".
Trenhaile goes on to apply a model of parallel slope retreat to erosion rates of macrotidal storm wave platforms in the Vale of Glamorgan, Wales. Sunamura (1973, p. 52) has also noted a tendency for parallel retreat of coastal cliffs in Japan. This concept will be examined later in the context of the Kaikoura data.
However, the parallel retreating single platform graded to low water level is by no means a universally accepted model. As has been mentioned already, Bartrum (1938) considered the primary control of platform elevation to be saturation level and that this occurred a little below mean water level. Hills (1949, 1971, 1972) has argued that wave action is the primary formative agent of shore platforms and that strong wave attack on exposed coasts is not restricted to any particular elevation, but is distributed over a broad vertical zone from some metres below sea level to some tens of metres above, the elevation of a particular platform being affected by lithology, rock weathering, degree of exposure, duration of development, and other factors. However, he concluded that mean tide level represents the ultimate downward level of development.
Mii (1962) identified eight major types of morphology on part of the Japanese coast and argued that the level of saturation was at low water. He considered it possible for more than one platform to develop at any given stand of sea level because of the vertical zonation of process, the influence of lithology and variations in exposure particularly to wave processes.
Dow
nloa
ded
by [
Ohi
o St
ate
Uni
vers
ity L
ibra
ries
] at
23:
33 0
6 D
ecem
ber
2014

No.3 KIRK - EROSION ON INTERTIDAL PLATFORMS 575
Gill (1967, 1972) working in Australia, proposed that platforms may occur at all possible heights, but are all ultimately graded to low water level.
Elsewhere, So (1965), Trenhaile (1971, 1972, 1974b) and others have shown that platforms are higher on exposed headlands than in bays and that there are often good relationships between platform gradient and tidal range and between the elevation of the cliff base and high water level (Trenhaile 1972). However, Trenhaile (1971) demonstrated for the shores of the Vale of Glamorgan that the elevation of high water rock ledges was lithologically controlled and reflected both past conditions of sea level and modern processes of formation.
Phillips (1970a, 1970b) has focused attention on the long-term development of platforms and noted that the present level of marine planation is highly variable in both range and location. He demonstrated that many platforms owe features to more than one single period of cutting at a protracted still-stand of sea level, particularly if continuing eustatic effects on sea level and tectonic influences on land level are considered. Many platforms, for example, have a variety of covering deposits of Quaternary origin from beneath which they are being excavated so that clearly some of their morphology is "inherited" from past periods of activity and their origin may be termed "polycyclic". Phillips (1970b) then demonstrated how inherited features combine with the zonation of modern processes to produce platforms of a wide variety of forms and elevations so that the association of one shore level with a single historical event is doubtful. Trenhaile (1972) concluded that much of the morphology he described was inherited from interglacial platforms subsequer,tly modified, mainly in Neolithic times but continuing into the present. ThIS aspect is of particular importance at Kaikoura where it will be shown that the inner margins of most platforms are mantled in beach, lagoon, and other deposits. The area also has a history of tectonic instability.
From the above discussion it may be concluded that the relationship between sea level and platform elevation is a complex function of process zonation, rock characteristics and history, but that the weight of opinion tends to favour ultimate grading with respect to low water.
Mode ~l Formation Almost as much complexity surrounds the problem of how platforms are
developed, although two major hypotheses have emerged. As has been mentioned, Bartrum (1938) considered that subaerial weathering is more intense than that beneath the sea so that the primary control of platform elevation is the level of permanent saturation. It was envisaged that weathering products were removed by "relatively weak" wave action. Wentworth (1938, 1939) discussed marine benching in Hawaii produced by chemical solution on calcareous shores and by water-layer weathering on shores developed in volcanigenic rocks. The latter process is particularly important since it depends upon frequent wetting and drying and consequent flaking of the rock surface in pools of standing water. It therefore leads to production of smooth, near-horizontal surfaces bordered by raised rims. On cliffs and the upper parts of platforms, flaking and cavernous weathering induced by wetting and drying and by salt crystallisation have been regarded as important weathering processes. Mii (1962) proposed that all forms of marine
Dow
nloa
ded
by [
Ohi
o St
ate
Uni
vers
ity L
ibra
ries
] at
23:
33 0
6 D
ecem
ber
2014
576 N.Z. JOURNAL OF GEOLOGY AND GEOPHYSICS VOL. 20
weathering are less intense than subaerial agencies so that weathering increases rapidly in power above low water level. This presupposes a dominantly sub-aerial origin for platforms.
In direct contrast to the weathering hypothesis, Hills (1949, 1971), Edwards (1951), Jutson (1939) and others have favoured a "storm wave" primary origin for many platforms. In these theories water-layer weathering, abrasion, and corrosion processes are viewed as secondary to platform cutting by the hydraulic effects of waves and the abrasive action of moving sediment. Accordingly, platforms are thought to be older and subject to greater energy at the lower, outer margins than at the inner edge. Cotton (1963) distinguished between the two major origins and argued that platforms of either type could be modified by secondary processes of chemical action or water layer weathering. So (1965), Hills (1972), and Trenhaile (1972) have all recorded a tendency toward flattening of the profile around mean water level.
Though much simplified the above discussion serves to highlight the fact that platform processes are extremely complex and that different processes may dominate in varying morphogenetic environments and mineralogies. The weathering hypothesis implies formation by downwasting and backwasting, wave action serving mainly to remove erosion products. Conversely, the wave-action hypothesis favours active cutting of the platform declining in intensity toward the high water cliff as width develops. The latter hypothesis also implies rapid retreat of the cliff toward a platform width and gradient which will absorb the energy incident upon it, at which point the rate of retreat of the low water cliff exerts a controlling influence on development, as previously discussed. Edwards (1951) proposed that platform preservation requires that the retreat rate of the main cliff equal or exceed that of the low water cliff. With the exception of Trenhaile's (1974b) work at the Vale of Glamorgan where close agreement between both vertical and lateral erosion rates and a parallel retreat model was demonstrated, a quantitative examination of competing hypotheses which have a long history in the literature has yet to be performed.
Age and Rate of Development
In recent years a number of studies have reported data on rates of activity of particular processes such as chemical solution (e.g., Revelle & Emery 1957), bioerosion (e.g., Neumann 1966), rates of surface lowering (Hodgkin 1964), and cliff recession (e.g., Trenhaile 1974b; Horikawa & Sunamura 1967) so that a better understanding of rates of formation has been gained. The problem of platfotm age, however, is more difficult and has received less attention.
A number of published values for downcutting, backwasting and undercutting have been gathered in Table 1. The list is by no means exhaustive but represents a wide range of lithologies and morphogenetic environments. A more extensive review of cliff retreat rates from around the world is presented by Sunamura (1973). Table 1 shows that published downwasting rates range between 0·1 and 35·0 mm ye i , with the most rapid rates occurring in exposed wave-dominated environments in which there is abundant abrasional material available at the shore. Rates of backwasting
Dow
nloa
ded
by [
Ohi
o St
ate
Uni
vers
ity L
ibra
ries
] at
23:
33 0
6 D
ecem
ber
2014

No.3
Author
Emery 1941
Revelle Emery 1957
North 1954
Evans 1969
Healy 1968
So 1965
Hodgkin 1964
Trenhaile 1974
Robinson pers. comm. 1974 Robinson pers. comm. 1974 Trudgill pers. comm.1976 Trudgill pers. comm.1976 Trudgill pers. comm.1976
Author
KIRK - EROSION ON INTERTIDAL PLATFORMS 577
TABLE 1-Some published rates of shore platform erosion
Note: Downwasting data are given in mm.ye l while backwasting and undercutting values are presented in m.ye l •
DOWNWASTING Rate
Method (mm ye l ) Process
Weathering of 0·3 Chemical + dated inscription biological
Chemical 0·3 Chemical analysis of solution and pool waters precipitation Volume of 0·6 Littorina spp. faecal pellets gastropod Width/depth 12·0 Rock-boring of clam holes clam
Inferred 1-0-10·0 Bioerosion
Profile surveys 24·5 Abrasion and old maps Plaster casts, 0·6-1·0 Gross surface steel scour pins lowering
Calculated 0·5-3·6 Wave action from recession rates Micro-erosion 0·1-1·0 Wetting and meter drying
Micro-erosion 1·5-35·0 Abrasion by meter gravels
Micro-erosion 1·0-2·0 Gross
Lithology Location
Sandstone, La Jolla, Calif. CaCo 3
cemented CaCo 3 Bikini Atoll,
Marshall Is.
Beach rock California
Soft mudstone Oregon
Siltstones and Whangaparaoa sandstones Penin., N.Z. Chalk Isle of Thanet,
English Channel Limestones Norfolk Is.+
Australia
Chalk Vale of Glamorgan, Wales
Laminated Yorkshire, mudstones U.K.
Laminated Yorkshire, mudstones U.K.
Sheltered Aldabra Atoll meter lowering rate coral limestone (leeward) Micro-erosion 3·0--4·0 Gross Exposed coral meter lowering rate limestone Micro-erosion 0·3-0·4 Gross Carboniferous meter lowering rate limestone
SUB-TIDAL CLIFFS AND OVERHANGS Rate
Method (m ye 1) Process Lithology
Aldabra Atoll (windward) Co Claire, Eire
Location
Neumann Direct 0·014
0·0025
Boring sponge CHona tampa Lithophaga spp. Molluscs
Reef+Cliff Carbonate Limestones and Dolomites
Bermuda 1966 measurement Vita-Finzi & Burrowing on Cornelius 1973 a rock jetty
Gulf of Oman
Dow
nloa
ded
by [
Ohi
o St
ate
Uni
vers
ity L
ibra
ries
] at
23:
33 0
6 D
ecem
ber
2014

578 N.Z. JOURNAL OF GEOLOGY AND GEOPHYSICS VOL. 20
TABLE 1-continued
------
BACKW ASTING Rate
Author Method (m yr!) Process Lithology Location
----
Gill 1973 Surveys 0 Quarrying and Basalt Victoria, (negligible) abrasion Australia
Gill 1973 Surveys 0·04 Slumping and Aeolianite Victoria, cave collapse Australia
Gill 1973 Surveys 0·008 Weathering Arkose Victoria, and abrasion Australia
Gill 1973 Surveys 0·0175 Weathering Siltstone Victoria, and abrasion Australia
Trenhaile Old photo- 0·0127 Abrasion Chalk Vale of 1974 graphs Glamorgan,
Wales
Rudberg Old photo- 0·004- Abrasion and Marls and Gotland, 1967 graphs, 0·006 mass- Limestones Baltic Sea
volume movement calculation
Schwartz Comparison 0·202 Undercutting Glacial drift W. Washington, 1971 of maps and slumping U.S.A.
Horikawa and Air photo- 0·1-1·01 Wave action Range from Japan Sunamura graphs and mass- diluvial to 1967 movement sandstone
Sunamura Surveys and 0·1- Wave action Range from Japan and 1973 air photo- 5·05 and mass- sands to worldwide
graphs movement sandstone
Fleming 1953 Surveys and 0·89 Wave action Siltstones and Taranaki, N.Z. photographs and mass- sandy
movement mudstones
Burgess 1971 Surveys and 0·69 Wave action Siltstones and Taranaki, N.Z. photographs and mass- sandy
movement mudstones
McLean and Surveys 1-69 Wave action Slumped Gisborne, N.Z. Davidson on mass- mudstones and 1968 movement sandstones
deposits
Norrman Air photo- 75·0 Storm wave Lavas S.W. coast of 1970 graphs, and action Surtsey,
surveys Iceland
Davis, Repeated 1·86- Wave action Glacial drift E. Coast, Fingleton and surveys 2·0 and sands Lake Michigan Pritchett 1975
Dow
nloa
ded
by [
Ohi
o St
ate
Uni
vers
ity L
ibra
ries
] at
23:
33 0
6 D
ecem
ber
2014
No.3 KIRK - EROSION ON INTERTIDAL PLATFORMS 579
can be seen to be generally much greater (often more than an order of magnitude more intense), and to span a range from negligible rates on some hard basalts in Australia to a maximum of 75 m in a single year on the rapidly evolving young coast of the island of Surtsey near Iceland. Rates are more rapid for unconsolidated gravels and sands and for soft mudstones and siltstones.
By contrast there are relatively few published data on sub-tidal erosion rates and it can be seen from Table 1 that most measurements relate to biogenic agents. In general, rates of undercutting are high and lie between those for backwasting and downcutting on the intertidal portions of platforms.
These data serve to show that platform modification and development can be rapid processes in terms of geologic time, perhaps more rapid than has been customarily thought. It may be inferred that platforms of the order of 100 m wide could be developed in a few thousand years or less in many environments at contemporary intensities of process. Takahashi (1973) concluded that platforms around the Southern Kii Peninsula in Japan have a planation age of 3000 years, and a similar time span is implied by Trenhaile (1974b) for the Vale of Glamorgan, though the latter are clearly partially inherited features.
In changeable morphogenetic environments (climate, wave climate) where there is also tectonic instability and lor eustatic change there is clearly considerable scope for more than one interval of erosion within the last few thousand years. The Kaikoura area is such an environment and one in which, from the above reviews, we should expect to find shore platforms of a variety of forms and elevations reflecting a complex balance among the elements of lithology, weathering, erosion, and recent history.
THE STUDY AREA
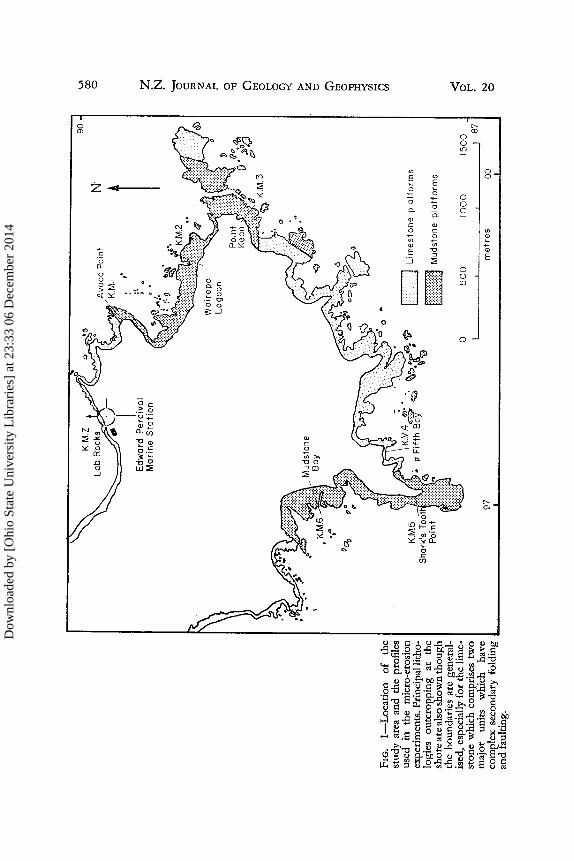
The Kaikoura Peninsula is located on the north-east coast of the South Island (centred on 420 25' S; 1730 42' E), and takes the form of a low, hilly, plateau rising to 108 m above sea level. As can be seen from Fig. 1 it projects seaward 4·5 km perpendicular to the general north-east-south-west strike of the coastline and has a compact shape broken by a series of projecting points and small bays. The peninsula has a total area above low water of about 5·2 km 2, some 0·77 km 2 of which is intertidal. Thus approximately 15% of the area is occupied by the shore platforms discussed in this paper so that they form a dominant element in the landscape. Platform processes have also been prominent in the Quaternary history of the peninsula because four extensive apparently interglacial surfaces dominate the upper levels. These features have been described by Suggate (1965), Chandra (1969), and Duckmanton (1974) and are important to the present study in that they indicate a long history of shore platform development and a Quaternary net tectonic uplift in excess of 100 m (Suggate 1965).
The north-east coast of the South Island is a rocky, fault-bounded one except in the immediate vicinity of Kaikoura where the peninsula bisects a narrow outwash plain bordered by greywacke mixed sand and gravel beaches which extend on to the flanks of the peninsula. On this coast mountains of
Dow
nloa
ded
by [
Ohi
o St
ate
Uni
vers
ity L
ibra
ries
] at
23:
33 0
6 D
ecem
ber
2014
FIG
. 1
-Lo
cati
on
o
f th
e st
udy
area
and
the
pro
file
s us
ed
in
the
mic
ro-e
rosi
on
expe
rim
ents
. Pri
ncip
al li
tho
logi
es
outc
ropp
ing
at
the
shor
e ar
e al
so s
how
n th
ou
gh
th
e bo
unda
ries
are
gen
eral
is
ed,
espe
cial
ly f
or t
he l
ime
ston
e w
hich
com
pris
es t
wo
0"0 ',"
0
N'
90
1
r
c=J
Lim
esio
ne
pla
tfo
rms
I({ttit
l Mu
dst
on
e p
latf
orm
s
50
0
10
00
--
---.
J
87
me
tre
s
'"0
0 1
00
m
ajor
un
its
whi
ch
have
I 97
co
mpl
ex s
econ
dary
fol
ding
L __
__
__
__
__
.L _
__
__
__
__
__
__
__
__
__
__
__
__
_ -L
. __
_ --J
and
faul
ting
.
VI
00
0 z N
0' c:: ~ z >
t"'
0 >:j ~
~
0 t"'
0 Q
>
Z
ti
~
~
0 :E ><:
[f) r; [f) ~ !'"'
N
0
Dow
nloa
ded
by [
Ohi
o St
ate
Uni
vers
ity L
ibra
ries
] at
23:
33 0
6 D
ecem
ber
2014
No.3 KIRK - EROSION ON INTERTIDAL PLATFORMS 581
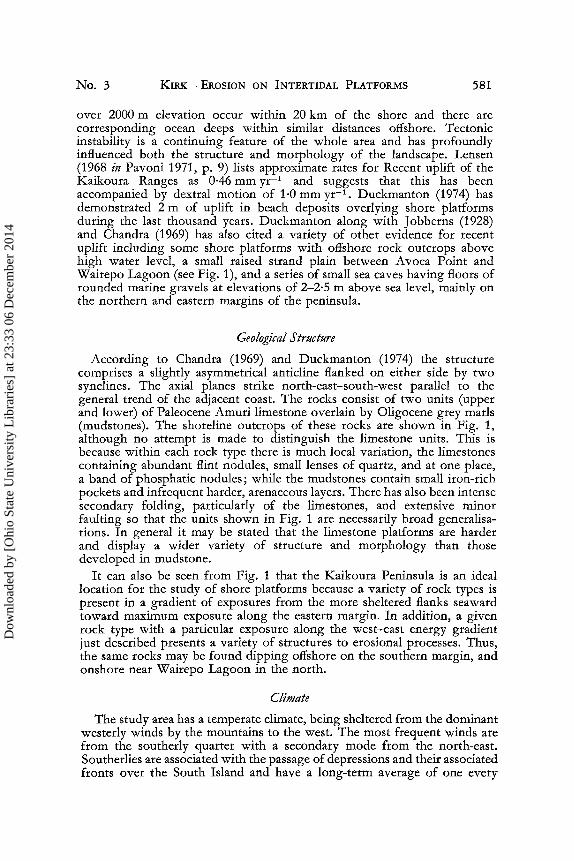
over 2000 m elevation occur within 20 km of the shore and there are corresponding ocean deeps within similar distances offshore. Tectonic instability is a continuing feature of the whole area and has profoundly influenced both the structure and morphology of the landscape. Lensen (1968 in Pavoni 1971, p. 9) lists approximate rates for Recent uplift of the Kaikoura Ranges as 0·46 mm ye l and suggests that this has been accompanied by dextral motion of 1·0 mm ye l • Duckmanton (1974) has demonstrated 2 m of uplift in beach deposits overlying shore platforms during the last thousand years. Duckmanton along with Jobberns (1928) and Chandra (1969) has also cited a variety of other evidence for recent uplift including some shore platforms with offshore rock outcrops above high water level, a small raised strand plain between Avoca Point and Wairepo Lagoon (see Fig. 1), and a series of small sea caves having floors of rounded marine gravels at elevations of 2-2·5 m above sea level, mainly on the northern and eastern margins of the peninsula.
Geological Structure
According to Chandra (1969) and Duckmanton (1974) the structure comprises a slightly asymmetrical anticline flanked on either side by two synclines. The axial planes strike north-east-south-west parallel to the general trend of the adjacent coast. The rocks consist of two units (upper and lower) of Paleocene Amuri limestone overlain by Oligocene grey marls (mudstones). The shoreline outcrops of these rocks are shown in Fig. 1, although no attempt is made to distinguish the limestone units. This is because within each rock type there is much local variation, the limestones containing abundant flint nodules, small lenses of quartz, and at one place, a band of phosphatic nodules; while the mudstones contain small iron-rich pockets and infrequent harder, arenaceous layers. There has also been intense secondary folding, particularly of the limestones, and extensive minor faulting so that the units shown in Fig. 1 are necessarily broad generalisations. In general it may be stated that the limestone platforms are harder and display a wider variety of structure and morphology than those developed in mudstone.
It can also be seen from Fig. 1 that the Kaikoura Peninsula is an ideal location for the study of shore platforms because a variety of rock types is present in a gradient of exposures from the more sheltered flanks seaward toward maximum exposure along the eastern margin. In addition, a given rock type with a particular exposure along the west-east energy gradient just described presents a variety of structures to erosional processes. Thus, the same rocks may be found dipping offshore on the southern margin, and onshore near Wairepo Lagoon in the north.
Climate
The study area has a temperate climate, being sheltered from the dominant westerly winds by the mountains to the west. The most frequent winds are from the southerly quarter with a secondary mode from the north-east. Southerlies are associated with the passage of depressions and their associated fronts over the South Island and have a long-term average of one every
Dow
nloa
ded
by [
Ohi
o St
ate
Uni
vers
ity L
ibra
ries
] at
23:
33 0
6 D
ecem
ber
2014

582 N.Z. JOURNAL OF GEOLOGY AND GEOPHYSICS VOL. 20
6-10 days (Garnier 1968). North-easterly winds are often sea breezes though occasionally strong winds from this quarter are generated by cyclonic disturbances tracking southward along the east coast. Both southerly and north-easterly conditions are important generators of waves reaching the Kaikoura coast.
Rainfall at Kaikoura averages 865 mm ye l and displays a lack of pronounced seasonality. Extreme rainfall reaches a May monthly maximum of 102 mm and a September monthly minimum of 51 mm.
Average monthly temperatures range from 7·2°c in July to 15·4°c in January and recorded extreme daily ranges are from 16·7°c in July to 2·8°c in January with a span of 32·1°c (daily maximum to daily minimum) for the year. Frosts are frequently recorded in winter. Sea surface temperatures vary from 12-18°c at the shore throughout the year.
Hence, there is sufficient water and a wide enough temperature range for a considerable weathering potential at the shoreline. There is also an abundance of high energy wave action.
Waves
The Kaikoura Peninsula is exposed to high energy oceanic swell and storm waves emanating from the south, south-east and north-east. Kirk (1975b) presents observations of waves from the beaches adjacent to the peninsula ranging in significant height from 0·3 m to 2·44 m and having periods offrom 7·5-10·0 s. However, McLean (1968) and Kirk (1972, 1973) have shown that the peninsula margins receive waves less than 0·5 m high half of the time. Waves larger than 1·5 m occur 15% of the time on the southern coast but only about 3% of the time on the northern shores. Although there is no data to hand on the frequency of occurrence of waves of a given height for the eastern margin it is generally felt that energy levels there are higher than elsewhere owing to the greater degree of exposure.
The infrequent episodes of high energy wave action noted for the northern and southern sectors are related to the cyclonic movements previously discussed so that it is reasonable to describe the wave environment of the peninsula as comprising protracted intervals of small waves and low swell (less than 0·5 m high) interrupted by intense periods of storm wave activity (wave heights greater than 2 m). Storm wave action is more intense and more frequent on the southern coast than the northern and waves are persistently larger on the eastern flank than on either the northern or southern. Large waves may be received at any point on the shoreline at any time of the year depending upon cyclonic conditions but for much of the time there is a gradient in wave energy from a minimum in the west to a maximum in the east.
Tides
The tides at Kaikoura have been recorded for a five-year period from 1967 to 1972 and described by Kirk (1976) as dominantly semi-diurnal but containing up to 20% diurnal inequality in the magnitude of high water,
Dow
nloa
ded
by [
Ohi
o St
ate
Uni
vers
ity L
ibra
ries
] at
23:
33 0
6 D
ecem
ber
2014

No.3 KIRK - EROSION ON INTERTIDAL PLATFORMS 583
the day-time high being larger. The mean range is 1·36 m and the maximum 2·57 m for the period of the record. There is a pronounced neap-spring cycle. The data have been corrected with respect to the Marlborough Catchment Board's local datum and mean sea level.
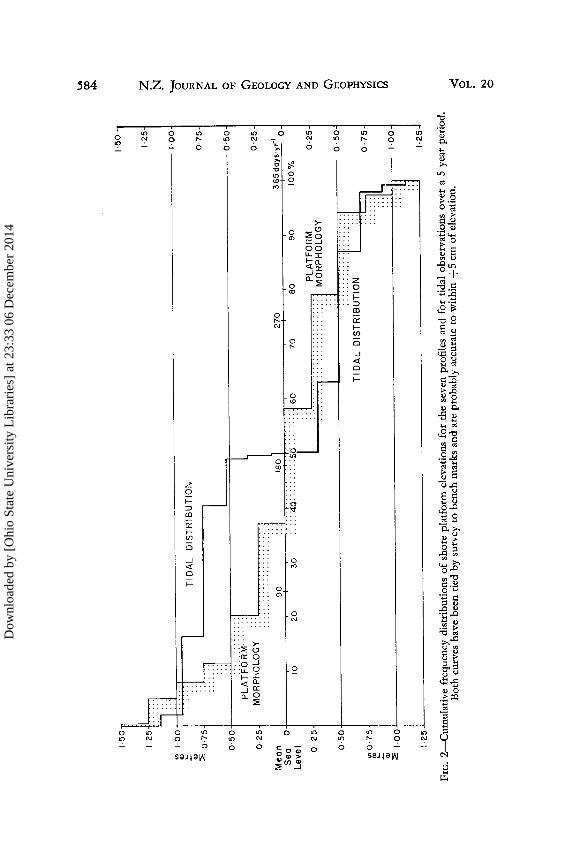
Figure 2 presents the cumulative curve of tidal elevations in relation to that for the platform levels studied. It can be seen that elevations above +1·0 m which represent 7% of the morphology are water-covered only 2·5% of the time. Elevations up to +0·5 m above mean sea level represent 21 % of the platforms and are submerged for 48% of the time. Hence, there is a rapid decline in the frequency of water cover between +0·5 and + 1·0 m, a zone which contains a significant proportion of the platform levels. It can also be seen that over half of the morphology occurs above mean sea level (57%).
A further 21% of the platforms lie between mean sea level and -0·5 m. This zone is water-covered from half to 63% of the time, while below -0·5 m the remaining 22% of the platforms are uncovered only 12% of the time. Hence, the shore platforms may be described as predominantly intertidal and presenting a range of elevations quite closely related to the pattern of tidal submergence. There is, however, clearly more rock exposed frequently above: mean sea level than is semi-permanently submerged below datum.
Shore Platforms
Duckmanton (1974) in a comprehensive study of both the past and present platforms of the peninsula surveyed 28 intertidal profiles and closely examined the nature and history of the backshore deposits. Platforms typically range in width from 40 m to more than 500 m with the largest ones occurring at the north-eastern and south-western promontories of the peninsula. Many platforms are more than 100 m wide and all have a well developed low water cliff located just below low tide level. At most locations the inner margin of the platform is masked by either beach, lagoon, or hillslope deposits, or by combinations of these, so that the high water cliff is mainly fossil. There are only three locations at which the complete platform is exposed and the cliff-base is bare of covering deposits. The low tide cliff supports a dense growth of Bull Kelp (Durvillea antarctica) and other organisms, particularly along the eastern shore and the platforms are broken up by extensive channels along fault planes and other lines of structural weakness.
Duckmanton identified five principal morphological types of platform dependent upon rock type and exposure: sheltered bay platforms in mudstone or in limestone, exposed point platforms in each rock type, and an intermediate group. The exposed point platforms were found to be widest irrespective of rock type and in common with So (1965) and Trenhaile (1971 the highest platforms were associated with the greatest exposures.
In agreement with the distribution of wave energy discussed in the preceding section, platforms were found to be highest along the eastern shore, of intermediate height on the northern margin, and lowest along the southern portion of the peninsula. However, there is a great deal of variation
Geology-14
Dow
nloa
ded
by [
Ohi
o St
ate
Uni
vers
ity L
ibra
ries
] at
23:
33 0
6 D
ecem
ber
2014
15
0
L
I 2
5G
l
<V
I T
IDA
L
DIS
TR
IBU
TIO
N
• ,oot-
bkL
I
j : : : :
] --
----
r-~
'00
eL
"F
a'M
Ll
MO
RP
HO
LOG
Y
...
1 ...
.. ,:::
:: ::
0·2
5
::E
0.7
5
Mea
n S
ea
0 L
evel
0·2
5
0·5
0
'" 0
·75
~
<V
::E
1.0
0
1·2
5
10
.. :: :4
0. :.
.:::::
50·
..
90
18
0
20
3
0
27
0
70
8
0
90
1·5
0
1·25
1·0
0
0·7
5
0·5
0
0·2
5
-, 3~5 d
ays·y
r 0
10
0%
0·2
5
0·5
0
0·7
5
1·0
0
1·2
5
VI
00 ~ z N ~ z >
t"
' o >,:j C')
t!1 o ~ >
Z
CI
C')
t!1 o ~ g
FIG
. 2
-Cu
mu
lati
ve
freq
uenc
y di
stri
buti
ons
of
shor
e pl
atfo
rm e
leva
tion
s fo
r th
e se
ven
prof
iles
and
for
tid
al o
bser
vati
ons
over
a 5
yea
r pe
riod
. B
oth
curv
es h
ave
been
tie
d by
sur
vey
to b
ench
mar
ks a
nd a
re p
roba
bly
accu
rate
to
wit
hin
+5
cm
of
elev
atio
n.
<!
o !"' tv
o
Dow
nloa
ded
by [
Ohi
o St
ate
Uni
vers
ity L
ibra
ries
] at
23:
33 0
6 D
ecem
ber
2014
No.3 KIRK - EROSION ON INTERTIDAL PLATFORMS 585
in elevation, reflecting the influences of lithology and structure, particularly in the east. Although a positive correlation was established between platform elevation and exposure to wave action (as measured by shallow water refraction coefficients), it was not possible to correlate morphologic variability with exposure.
More than 90% of the morphology measured occurred within ± 1.0 m of mean sea level and 57% lay between ±0·5 m. The mean elevation determined for all the platforms was +0·06 m and was associated with a standard deviation of 0·64 m. Mudstone platforms were found to have very gentle slopes, usually less than one degree, while the limestone displayed generally steeper slopes and much greater morphological variability owing to structural as well as lithological variations.
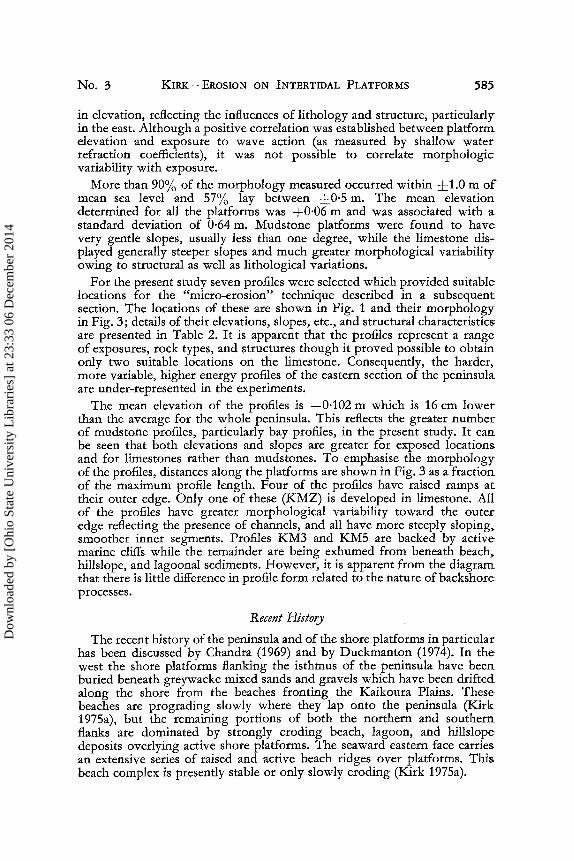
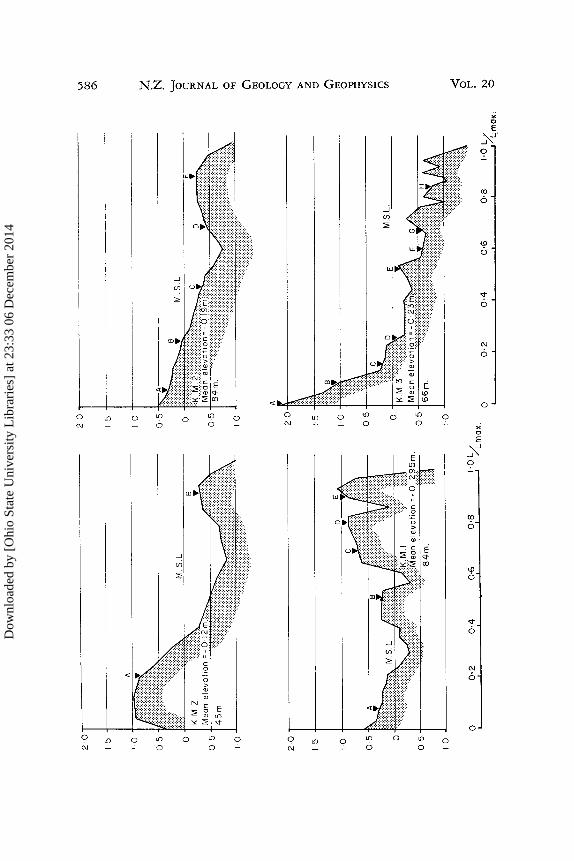
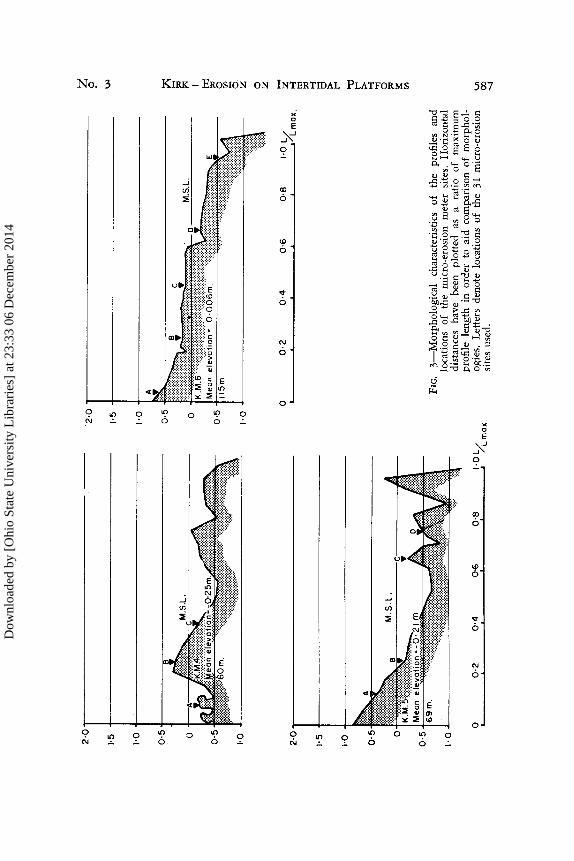
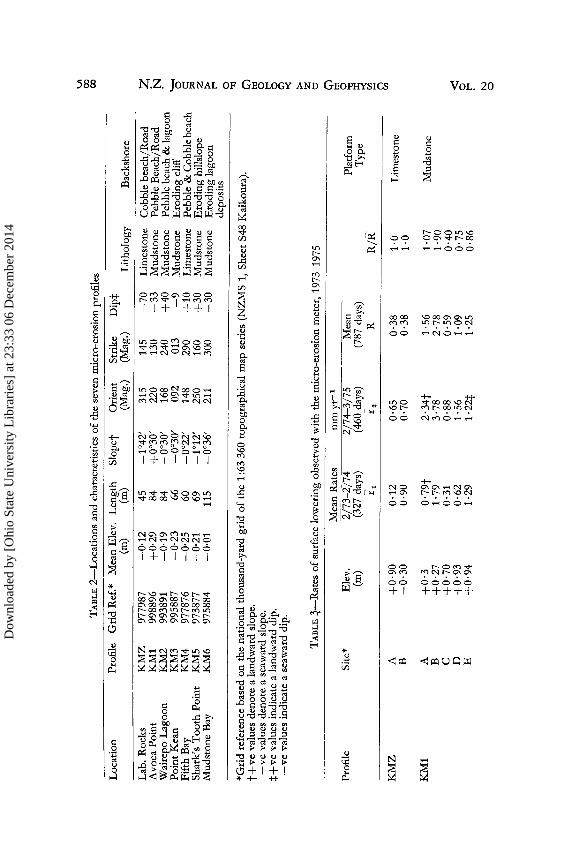
For the present study seven profiles were selected which provided suitable locations for the "micro-erosion" technique described in a subsequent section. The locations of these are shown in Fig. 1 and their morphology in Fig. 3; details of their elevations, slopes, etc., and structural characteristics: are presented in Table 2. It is apparent that the profiles represent a range of exposures, rock types, and structures though it proved possible to obtain only two suitable locations on the limestone. Consequently, the harder, more variable, higher energy profiles of the eastern section of the peninsula are under-represented in the experiments.
The mean elevation of the profiles is -0·102 m which is 16 cm lower than the average for the whole peninsula. This reflects the greater number of mudstone profiles, particularly bay profiles, in the present study. It can be seen that both elevations and slopes are greater for exposed locations and for limestones rather than mudstones. To emphasise the morphology of the profiles, distances along the platforms are shown in Fig. 3 as a fraction of the maximum profile length. Four of the profiles have raised ramps at their outer edge. Only one of these (KMZ) is developed in limestone. All of the profiles have greater morphological variability toward the outer edge reflecting the presence of channels, and all have more steeply sloping, smoother inner segments. Profiles KM3 and KM5 are backed by active marine cliffs while the remainder are being exhumed from beneath beach, hillslope, and lagoonal sediments. However, it is apparent from the diagram that there is little difference in profile form related to the nature of back shore processes.
Recent History
The recent history of the peninsula and of the shore platforms in particular has been discussed by Chandra (1969) and by Duckmanton (1974). In the west the shore platforms flanking the isthmus of the peninsula have been buried beneath greywacke mixed sands and gravels which have been drifted along the shore from the beaches fronting the Kaikoura Plains. These beaches are prograding slowly where they lap onto the peninsula (Kirk 1975a), but the remaining portions of both the northern and southern flanks are dominated by strongly eroding beach, lagoon, and hillslope deposits overlying active shore platforms. The seaward eastern face carries an extensive series of raised and active beach ridges over platforms. This beach complex is presently stable or only slowly eroding (Kirk 1975a).
Dow
nloa
ded
by [
Ohi
o St
ate
Uni
vers
ity L
ibra
ries
] at
23:
33 0
6 D
ecem
ber
2014
20
'
20
15
I
15
~:Pk
10
05
M.S
L
0 ). ~
10
20
,---------------------
2°1r~------------
15
+
-1
---------------
15
I\A
1
0 I
A..
1·0
I\!::::g
o
5 -f
.,.-
A
.§. --I
05
o o
5m
. 0
5 t-I----~~
10
~----------------
1·0 -'----------------"
? ~'
2 0
;4
0;6
0
i8
1,'0
Xma
x o
0·2
0
·4
0·6
0
'8
1·0
L/
L-----'---_
_ .l
-_
__
-'-_
__
_ .l
-_
__
...J'
/L.m
ax,
Vl
00
G\ z N ~ z :>
t'"
o "'l C)
tr1 o t'" o ~ :> z tJ
C)
tr1 o ~ Q F
N o
Dow
nloa
ded
by [
Ohi
o St
ate
Uni
vers
ity L
ibra
ries
] at
23:
33 0
6 D
ecem
ber
2014
2'0
'2
'0
1·5
1'5
1·0
,·0
0·5
0
·5
0 0
0·5
0
·5
"0
"0
2·0
T'-
--------------------------------
1'5 +
1--------------------
"0
+1
-------------------
0·5
o
O' 5
I _
_
. .,.((
((")))
:('
,·0
-'----------"
? ~'
2 0
;4
0'(
' 0
i8
'!.O
~mox
o 0
·2
0·4
0
·6
0·8
,·
0 Y
. L
-_
__
_L
__
__
__
__
~ _
__
__
_ _
L _
__
__
__
_ ~ _
__
__
_ ~I
Lm
ox
,
FIG
. 3
-Mo
rph
olo
gic
al
char
acte
rist
ics
of
the
prof
iles
an
d lo
cati
ons
of
the
mic
ro-e
rosi
on
met
er
site
s.
Hor
izon
tal
dist
ance
s ha
ve
been
pl
otte
d as
a
rati
o of
m
axim
um
prof
ile
leng
th i
n or
der
to a
id c
ompa
riso
n of
mor
phol
og
ies.
L
ette
rs d
enot
e lo
cati
ons
of
the
31 m
icro
-ero
sion
si
tes
used
.
t I,j>
~
~ I ~ [fJ o z o z ......
Z ...;
t%1 ~ ~ t""
"'C E
~ ~ [fJ
Ul co
-...J
Dow
nloa
ded
by [
Ohi
o St
ate
Uni
vers
ity L
ibra
ries
] at
23:
33 0
6 D
ecem
ber
2014
TAB
LE 2
-Lo
cati
on
s an
d ch
arac
teri
stic
s o
f th
e se
ven
mic
ro-e
rosi
on p
rofi
les
Loc
atio
n P
rofi
le
Gri
d R
ef. *
M
ean
Ele
v.
Len
gth
Slo
pet
Ori
ent
Str
ike
Dip
:j:
(m)
(m)
(Mag
.)
(Mag
.)
Lit
holo
gy
Bac
ksho
re
Lab
. R
ocks
K
MZ
97
7987
-0
·12
45
-1
°42
' 31
5 14
5 -7
0
Lim
esto
ne
Cob
ble
beac
h/R
oad
Avo
ca P
oint
K
Ml
9988
96
+0
·29
84
+
0°3
0'
220
130
-33
M
udst
one
Peb
ble
Bea
ch/R
oad
Wai
repo
Lag
oon
KM
2 99
3891
-0
,19
84
-0
°30
' 16
8 24
0 +
40
M
udst
one
Peb
ble
beac
h &
la
goon
P
oint
Kea
n K
M3
9958
87
-0,2
3
66
-0°3
0'
092
013
-9
M
udst
one
Ero
ding
clif
f F
ifth
Bay
K
M4
9778
76
-0,2
5
60
-0°2
2'
148
290
+1
0
Lim
esto
ne
Peb
ble
& C
obbl
e be
ach
Sha
rk's
To
oth
Poi
nt
KM
5 97
3877
-0
·21
69
-1
°12
' 25
0 16
0 +
30
M
udst
one
Ero
ding
hil
lslo
pe
Mud
ston
e B
ay
KM
6 97
5884
-0
·01
11
5 -0
°36
' 21
1 30
0 -3
0
Mud
ston
e E
rodi
ng l
agoo
n de
posi
ts
*Gri
d re
fere
nce
base
d o
n t
he n
atio
nal
thou
sand
-yar
d gr
id o
f th
e 1
:633
60 t
opog
raph
ical
map
ser
ies
(NZ
MS
1,
She
et S
48 K
aiko
ura)
. t+
ve v
alue
s de
note
a l
andw
ard
slop
e.
-ve v
alue
s de
note
a s
eaw
ard
slop
e.
:f:+
ve v
alue
s in
dica
te a
lan
dwar
d di
p.
-ve v
alue
s in
dica
te a
sea
war
d di
p.
TAB
LE ~-Rates o
f su
rfac
e lo
wer
ing
obse
rved
wit
h th
e m
icro
-ero
sion
met
er,
1973
-197
5
Mea
n R
ates
m
m y
r-1
Pro
file
Si
te*
Ele
v.
2/7
3-2
/74
2
/74
-3/7
5
Mea
n P
latf
orm
(m
) (3
27.cla
ys)
(46O
_day
s)
(787
day
s)
Typ
e r
1 r
2 R
R
/R
KM
Z
A
+0
·90
0
·12
0·
65
0·3
8
1·0
L
imes
tone
B
-0
·30
0
·90
0
·70
0
·38
1
·0
KM
l A
+
0·3
0
·79
t 2
·34
t 1
·56
1
·07
M
udst
one
B
+0
·27
1
·79
3
·78
2
·78
1
·90
C
+
0·7
0
0·31
0
·88
0
·59
0
·40
D
+
0·9
3
0·6
2
1·5
6
1·0
9
0·75
E
+
0·9
4
1·2
9
1·22
:j:
1·25
0
·86
VI
(Xl
(Xl z N
'0' ~ z > t'"
o "'1 ~ o ~ > Z
t:t ~ o :E ;;i 1;i ~ !'"
N o
Dow
nloa
ded
by [
Ohi
o St
ate
Uni
vers
ity L
ibra
ries
] at
23:
33 0
6 D
ecem
ber
2014

z ~ K
M2
A
+0
·38
5·
61
6·10
5
·84
2
·40
M
udst
one
Ij>
B
+0
·06
1·
01
1·45
1
·23
0·
49
C
-0·3
5
0·6
3t
1·5
8t
1·10
0
·44
D
-0
·45
1·
43
1·3
9t
1·41
0
·56
E
-0
·21
2
·93
2
·86
t 2·
98
1·1
6
KM
3 A
+
2·1
0
3·5
9
1·56
§ 2
·57
2·
25
Mud
ston
e ~
iiJ B
+
1·0
5
1·4
4
1·21
§ 1·
32
1·16
;>:
:
C
+0
·20
0·
09
1·73
0·
91
0·79
I
D
-0·1
3
No
dat
a (v
anda
lism
of
site
) tT
j
E
-0·2
0
0·3
0
0·67
0·
49
0·43
~
F -0
·58
0·
97
0·99
0·
98
0·86
";
/)
G
-0·5
2
0·53
2·
03
1·28
1
·12
S
H
-0·6
7
0·0
4
0·85
0·
44
0·38
Z
0
KM
4 A
-0
·27
0
·44
t 1·
59:j:
1·
01
0·75
L
imes
tone
Z
B
+0
·27
0·
76
0·26
0·
51
0·38
.....
. Z
C
-0
·15
4
·68
0·
35*
2·5
2
1·8
7
Jooi
tl1
KM
5 A
+
0·4
7
1·8
0
0·23
* 1·
01
1·58
M
udst
one
~ B
-0
·18
0·
39
0·95
0·
67
1·05
~
C
-0·2
0
0·15
0·
55
0·35
0·
55
t-<
D
-0·5
0
0·93
0·
11
0·5
2
0·81
'"C
j t-<
K
M6
A
+0
·61
8
·05
6
·0
7·03
2
·92
M
udst
one
>
Jooi
B
+0
·19
0
·64
1·
54
1·09
0·
45
>:j
C
+0
·18
1
·25
1
·16
1·
21
0·5
0
0 ~
D
-0·1
3
1·18
1
·64
1
·42
0·
59
s:: E
-0
·52
1
·34
1
·23
t 1·
31
0·5
4
en
*The
sit
e le
tter
s ar
e as
sho
wn
in F
ig.
3.
tDen
otes
a s
ite
at w
hich
for
som
e pa
rt o
f th
e ti
me
only
tw
o o
f th
e th
ree
poss
ible
rea
ding
s w
ere
obta
ined
. :j:
Den
otes
a s
ite
whe
re o
nly
one
of
thre
e re
adin
gs w
ere
obta
ined
. §I
ndic
ates
a s
ite
dam
aged
dur
ing
the
two
year
s.
VI
00
\0
Dow
nloa
ded
by [
Ohi
o St
ate
Uni
vers
ity L
ibra
ries
] at
23:
33 0
6 D
ecem
ber
2014
590 N.Z. JOURNAL OF GEOLOGY AND GEOPHYSICS VOL. 20
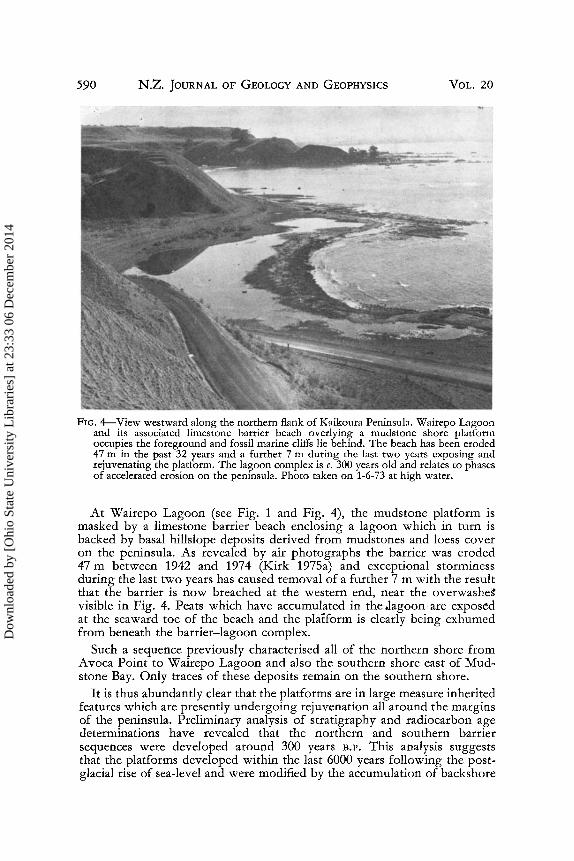
FIG. 4-View westward along the northern flank of Kaikoura Peninsula. Wairepo Lagoon and its associated limestone barrier beach overlying a mudstone shore platform occupies the foreground and fossil marine cliffs lie behind. The beach has been eroded 47 m in the past 32 years and a further 7 m during the last two years exposing and rejuvenating the platform. The lagoon complex is c. 300 years old and relates to phases of accelerated erosion on the peninsula. Photo taken on 1-6-73 at high water.
At Wairepo Lagoon (see Fig. 1 and Fig. 4), the mudstone platform is masked by a limestone barrier beach enclosing a lagoon which in turn is backed by basal hillslope deposits derived from mudstones and loess cover on the peninsula. As revealed by air photographs the barrier was eroded 47 m between 1942 and 1974 (Kirk 1975a) and exceptional storminess during the last two years has caused removal of a further 7 m with the result that the barrier is now breached at the western end, near the overwashe~ visible in Fig. 4. Peats which have accumulated in the .lagoon are exposed at the seaward toe of the beach and the platform is clearly being exhumed from beneath the barrier-lagoon complex.
Such a sequence previously characterised all of the northern shore from Avoca Point to Wairepo Lagoon and also the southern shore east of Mudstone Bay. Only traces of these deposits remain on the southern shore.
It is thus abundantly clear that the platforms are in large measure inherited features which are presently undergoing rejuvenation all around the margins of the peninsula. Preliminary analysis of stratigraphy and radiocarbon age determinations have revealed that the northern and southern barrier sequences were developed around 300 years B.P. This analysis suggests that the platforms developed within the last 6000 years following the postglacial rise of sea-level and were modified by the accumulation of backshore
Dow
nloa
ded
by [
Ohi
o St
ate
Uni
vers
ity L
ibra
ries
] at
23:
33 0
6 D
ecem
ber
2014
No.3 KIRK - EROSION ON INTERTIDAL PLATFORMS 591
deposits during the last 600-1000 years; this fossilised the inner portions and the marine cliffs. The accumulation phase followed tectonic uplift of less than 2 m and the supply of materials may have been augmented by cultural devegetation of the peninsula. A further erosional phase, possibly cultural in origin, with consequent input of gravels to the intertidal zone occurred about 300 years B.P. and this mantled some of the earlier limestone beach gravels with hillslope deposits. Most of these covering deposits are presently erosional and, as has been described, in a few locations the platforms are completely rejuvenated so that the marine cliff is again active. Details of the recession rates in these cliffs and back shore deposits determined by Kirk (1975a) will be presented later.
From the above discussion it should be clear that the Kaikoura Peninsula presents an interesting and variable assemblage of dominantly intertidal shore platforms with a complex history. The environment is a high energy one in terms of wave energy, and sub-aerial weathering potential is considerable. There has been sufficient detailed study of both processes and Recent history in the area to attempt a quantitative analysis of platform genesis. Elevation and morphology appear to reflect contemporary processes, particularly exposure to wave action and tidal range. This is in spite of structural and lithologic variations and the clearly inherited nature of at least the inner margins of the platforms. A number of points of agreement with the literature have already been demonstrated but it remains to examine quantitatively how these changes have come about, the manner in which platform development is now proceeding, the rates of contemporary activity, and the level or levels to which processes are adjusted.
EXPERIMENTAL PROCEDURES
The first notable success in measuring erosion rates on shore platforms was achieved by Emery (1941) who recorded the recession rates of dated inscriptions on cliffs and by Hodgson (1964) who used plaster casts and steel pins. Other rates of erosion have been determined by the authors listed in Table 1 for bioerosion and chemical solution and by Trudgill (pers. comm. 1976) and Robinson (pers. comm. 1974) who used the same technique as that described below.
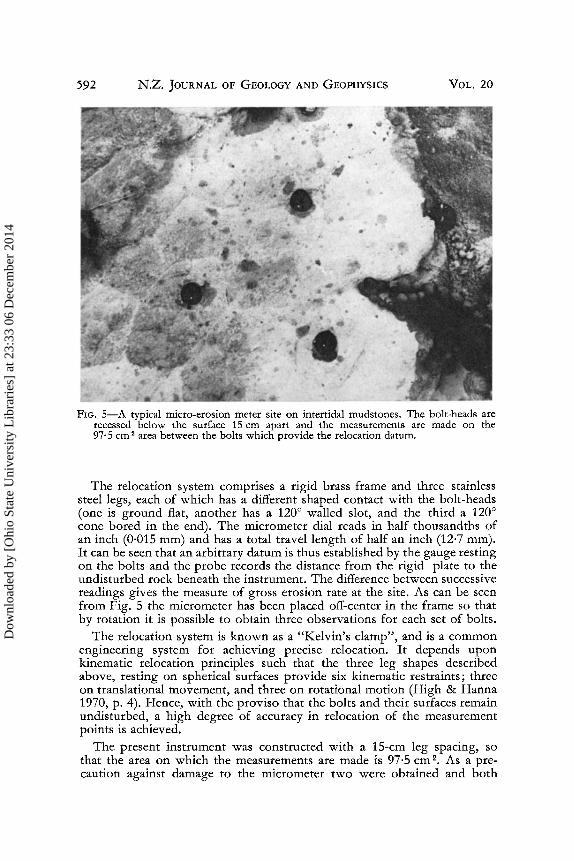
High & Hanna (1970) who developed the "micro-erosion meter" method chosen for this study have noted that in general it is difficult to devise techniques suitable for measurement of relatively slow processes over the geomorphologically short period of months or years. Their method, which partially fulfils this requirement, was originally developed for determining solution rates in karst landforms but has many other applications. It involves setting steel expansion bolts in the rock surface and making periodic measurements of surface lowering on the undisturbed area between the bolts with a "micro-erosion meter" which comprises a rigid frame for accurately relocating the device, and a dial-indicating micrometer. The bolts, which have hemispherical heads, are inserted in an equilateral triangular pattern and the heads are recessed below the rock surface as can be seen from Fig. 5. Figure 6 shows the micro-erosion meter used in this study in position for measurement on a set of bolts.
Dow
nloa
ded
by [
Ohi
o St
ate
Uni
vers
ity L
ibra
ries
] at
23:
33 0
6 D
ecem
ber
2014
.592 N.Z. JOURNAL OF GEOLOGY AND GEOPHYSICS VOL. 20
FIG. 5-A typical micro-erosion meter site on intertidal mudstones. The bolt-heads are recessed below the surface 15 em apart and the measurements are made on the 97· 5 em 2 area between the bolts which provide the relocation datum.
The relocation system comprises a rigid brass frame and three stainless steel legs, each of which has a different shaped contact with the bolt-heads (one is ground flat, another has a 1200 walled slot, and the third a 1200
cone bored in the end). The micrometer dial reads in half thousandths of an inch (0·015 mm) and has a total travel length of half an inch (12·7 mm). It can be seen that an arbitrary datum is thus established by the gauge resting on the bolts and the probe records the distance from the rigid plate to the undisturbed rock beneath the instrument. The difference between successive readings gives the measure of gross erosion rate at the site. As can be seen from Fig. S the micrometer has been placed off-center in the frame so that by rotation it is possible to obtain three observations for each set of bolts.
The relocation system is known as a "Kelvin's clamp", and is a common engineering system for achieving precise relocation. It depends upon kinematic relocation principles such that the three leg shapes described above, resting on spherical surfaces provide six kinematic restraints; three on translational movement, and three on rotational motion (High & Hanna 1970, p. 4). Hence, with the proviso that the bolts and their surfaces remain undisturbed, a high degree of accuracy in relocation of the measurement points is achieved.
The present instrument was constructed with a lS-cm leg spacing, so that the area on which the measurements are made is 97·5 cm 2. As a precaution against damage to the micrometer two were obtained and both
Dow
nloa
ded
by [
Ohi
o St
ate
Uni
vers
ity L
ibra
ries
] at
23:
33 0
6 D
ecem
ber
2014

No.3 KIRK - EROSION ON INTERTIDAL PLATFORMS 593
FIG. 6-Micro-erosion meter in place on a mudstone site. The dial-test-micrometer is mounted off-centre in the frame to provide three observations per site by rotation of the instrument. The gauge is provided with a lifter to avoid damage to the probe and the rock surface during placement. Scale interval: 5 cm.
were used on the first survey so that at any time the gauge could be replaced without loss of continuity in the observations. A calibration plate was also constructed so that the gauge and frame characteristics could be checked before each set of field measurements.
The bolts employed were of two types. Initially standard "Rawl Plugs" having half inch (12·7 mm) diameter expansion cases and containing ts in (8 mm) steel bolts were used. The head of each bolt was drilled and a stainless steel ball-bearing was glued on with heat-cured "Araldite" to provide the gauge resting points. While some of these bolts are still in service more than three years after installation, most have either been vandalised or the ball-bearing has broken free of the glue bond. Most of these have been replaced with bolts cut from a single length of i in (9·52 mm) marine grade stainless steel on which a thread and a hemispherical head have been turned. The bolt was completed by the addition of a stainless steel nut coated with a thread bonding compound, and a washer. These have proven excellent in operation and have been screwed into the ordinary steel "Rawl Plugs", already installed in the shore platforms. The plugs are 5 em long.
Some difficulty was experienced in finding near-horizontal sites for the bolt sets, as required by the technique, particularly on the limestones. This factor more than any other governed the choice of the sites shown in Fig. 1
Dow
nloa
ded
by [
Ohi
o St
ate
Uni
vers
ity L
ibra
ries
] at
23:
33 0
6 D
ecem
ber
2014

594 N.Z. JOURNAL OF GEOLOGY AND GEOPHYSICS VOL. 20
and led to the deficiency in representation for limestone profiles and in sites along the intensely folded eastern face of the peninsula.
A total of 32 sets of bolts were installed on the seven profiles. Their distribution with respect to profiles and elevation is shown in Fig. 3 and in Table 3. From Fig. 3 it can be seen that the sites span the platforms from slightly below mean low water level to well above high water level with 16 sites below mean sea level and five below -0·5 m in the semipermanently covered zone. Seven sites were emplaced above +0·5 m in the zone of predominantly sub-aerial weathering so that it is felt a good coverage of process zones was achieved. One site, D on profile KM3, was extensively vandalised shortly after installation and so the subsequent measurements were made on only 31 sites.
Following installation of the bolts each profile was surveyed using a "Quickset Level" and metric staff. The profiles were then tied by lateral survey to a series of bench marks around the peninsula so that the elevations of the bolt sites shown in Fig. 3 and Table 3 are thought to be accurate to within ±S cm. This procedure also permitted correction of the elevations with respect to the tide curve derived from Kirk (1976) which is shown in Fig. 2.
The bolt sets were read at about two monthly intervals from February 1973 until March 1975. It is these data which will now be presented and discussed. The experiment is continuing but the frequency of observation has been reduced to twice a year.
RESULTS
Average lowering rates for each of the two years and for the whole period are presented in Table 3 while the averages for each profile and the annual weighted means are presented in Table 4. The latter figures have been weighted to allow for the variable numbers of sites per profile. These data are based on 672 successful observations of changes in surface elevation and represent a 60·2% efficiency in sampling the total possible 1116 observations. The most frequent causes of inability to record a surface change, in decreasing order of occurrence, were temporary loss of a site beneath sediment or algal cover, surface lowering beyond the span of the micrometer probe (which was overcome by use of extensions to the anvil on the probe), breakdown of bolts of the initial type, and vandalism of one or more of the bolts. The Kaikoura Peninsula is a popular recreation area so that vandalism was unavoidable even though the sites were chosen to be as inconspicuous as possible.
It can be seen from Table 3 that there was a wide variation in average lowering rates between and within profiles, and between the two years. As can be seen, maximum mean lowering rate for the two years was 7·03 mm ye i which occurred on mudstones immediately adjacent to an eroding backshore deposit in the high energy southern zone at Mudstone Bay (see Fig. 1). High rates were also observed in a similar situation on profile KM2 at Wairepo Lagoon on the north coast. Significantly, rates of lowering immediately adjacent to the active marine cliff at KM3 were lower (2·57 mm ye i
).
Dow
nloa
ded
by [
Ohi
o St
ate
Uni
vers
ity L
ibra
ries
] at
23:
33 0
6 D
ecem
ber
2014

No.3 KIRK - EROSION ON INTERTIDAL PLATFORMS 595
TABLE 4-Average rates of surface lowering for individual profiles, for the study years, and for the period as a whole-1973-1975
Profile No. of Sites Mean Mean Mean (1973-1974) (1974--1975) 1973-1975
mmyr-l mmyr-l mm yr- l
KMZ 2 0·10 0·67 0·38 KM1 5 0·96 1·96 1-46 KM2 5 2·32 2·68 2·50 KM3 7 0·99 1·29 1·14 KM4 3 1·96 0·73 1·35 KM5 4 0·82 0·46 0·64 KM6 5 2·49 2·32 2·41
Grand mean, 1973-1975 = 1·53 mm yr- l
Minimum mean rates of 0·38 mm ye i were recorded on the limestones of the north coast at KMZ. This value probably does not reflect an accurate rate of lowering for this profile since the tightly folded and shattered limestones at this site frequently shed blocks and plates of rock, one of which rendered the upper site inoperative during the later stages of the study.
Table 4 confirms that the highest average rates for profiles occurred adjacent to eroding backshore deposits in Mudstone Bay and at Wairepo Lagoon and that the grand mean lowering rate for the intertidal zone as a whole was 1·53 mm ye i with little variation between the two years. The standard deviation was 1·45 mm.
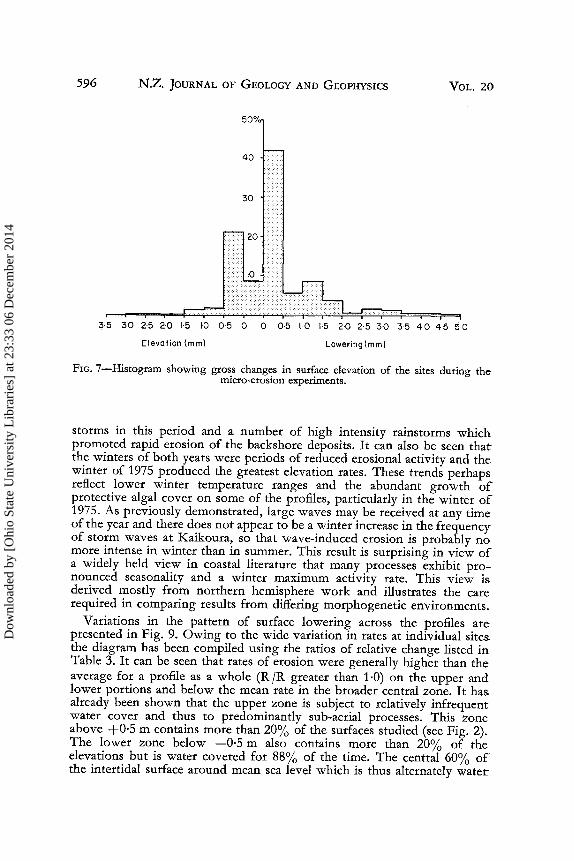
Figure 7 presents a histogram of the gross survey observations, which shows that the distribution of lowering rates is strongly positively skewed. Robinson (1976) first drew attention to this characteristic of intertidal erosion rates and stated that it precludes the use of parametric statistical tests for comparing data sets.
The diagram shows that the surface did not always lower between surveys and that elevations of the surface having a mode of 0-0·5 mm and a maximum of 3·0 mm were occasionally observed. These changes were caused by growth of algae on some sites, and by swelling of mudstone surfaces consequent upon wetting. Algal growths were common on the southern profiles (KMS, KM6) during the winter and coralline algae affected two low water sites (KM3H and KM4C).
It can be seen that the surface lowering rates have an elongated distribution with a dominant mode at 0-0·5 mm, a minor mode at 1·0-1·5 mm, and a maximum of 5·0 mm. The principal mode appears to represent granular disintegration of the rock surface on both the limestone and the mudstone, while the secondary mode and the tail represent flaking and chipping of the mudstone surface. The major process responsible for flaking appeared to be wetting and drying as described by Wentworth (1938).
Figure 8 indicates the variation in both surface lowering rates and elevation rates during the two years, from which it is clear that the maximum erosion occurred in the summer and winter of 1974. There were numerous
Dow
nloa
ded
by [
Ohi
o St
ate
Uni
vers
ity L
ibra
ries
] at
23:
33 0
6 D
ecem
ber
2014
596 N.Z. JOURNAL OF GEOLOGY AND GEOPHYSICS VOL. 20
3·5 3·0 2·5 2·0 1·5 1·0 0·5 0 0 0·5 1·0 1·5 2·0 2·5 3·0 3·5 4·0 4·5 5·0
Elevation (mm) Lowering (mm)
FIG. 7-Histogram showing gross changes in surface elevation of the sites during the micro-erosion experiments.
storms in this period and a number of high intensity rainstorms which promoted rapid erosion of the back shore deposits. It can also be seen that the winters of both years were periods of reduced erosional activity and the winter of 1975 produced the greatest elevation rates. These trends perhaps reflect lower winter temperature ranges and the abundant growth of protective algal cover on some of the profiles, particularly in the winter of 1975. As previously demonstrated, large waves may be received at any time of the year and there does not appear to be a winter increase in the frequency of storm waves at Kaikoura, so that wave-induced erosion is probably no more intense in winter than in summer. This result is surprising in view of a widely held view in coastal literature that many processes exhibit pronounced seasonality and a winter maximum activity rate. This view is. derived mostly from northern hemisphere work and illustrates the care required in comparing results from differing morphogenetic environments.
Variations in the pattern of surface lowering across the profiles are presented in Fig. 9. Owing to the wide variation in rates at individual sites. the diagram has been compiled using the ratios of relative change listed in Table 3. It can be seen that rates of erosion were generally higher than the average for a profile as a whole (R jR greater than 1·0) on the upper and lower portions and below the mean rate in the broader central zone. It has. already been shown that the upper zone is subject to relatively infrequent water cover and thus to predominantly sub-aerial processes. This zone above +0·5 m contains more than 20% of the surfaces studied (see Fig. 2). The lower zone below -0·5 m also contains more than 20% of the elevations but is water covered for 88% of the time. The central 60% of the intertidal surface around mean sea level which is thus alternately water-
Dow
nloa
ded
by [
Ohi
o St
ate
Uni
vers
ity L
ibra
ries
] at
23:
33 0
6 D
ecem
ber
2014
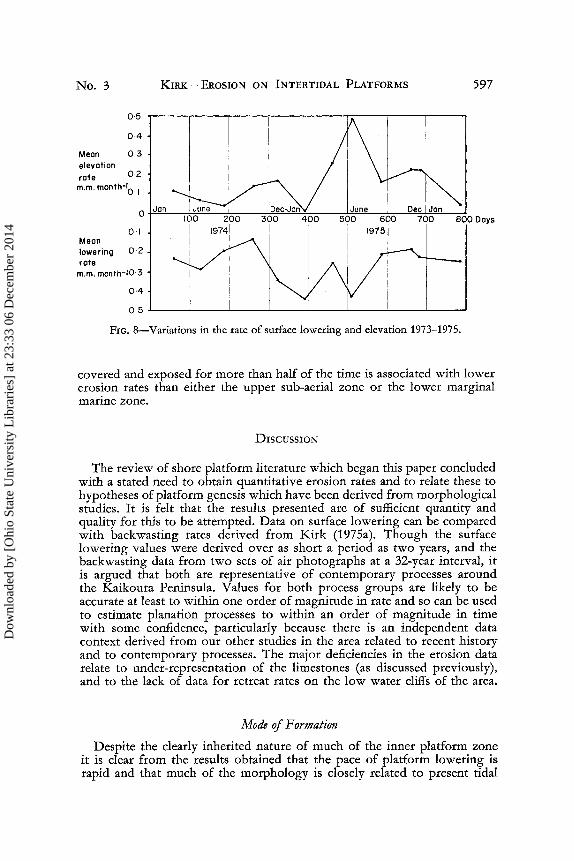
No.3 KIRK - EROSION ON INTERTIDAL PLATFORMS 597
05,---.,.---,..---..----,.----,...,.---,.----.,.----,
0-4
Mean 0·3 elevation rate 02
m.m. month-Io. I
o Jan
0·1 Mean lowering 0·2 rate
m.m. month-10'3
004
FIG. 8-Variations in the rate of surface lowering and elevation 1973-1975.
covered and exposed for more than half of the time is associated with lower erosion rates than either the upper sub-aerial zone or the lower marginal marine zone.
DISCUSSION
The review of shore platform literature which began this paper concluded with a stated need to obtain quantitative erosion rates and to relate these to hypotheses of platform genesis which have been derived from morphological studies. It is felt that the results presented are of sufficient quantity and quality for this to be attempted. Data on surface lowering can be compared with backwasting rates derived from Kirk (1975a). Though the surface lowering values were derived over as short a period as two years, and the backwasting data from two sets of air photographs at a 32-year interval, it is argued that both are representative of contemporary processes around the Kaikoura Peninsula. Values for both process groups are likely to be accurate at least to within one order of magnitude in rate and so can be used to estimate planation processes to within an order of magnitude in time with some confidence, particularly because there is an independent data context derived from our other studies in the area related to recent history and to contemporary processes. The major deficiencies in the erosion data relate to under-representation of the limestones (as discussed previously), and to the lack of data for retreat rates on the low water cliffs of the area.
Mode of Formation
Despite the clearly inherited nature of much of the inner platform zone it is clear from the results obtained that the pace of platform lowering is rapid and that much of the morphology is closely related to present tidal
Dow
nloa
ded
by [
Ohi
o St
ate
Uni
vers
ity L
ibra
ries
] at
23:
33 0
6 D
ecem
ber
2014
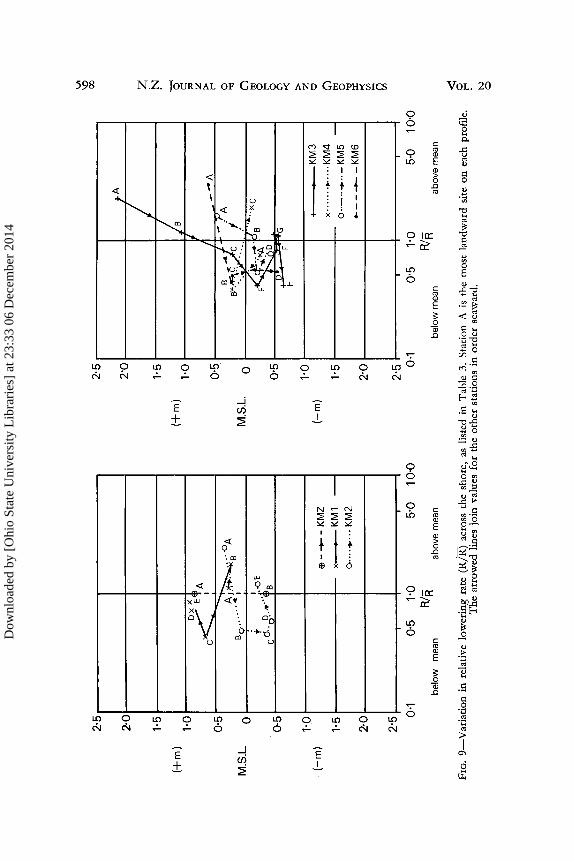
(+m
)
M.S
.L.
(-m
)
2·5
2·0
1-5
1·0
0·5 0
:<~EA
c I
~ ..
. oA
Bo ...
.. ··
4 I
B
0·5
t I.
·OE
cd
.. J.
..• ···
B
1·0
Ell -
__
-K
MZ
1·5
x_
KM
l
o···
·· ..
···K
M2
2·0
2·5 0·
1 0·
5 1·
0 R/
R 5·
0
belo
w
mea
n ab
ove
mea
n
(+m
)
M.S
.L.
(-m
)
-- 10·0
2·5
2·0
1·5
1·0
0·5 0 0·5
1·0
1·5
2·0
2·5 0·
1
fA
I Is fI / --A
B~.
-/A
8"
' .. :"'\
(:.
c l
..•...
...
E~-+·
E
·';:~~
D ~B"'·"C
tI
F
G
+
I K
M3
x··
····
· .. ·
···K
M4
-
o··_
·· ...
··-K
M5
0----"-
-KM
6
0·5
1·0
R/R
5·0
10·0
belo
w m
ean
abov
e m
ean
FIG
. 9
-Var
iati
on
in
rel
ativ
e lo
wer
ing
rate
(R
/R)
acro
ss t
he s
hore
, as
lis
ted
in T
able
3.
Sta
tion
A i
s th
e m
ost
land
war
d si
te o
n e
ach
prof
ile.
T
he
arro
wed
lin
es j
oin
valu
es f
or t
he o
ther
sta
tion
s in
ord
er s
eaw
ard.
VI
\0
(Xl z N f z :>
r o >
rj o tTl o ~ :> z I;:
) ~ o ~ Q
~ r N o
Dow
nloa
ded
by [
Ohi
o St
ate
Uni
vers
ity L
ibra
ries
] at
23:
33 0
6 D
ecem
ber
2014

No.3 KIRK - EROSION ON INTERTIDAL PLATFORMS 599
TABLE 5-Results of Mann-Whitney U tests on the relationship between erosion rates and rock types; "exposure" to wave action and relative abundance of abrasion materials
Calc Critical Significance Data Group N U U 2 p at 0·01
Limestone 5 96 v. 1-665 0·0475 Not Significant
Mudstone 26 34
North Side 12 47 v. 24 Not Significant
East 10 73
East 10 48'5 v. 16 Not Significant
South 9 41·5
South 9 64·5 v. 21 Not Significant
North 12 43·5
Eroding backshore 14 91 v. 77 Not Significant
Stable sites 17 147
Computations were performed according to Siegel (1956, pp. 116-124). Tests of significanee are based on "2" scores for N larger than 20 and on "U" for smaller data sets.
range and pattern. It will also be recalled that Duckmanton (1974) demonstrated a positive correlation between platform elevation and exposure to wave action. Thus point platforms are, in general, higher than those in bays. However, the pattern is complicated by lithology because platform elevations are lowest on the high energy southern coast, intermediate along the less exposed northern shore (both of these shore zones being composed of mudstone), and highest along the limestone-dominated, very exposed eastern margin of the Peninsula. A high degree of individual profile variation was ascribed to the influences of lithology and structure, especially on the limestones.
In order to determine whether these morphological relationships are reflected in erosion rates the series of Mann-Whitney "U" tests shown in Table 5 were carried out. This test is non-parametric and so is suitable for skewed data distributions such as those of the present study. Comparisons were made between rock types, exposures to wave energy, and between profiles backed by eroding cover deposits and those with a more stable backshore. As can be seen from the table there was no statistically significant result (p = 0·01). This is a particularly important set of results because it demonstrates that morphological relationships are not necessarily directly reflected in patterns of erosion rates. These results also militate against exposure to wave action as the single major determinant of both morphology and erosion rates.
It should also be noted that Table 5 shows no significant difference in lowering rates between limestone and mudstone lithologies. However, the
Geology-I 5
Dow
nloa
ded
by [
Ohi
o St
ate
Uni
vers
ity L
ibra
ries
] at
23:
33 0
6 D
ecem
ber
2014
600 N.Z. JOURNAL OF GEOLOGY AND GEOPHYSICS VOL. 20
technique measures granular and small chip disintegration only and it is likely that larger fragments up to block size are released from the limestones, so that this result must be viewed with caution.
In terms of the alternative hypotheses of platform development presented in the initial review (i.e., sub-aerially weathered or wave-quarried), it has already been shown that the intertidal portion of the Kaikoura platforms consists of three zones defined by surface lowering rates: upper and lower zones of more rapid activity, and a broader central area eroding relatively less rapidly. The upper zones are subject to sub-aerial processes of weathering, to salt water wetting and drying, and to active abrasion by removal of backshore covering strata. The lowermost sections of all the profiles are water-covered 88% of the time and are thus more subject to more intense wave action and to preferential erosion by biological agencies than are higher elevations. Since many of the platforms are channelled in the middle and lower zones, the central portions of the profiles are probably subject to wetting and drying and to a more confined movement of erosion products than the upper zone. Therefore it is hypothesised that the central zones mark a transition from an upper zone of sub-aerial weathering and more intense mechanical erosion, to a lower zone of similarly intense marine-dominated processes, principally wave action and bio-erosion. If this interpretation is correct, the central reaches of the platforms can be regarded as zones of less intense lowering by pan formation and water-layer weathering on the areas between channels. It is suggested that such a composite mode of formation can also account for the lack of correspondence between erosion rates and exposure to wave action despite the morphological correlation. While wave energy levels vary around the peninsula it is likely that sub-aerial weathering rates and abrasion by release of rather uniform limestone gravels from backshore deposits, are similar at most points.
The hypothesis proposed suggests the possibility of at least two levels of planation related to contemporary process, an upper weathering-induced level which grades seaward into a less rapidly eroding zone, and a lower, 11;l.ore frequently wave-worked level which intersects the low water cliff slightly below mean low water mark. Ultimately the action of such a combination of processes should lead to a seaward sloping platform graded to low water level as proposed by Gill (1972). The resulting surface would have an elevational range related to tide range and degree of exposure to wave energy.
It should also be mentioned that while the above hypothesis is advanced for both the limestones and the mudstones, the morphology is more clearly defined on the more massive mudstone than on the harder, folded and shattered limestones.
In view of these findings it seems wise to conclude that neither wave action, nor subaerial processes dominate shore platform development at Kaikoura but that there is a gradient across the shore from a subaerial complex at the landward edge to a marine complex near the low tide cliff. At least for Kaikoura these complexes have approximately equal erosion rates and the transition between is associated with lower rates. It seems likely that this hypothesis will have wider application to platforms in other
Dow
nloa
ded
by [
Ohi
o St
ate
Uni
vers
ity L
ibra
ries
] at
23:
33 0
6 D
ecem
ber
2014
No.3 KIRK - EROSION ON INTERTIDAL PLATFORMS 601
environments and in other lithologies. For example, So (1965), Trenhaile (1972), and Hills (1972) have all reported a tendency toward flattening of the {;entral portions of shore platforms.
Planation Rate and Indicated Ages
Table 4 shows that the grand mean lowering rates for Kaikoura (1·53 mm ye I ), are intermediate values in the range reviewed in Table 1 (0·1-35 mm ye I ). Average backwasting rates for the Kaikoura Peninsula range from {)·8-1·49 myel for unconsolidated deposits, and 0·24-0·33 myel for active mudstone cliffs (Kirk 1975a, table 3, p. 797). Thus, maximum backwasting rates are between one and two orders of magnitude greater than lowering rates.
The data also demonstrate quite clearly that shore platform development at Kaikoura, as elsewhere, can be a geologically rapid phenomenon. In agreement with earlier studies, platform lowering is particularly rapid where there is an abundant supply of abrasional material, as at Wairepo Lagoon and Mudstone Bay where the maximum rates occurred. However, the last Mann-Whitney test in Table 5 shows that enhanced rates do not characterise the profile as a whole. This result tends to confirm the role of sub-aerial weathering in addition to abrasion as the formative influence on the upper profile and to minimise the influence of abrasion by erosion products on the lower profile except within channel systems.
As previously discussed, it has been argued that shore platforms should develop essentially by parallel retreat of a marine cliff above a gently sloping and slowly lowering intertidal surface. The parallel retreat model thus provides a simple means of further assessing morphological development and, as will be demonstrated shortly, a way of estimating planation ages. The equation for this model was also applied by Trenhaile (1974b) who used estimates of backwasting rates, derived from old photographs and surveys for 820 profiles on the coasts of England and Wales, and platform gradients to calculate estimates of lowering rates. For chalk it was found that lowering rates were typically about 2% or backwasting rates while for Lias sediments the proportion rose to approximately 5%.
The parallel retreat model takes the form:
dD=dW - - .tana dt dt
where dD is the increment of surface lowering in time dt, dW is the increment of cliff backwasting in time dt and a is the platform gradient (Trenhaile 1974b, p. 139). The model is presented graphically in Fig. 10 and has been applied to the Kaikoura platforms using the values in Table 6. For the present study estimates of dD are provided by the micro-erosion data and values of dW are derived from the air-photograph analysis (Kirk 1975a). For the air photography data dt is thus 32 years. Since platform gradient is also known (Table 6) it is possible to test the applicability of the model by comparing measured values of dW and estimates predicted by the model. As can be seen from Fig. lOB the overall agreement is rather poor which
Dow
nloa
ded
by [
Ohi
o St
ate
Uni
vers
ity L
ibra
ries
] at
23:
33 0
6 D
ecem
ber
2014

602 N.Z. JOURNAL OF GEOLOGY AND GEOPHYSICS VOL. 20
is not surprising in view of the inherited nature of the inner margins of the platforms. It will be recalled that Trenhaile's platforms also contained a significant proportion of inherited morphology.
However, the diagram shows reasonable agreement between field estimates and the model for profiles KMZ, KM2, KM3 and KM5. It should be noted that KM3 and KM5 are the only two profiles backed by active marine cliffs and KM2 has the highest rates of backshore erosion. Of the remaining profiles, KMl has a concrete retaining wall at the inner edge and KM4 occurs below a stable limestone beach. Profile KM6 has rapidly eroding backshore deposits and has a very low angle of slope. It is also a bay-floor profile. This measure of agreement was deemed to be sufficient to persist with the analysis.
Figure 10C shows a good logarithmic rather than a linear relationship between measured lowering rates and calculated backwasting rates (r = 0·89, significant at p = 0·01). This result reflects the strong influence of slope angle in the calculations. The best-fit line shown in the diagram thus indicates that for Kaikoura the relationship between measured lowering and calculated backwasting varies logarithmically owing to variations in platform gradient. This suggests that future modelling attempts might be more satisfactorily based on logarithmic or power functions for situations in which platform slopes vary widely, rather than on the simple linear equation employed here. It also suggests the use of different slope forms relating lowering to backwasting than the parallel retreat model. However, for the present analysis lowering rates varied between 0·63 and 10·52% of widening rates with an average of 2·7% so that it may be concluded for Kaikoura that annual lowering averages about 3% of backwasting. This compares well with the relationship (dD = 0·02 dW) reported by Trenhaile (1974b) for the Lias sediments of U.K., though it is important to note for the present study that the best-fit relationship between lowering rates and backwasting rates is non-linear and masks a wide scatter of values.
Since the model links both surface lowering and backwasting rates it is possible to use it for compiling estimates of planation age for the platforms. Planation age is defined here as the time required to cut a platform of a given width at contemporary rates of cliff retreat and surface lowering by parallel retreat. It is clearly a minimum time and does not necessarily indicate the age of the platform.
Such estimates are presented in Table 7 from which it can be seen that the largest estimate is 3515 years for KMZ and the shortest 284 years for KM2 at Wairepo Lagoon. As previously mentioned, the erosion rates for KMZ are underestimated because of block disintegration so that the planation age is an over-estimate. The average of the planation ages is 1117 years.
In the introduction to this discussion it was argued that the erosion rates presented in this study should be viewed as correct to within an order of magnitude and it is now suggested that similar restraints should be applied to the planation ages calculated from them. Hence, it is concluded that the profiles studied could be cut at present sea level in periods ranging from 102-10 3 years only. This confirms the author's personal view that shore platforms, at least in the Kaikoura area, are more dynamic and more changeable features than was previously considered likely.
Dow
nloa
ded
by [
Ohi
o St
ate
Uni
vers
ity L
ibra
ries
] at
23:
33 0
6 D
ecem
ber
2014
dW d
O/d
t = dW
Id
t. to
n'"
dO
0-4
/1@
0·3
;;
, ~
;0
'2t·
M.1
.
'0
K.M
.4
/ e
K.M
.3
:>
0 '00
·1
(,)
/ e
K.M
.5
eK
.M.6
° ¥
K.M
.Z
I
° 0
1
02
0
·3
0-4
Me
osu
red
( d
W)m
yr-l
C
it
© O
·OJ
I 7'
'A
, ... >-
00
05
E °1_
'C'C
II>
'0
0::
0·0
01
0>
.§
II> 3:0
·00
05
.3
'0
~ " on o II>
::;:
,,0
., ~
~ KM
5 ®
. ~\)<
O'
':J'/..
~.
KM
I
"" C!
J'~
KM
4@
@
KM
3
00'1
;)
~~:>"
0'
0·0
~
0·0
00
1 r
,/ O
'OJ
0'0
5
01
0·5
Cal
cula
ted
Wid
enin
g R
ate
(dW
) m
yr-
I
dt
J·O
FIG
. IG
--T
he p
aral
lel
slop
e re
trea
t m
odel
(A
) as
def
ined
in
the
text
; B
. C
ompa
riso
n be
twee
n m
easu
red
back
was
ting
ra
tes
(fro
m a
ir p
hoto
grap
h su
rvey
s 32
yea
rs a
part
) an
d ra
tes
calc
ulat
ed f
rom
the
mod
el b
y us
ing
obse
rved
low
erin
g ra
tes
and
mea
sure
d pl
atfo
rm g
radi
ents
as
list
ed i
n T
able
6.
~ \,)l
~ I tT:! ~ Vl o Z o Z .... Z
>-i
t>1 ~ ~ t""
'"tj
S
~ ~ Vl
0\ o I,
jJ
Dow
nloa
ded
by [
Ohi
o St
ate
Uni
vers
ity L
ibra
ries
] at
23:
33 0
6 D
ecem
ber
2014

TABL
E 6
-Mea
sure
d a
nd c
alcu
late
d er
osio
n ra
tes
used
in
app
lyin
g th
e pa
rall
el s
lope
ret
reat
mod
el t
o pl
atfo
rm e
rosi
on p
atte
rns
Pro
file
M
ean
Low
erin
g G
radi
ent
Tan
C
alcu
late
d M
easu
red
Rem
arks
ra
te (
dD
/dt)
a
a d
W/d
t*
dW
/dtt
m
yel
degr
ees
my
el
my
el
KM
Z
0·00
038
1° 4
2'
0·02
97
0·01
28
Zer
o R
oad
wor
ks
KM
1 0·
0014
6 0°
30'
0·
0087
0·
168
Zer
o R
oad
wor
ks
KM
2 0·
0025
0°
30'
0·
0087
0·
287
0·4
0
Ero
ding
bea
ch
KM
3 0·
0011
4 0°
30'
0·
0087
0.
031
0·2
4
Ero
ding
clif
f K
M4
0·00
135
0° 2
2'
0·00
64
0·21
1 Z
ero
Sta
ble
beac
h K
M5
0·00
065
1° 1
2'
0·02
09
0·03
1 0
·10
E
rodi
ng h
ills
lope
K
M6
0·00
241
0° 3
6'
0·01
05
0·22
9 0
·24
E
rodi
ng
*Cal
cula
ted
from
the
rel
atio
nshi
p d
D / d
t =
dW
/ dt
tan
a tV
alue
s o
f dW
fro
m a
eria
l ph
otog
raph
s in
194
2 an
d 19
72 (
dt =
32
yea
rs),
see
Kir
k (1
975a
).
C\
o 01>. z N
0' ~ z > t"' o >,j ~ o S ~ > Z
t;
C)
tl1 o ~ g ~ r'
tv
o
Dow
nloa
ded
by [
Ohi
o St
ate
Uni
vers
ity L
ibra
ries
] at
23:
33 0
6 D
ecem
ber
2014
No.3 KIRK - EROSION ON INTERTIDAL PLATFORMS 605
TABLE 7-Calculated planation ages using the parallel retreat model. The "age" is the time required to cut a platform of stated width at the indicated erosion rates by parallel retreat.
Profile Mean Gradient Calculated Width of Indicated Planation age dD/dt a dW/dt Platform yr myel degrees myel m
KMZ 0·00038 1° 42' 0·0128 45 3516
KM1 0·00146 0° 30' 0·168 84 500
KM2 0·0025 0° 30' 0·287 84 293
KM3 0·00114 0° 30' 0·131 66 504
KM4 0·00135 0° 22' 0·211 60 284
KM5 0·00065 1° 12' 0·031 69 2225
KM6 0·00241 0° 36' 0·229 115 502
It has already been shown that the present erosion rates are consistent with those reported elsewhere in the world and it was noted that Takahashi (1974) has calculated a 2000-3000 year planation age for some platforms in Japan. If calculations similar to those in Table 7 are applied to Trenhaile's (197 4b) data, an indicated planation age of the order of 10 3 years is also obtained. The age of the platforms was argued to be older than this and so it is important to regard planation estimates more as an index of potential for change (and hence the likelihood of encountering inherited features), than of the absolute age of particular platforms.
Tectonism, Planation and Recent Risto,:y
Other important implications of the planation ages of Table 7 and the relationship between planation processes and platform age can be established by reference to the Recent history of the Kaikoura Peninsula. Duckmanton's (1974) study revealed 2 m of tectonic uplift on the peninsula over the last thousand years and also that there have been two phases of erosion in the hinterland. The debris from these two phases built the backshore beaches and enclosed the lagoons which are presently being stripped from the northern and southern margins of the peninsula.
From Table 4 it can be seen that the average gross lowering rate of 1· 53 mm ye l is less than the 2 mm yr- l uplift rate which would apply if the uplift has been uniform and continuous. This may account for some of the variability in platform morphology and may also explain why there is a slightly higher proportion of the morphology above mean water level than below (see Fig. 2) despite the rapid pace of present processes. However, there are important local exceptions to this.
It was noted that the lagoonal deposits at Wairepo Lagoon have been carbon dated to around 300 years B.P., so that again if uplift has been uniform
Dow
nloa
ded
by [
Ohi
o St
ate
Uni
vers
ity L
ibra
ries
] at
23:
33 0
6 D
ecem
ber
2014

606 N.Z. JOURNAL OF GEOLOGY AND GEOPHYSICS VOL. 20
the profile at that point has been raised 60 cm and cut down some 75 cm (see Table 4, profile KM2 has an average lowering rate of 2·50 mm ye l )
during the period of lagoon formation and subsequent retreat of the barrier beach. This suggests that platform development can more than keep pace with tectonic uplift where there is an abundant supply of abrasional materials. This factor undoubtedly contributes to morphological variability around the peninsula and must be considered in addition to the degree of exposure to wave energy.
The local history of platform development can be further illuminated by comparing the pattern of tectonic uplift with a eustatic curve of sea level change; as has been done in Fig. 11. The eustatic curve has been derived by fitting polynomial regressions to 44 published radiocarbon dates derived from all sections of the New Zealand coast and continental shelf. The curve is a "best fit" to available data and because of tectonic variations and errors in sampling and dating, it does not reflect the precise pattern of sea level change either at Kaikoura or elsewhere. Because of this the pattern of minor fluctuations shown for the last 5000 years may be exaggerated. However, a good fit to the available data was achieved (r = 0·98, significant at p = 0·01) which indicates that at least the broad pattern of change can be safely inferred.
The diagram also contains lines for a uniform tectonic uplift rate 0
2 mm ye l for Kaikoura Peninsula during the last thousand years (Duckmanton 1914) and for 0·46 mm ye l (Lensen 1968 in Pavoni 1971). The latter rate corresponds to uplift rates for the adjacent Kaikoura ranges and so may more accurately reflect longer term processes. A composite curve using Lensen's rate up to 1000 years B.P. and Duckmanton's for the remaining time is also shown.
Whichever uplift curve is employed the diagram reveals four proposed phases of activity in the shore platforms of the Kaikoura Peninsula. First there is a period (A) up to between 6000 and 7000 years B.P. when sea level rose rapidly, drowning the steep, narrow continental shelf in the area. Secondly, shore platform development (B) probably began about 6000 years B.P. and would have proceeded very rapidly until between 2000 and 3000 years B.P. when tectonic uplift had raised the inner margins of the developing platforms to a level near the upper limit of present sea level and tidal range (mean 1·36 m; maximum 2·57 m). The events of the last thousand years (C) then occurred with at least two phases of activity on the peninsula contributing the materials to build the barrier beaches and mantle the marine cliff. The fourth phase (D) is that of the present in which there is diminished supply of materials to the covering deposits and progress toward a new adjustment between sea level, uplift, and rapid erosion which is resulting in rejuvenation of the upper intertidal rock surface.
The age of the platforms is thus considered to be about 6000 years made up of two intervals of rapid planation (the first being the most active) separated by an interval of lesser activity during which marine planation processes· were partially offset by littoral deposition phases. The shore platforms of the Kaikoura Peninsula are thus argued to be polycyclic in origin, having passed through four stages of development within the one broadly uniform stand of sea level. Although many of their morphological
Dow
nloa
ded
by [
Ohi
o St
ate
Uni
vers
ity L
ibra
ries
] at
23:
33 0
6 D
ecem
ber
2014

No.3 KIRK - EROSION ON INTERTIDAL PLATFORM
9 8 7
r-I Lensen \92_ O·46~!.-_--
- - co rnpo5ite . -'-'-
A
\O~ ~o(\ ;
ouc.~:,.......--' .\ ;;.,---
1."'~.;!!.--' ;;.,--- SUBMERGENCE
OF CONTINENTAL SHELF
Years B.P. X 103
5 4
Best fit eustatic curve N.Z wide
3 2
c o
30
35
607
] ctS OJ CfJ
C OJ CfJ ~ a. 3: o
Q) ..0
CfJ ~ Q) ~
FIG. 11-Approximate relationship between Recent eustatic sea-levels and tectonic uplift of the Kaikoura Peninsula over the last 6000 years. The eustatic curve is a "best fit" by polynomial regression to New Zealand-wide data and tectonic uplift is assumed to be uniform.
attributes reflect the present process regime and contemporary relationships between land and sea levels, much of their character is inherited, some of it from as recently as 200-400 years ago and they continue to change as the balance among the cQntrolling factors shifts.
Littoral Sediment Budget
As a final step in the analysis it is apparent that the data can be employed to provide estimates of littoral denudation rates for the Kaikoura Peninsula. Total sediment contributions are comprised of five principal components:
ql Erosion of the low water cliff. q2a Erosion products derived from intertidal lowering detectable by
the micro-erosion meter technique, principally flaking and granular disintegration.
Dow
nloa
ded
by [
Ohi
o St
ate
Uni
vers
ity L
ibra
ries
] at
23:
33 0
6 D
ecem
ber
2014
608 N.Z. JOURNAL OF GEOLOGY AND GEOPHYSICS VOL. 20
q2b Erosion products from intertidal lowering not detected by the experimental method-mainly block breakdown of the limestones.
q3 Erosion products derived from the stripping of backshore cover deposits.
q4 Erosion products derived from backwasting of active marine cliffs.
q5 Erosion products moved through the littoral zone from the body of the peninsula by streams during floods.
Obviously, ql and q2b can not be estimated from the available data, and q5 is thought to be so small that it can be ignored and the denudation rate to be presented should, therefore, be regarded as a minimum.
The component rate for the intertidal platform surfaces (q2a) was calculated by deriving the quantity of material eroded per metre width of each profile annually, taking the average and multiplying by the intertidal area of the peninsula. Quantities for individual profiles ranged from 0.017 m 3 m- I ye I for KMZ to 0.28 m 3 m- I ye I for KM6 and the average was 0.119 m 3 m- I ye I . Taking the intertidal area as approximately 0·77 km2, the component rate is estimated as:
q2a = Average Rate.Area = 0·118.0·77 X 106
Average Width 74·7 = 1579 m 3 ye I
Assuming an average bulk density of 2·0 gm cm-3 this corresponds to 3159 tonnes of rock fragments per year.
Erosion of backshore cover (q3) has been estimated from the air photography analysis at 1100 m 3 ye I and active cliff erosion (q4) on three restricted sections of the eastern margin of the peninsula at a further 1370 m 3
ye I • Once again if an average bulk density of 2·0 gm cm-3 is assumed these rates correspond to release of 2200 and 2740 tonnes per year of rock particles respectively.
Thus total estimated denudation is given by
Qes t = q2a + q3 + q. = 1579 + 1100 + 1370
:. Qest = 4049 m3 yr-l = 8098 tonnes yr-l
It is speculated that the additional input from block disintegration and direct contributions from the peninsula by agents of erosion other than cliff processes would raise this total to about 5000 m 3 ye I •
This estimated denudation rate and the component erosion rates for cliffs and platforms may be regarded as the baseline against which maninduced changes by kelp harvesting or other means may be assessed. It can be seen that 39% is contributed by platform lowering, 27% by erosion of covering deposits and 34% by direct erosion of limited stretches of active marine cliff. This latter component may be expected to increase both in total and as a proportion of the sediment budget as rejuvenation of the platforms proceeds. At present this is a natural process but it could be accelerated if the energy absorbing protection of the kelp on the low water
Dow
nloa
ded
by [
Ohi
o St
ate
Uni
vers
ity L
ibra
ries
] at
23:
33 0
6 D
ecem
ber
2014
No.3 KIRK - EROSION ON INTERTIDAL PLATFORM 609
cliff was reduced over large areas. As an illustration of this effect Wayne (1974) has shown that average bending moments on fronds of artificial sea grass can be as high as 2·0 Ib inch (0·35 kg cm) which will result in up to 20% reductions in incident wave energy solely because of the energy loss in bending the fronds of dense stands of the grass. The preceding analysis has shown that erosion rates are very rapid around Kaikoura Peninsula in the presence of existing kelp stands.
CONCLUSIONS
In common with many previous studies the present one has demonstrated the complexity of shore platform processes and morphology. The study has also shown both the feasibility and the difficulties of combining studies of erosion rates, even over quite short periods of time, with the more usual morphological studies. This approach has enabled some degree of quantitative resolution of the major formative influences in the Kaikoura area and it is reasonable to conclude that a similar approach would be equally advantageous in other situations. The present study also demonstrates the value of continuing research on a number of fronts for particular areas of interest. Thus, it has been possible at Kaikoura to draw upon detailed information from related studies concerning waves, tides, morphology, and Recent history. Without access to such information interpretation of many facets of the erosion data would have been seriously hampered.
It has been clearly shown that the shore platforms have a complex origin both in terms of present process zonation across the shore and in terms of a changing balance of processes through time. Rather than being predominantly wave-worked or sub-aerially weathered it has been hypothesised that there is a gradient of process across the shore from a marine maximum low on the profile, through a central zone of relatively lower intensity to an upper sub-aerially dominated zone where erosion is again relatively more active. It is therefore considered unlikely that there is a single process of planation which is the primary determinant of morphology, so that although a broad correlation between platform elevation and exposure to wave energy occurs with higher platforms to the east and on exposed points there are complicating influences. These include the influence of lithology and structure, the shore-normal process zonation just mentioned and the occurrence of higher rates of erosion at sites where abrasion materials are abundantly supplied by stripping of cover deposits. Hence it is possible at Kaikoura to encounter more than one platform elevation even in rocks of relatively uniform lithology and structure such as the mudstones.
That the platforms are all intertidal and quite well adjusted in elevation to both tide range and wave energy could be taken to indicate support for the "one sea level, one platform" hypothesis, but it must be remembered that four phases of change have been advanced to account for events during the last 5000-6000 years of sea levels near that of the present. These changes reflect not only tectonic-eustatic adjustments but also erosional episodes in the hinterland and concomitant deposition of covering deposits at the shore, so that modern and inherited features occur throughout the littoral zone and the profiles reflect a number of historical events both erosional and depositional.
Dow
nloa
ded
by [
Ohi
o St
ate
Uni
vers
ity L
ibra
ries
] at
23:
33 0
6 D
ecem
ber
2014
610 N.Z. JOURNAL OF GEOLOGY AND GEOPHYSICS VOL. 20
Contemporary rates of erosion were demonstrated to be rapid especially on the mudstones, and to lie within ranges reported from elsewhere in the world. In agreement with other studies it was shown that backwasting is more rapid than lowering, by an average of 3%. The estimates of sediment budget revealed the importance of the marine cliff in platform development as it contributes up to 34% of the annual eroded volume though it occupies only limited segments of the perimeter of Kaikoura Peninsula.
The parallel retreat model of platform development was applied to the observed data on lowering and backwasting rates with only moderate agreement between predicted and observed rates of backwasting. A logarithmic best-fit relationship between observed lowering rates and predicted backwasting rates was obtained which reflects the strong influence of platform gradient in the calculations. These findings suggest that future modelling based on power or logarithmic functions may be more successful in describing the pattern of platform growth than the simple, linear parallel retreat model.
However, for the present study the agreement between measured and predicted changes was considered to be adequate for use of the parallel retreat model to estimate planation ages. Agreement, not surprisingly, was best for profiles backed by active marine cliffs and by very rapidly eroding cover deposits. It was argued that both erosion rates and indicated planation ages are probably accurate within an order of magnitude despite deficiencies in the model and the short period of observation. If the observed erosion rates were doubled or halved calculated planation ages would still lie in the interval 102-10 3 years and the estimates are further supported by agreement with two previous studies and by the presence of inherited features at Kaikoura such as the Wairepo Lagoon complex which is approximately 300 years old. It is concluded that the shore platforms of Kaikoura Peninsula are geologically rapidly evolving features which respond quickly to even small changes among the elements of lithology, structure, erosion processes, and eustatic-tectonic balance.
ACKNOWLEDGMENTS
This study could not have been completed without the help of many people, particularly during the installation of the micro-erosion sites. Here I especially want to record my thanks to David Harrowfield, Warren Farrelly, Miles Reay, John Campbell, and Henry Hudson. Henry Hudson also designed and manufactured the improved version of the bolts.
The University Grants Committee and the University of Canterbury have provided continued funding for all of our studies in the Kaikoura area for which I express my thanks. Professor G. Knox, Department of Zoology made available the facilities of the Edward Percival Marine Laboratory, Kaikoura as a base of operations and this has greatly facilitated the work.
My thanks also go to Anna Moloney who typed the manuscript and to the staff of the Cartographic Section, Department of Geography who produced the diagrams. Ian Owens, Rick Gillie, and John Dodson read and criticised the manuscript. To these colleagues I also express my gratitude.
REFERENCES
BARTRUM, J. A. 1916: High water rock platforms: a phase of shoreline erosion. Transactions of the New Zealand Institl/te 48: 132-4.
Dow
nloa
ded
by [
Ohi
o St
ate
Uni
vers
ity L
ibra
ries
] at
23:
33 0
6 D
ecem
ber
2014

No.3 KIRK - EROSION ON INTERTIDAL PLATFORM 611
--- 1926: 'Abnormal' shore platforms. Journal of Geology 34: 793-806. --- 1938: Shore platforms: a discussion. Journal of Geomorphology 1 (3): 266-8. BURGESS, J. S. 1971: Coastline changes at Wanganui, New Zealand. (Unpublished Ph.D.
Thesis lodged in the Library, University of Canterbury, Christchurch, New Zealand. 99 p.)
CHALLINOR, J. 1949: A principle in coastal geomorphology. Geography 34 (4): 212-15. CHANDRA, S. 1969: The geomorphology of the Kaikoura Area. Earth Science Journal 3 (2):
109-22. COTTON, C. A. 1949: Plunging cliffs, Lyttelton Harbour. New Zealand Geographer 5 (2):
130-6. 1963: Level of planation of marine benches. Zeitschrift fur Geomorphologie N.S.7: 97-111.
---- 1967: Plunging cliffs and Pleistocene coastal cliffing in the Southern Hemisphere. Melanges offerts a O. Tulippe 1: 37-60.
DAVIS, R. A.; FINGLETON, W. G.; PRITCHETT, P. C. 1975: Beach profile changes East Coast of Lake Michigan, 1970-72. U.S. Army Coastal Engineering Research Center. Miscellaneous Paper 10-75. 97 p.
DAVIS, W. M. 1896: The outline of Cape Cod. Proceedings of the American Academy of Arts and Science 31: 303-32.
DUCKMANTON, N. M. 1974: The shore platforms of the Kaikoura Peninsula. (Unpublished M.A. Thesis lodged in the Library, University of Canterbury, Christchurch, New Zealand. 136 p.)
EDWARDS, A. B. 1941: Storm wave platforms. Journal of Geomorphology 4: 223-36. ---- 1951: Wave action in shore platform formation. Geological Magazine 88: 41-9. EMERY, K. O. 1941: Rates of surface retreat of sea cliffs based on dated inscriptions.
Science 93 (2426): 617-18. ---- 1946: Marine Solution Basins. Journal of Geology 54 (4): 209-28. EVANS, J. W. 1968: The role of Penitella penita (Conrad 1837) (Family Pholadidae) as
eroders along the Pacific Coast of North America. Ecology 49 (1): 156-9. FLEMING, C. A. 1953: The geology of Wanganui Subdivision. N.Z. Geological Survey
Bulletin 52. 362 p. GARNIER, R. J. 1958: "The climate of New Zealand". Edward Arnold, London. 191 p.
GILL, E. D. 1950: Some unusual shore platforms near Gisborne, North Island, New Zealand. R'!)Ial Society of N.Z. Transactions 78 (1): 64-8.
---- 1967: The dynamics of the shore platform process, and its relation to changes in sea-level. Royal Socie~y of Victoria Proceedings 80 (2): 183-92.
---- 1972: Ramparts on shore platforms. Pacific Geology 4: 121-33. ---- 1973: Rate and mode of retrogradation on rocky coasts in Victoria, Australia,
and their relationship to sea-level changes. Boreas 2 (3): 143-72. HAY, C. H.; SOUTH, G. R. 1974: Some implications of field experiments on proposed
commercial harvesting of Durvillea in New Zealand. Abstracts VIII International Seaweed Symposium, Bangor, 1974: B64.
HEALY, T. R. 1968a: Shore platform morphology on the Whangaparaoa Peninsula, Auckland. Conference Series New Zealand Geographical Society 5: 163-8.
---- 1968b: Bioerosion on shore platforms developed in the Waitemata Formation, Auckland. Earth Science Journal 2 (1): 26-37.
HIGH, C.; HANNA, F. K. 1970: A method for the direct measurement of erosion on rock surfaces. British Geomorphological Research Group Technical Bulletin No.5. 24 p.
HILLS, E. S. 1949: Shore Platforms. Geological Magazine 86 (3): 137-52. ---- 1971: A study of cliffy coastal profiles based on examples in Victoria, Australia.
Zeitschrift fur Geomorphologie N.S. 15 (2): 137-80. ---- 1972: Shore platforms and wave ramps. Geological Magazine 109: 81-8.
Dow
nloa
ded
by [
Ohi
o St
ate
Uni
vers
ity L
ibra
ries
] at
23:
33 0
6 D
ecem
ber
2014

612 N.Z. JOURNAL OF GEOLOGY AND GEOPHYSICS VOL. 20
HODGKIN, P. 1964: Rate of erosion on intertidal limestone. Zeitschrift fur Geomorphologie N.J. 8: 385-92.
HORIKAWA, K.; SUNAMURA, T. 1967: A study of erosion of coastal cliffs by using aerial photographs. Coastal Engineering in Japan 10: 67-83.
JOBBERNS, G. 1928: The raised beaches of the north east coast of the South Island of New Zealand. Transactions of the N.Z. Institute 59: 508-70.
JOHNSON, D. W. 1919: "Shore Processes and Shoreline Development". Wiley, New York. 584p.
JUTSON, J. T. 1939: Shore platforms near Sydney, New South Wales. Journal of Geomorphology 2 (3): 237-50.
---- 1950: On the terminology and classification of shore platforms. Royal Society of Victoria Proceedings 62: 71-8.
KING, C. A. M. 1972: "Beaches and Coasts". (2nd ed.) Arnold, London. 570 p. KIRK, R. M. 1972: Statistical summary of sea state observations in New Zealand, 1971.
Unpublished Report, Department of Geography, University of Canterbury, Christchurch, N.Z. 20 p.
1973: Statistical summary of sea state observations in New Zealand, 1972. Unpublishqd Report, Department of Geography, University of Canterbury, Christchurch, N.Z. 23 p.
---- 1975a: Coastal changes at Kaikoura, 1942-1974, determined from air photographs. N.z. Journal of Geology and Geophysics 18 (6): 787-801.
---- 1975b: Aspects of surf and runup processes on mixed sand and gravel beaches. Geograftska Annaler 57A (1-2): 117-33.
1976: Tidal observations at the Edward Percival Marine Laboratory, Kaikoura. October 1967 to October 1972. Unpublished Report, Department of Geography, University of Canterbury, Christchurch, N.Z. 15 p.
McLEAN, J. F. 1967: Objective description of shore platforms on the North East Coast of the South Island. (Unpublished M.A. Thesis lodged in the Library, University of Canterbury, Christchurch, N.Z. 90 p.)
McLEAN, R. F. 1968: Statistical Summary of Sea State Observations in New Zealand, 1967. Unpublished Report, Department of Geography, University of Canterbury, Christchurch, N.Z. 18 p.
McLEAN, R. F.; DAVIDSON, C. F. 1968: The role of mass movement in shore platform development along the Gisborne coastline, New Zealand. Earth Science Journal 2 (1): 15-25.
MIl, H. 1962: Coastal geology of Tanabe Bay. Science Reports Tohoku University Second Series (Geology) 34 (1): 1-96.
NEUMANN, A. C. 1966: Observations on coastal erosion in Bermuda and measurements of the boring rate of Cliona lampa (the Sponge). Limnology and Oceanography 11 (1): 92-108.
NORRMAN, J. O. 1970: Trends in postvolcanic development of Surtsey Island. Meddelanden fran Uppsala Geograftska Institutionen. Serfes A (246): 1-18.
NORTH, W. J. 1954: Size distribution, erosive activities and gross metabolic efficiency of the marine intertidal snails Littorina planaxis and L. scutulata. Biological Bulletin of the Marine Biological Laboratory, Woods Hole 106: 187-97.
ONGLEY, M. 1940: Note on coastal benches formed by spray weathering. N.Z. Journal of Science and Technology B22 (1): 34-5.
PAVONI, N. 1971: Recent and Late Cenozoic movements of the Earth's crust. Pp. 7-17 in "Recent Crustal Movements". Rf!)lal Society of N.Z. Bulletin 9. 247 p.
PHILLIPS, B. A. M. 1970a: The significance of inheritance in the interpretation of marine and Lacustrine coastal histories. Lakehead University Review 3 (1): 36-45.
---- 1970b: Effective levels of marine planation on raised and present rock platforms. La Review de Geographie de Montreal 24 (3): 227-40.
REVELLE, R.; EMERY, K. O. 1957: Chemical erosion of beach rock and exposed reef rock. U.S. Geological Survey Professional Paper 260-T: 699-709.
Dow
nloa
ded
by [
Ohi
o St
ate
Uni
vers
ity L
ibra
ries
] at
23:
33 0
6 D
ecem
ber
2014

No.3 KIRK - EROSION ON INTERTIDAL PLATFORM 613
ROBINSON, L. A. 1976: The Micro-erosion meter technique in a littoral environment. Marine Geology 22: M51-8.
RUDBERG, S. 1967: The cliff coast of Gotland and the rate of cliff retreat. Geograjiska Annaler 49A (2-4): 283-98.
SCHWARTZ, M. L. 1971: Shannon Point cliff recession. Shore and Beach, April 1971 : 45-8. SIEGEL, S. 1956: "Nonparametric Statistics for the Behavioral Sciences". McGraw-HilI,
New York. 312 p. So, C. L. 1965: Coastal platforms of the Isle of Thanet, Kent. Institute of British Geographers
Transactions 37: 147-56.
SUGGATE, R. P. 1965: Late Pleistocene geology of the Northern part of the South Island, New Zealand. N.Z. Geological Survey Bulletin 77. 91 p.
SUNAMURA, T. 1973: Coastal cliff erosion due to waves-field investigations and laboratory experiments. Journal of the Faculty of Engineering, University of Tokyo 32 (1). 86 pi
TAKAHASHI, T. 1973: Formation and evolution of shore platforms around Southern Ki. Peninsula. Science Reports Tohoku University (Geography) 23 (1): 63-89.
1974: Level and age of planation of emerged platforms near Cape Muroto, Shikohu. Science Reports Tohoku University (Geography) 24 (1): 47-58
TRENHAILE, A. S. 1971: Lithological control of high water rock ledges in the Vale of Glamorgan, Wales. Geograjiska Annaler 53A (1): 59-69.
---- 1972: The shore platforms of the Vale of Glamorgan, Wales. Institute of British Geographers Transactions 44: 127-44.
---- 1974a: The morphology and classification of shore platforms in England and Wales. Geograjiska Annaler 56A (1-2): 103-10.
---- 1974b: The geometry of shore platforms in England and Wales. Institute of British Geographers Transactions 46: 129-42.
VITA-FINZI, c.; CORNELIUS, P. F. S. 1973: Cliff sapping by molluscs in Oman. Journal of Sedimentary Petrology 43 (1): 31-2.
WAYNE, C. J. 1974: Effect of artificial sea grass on wave energy and near-shore sand transport. Transactions of the Gulf Coast Association of Geological Societies 24 (353): 279-82.
WENTWORTH, C. K. 1938: Marine bench-forming processes-water level weathering. Journal of Geomorphology 1 (1): 5-32.
---- 1939: Marine bench-forming processes-solution benching. Journal of Geomorphology 2 (1): 3-25.
WRIGHT, L. W. 1967: Some characteristics of the shore platforms of the English Channel coast and the northern part of the North Island, New Zealand. Zeitschrift fur Geomorphologie N.S. 11 (I): 36-46.
© Crown Copyright
E. C. KEATING. GOVERNMENT PRINTER, WELLINGTON, NEW ZEALAND-1977
93037 D-1.400/4/77 P
Dow
nloa
ded
by [
Ohi
o St
ate
Uni
vers
ity L
ibra
ries
] at
23:
33 0
6 D
ecem
ber
2014