r&s upv-k9/-k91 lte/umts/gsm mobile phone tests …
TRANSCRIPT
PA
D-T
-M: 3574.3
259.0
2/0
1.0
0/C
I/1/E
N
R&S®UPV-K9/-K91 LTE/UMTS/GSM Mobile Phone Tests Operating Manual
Version 3.3.1.84
Opera
ting M
an
ual
1402.0043.12 – 10

© 2020 Rohde & Schwarz GmbH & Co. KG
Muehldorfstr. 15, 81671 Munich, Germany
Phone: +49 89 41 29 - 0
Fax: +49 89 41 29 12 164
E-mail: [email protected]
Internet: http://www.rohde-schwarz.com
Subject to change – Data without tolerance limits is not binding.
R&S® is a registered trademark of Rohde & Schwarz GmbH & Co. KG.
Trade names are trademarks of the owners.
The following abbreviations are used throughout this manual:
R&S®UPV-K9/-K91 is abbreviated as R&S UPV-K9/-K91
R&S UPV-K9/-K91 Contents
Operating Manual 1402.0043.12 - 10 3
Contents
1 Overview .............................................................................................. 9
2 Preparation and Start of the Application Software ........................ 10
2.1 Required Measuring Instruments and Accessories ...............................................10
2.2 Installing the Software ..............................................................................................15
2.3 Verification of the Installation ..................................................................................17
2.4 Test Setup ...................................................................................................................18
2.5 Starting the Application Software ............................................................................22
2.6 Options (General settings) ........................................................................................27
2.6.1 Mouth Calibration Frequency Range ...........................................................................27
2.6.2 Standard ......................................................................................................................28
2.6.3 Select Standard at Startup ...........................................................................................28
2.6.4 Release ........................................................................................................................28
2.6.5 Select Release at Startup ............................................................................................28
2.6.6 Ear Simulator ...............................................................................................................29
2.6.7 Select Ear Simulator at Startup ...................................................................................29
2.6.8 Artificial Mouth .............................................................................................................29
2.6.9 Select Artificial Mouth at Startup ..................................................................................29
2.6.10 System Simulator .........................................................................................................29
2.6.11 Hands-free Settings .....................................................................................................29
2.6.12 Activation Signal for Distortion Tests ...........................................................................29
2.6.13 Show Operator Instructions .........................................................................................30
2.6.14 R&S CMU Remote Control ..........................................................................................32
2.6.15 R&S CMU Subsystem .................................................................................................32
2.6.16 R&S CMW Remote Control .........................................................................................32
2.6.17 Noise Calibration Configuration ...................................................................................33
2.6.18 R&S UPP Remote Control ...........................................................................................40
2.6.19 Input Switcher ..............................................................................................................41
2.6.20 Report settings .............................................................................................................41
2.6.21 Generate Temporary Export Files ...............................................................................41
2.6.22 Generate Temporary Image Files ................................................................................42
2.6.23 Store Results of Further Measurements ......................................................................42
2.6.24 Do not Change Scale for Further Meas. ......................................................................42
R&S UPV-K9/-K91 Contents
Operating Manual 1402.0043.12 - 10 4
2.6.25 Store Loaded Curve Data to Results ...........................................................................42
2.6.26 Enable Remote Control ...............................................................................................42
3 Calibration ......................................................................................... 43
3.1 Calibration Devices....................................................................................................43
3.2 Microphone Calibration .............................................................................................45
3.3 Calibration of Artificial Ear .......................................................................................47
3.3.1 Calibration of Ear Type 1 .............................................................................................47
3.3.2 Calibration of Ear Type 3.2 Low Leakage ...................................................................48
3.3.3 Calibration of Ear Type 3.2 High Leakage ...................................................................48
3.3.4 Calibration of Ear Type 3.3 ..........................................................................................49
3.3.5 Calibration of Ear Type 3.4 ..........................................................................................51
3.4 Calibration of Artificial Mouth for Handset Tests ...................................................51
3.5 P.50 Speech Spectrum Calibration ..........................................................................53
3.6 P.501 Speech Spectrum Calibration ........................................................................54
3.7 Calibration of CMU Speech Codec...........................................................................55
3.8 Calibration of CMW Speech Codec ..........................................................................56
3.9 Calibration of Ambient Noise Field ..........................................................................57
3.10 Calibration of Noise Field for “Speech Quality in Presence of Background Noise”
Test ..............................................................................................................................60
3.10.1 Connections .................................................................................................................60
3.10.2 Establishing the Remote Control Connection between R&S UPV and R&S UPP ......61
3.10.3 Prerequisites ................................................................................................................61
3.10.4 Configuration ................................................................................................................61
3.10.5 Switcher Support..........................................................................................................67
3.10.6 Selection of Background Noise Signals .......................................................................70
3.10.7 Starting the Calibration Process ..................................................................................70
3.10.8 Stopping and Resuming the Calibration Process ........................................................71
3.10.9 Preparatory Measurements for Delay Measurement ...................................................73
3.10.10 Delay Measurement .....................................................................................................74
3.10.11 Preparatory Measurements for Equalization ...............................................................77
3.10.12 Shared Equalization Method ........................................................................................80
3.10.13 Individual Equalization Method ....................................................................................80
3.10.14 Level Adjustment .........................................................................................................81
3.10.15 Equalization .................................................................................................................81
3.10.16 Final Test of All Ambiances .........................................................................................84
3.10.17 Calibration Sections and Resuming Points .................................................................84
3.10.18 Calibration Report ........................................................................................................86
R&S UPV-K9/-K91 Contents
Operating Manual 1402.0043.12 - 10 5
3.11 Synchronization of CMW clock ................................................................................89
3.11.1 Preparations .................................................................................................................89
3.11.2 Starting the Synchronization Process ..........................................................................90
3.11.3 Stopping the Synchronization Process ........................................................................91
3.11.4 Steps of Synchronization Process ...............................................................................91
3.11.5 Options after Termination of Synchronization .............................................................95
3.11.6 Synchronization Report ...............................................................................................96
4 Data Entry for Reporting .................................................................. 98
4.1 Operator ......................................................................................................................98
4.2 Test object ..................................................................................................................98
5 Measurements ................................................................................... 99
5.1 General ........................................................................................................................99
5.2 Starting Measurements .............................................................................................99
5.3 Functionality and Control of the Measurement Macros ......................................101
5.3.1 Zooming .....................................................................................................................101
5.3.2 Changing the Scale of the Graph ..............................................................................102
5.3.3 Cursor ........................................................................................................................102
5.3.4 Data Point Size ..........................................................................................................102
5.3.5 Entering a Comment ..................................................................................................102
5.3.6 Storing a Hardcopy of the Graph ...............................................................................102
5.3.7 Making Additional Measurements ..............................................................................103
5.3.8 Storing and Loading Curves ......................................................................................103
5.3.9 Storing Curves as Limit Curves .................................................................................104
5.3.10 Deleting Additional Curves in the Measurement Graph ............................................104
5.3.11 Creating a Report.......................................................................................................104
5.3.12 Closing the Measurement Window ............................................................................104
5.4 Applicability of Measurements and Equipment Depending on the Release .....104
5.5 Sending Frequency Response and Loudness Rating .........................................105
5.5.1 Sending Frequency Response ..................................................................................105
5.5.2 Sending Loudness Rating ..........................................................................................105
5.5.3 Sending Tests Using Artificial Voice According to ITU-T P.50 or Single-Talk Speech
according to ITU-T P.501 as Test Signal ...................................................................107
5.6 Receiving Frequency Response and Loudness Rating.......................................107
5.6.1 Receiving Frequency Response ................................................................................108
5.6.2 Receiving Loudness Rating .......................................................................................109
5.6.3 Receiving Tests Using Artificial Voice according to ITU-T P.50 or Single-Talk Speech
according to ITU-T P.501 as Test Signal ...................................................................110
R&S UPV-K9/-K91 Contents
Operating Manual 1402.0043.12 - 10 6
5.7 Sidetone Masking Rating (STMR) ..........................................................................111
5.7.1 STMR Tests Using Artificial Voice according to ITU-T P.50 or Single-Talk Speech
according to ITU-T P.501 as Test Signal ...................................................................112
5.8 Sidetone Delay .........................................................................................................113
5.9 Roundtrip Delay .......................................................................................................114
5.10 Receiving Impairments ...........................................................................................116
5.11 Jitter Buffer Management Behaviour .....................................................................118
5.12 Echo Loss (TCLw)....................................................................................................119
5.13 Stability Margin ........................................................................................................120
5.14 Stability Loss ............................................................................................................121
5.15 Echo Control Characteristics .................................................................................122
5.16 Sending Distortion ...................................................................................................125
5.17 Receiving Distortion ................................................................................................129
5.18 Idle Channel Noise Sending ...................................................................................132
5.19 Idle Channel Noise Receiving .................................................................................134
5.20 Ambient Noise Rejection ........................................................................................136
5.21 Speech Quality in Presence of Ambient Noise .....................................................138
5.21.1 Setup ..........................................................................................................................138
5.21.2 Connections ...............................................................................................................139
5.21.3 Switcher Support........................................................................................................139
5.21.4 Prerequisites ..............................................................................................................141
5.21.5 Measurement .............................................................................................................141
5.21.6 Continuing Aborted Measurements ...........................................................................143
5.21.7 Typical Problems during measurement .....................................................................143
5.21.8 Additional operations when finished ..........................................................................145
5.21.9 Extended Speech Quality Measurements .................................................................145
5.21.10 Continuing Aborted Extended Measurements ...........................................................146
5.22 UE Send Clock Accuracy ........................................................................................147
5.23 Notes on Hands-Free Measurements ....................................................................148
5.23.1 General Remarks .......................................................................................................148
5.23.2 Test Setup ..................................................................................................................148
5.23.3 Acoustic Calibration for Hands Free Tests ................................................................150
5.24 “Utilites” Measurements .........................................................................................151
5.24.1 Sidetone Distortion.....................................................................................................151
5.24.2 Gain Variation Tests ..................................................................................................152
5.24.3 Delay Measurements .................................................................................................153
5.24.4 Background Noise Measurements .............................................................................154
R&S UPV-K9/-K91 Contents
Operating Manual 1402.0043.12 - 10 7
6 Customizing Measurements .......................................................... 156
6.1 Editing Parameters ..................................................................................................157
6.2 Editing Limit Curves ................................................................................................158
7 Measurements with Electric Connections .................................... 159
7.1 Introduction ..............................................................................................................159
7.2 Calibration Values for Electric Connections .........................................................159
7.2.1 Electric Connection Replacing Artificial Ear ..............................................................159
7.2.2 Electric Connection Replacing Artificial Mouth ..........................................................160
7.2.3 Electric Connection Replacing Encoder ....................................................................160
7.2.4 Electric Connection Replacing Decoder ....................................................................160
7.3 Performing the Measurements ...............................................................................160
8 Automatic Test Sequences ............................................................ 161
8.1 Creating and Editing a Sequence ...........................................................................161
8.2 Remote Control of R&S CMU200 within a Sequence ...........................................162
8.3 Remote Control of R&S CMW500 within a Sequence ..........................................163
8.4 Starting an External Executable within a Sequence ............................................164
8.5 Opening an Existing Sequence ..............................................................................164
8.6 Running a Sequence ...............................................................................................165
8.7 Running a Single Measurement out of a Sequence .............................................165
8.8 Reporting on Sequence Results ............................................................................165
9 Reporting, Storing, Loading and Deleting Results ...................... 166
9.1 Result Files ...............................................................................................................166
9.2 Report Settings ........................................................................................................166
9.3 Generating a Single Report ....................................................................................167
9.4 Generating a Sequence Report ..............................................................................167
9.5 Selection Report ......................................................................................................167
9.6 Preview Window.......................................................................................................168
9.7 Storing and Loading Curves ...................................................................................169
9.8 ASCII Result Files ....................................................................................................169
9.9 Deleting Results .......................................................................................................169
10 Remote Controlled Start of Testcases via GPIB .......................... 170
10.1 Preparations .............................................................................................................170
10.2 Starting a Measurement ..........................................................................................170
10.3 Reading the Results ................................................................................................170
R&S UPV-K9/-K91 Contents
Operating Manual 1402.0043.12 - 10 8
10.4 Determining the Termination of a Measurement ..................................................173
11 Terminating the Application .......................................................... 174
12 Appendix A Settings on the Radio Communication Tester
R&S CMU200 ................................................................................... 175
12.1 Settings for GSM:.....................................................................................................175
12.2 Settings for UMTS WCDMA FDD: ...........................................................................178
13 Appendix B Settings on the Radio Communication Tester
R&S CMW500 .................................................................................. 182
13.1 Settings for LTE: ......................................................................................................182
13.2 Settings for UMTS WCDMA FDD: ...........................................................................185
13.3 Settings for GSM:.....................................................................................................187
14 Appendix C Troubleshooting ......................................................... 189
14.1 Error Message 2908 During Installation ................................................................189
14.2 Damaged Setup File is Reported ............................................................................189
14.3 Damaged Results File is Reported.........................................................................189
14.4 A Test is Not Starting Properly ...............................................................................189
14.5 A Calibration Value is Missing or No Device is Selected for a Required
Calibration Type .......................................................................................................189
14.6 The Receiving Noise Test Produces an Overrange Error ...................................190
14.7 ARL for the Sending Distortion Test Cannot be Adjusted ..................................190
14.8 A Measurement Using a Custom Limit Curve Produces an Error ......................190
14.9 Other Problems of Unknown Reason ....................................................................190
R&S UPV-K9/-K91 Overview
Operating Manual 1402.0043.12 -10 9
1 Overview
The acoustic transmission and reproduction quality of a mobile phone is its most
important characteristic in everyday use. Even the most visually appealing design and
wonderfully sophisticated operating concept are not much use, when you cannot or
can hardly understand what is being said at the other end. Improvements in voice
quality achieved with wideband and super-wideband codecs as well as with modern
noise suppression and echo cancelling techniques have to be verified. In voice calls
over IP-based IMS connections like Voice over LTE, the processing delay in the mobile
phone as well as its ability to cope with packet delay jitter and packet loss is important
and has to be tested.
Instruments and methods for measuring acoustic characteristics are therefore essential
tools for assessing the quality and suitability of a mobile phone.
These tests are based on standards for 3GPP mobile phones. The test methods are
stipulated in 3GPP TS 26.132 and the values to be attained in 3GPP TS 26.131.
As of release 4 of the GSM 51.010 standard (successor to GSM 11.10), even GSM
mobile phones may be tested to 3GPP TS 26.132.
The R&S® UPV-K9 and R&S® UPV-K91 options (LTE/UMTS/GSM Mobile Phone
Tests) of the Audio Analyzer R&S® UPV, called herein below “UPV”, are now available
for measuring the acoustic characteristics of LTE, UMTS and GSM mobile phones.
The measurements are in line with 3GPP TS 26.131, TS 26.132 and TS 51.010 and
have been validated in conjunction with Wideband Radiocommunication tester
R&S® CMW500 by an independent test house for conformance testing on LTE, UMTS
and GSM mobile phones.
The current version of the software supports 3GPP TS 26.131 and TS 26.132 up to
Release 15.
From version 2.3.1.47 of the software, a new “Release” menu is available which allows
you to determine and start the test cases applicable to a given combination of speech
codec bandwidth, type of tested device (handset, headset or handheld, desktop or
vehicle-mounted hands-free) and release number of the test specifications.
R&S UPV-K9/-K91 Preparation and Start of the Application Software
Operating Manual 1402.0043.12 -10 10
2 Preparation and Start of the Application
Software
2.1 Required Measuring Instruments and Accessories
The R&S® UPV audio analyzer with the options as described below is required for the
measurements.
The mobile phone under test is connected via the RF interface using Wideband Radio
Communication Tester R&S® CMW500, called herein below R&S® CMW500. Legacy
support for the Universal Digital Radio Communication Tester R&S® CMU200, called
herein below CMU200,is also provided. These testers simulate a base station for the
mobile phone so that a speech call can be set up.
The R&S® CMW500 must be equipped with the options R&S® CMW-B400B (Audio
Board) and R&S® CMU-B405A (Speech Board) in addition to the options required for
the signaling of the respective radio access technology. For detailed information on the
configuration of the R&S® CMW500 please contact your R&S sales office.
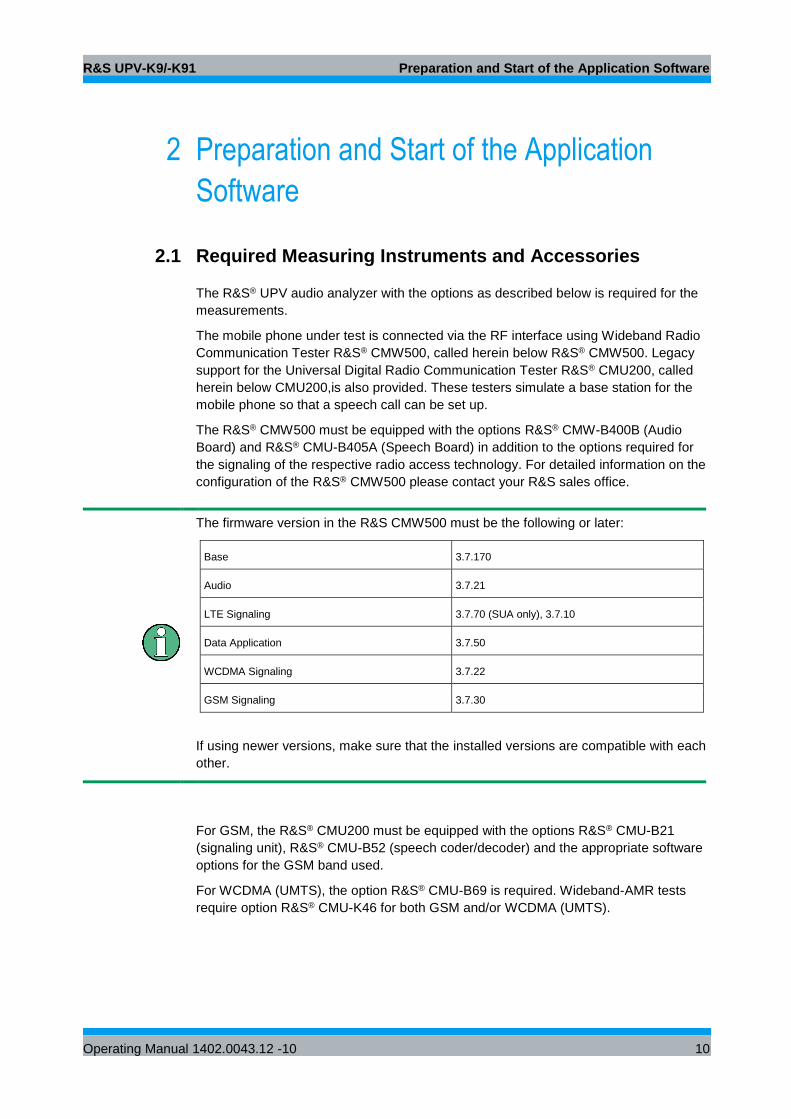
The firmware version in the R&S CMW500 must be the following or later:
Base 3.7.170
Audio 3.7.21
LTE Signaling 3.7.70 (SUA only), 3.7.10
Data Application 3.7.50
WCDMA Signaling 3.7.22
GSM Signaling 3.7.30
If using newer versions, make sure that the installed versions are compatible with each
other.
For GSM, the R&S® CMU200 must be equipped with the options R&S® CMU-B21
(signaling unit), R&S® CMU-B52 (speech coder/decoder) and the appropriate software
options for the GSM band used.
For WCDMA (UMTS), the option R&S® CMU-B69 is required. Wideband-AMR tests
require option R&S® CMU-K46 for both GSM and/or WCDMA (UMTS).
R&S UPV-K9/-K91 Preparation and Start of the Application Software
Operating Manual 1402.0043.12 -10 11
The firmware version in the R&S® CMU200 must be 5.04 or higher.
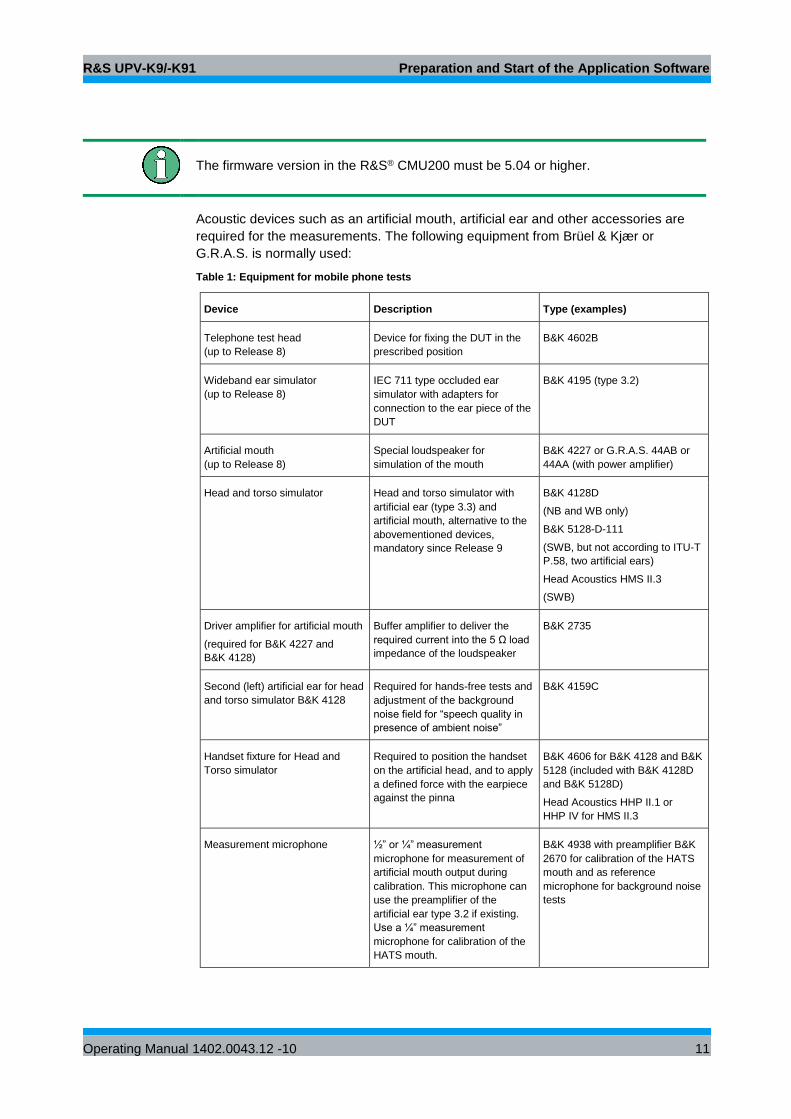
Acoustic devices such as an artificial mouth, artificial ear and other accessories are
required for the measurements. The following equipment from Brüel & Kjær or
G.R.A.S. is normally used:
Table 1: Equipment for mobile phone tests
Device Description Type (examples)
Telephone test head
(up to Release 8)
Device for fixing the DUT in the
prescribed position
B&K 4602B
Wideband ear simulator
(up to Release 8)
IEC 711 type occluded ear
simulator with adapters for
connection to the ear piece of the
DUT
B&K 4195 (type 3.2)
Artificial mouth
(up to Release 8)
Special loudspeaker for
simulation of the mouth
B&K 4227 or G.R.A.S. 44AB or
44AA (with power amplifier)
Head and torso simulator Head and torso simulator with
artificial ear (type 3.3) and
artificial mouth, alternative to the
abovementioned devices,
mandatory since Release 9
B&K 4128D
(NB and WB only)
B&K 5128-D-111
(SWB, but not according to ITU-T
P.58, two artificial ears)
Head Acoustics HMS II.3
(SWB)
Driver amplifier for artificial mouth
(required for B&K 4227 and
B&K 4128)
Buffer amplifier to deliver the
required current into the 5 Ω load
impedance of the loudspeaker
B&K 2735
Second (left) artificial ear for head
and torso simulator B&K 4128
Required for hands-free tests and
adjustment of the background
noise field for “speech quality in
presence of ambient noise”
B&K 4159C
Handset fixture for Head and
Torso simulator
Required to position the handset
on the artificial head, and to apply
a defined force with the earpiece
against the pinna
B&K 4606 for B&K 4128 and B&K
5128 (included with B&K 4128D
and B&K 5128D)
Head Acoustics HHP II.1 or
HHP IV for HMS II.3
Measurement microphone ½” or ¼” measurement
microphone for measurement of
artificial mouth output during
calibration. This microphone can
use the preamplifier of the
artificial ear type 3.2 if existing.
Use a ¼” measurement
microphone for calibration of the
HATS mouth.
B&K 4938 with preamplifier B&K
2670 for calibration of the HATS
mouth and as reference
microphone for background noise
tests
R&S UPV-K9/-K91 Preparation and Start of the Application Software
Operating Manual 1402.0043.12 -10 12
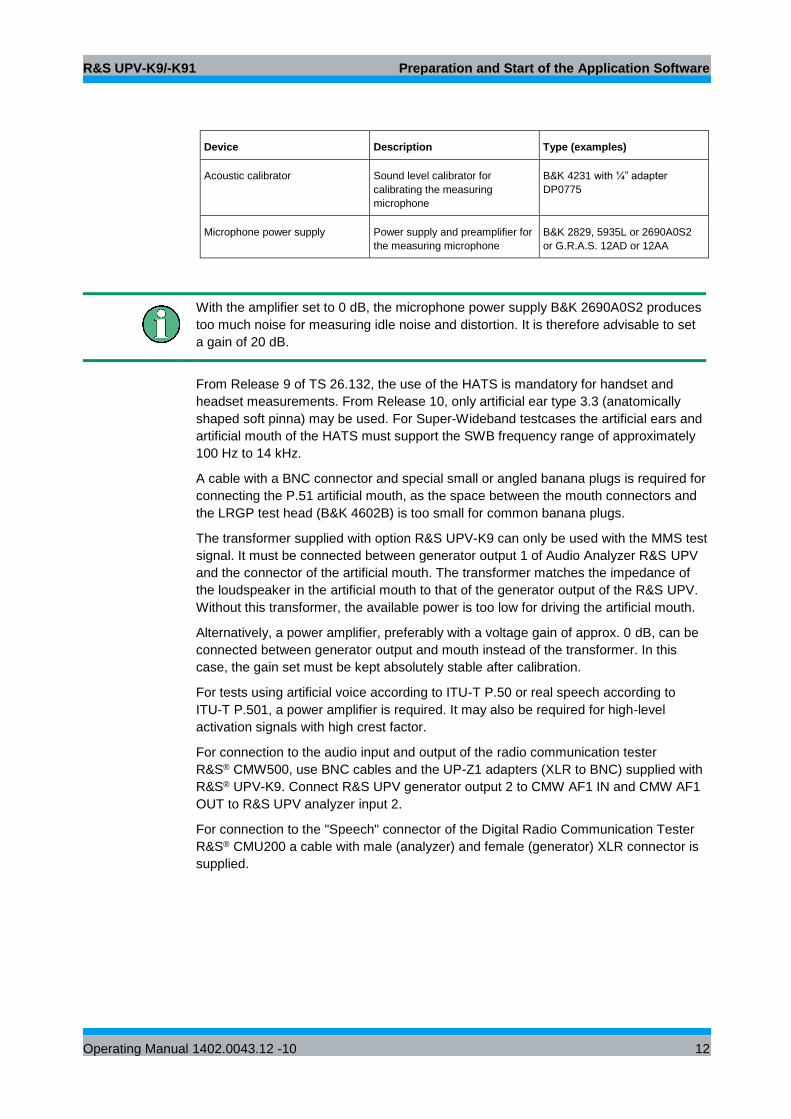
Device Description Type (examples)
Acoustic calibrator Sound level calibrator for
calibrating the measuring
microphone
B&K 4231 with ¼” adapter
DP0775
Microphone power supply Power supply and preamplifier for
the measuring microphone
B&K 2829, 5935L or 2690A0S2
or G.R.A.S. 12AD or 12AA
With the amplifier set to 0 dB, the microphone power supply B&K 2690A0S2 produces
too much noise for measuring idle noise and distortion. It is therefore advisable to set
a gain of 20 dB.
From Release 9 of TS 26.132, the use of the HATS is mandatory for handset and
headset measurements. From Release 10, only artificial ear type 3.3 (anatomically
shaped soft pinna) may be used. For Super-Wideband testcases the artificial ears and
artificial mouth of the HATS must support the SWB frequency range of approximately
100 Hz to 14 kHz.
A cable with a BNC connector and special small or angled banana plugs is required for
connecting the P.51 artificial mouth, as the space between the mouth connectors and
the LRGP test head (B&K 4602B) is too small for common banana plugs.
The transformer supplied with option R&S UPV-K9 can only be used with the MMS test
signal. It must be connected between generator output 1 of Audio Analyzer R&S UPV
and the connector of the artificial mouth. The transformer matches the impedance of
the loudspeaker in the artificial mouth to that of the generator output of the R&S UPV.
Without this transformer, the available power is too low for driving the artificial mouth.
Alternatively, a power amplifier, preferably with a voltage gain of approx. 0 dB, can be
connected between generator output and mouth instead of the transformer. In this
case, the gain set must be kept absolutely stable after calibration.
For tests using artificial voice according to ITU-T P.50 or real speech according to
ITU-T P.501, a power amplifier is required. It may also be required for high-level
activation signals with high crest factor.
For connection to the audio input and output of the radio communication tester
R&S® CMW500, use BNC cables and the UP-Z1 adapters (XLR to BNC) supplied with
R&S® UPV-K9. Connect R&S UPV generator output 2 to CMW AF1 IN and CMW AF1
OUT to R&S UPV analyzer input 2.
For connection to the "Speech" connector of the Digital Radio Communication Tester
R&S® CMU200 a cable with male (analyzer) and female (generator) XLR connector is
supplied.
R&S UPV-K9/-K91 Preparation and Start of the Application Software
Operating Manual 1402.0043.12 -10 13
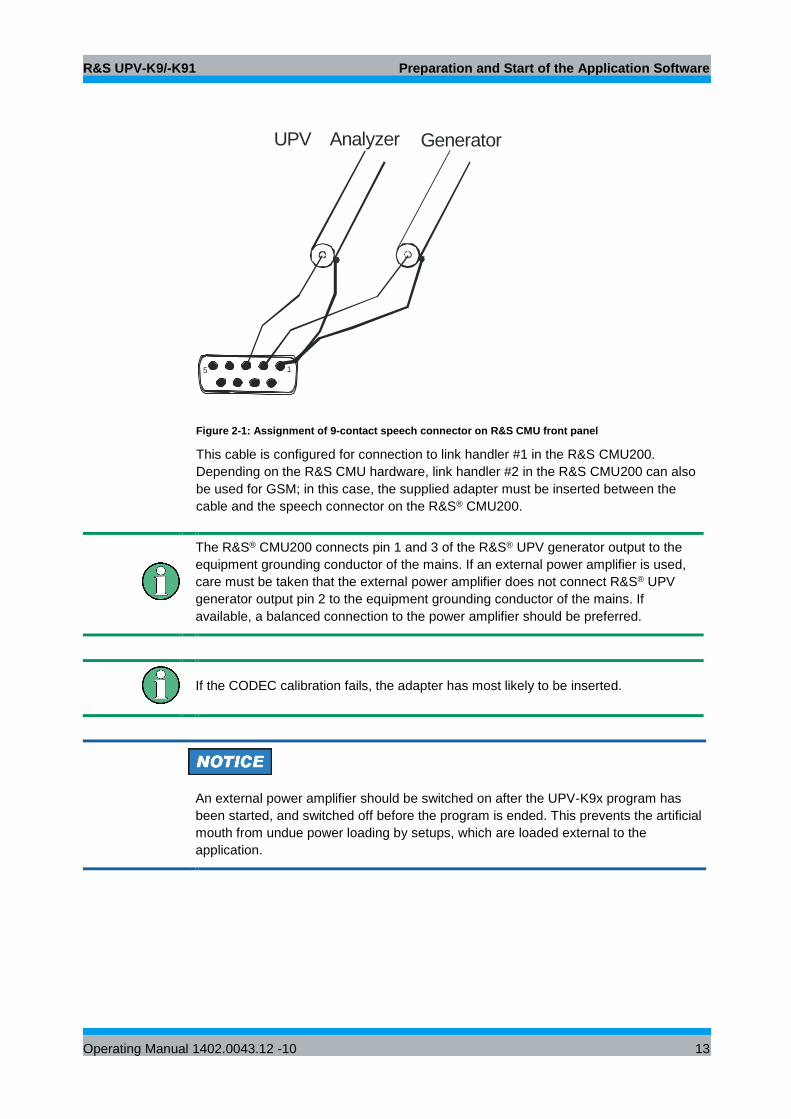
UPV Analyzer Generator
5 1
Figure 2-1: Assignment of 9-contact speech connector on R&S CMU front panel
This cable is configured for connection to link handler #1 in the R&S CMU200.
Depending on the R&S CMU hardware, link handler #2 in the R&S CMU200 can also
be used for GSM; in this case, the supplied adapter must be inserted between the
cable and the speech connector on the R&S® CMU200.
The R&S® CMU200 connects pin 1 and 3 of the R&S® UPV generator output to the
equipment grounding conductor of the mains. If an external power amplifier is used,
care must be taken that the external power amplifier does not connect R&S® UPV
generator output pin 2 to the equipment grounding conductor of the mains. If
available, a balanced connection to the power amplifier should be preferred.
If the CODEC calibration fails, the adapter has most likely to be inserted.
An external power amplifier should be switched on after the UPV-K9x program has
been started, and switched off before the program is ended. This prevents the artificial
mouth from undue power loading by setups, which are loaded external to the
application.
R&S UPV-K9/-K91 Preparation and Start of the Application Software
Operating Manual 1402.0043.12 -10 14
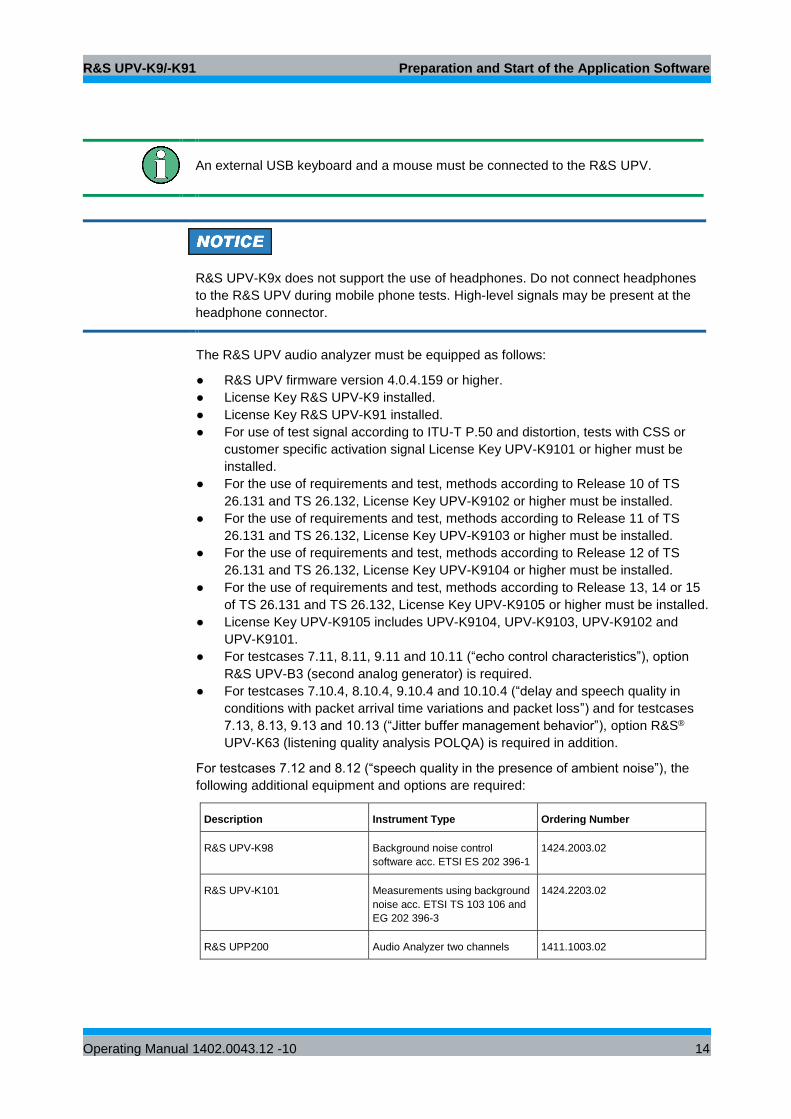
An external USB keyboard and a mouse must be connected to the R&S UPV.
R&S UPV-K9x does not support the use of headphones. Do not connect headphones
to the R&S UPV during mobile phone tests. High-level signals may be present at the
headphone connector.
The R&S UPV audio analyzer must be equipped as follows:
● R&S UPV firmware version 4.0.4.159 or higher.
● License Key R&S UPV-K9 installed.
● License Key R&S UPV-K91 installed.
● For use of test signal according to ITU-T P.50 and distortion, tests with CSS or
customer specific activation signal License Key UPV-K9101 or higher must be
installed.
● For the use of requirements and test, methods according to Release 10 of TS
26.131 and TS 26.132, License Key UPV-K9102 or higher must be installed.
● For the use of requirements and test, methods according to Release 11 of TS
26.131 and TS 26.132, License Key UPV-K9103 or higher must be installed.
● For the use of requirements and test, methods according to Release 12 of TS
26.131 and TS 26.132, License Key UPV-K9104 or higher must be installed.
● For the use of requirements and test, methods according to Release 13, 14 or 15
of TS 26.131 and TS 26.132, License Key UPV-K9105 or higher must be installed.
● License Key UPV-K9105 includes UPV-K9104, UPV-K9103, UPV-K9102 and
UPV-K9101.
● For testcases 7.11, 8.11, 9.11 and 10.11 (“echo control characteristics”), option
R&S UPV-B3 (second analog generator) is required.
● For testcases 7.10.4, 8.10.4, 9.10.4 and 10.10.4 (“delay and speech quality in
conditions with packet arrival time variations and packet loss”) and for testcases
7.13, 8.13, 9.13 and 10.13 (“Jitter buffer management behavior”), option R&S®
UPV-K63 (listening quality analysis POLQA) is required in addition.
For testcases 7.12 and 8.12 (“speech quality in the presence of ambient noise”), the
following additional equipment and options are required:
Description Instrument Type Ordering Number
R&S UPV-K98 Background noise control
software acc. ETSI ES 202 396-1
1424.2003.02
R&S UPV-K101 Measurements using background
noise acc. ETSI TS 103 106 and
EG 202 396-3
1424.2203.02
R&S UPP200 Audio Analyzer two channels 1411.1003.02
R&S UPV-K9/-K91 Preparation and Start of the Application Software
Operating Manual 1402.0043.12 -10 15
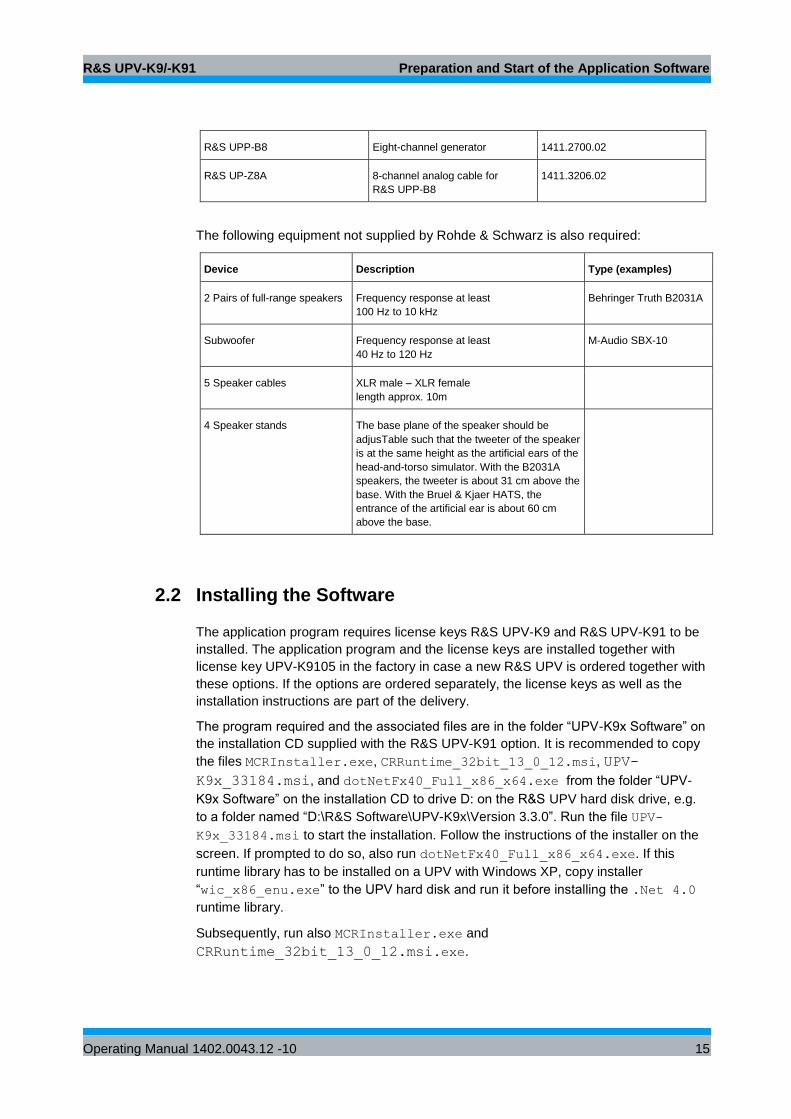
R&S UPP-B8 Eight-channel generator 1411.2700.02
R&S UP-Z8A 8-channel analog cable for
R&S UPP-B8
1411.3206.02
The following equipment not supplied by Rohde & Schwarz is also required:
Device Description Type (examples)
2 Pairs of full-range speakers Frequency response at least
100 Hz to 10 kHz
Behringer Truth B2031A
Subwoofer Frequency response at least
40 Hz to 120 Hz
M-Audio SBX-10
5 Speaker cables
XLR male – XLR female
length approx. 10m
4 Speaker stands The base plane of the speaker should be
adjusTable such that the tweeter of the speaker
is at the same height as the artificial ears of the
head-and-torso simulator. With the B2031A
speakers, the tweeter is about 31 cm above the
base. With the Bruel & Kjaer HATS, the
entrance of the artificial ear is about 60 cm
above the base.
2.2 Installing the Software
The application program requires license keys R&S UPV-K9 and R&S UPV-K91 to be
installed. The application program and the license keys are installed together with
license key UPV-K9105 in the factory in case a new R&S UPV is ordered together with
these options. If the options are ordered separately, the license keys as well as the
installation instructions are part of the delivery.
The program required and the associated files are in the folder “UPV-K9x Software” on
the installation CD supplied with the R&S UPV-K91 option. It is recommended to copy
the files MCRInstaller.exe, CRRuntime_32bit_13_0_12.msi, UPV-
K9x_33184.msi, and dotNetFx40_Full_x86_x64.exe from the folder “UPV-
K9x Software” on the installation CD to drive D: on the R&S UPV hard disk drive, e.g.
to a folder named “D:\R&S Software\UPV-K9x\Version 3.3.0”. Run the file UPV-
K9x_33184.msi to start the installation. Follow the instructions of the installer on the
screen. If prompted to do so, also run dotNetFx40_Full_x86_x64.exe. If this
runtime library has to be installed on a UPV with Windows XP, copy installer
“wic_x86_enu.exe” to the UPV hard disk and run it before installing the .Net 4.0
runtime library.
Subsequently, run also MCRInstaller.exe and
CRRuntime_32bit_13_0_12.msi.exe.
R&S UPV-K9/-K91 Preparation and Start of the Application Software
Operating Manual 1402.0043.12 -10 16
Note (1)
MCRInstaller.exe must be run, unless UPV-K9x software version 3.0.3.56 or
higher or UPV-K9y software version 3.0.0.65 (or higher) is already installed on the
R&S UPV.
Note (2)
If a UPV-K9y software version below 3.0.0.65 is installed it is recommended to update
to the latest version (currently 3.1.0.69).
Note (3)
Prior to an upgrade of UPV-K9x software from version 2.3.1 or below the program
“MATLAB® Component Runtime” must be de-installed using the windows tool “Add or
Remove programs” (XP) or “Programs and Features” (Win7) respectively.
Note (4)
In case it is desired to run an older version of the UPV-K9y software, the old version of
MCRInstaller.exe (from the older version UPV-K9y installation CD) must be re-
installed after installation of the new version.
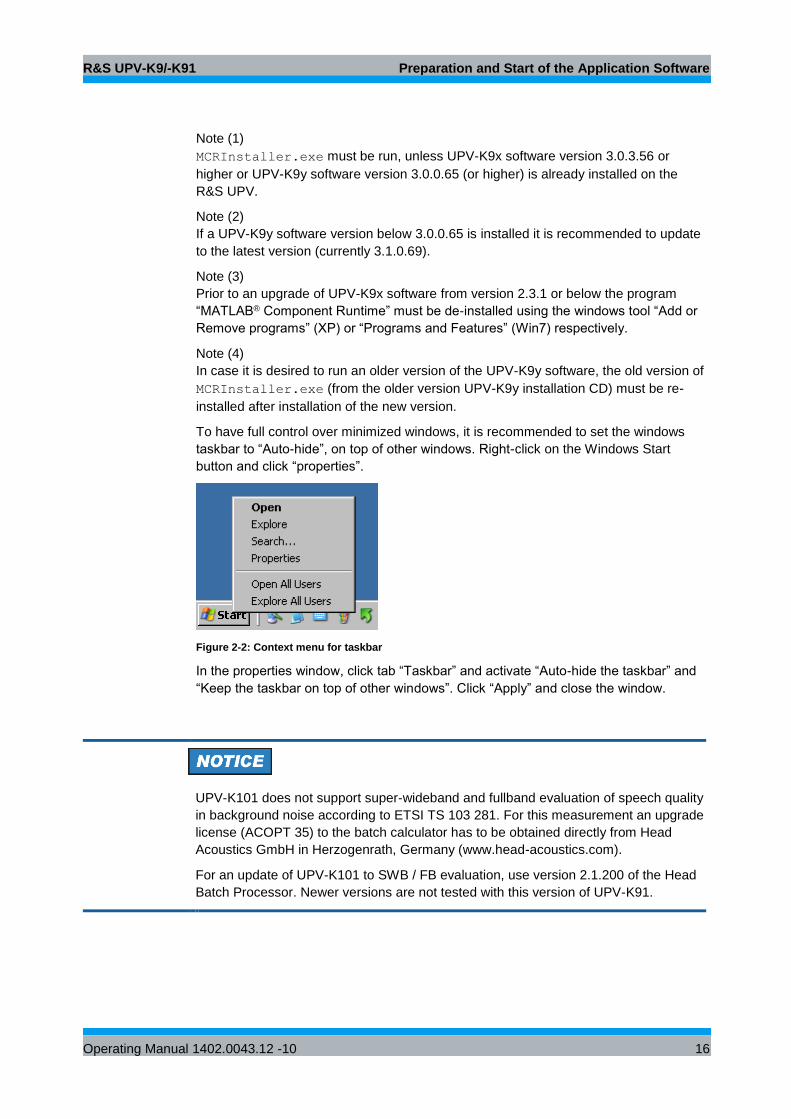
To have full control over minimized windows, it is recommended to set the windows
taskbar to “Auto-hide”, on top of other windows. Right-click on the Windows Start
button and click “properties”.
Figure 2-2: Context menu for taskbar
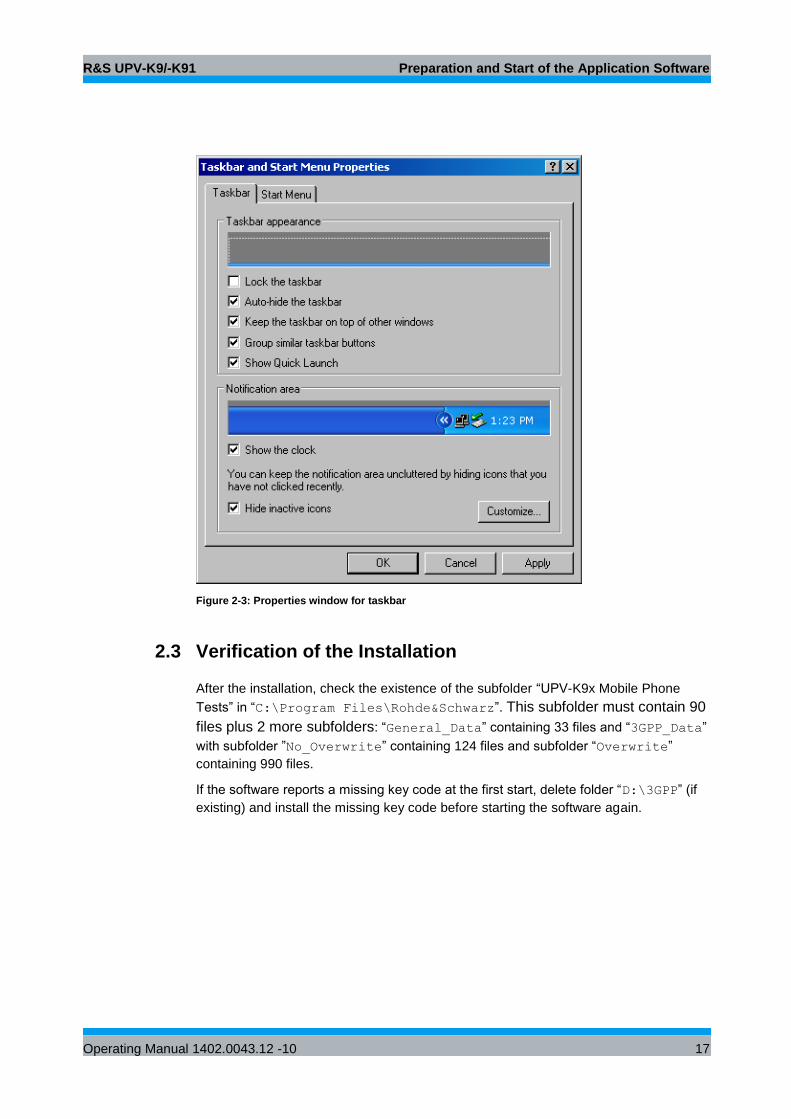
In the properties window, click tab “Taskbar” and activate “Auto-hide the taskbar” and
“Keep the taskbar on top of other windows”. Click “Apply” and close the window.
UPV-K101 does not support super-wideband and fullband evaluation of speech quality
in background noise according to ETSI TS 103 281. For this measurement an upgrade
license (ACOPT 35) to the batch calculator has to be obtained directly from Head
Acoustics GmbH in Herzogenrath, Germany (www.head-acoustics.com).
For an update of UPV-K101 to SWB / FB evaluation, use version 2.1.200 of the Head
Batch Processor. Newer versions are not tested with this version of UPV-K91.
R&S UPV-K9/-K91 Preparation and Start of the Application Software
Operating Manual 1402.0043.12 -10 17
Figure 2-3: Properties window for taskbar
2.3 Verification of the Installation
After the installation, check the existence of the subfolder “UPV-K9x Mobile Phone
Tests” in “C:\Program Files\Rohde&Schwarz”. This subfolder must contain 90
files plus 2 more subfolders: “General_Data” containing 33 files and “3GPP_Data”
with subfolder ”No_Overwrite” containing 124 files and subfolder “Overwrite”
containing 990 files.
If the software reports a missing key code at the first start, delete folder “D:\3GPP” (if
existing) and install the missing key code before starting the software again.
R&S UPV-K9/-K91 Preparation and Start of the Application Software
Operating Manual 1402.0043.12 -10 18
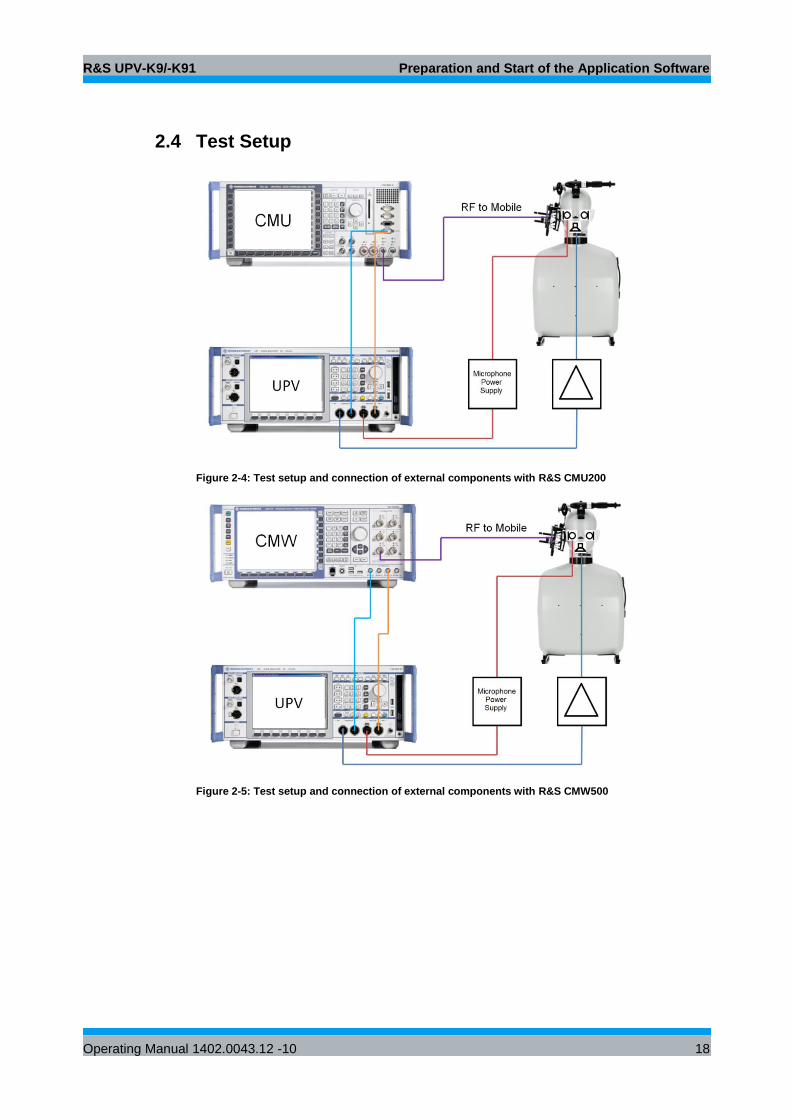
2.4 Test Setup
Figure 2-4: Test setup and connection of external components with R&S CMU200
Figure 2-5: Test setup and connection of external components with R&S CMW500
R&S UPV-K9/-K91 Preparation and Start of the Application Software
Operating Manual 1402.0043.12 -10 19
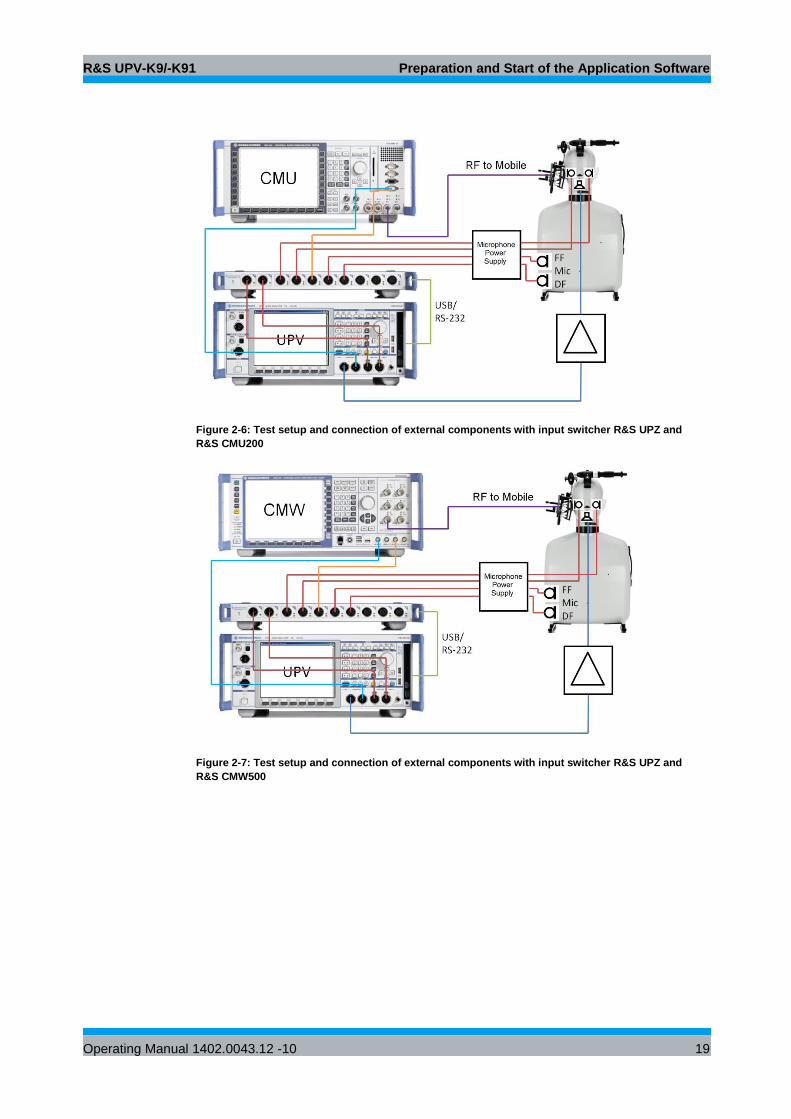
Figure 2-6: Test setup and connection of external components with input switcher R&S UPZ and
R&S CMU200
Figure 2-7: Test setup and connection of external components with input switcher R&S UPZ and
R&S CMW500
R&S UPV-K9/-K91 Preparation and Start of the Application Software
Operating Manual 1402.0043.12 -10 20
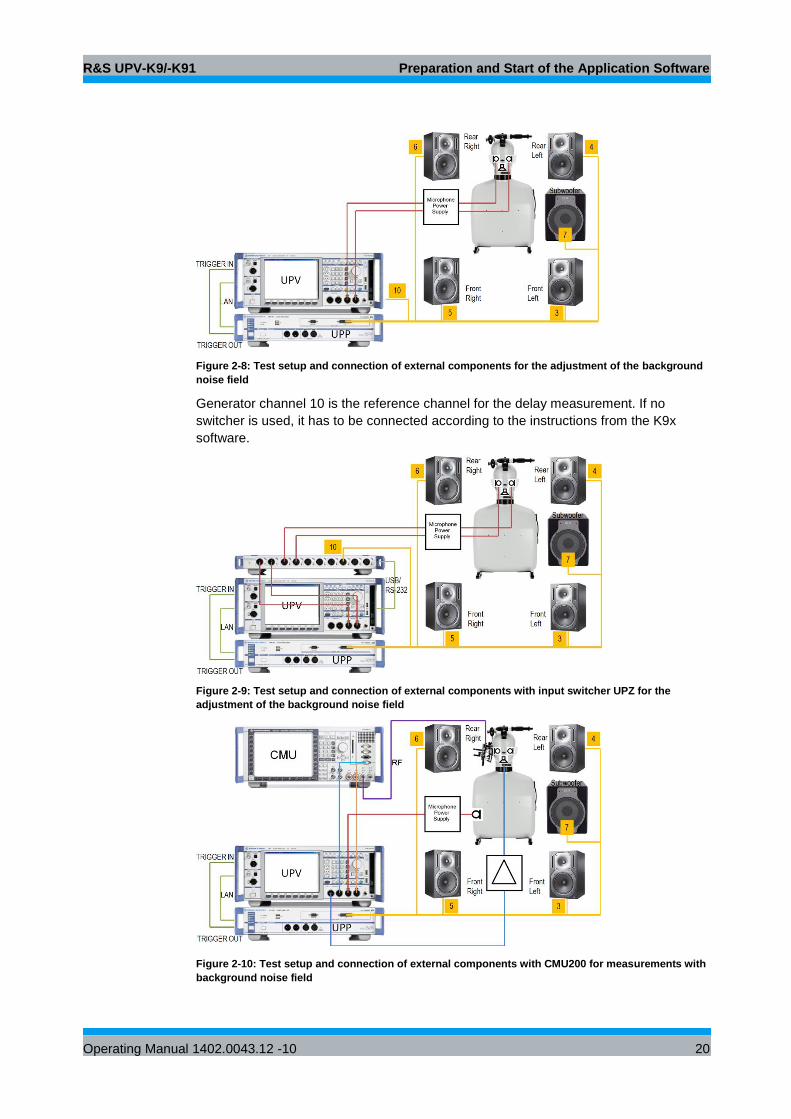
Figure 2-8: Test setup and connection of external components for the adjustment of the background
noise field
Generator channel 10 is the reference channel for the delay measurement. If no
switcher is used, it has to be connected according to the instructions from the K9x
software.
Figure 2-9: Test setup and connection of external components with input switcher UPZ for the
adjustment of the background noise field
Figure 2-10: Test setup and connection of external components with CMU200 for measurements with
background noise field
R&S UPV-K9/-K91 Preparation and Start of the Application Software
Operating Manual 1402.0043.12 -10 21
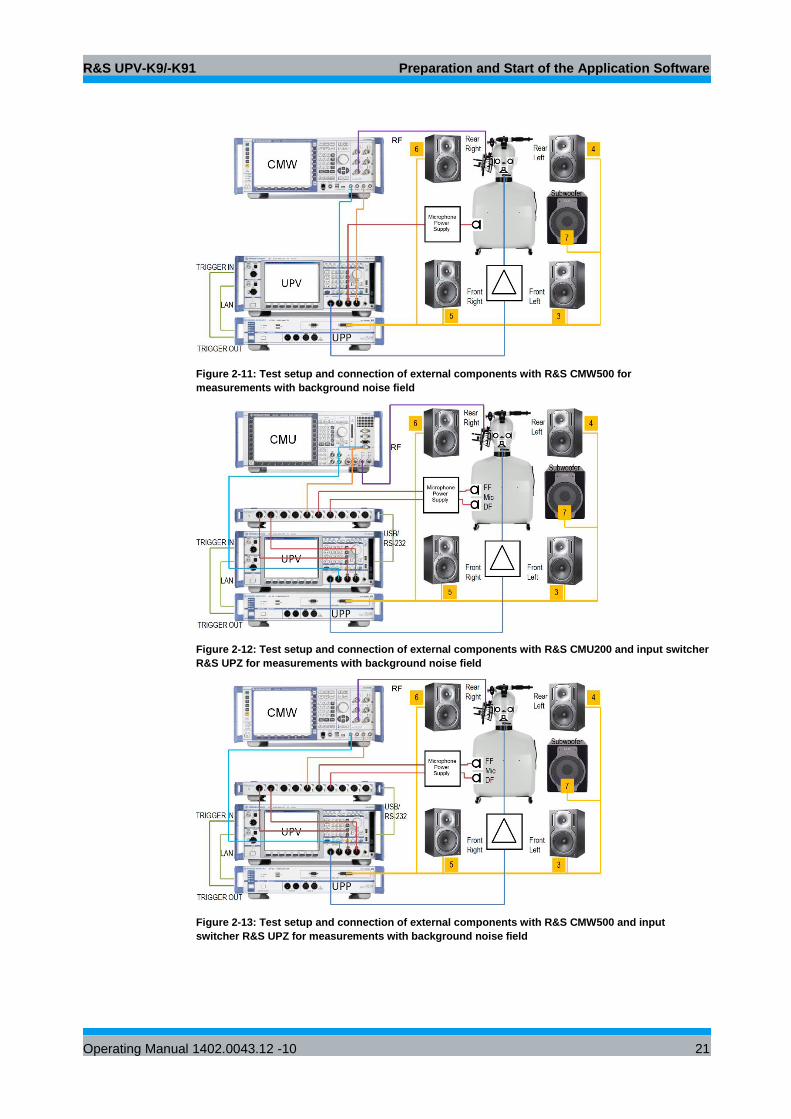
Figure 2-11: Test setup and connection of external components with R&S CMW500 for
measurements with background noise field
Figure 2-12: Test setup and connection of external components with R&S CMU200 and input switcher
R&S UPZ for measurements with background noise field
Figure 2-13: Test setup and connection of external components with R&S CMW500 and input
switcher R&S UPZ for measurements with background noise field
R&S UPV-K9/-K91 Preparation and Start of the Application Software
Operating Manual 1402.0043.12 -10 22
In case of hum noise in one or more of the speakers, it may be necessary to insert an
isolating audio transformer between the output of UPP-B8 and the input of the speaker.
It may also help to connect the speaker to the same power outlet as the UPP.
Switching of connections between tests is required for binaural measurements
(handsfree tests and tests of binaural headsets) and for calibration, in particular for the
adjustment of the background noise reproduction. In the setups in Figure 2-4,
Figure 2-5, Figure 2-8, Figure 2-10 and Figure 2-11, connections have to be changed
manually between tests and even during the background noise adjustment. This can
be avoided by using an R&S UPZ12 input switcher as shown in Figure 2-6, Figure 2-7,
Figure 2-9, Figure 2-12 and Figure 2-13.
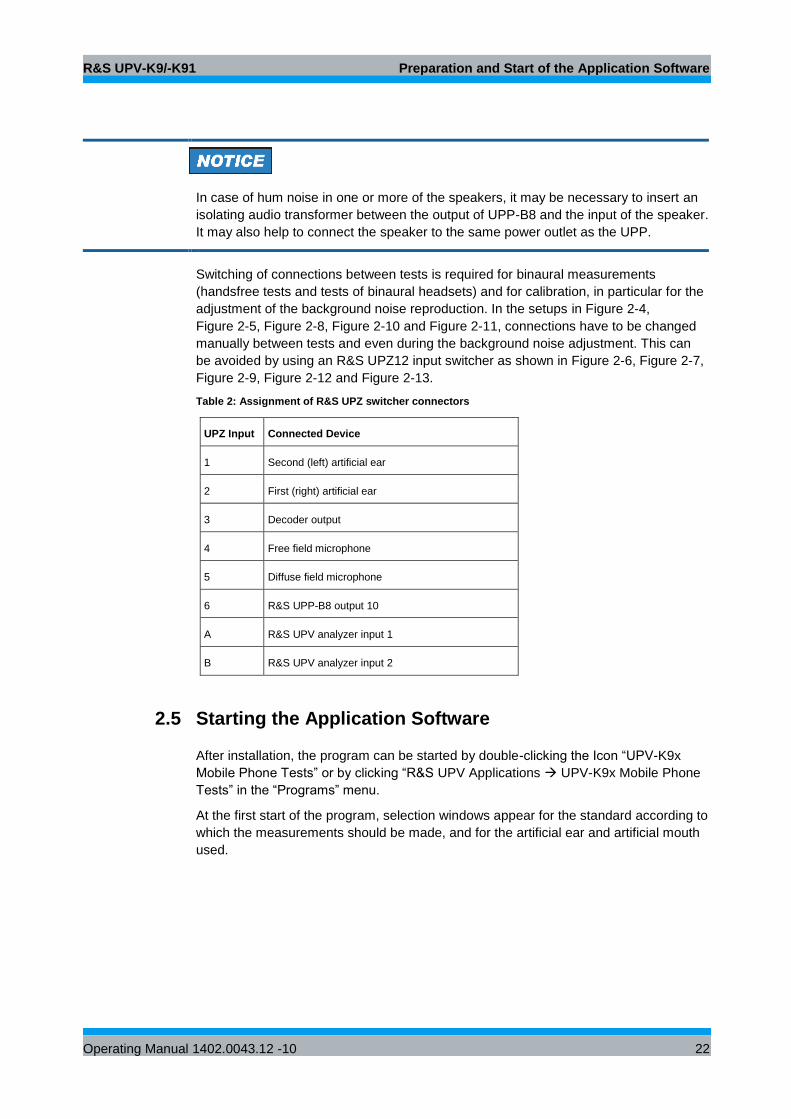
Table 2: Assignment of R&S UPZ switcher connectors
UPZ Input Connected Device
1 Second (left) artificial ear
2 First (right) artificial ear
3 Decoder output
4 Free field microphone
5 Diffuse field microphone
6 R&S UPP-B8 output 10
A R&S UPV analyzer input 1
B R&S UPV analyzer input 2
2.5 Starting the Application Software
After installation, the program can be started by double-clicking the Icon “UPV-K9x
Mobile Phone Tests” or by clicking “R&S UPV Applications UPV-K9x Mobile Phone
Tests” in the “Programs” menu.
At the first start of the program, selection windows appear for the standard according to
which the measurements should be made, and for the artificial ear and artificial mouth
used.
R&S UPV-K9/-K91 Preparation and Start of the Application Software
Operating Manual 1402.0043.12 -10 23
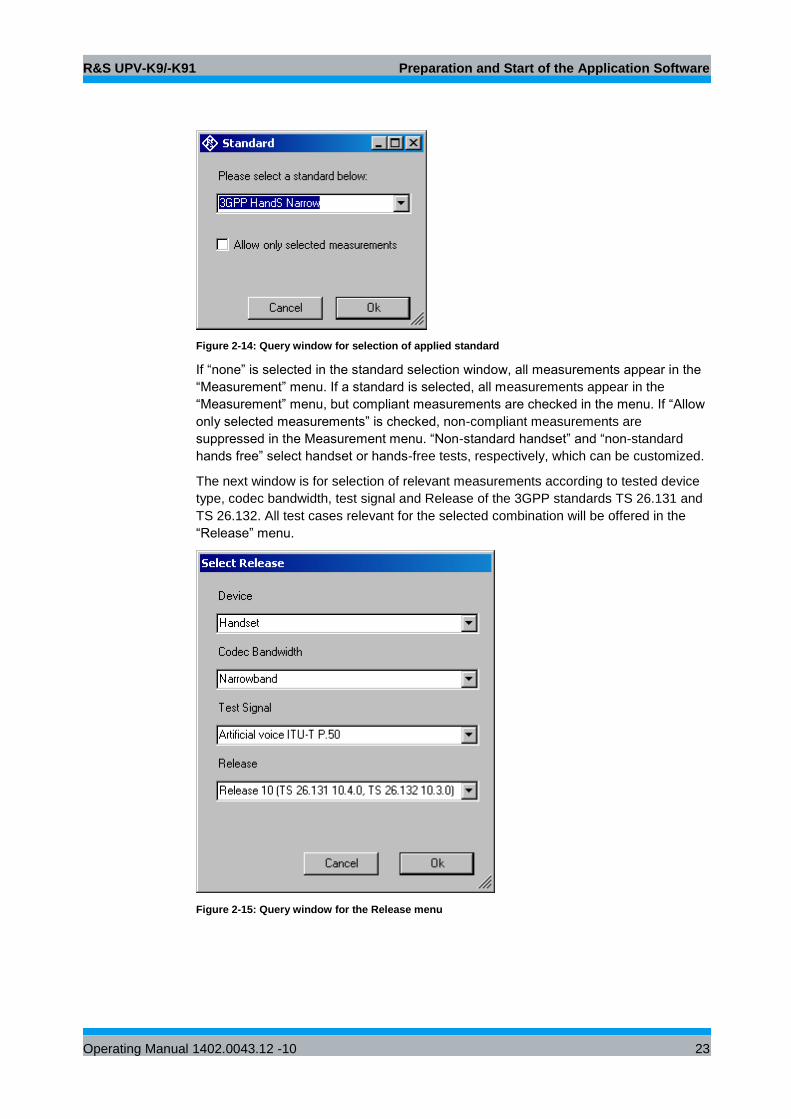
Figure 2-14: Query window for selection of applied standard
If “none” is selected in the standard selection window, all measurements appear in the
“Measurement” menu. If a standard is selected, all measurements appear in the
“Measurement” menu, but compliant measurements are checked in the menu. If “Allow
only selected measurements” is checked, non-compliant measurements are
suppressed in the Measurement menu. “Non-standard handset” and “non-standard
hands free” select handset or hands-free tests, respectively, which can be customized.
The next window is for selection of relevant measurements according to tested device
type, codec bandwidth, test signal and Release of the 3GPP standards TS 26.131 and
TS 26.132. All test cases relevant for the selected combination will be offered in the
“Release” menu.
Figure 2-15: Query window for the Release menu
R&S UPV-K9/-K91 Preparation and Start of the Application Software
Operating Manual 1402.0043.12 -10 24
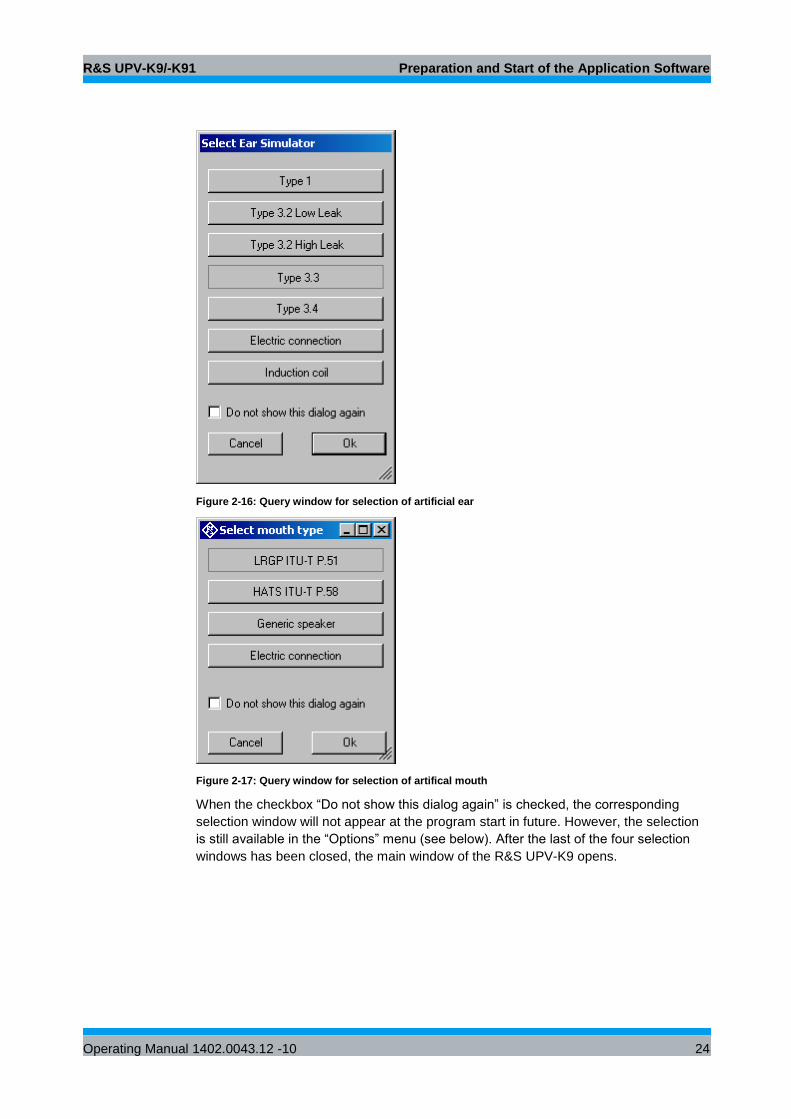
Figure 2-16: Query window for selection of artificial ear
Figure 2-17: Query window for selection of artifical mouth
When the checkbox “Do not show this dialog again” is checked, the corresponding
selection window will not appear at the program start in future. However, the selection
is still available in the “Options” menu (see below). After the last of the four selection
windows has been closed, the main window of the R&S UPV-K9 opens.
R&S UPV-K9/-K91 Preparation and Start of the Application Software
Operating Manual 1402.0043.12 -10 25
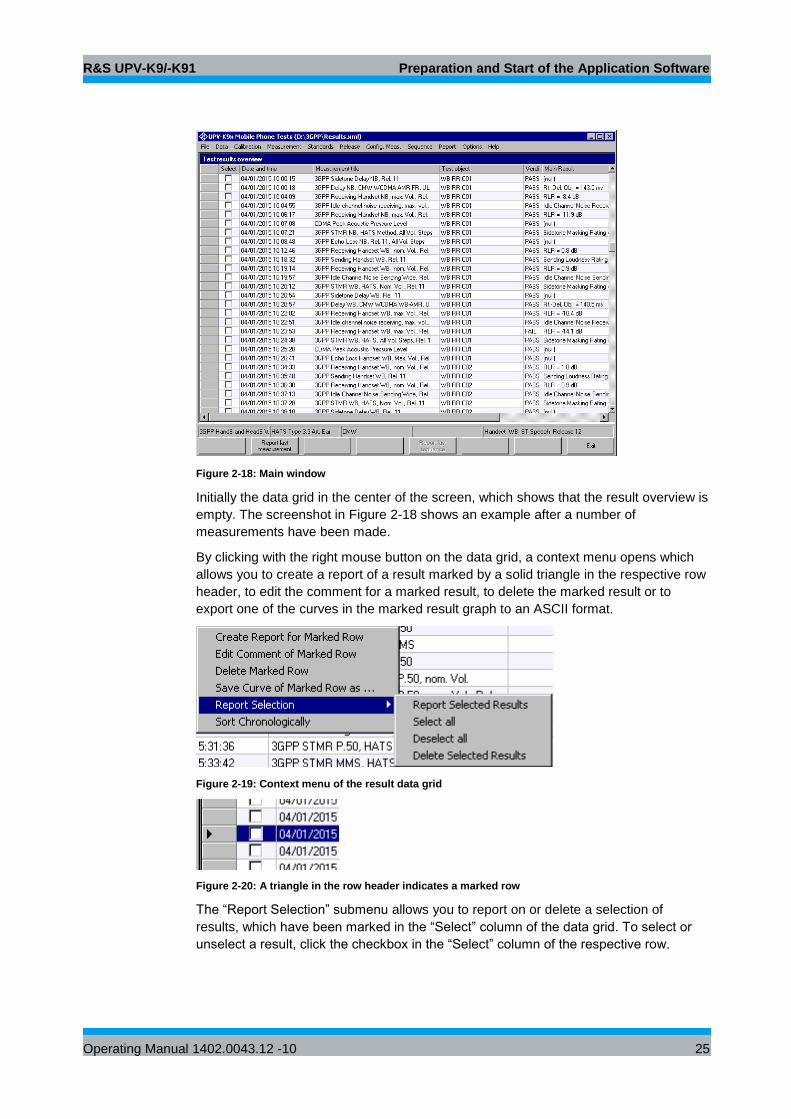
Figure 2-18: Main window
Initially the data grid in the center of the screen, which shows that the result overview is
empty. The screenshot in Figure 2-18 shows an example after a number of
measurements have been made.
By clicking with the right mouse button on the data grid, a context menu opens which
allows you to create a report of a result marked by a solid triangle in the respective row
header, to edit the comment for a marked result, to delete the marked result or to
export one of the curves in the marked result graph to an ASCII format.
Figure 2-19: Context menu of the result data grid
Figure 2-20: A triangle in the row header indicates a marked row
The “Report Selection” submenu allows you to report on or delete a selection of
results, which have been marked in the “Select” column of the data grid. To select or
unselect a result, click the checkbox in the “Select” column of the respective row.
R&S UPV-K9/-K91 Preparation and Start of the Application Software
Operating Manual 1402.0043.12 -10 26
If the results have been sorted alphabetically according to one of the columns by
clicking on the respective column header, the chronological order can be restored
using the context menu item “Sort Chronologically”.
Operating Concept
R&S 3GPP mobile phone tests consist of the main user interface window, which allows
general settings, calibration routines, data handling, automatic sequencing and
reporting tools, and of test macros for basic measurement types defined in the
standards. Each measurement type provides a set of parameters (R&S UPV setup
files, limits etc.) which are defined in separated measurement definition files, one for
each test case.
Do not attempt to modify files with extensions “set”, “sup”, “xml”, “cal” “seq” or “mdf”,
using a text editor. Any change with a text editor may make the files unusable and
cause malfunction of the software.
R&S UPV-K9/-K91 Preparation and Start of the Application Software
Operating Manual 1402.0043.12 -10 27
2.6 Options (General settings)
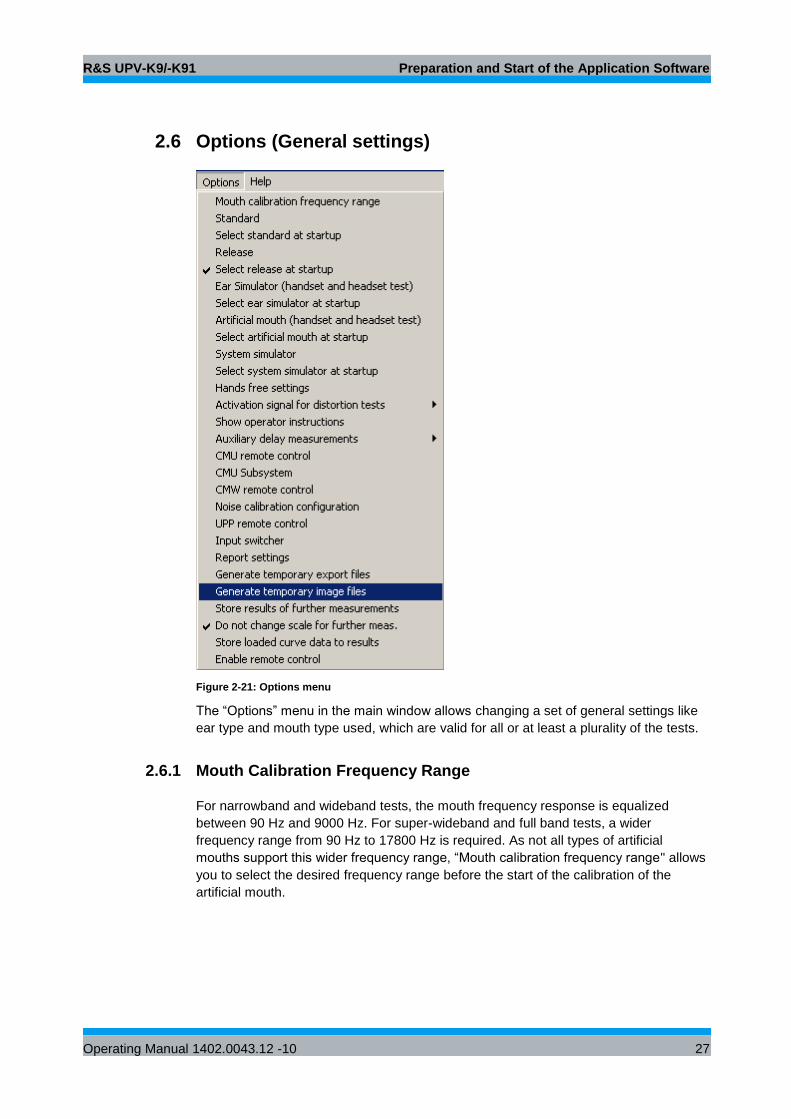
Figure 2-21: Options menu
The “Options” menu in the main window allows changing a set of general settings like
ear type and mouth type used, which are valid for all or at least a plurality of the tests.
2.6.1 Mouth Calibration Frequency Range
For narrowband and wideband tests, the mouth frequency response is equalized
between 90 Hz and 9000 Hz. For super-wideband and full band tests, a wider
frequency range from 90 Hz to 17800 Hz is required. As not all types of artificial
mouths support this wider frequency range, “Mouth calibration frequency range" allows
you to select the desired frequency range before the start of the calibration of the
artificial mouth.
R&S UPV-K9/-K91 Preparation and Start of the Application Software
Operating Manual 1402.0043.12 -10 28
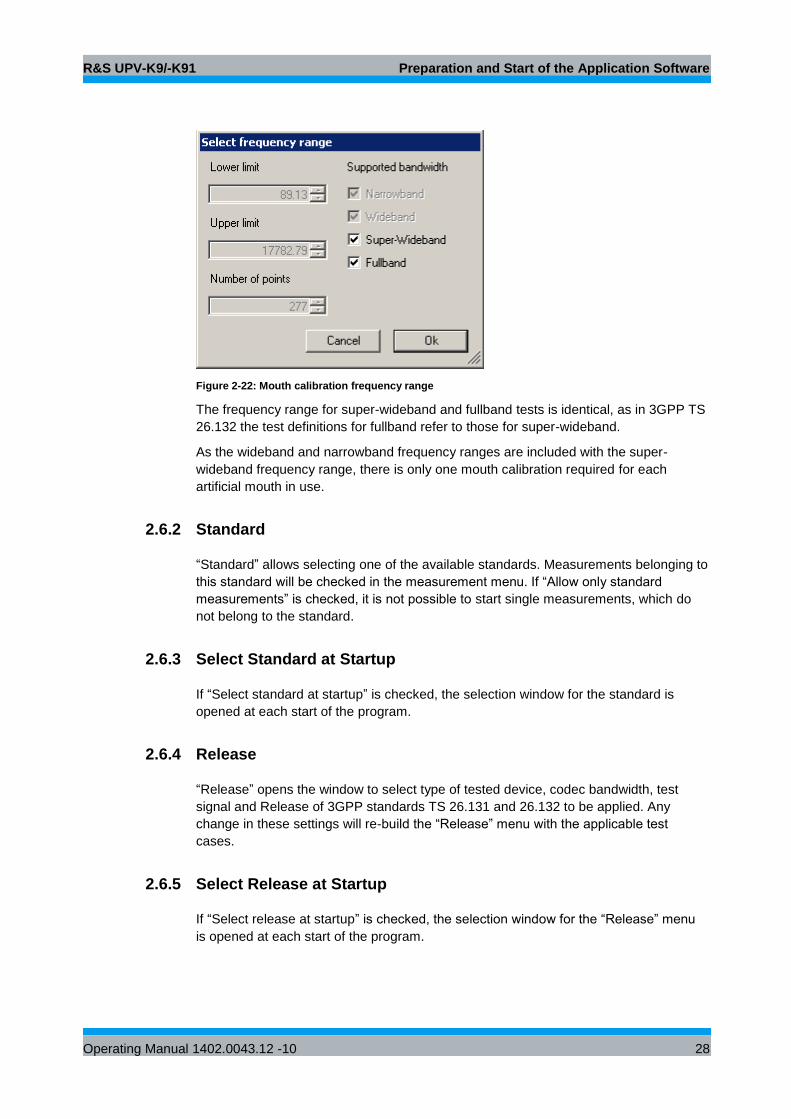
Figure 2-22: Mouth calibration frequency range
The frequency range for super-wideband and fullband tests is identical, as in 3GPP TS
26.132 the test definitions for fullband refer to those for super-wideband.
As the wideband and narrowband frequency ranges are included with the super-
wideband frequency range, there is only one mouth calibration required for each
artificial mouth in use.
2.6.2 Standard
“Standard” allows selecting one of the available standards. Measurements belonging to
this standard will be checked in the measurement menu. If “Allow only standard
measurements” is checked, it is not possible to start single measurements, which do
not belong to the standard.
2.6.3 Select Standard at Startup
If “Select standard at startup” is checked, the selection window for the standard is
opened at each start of the program.
2.6.4 Release
“Release” opens the window to select type of tested device, codec bandwidth, test
signal and Release of 3GPP standards TS 26.131 and 26.132 to be applied. Any
change in these settings will re-build the “Release” menu with the applicable test
cases.
2.6.5 Select Release at Startup
If “Select release at startup” is checked, the selection window for the “Release” menu
is opened at each start of the program.
R&S UPV-K9/-K91 Preparation and Start of the Application Software
Operating Manual 1402.0043.12 -10 29
2.6.6 Ear Simulator
“Ear simulator” allows selecting the type of ear simulator used. For details on the
handling of calibration data, see section 3 Calibration below.
2.6.7 Select Ear Simulator at Startup
If “Select ear simulator at startup” is checked, the selection window for the ear
simulator is opened at each start of the program.
2.6.8 Artificial Mouth
“Artificial mouth” allows selecting the type of artificial mouth used. For details on the
handling of calibration data, see section 3 Calibration below.
2.6.9 Select Artificial Mouth at Startup
If “Select artificial mouth at startup” is checked, the selection window for the artificial
mouth is opened at each start of the program.
2.6.10 System Simulator
“System simulator” allows selecting the type of system simulator used. For details on
the handling of calibration data, see section 3 Calibration below.
2.6.11 Hands-free Settings
“Hands-free settings” allows selecting the acoustic instruments used for hands free
testing. It is possible to use an ITU-T P.51 artificial mouth together with a free field
microphone, a HATS with one artificial ear or a HATS with two artificial ears. If two
artificial ears are used, the decoder has to be disconnected from analyzer input 2 and
the second artificial ear has to be connected to it for receiving measurements. Do not
forget to re-connect the decoder for any measurement in sending direction.
2.6.12 Activation Signal for Distortion Tests
In the sub-menu to “Activation signal for distortion tests”, signals can be imported to
the test system. If more than one imported signal is available, it is possible to choose
one of them for actual use.
R&S UPV-K9/-K91 Preparation and Start of the Application Software
Operating Manual 1402.0043.12 -10 30
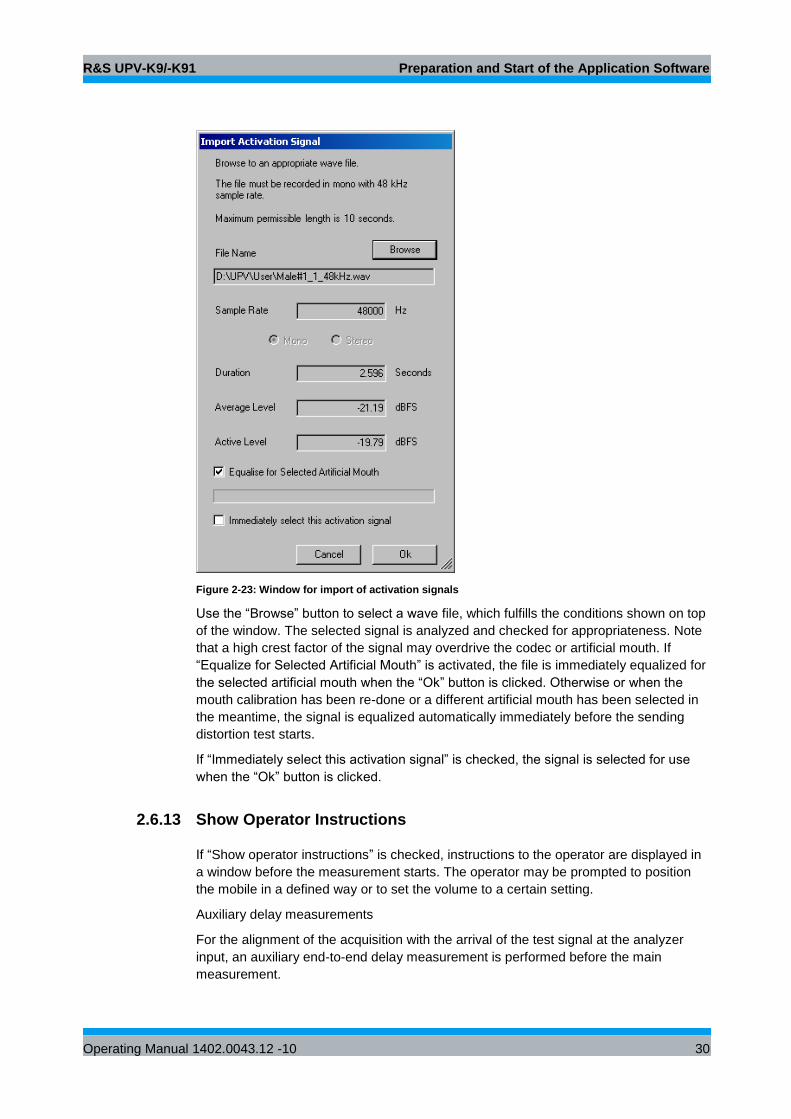
Figure 2-23: Window for import of activation signals
Use the “Browse” button to select a wave file, which fulfills the conditions shown on top
of the window. The selected signal is analyzed and checked for appropriateness. Note
that a high crest factor of the signal may overdrive the codec or artificial mouth. If
“Equalize for Selected Artificial Mouth” is activated, the file is immediately equalized for
the selected artificial mouth when the “Ok” button is clicked. Otherwise or when the
mouth calibration has been re-done or a different artificial mouth has been selected in
the meantime, the signal is equalized automatically immediately before the sending
distortion test starts.
If “Immediately select this activation signal” is checked, the signal is selected for use
when the “Ok” button is clicked.
2.6.13 Show Operator Instructions
If “Show operator instructions” is checked, instructions to the operator are displayed in
a window before the measurement starts. The operator may be prompted to position
the mobile in a defined way or to set the volume to a certain setting.
Auxiliary delay measurements
For the alignment of the acquisition with the arrival of the test signal at the analyzer
input, an auxiliary end-to-end delay measurement is performed before the main
measurement.
R&S UPV-K9/-K91 Preparation and Start of the Application Software
Operating Manual 1402.0043.12 -10 31
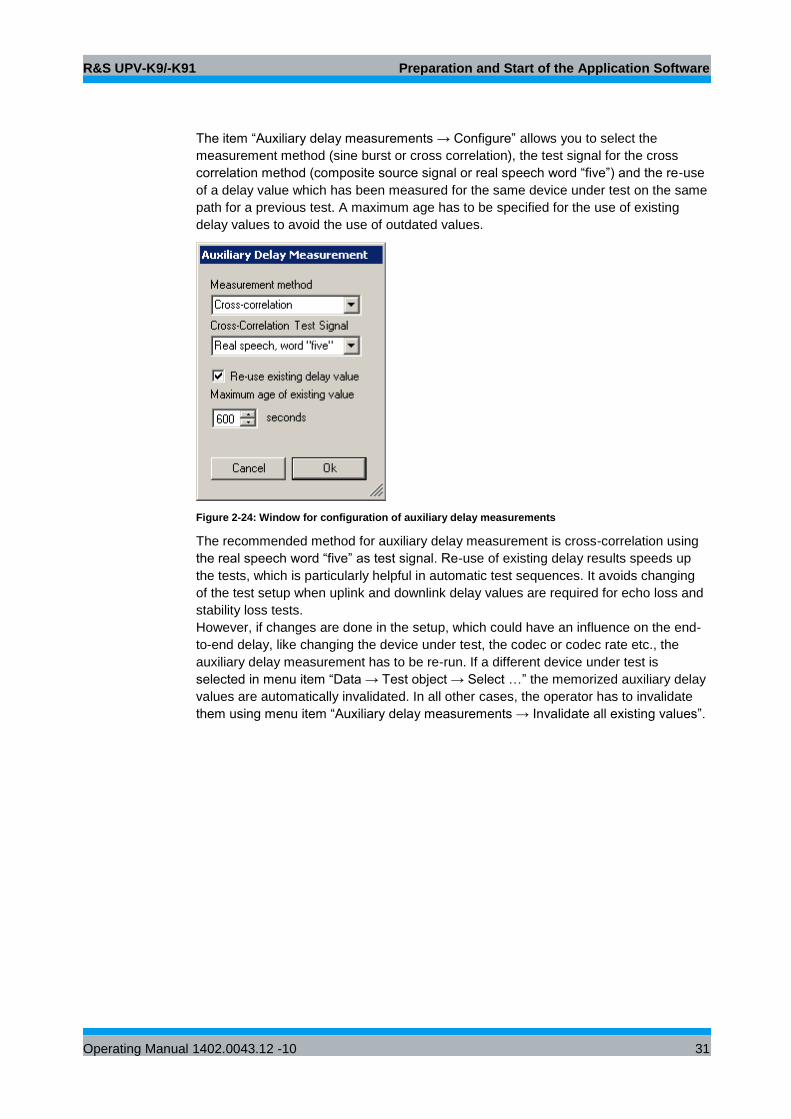
The item “Auxiliary delay measurements → Configure” allows you to select the
measurement method (sine burst or cross correlation), the test signal for the cross
correlation method (composite source signal or real speech word “five”) and the re-use
of a delay value which has been measured for the same device under test on the same
path for a previous test. A maximum age has to be specified for the use of existing
delay values to avoid the use of outdated values.
Figure 2-24: Window for configuration of auxiliary delay measurements
The recommended method for auxiliary delay measurement is cross-correlation using
the real speech word “five” as test signal. Re-use of existing delay results speeds up
the tests, which is particularly helpful in automatic test sequences. It avoids changing
of the test setup when uplink and downlink delay values are required for echo loss and
stability loss tests.
However, if changes are done in the setup, which could have an influence on the end-
to-end delay, like changing the device under test, the codec or codec rate etc., the
auxiliary delay measurement has to be re-run. If a different device under test is
selected in menu item “Data → Test object → Select …” the memorized auxiliary delay
values are automatically invalidated. In all other cases, the operator has to invalidate
them using menu item “Auxiliary delay measurements → Invalidate all existing values”.
R&S UPV-K9/-K91 Preparation and Start of the Application Software
Operating Manual 1402.0043.12 -10 32
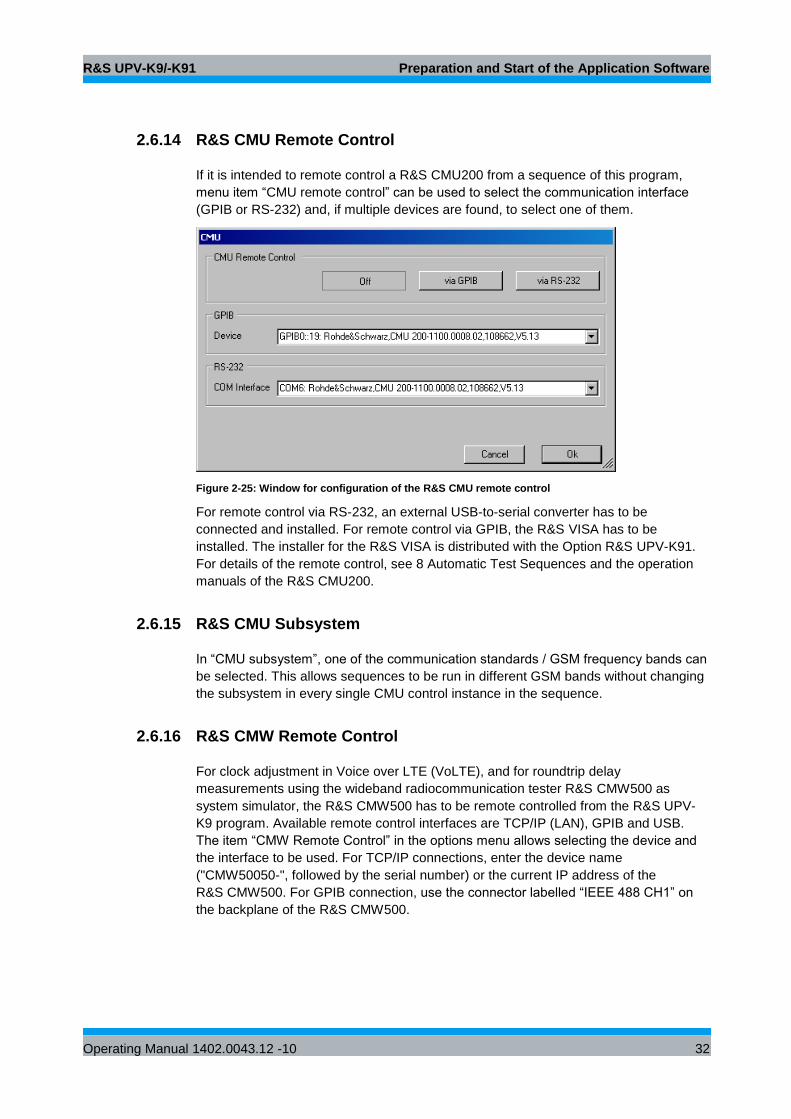
2.6.14 R&S CMU Remote Control
If it is intended to remote control a R&S CMU200 from a sequence of this program,
menu item “CMU remote control” can be used to select the communication interface
(GPIB or RS-232) and, if multiple devices are found, to select one of them.
Figure 2-25: Window for configuration of the R&S CMU remote control
For remote control via RS-232, an external USB-to-serial converter has to be
connected and installed. For remote control via GPIB, the R&S VISA has to be
installed. The installer for the R&S VISA is distributed with the Option R&S UPV-K91.
For details of the remote control, see 8 Automatic Test Sequences and the operation
manuals of the R&S CMU200.
2.6.15 R&S CMU Subsystem
In “CMU subsystem”, one of the communication standards / GSM frequency bands can
be selected. This allows sequences to be run in different GSM bands without changing
the subsystem in every single CMU control instance in the sequence.
2.6.16 R&S CMW Remote Control
For clock adjustment in Voice over LTE (VoLTE), and for roundtrip delay
measurements using the wideband radiocommunication tester R&S CMW500 as
system simulator, the R&S CMW500 has to be remote controlled from the R&S UPV-
K9 program. Available remote control interfaces are TCP/IP (LAN), GPIB and USB.
The item “CMW Remote Control” in the options menu allows selecting the device and
the interface to be used. For TCP/IP connections, enter the device name
("CMW50050-", followed by the serial number) or the current IP address of the
R&S CMW500. For GPIB connection, use the connector labelled “IEEE 488 CH1” on
the backplane of the R&S CMW500.
R&S UPV-K9/-K91 Preparation and Start of the Application Software
Operating Manual 1402.0043.12 -10 33
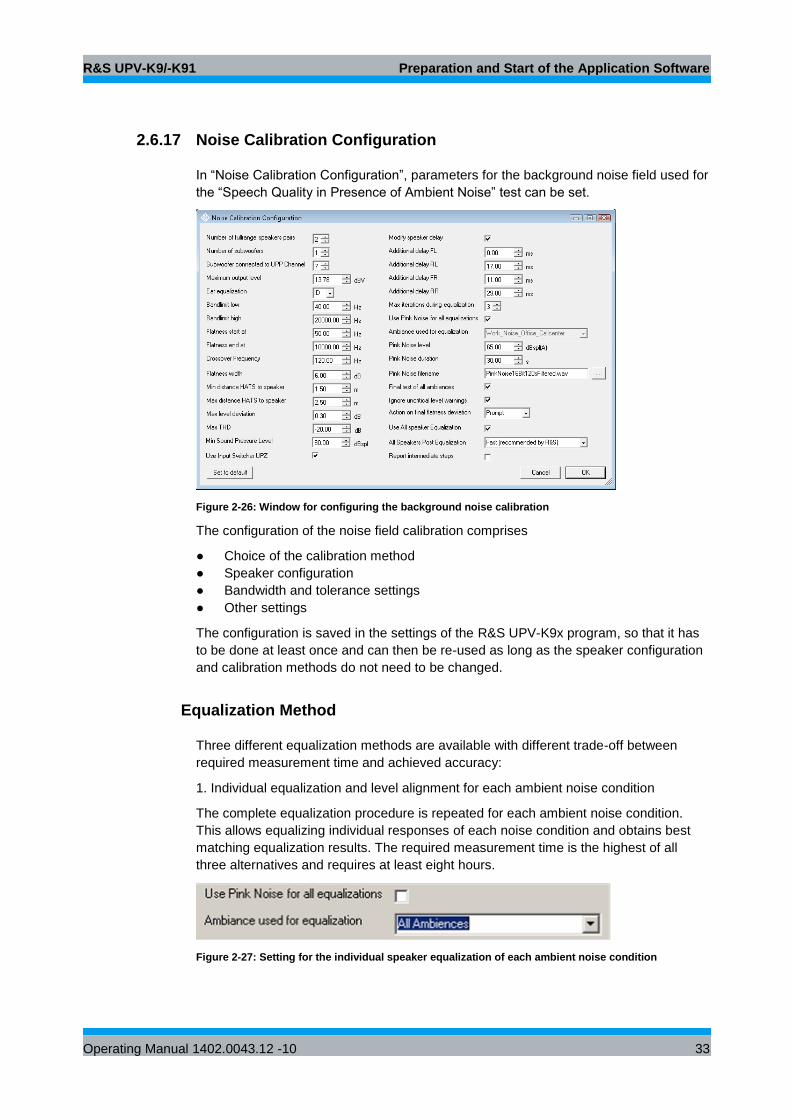
2.6.17 Noise Calibration Configuration
In “Noise Calibration Configuration”, parameters for the background noise field used for
the “Speech Quality in Presence of Ambient Noise” test can be set.
Figure 2-26: Window for configuring the background noise calibration
The configuration of the noise field calibration comprises
● Choice of the calibration method
● Speaker configuration
● Bandwidth and tolerance settings
● Other settings
The configuration is saved in the settings of the R&S UPV-K9x program, so that it has
to be done at least once and can then be re-used as long as the speaker configuration
and calibration methods do not need to be changed.
Equalization Method
Three different equalization methods are available with different trade-off between
required measurement time and achieved accuracy:
1. Individual equalization and level alignment for each ambient noise condition
The complete equalization procedure is repeated for each ambient noise condition.
This allows equalizing individual responses of each noise condition and obtains best
matching equalization results. The required measurement time is the highest of all
three alternatives and requires at least eight hours.
Figure 2-27: Setting for the individual speaker equalization of each ambient noise condition
R&S UPV-K9/-K91 Preparation and Start of the Application Software
Operating Manual 1402.0043.12 -10 34
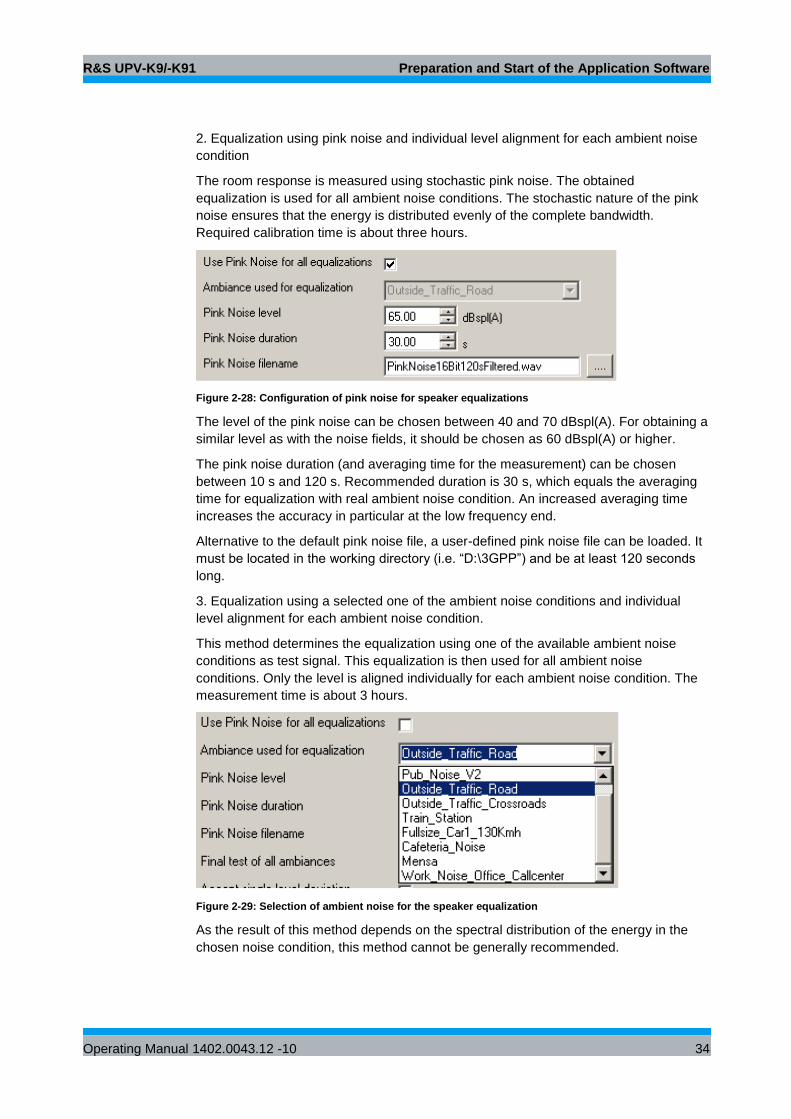
2. Equalization using pink noise and individual level alignment for each ambient noise
condition
The room response is measured using stochastic pink noise. The obtained
equalization is used for all ambient noise conditions. The stochastic nature of the pink
noise ensures that the energy is distributed evenly of the complete bandwidth.
Required calibration time is about three hours.
Figure 2-28: Configuration of pink noise for speaker equalizations
The level of the pink noise can be chosen between 40 and 70 dBspl(A). For obtaining a
similar level as with the noise fields, it should be chosen as 60 dBspl(A) or higher.
The pink noise duration (and averaging time for the measurement) can be chosen
between 10 s and 120 s. Recommended duration is 30 s, which equals the averaging
time for equalization with real ambient noise condition. An increased averaging time
increases the accuracy in particular at the low frequency end.
Alternative to the default pink noise file, a user-defined pink noise file can be loaded. It
must be located in the working directory (i.e. “D:\3GPP”) and be at least 120 seconds
long.
3. Equalization using a selected one of the ambient noise conditions and individual
level alignment for each ambient noise condition.
This method determines the equalization using one of the available ambient noise
conditions as test signal. This equalization is then used for all ambient noise
conditions. Only the level is aligned individually for each ambient noise condition. The
measurement time is about 3 hours.
Figure 2-29: Selection of ambient noise for the speaker equalization
As the result of this method depends on the spectral distribution of the energy in the
chosen noise condition, this method cannot be generally recommended.
R&S UPV-K9/-K91 Preparation and Start of the Application Software
Operating Manual 1402.0043.12 -10 35
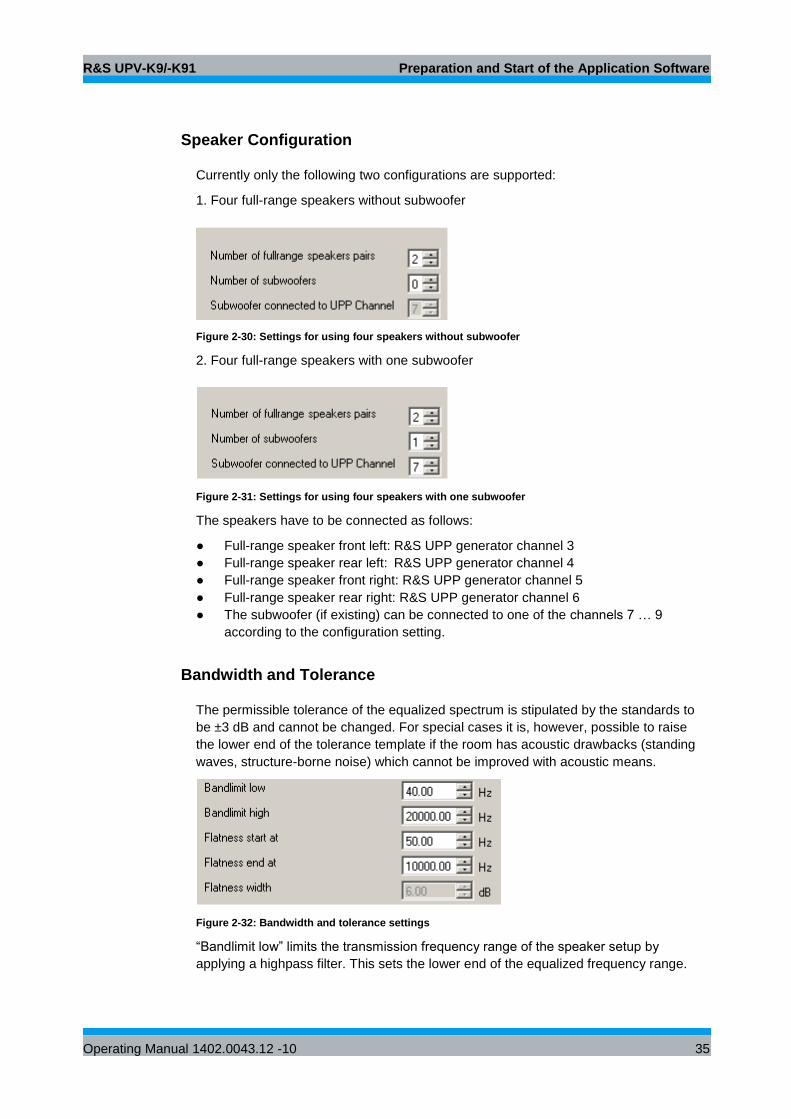
Speaker Configuration
Currently only the following two configurations are supported:
1. Four full-range speakers without subwoofer
Figure 2-30: Settings for using four speakers without subwoofer
2. Four full-range speakers with one subwoofer
Figure 2-31: Settings for using four speakers with one subwoofer
The speakers have to be connected as follows:
● Full-range speaker front left: R&S UPP generator channel 3
● Full-range speaker rear left: R&S UPP generator channel 4
● Full-range speaker front right: R&S UPP generator channel 5
● Full-range speaker rear right: R&S UPP generator channel 6
● The subwoofer (if existing) can be connected to one of the channels 7 … 9
according to the configuration setting.
Bandwidth and Tolerance
The permissible tolerance of the equalized spectrum is stipulated by the standards to
be ±3 dB and cannot be changed. For special cases it is, however, possible to raise
the lower end of the tolerance template if the room has acoustic drawbacks (standing
waves, structure-borne noise) which cannot be improved with acoustic means.
Figure 2-32: Bandwidth and tolerance settings
“Bandlimit low” limits the transmission frequency range of the speaker setup by
applying a highpass filter. This sets the lower end of the equalized frequency range.
R&S UPV-K9/-K91 Preparation and Start of the Application Software
Operating Manual 1402.0043.12 -10 36
It is recommended to suppress frequencies below the 50 Hz third octave, which means
to set the bandlimit low to about 44.5 Hz. For other third octaves, the recommended
lower band limit is fc / 1.122 with fc being the center frequency of the third octave. The
value of “Flatness start at” is automatically adapted to an increased lower band limit if
required.
“Bandlimit high” sets the upper frequency limit for the equalization. The default value of
20,000 Hz should not be altered.
“Flatness starts at” sets the lower frequency limit for the tolerance check. The standard
ETSI EG 202 396-1 stipulates a value of 50 Hz.
“Flatness ends at” sets the upper frequency limit for the tolerance check. The standard
ETSI EG 202 396-1 stipulates a value of 10,000 Hz.
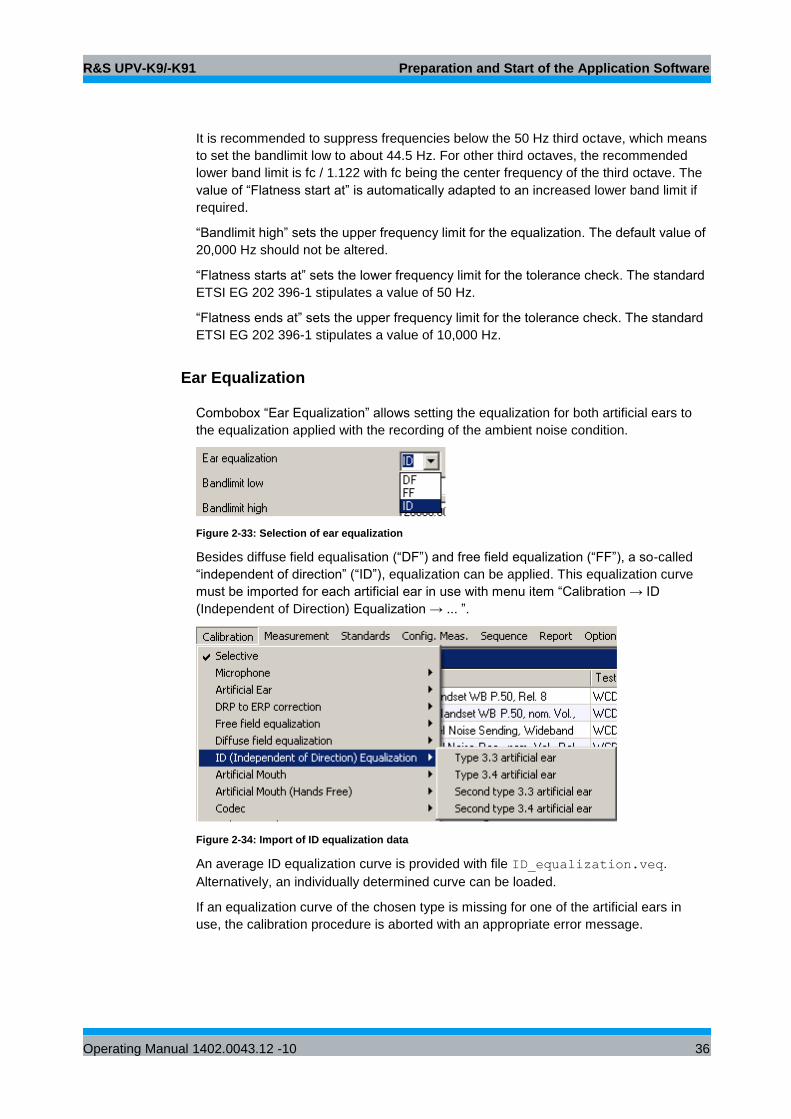
Ear Equalization
Combobox “Ear Equalization” allows setting the equalization for both artificial ears to
the equalization applied with the recording of the ambient noise condition.
Figure 2-33: Selection of ear equalization
Besides diffuse field equalisation (“DF”) and free field equalization (“FF”), a so-called
“independent of direction” (“ID”), equalization can be applied. This equalization curve
must be imported for each artificial ear in use with menu item “Calibration → ID
(Independent of Direction) Equalization → ... ”.
Figure 2-34: Import of ID equalization data
An average ID equalization curve is provided with file ID_equalization.veq.
Alternatively, an individually determined curve can be loaded.
If an equalization curve of the chosen type is missing for one of the artificial ears in
use, the calibration procedure is aborted with an appropriate error message.
R&S UPV-K9/-K91 Preparation and Start of the Application Software
Operating Manual 1402.0043.12 -10 37
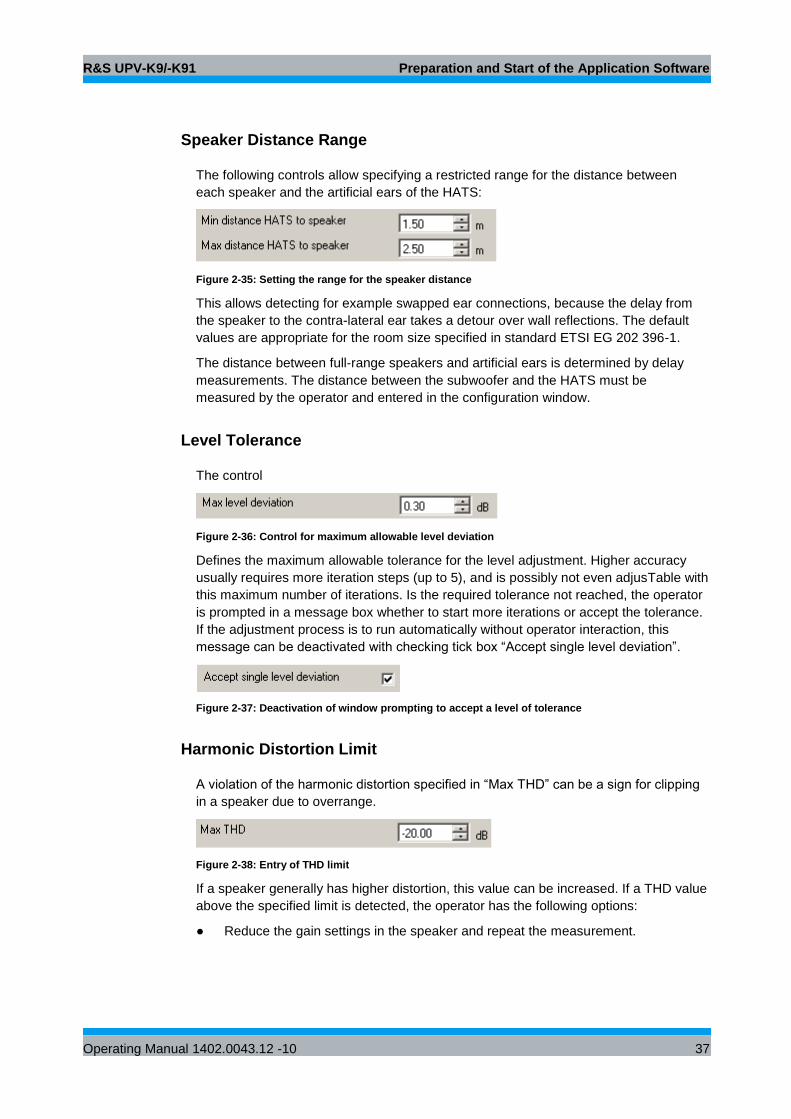
Speaker Distance Range
The following controls allow specifying a restricted range for the distance between
each speaker and the artificial ears of the HATS:
Figure 2-35: Setting the range for the speaker distance
This allows detecting for example swapped ear connections, because the delay from
the speaker to the contra-lateral ear takes a detour over wall reflections. The default
values are appropriate for the room size specified in standard ETSI EG 202 396-1.
The distance between full-range speakers and artificial ears is determined by delay
measurements. The distance between the subwoofer and the HATS must be
measured by the operator and entered in the configuration window.
Level Tolerance
The control
Figure 2-36: Control for maximum allowable level deviation
Defines the maximum allowable tolerance for the level adjustment. Higher accuracy
usually requires more iteration steps (up to 5), and is possibly not even adjusTable with
this maximum number of iterations. Is the required tolerance not reached, the operator
is prompted in a message box whether to start more iterations or accept the tolerance.
If the adjustment process is to run automatically without operator interaction, this
message can be deactivated with checking tick box “Accept single level deviation”.
Figure 2-37: Deactivation of window prompting to accept a level of tolerance
Harmonic Distortion Limit
A violation of the harmonic distortion specified in “Max THD” can be a sign for clipping
in a speaker due to overrange.
Figure 2-38: Entry of THD limit
If a speaker generally has higher distortion, this value can be increased. If a THD value
above the specified limit is detected, the operator has the following options:
● Reduce the gain settings in the speaker and repeat the measurement.
R&S UPV-K9/-K91 Preparation and Start of the Application Software
Operating Manual 1402.0043.12 -10 38
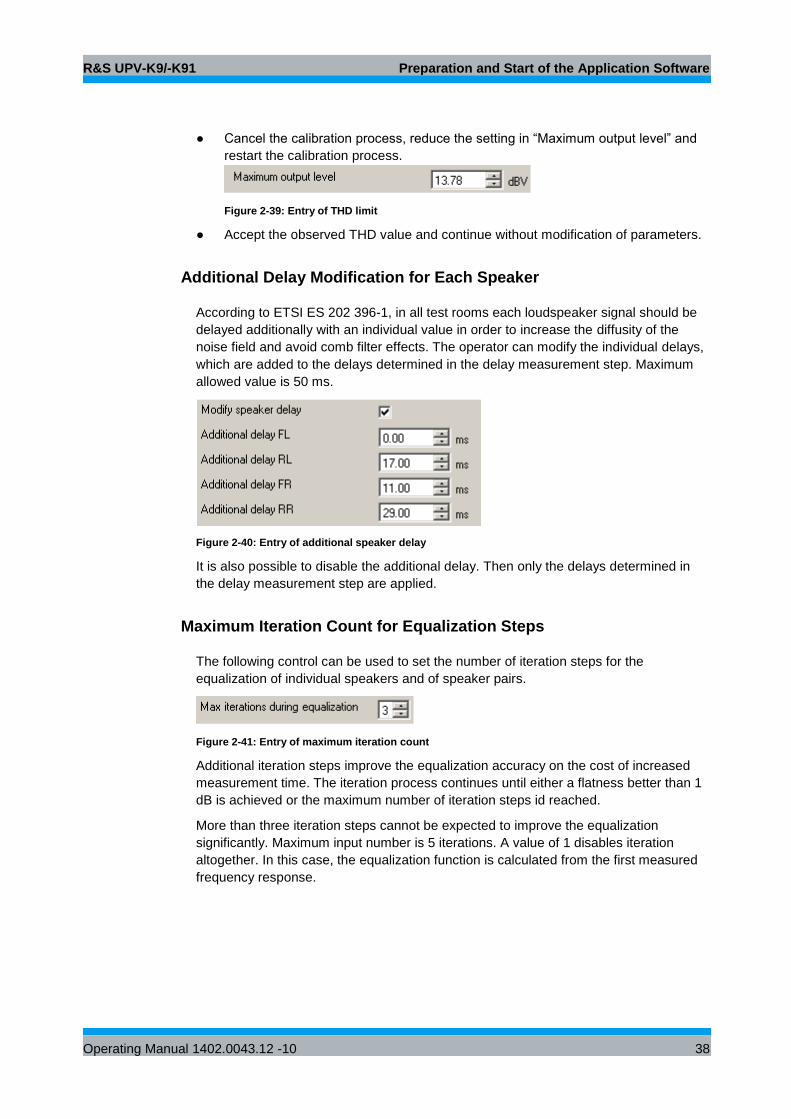
● Cancel the calibration process, reduce the setting in “Maximum output level” and
restart the calibration process.
Figure 2-39: Entry of THD limit
● Accept the observed THD value and continue without modification of parameters.
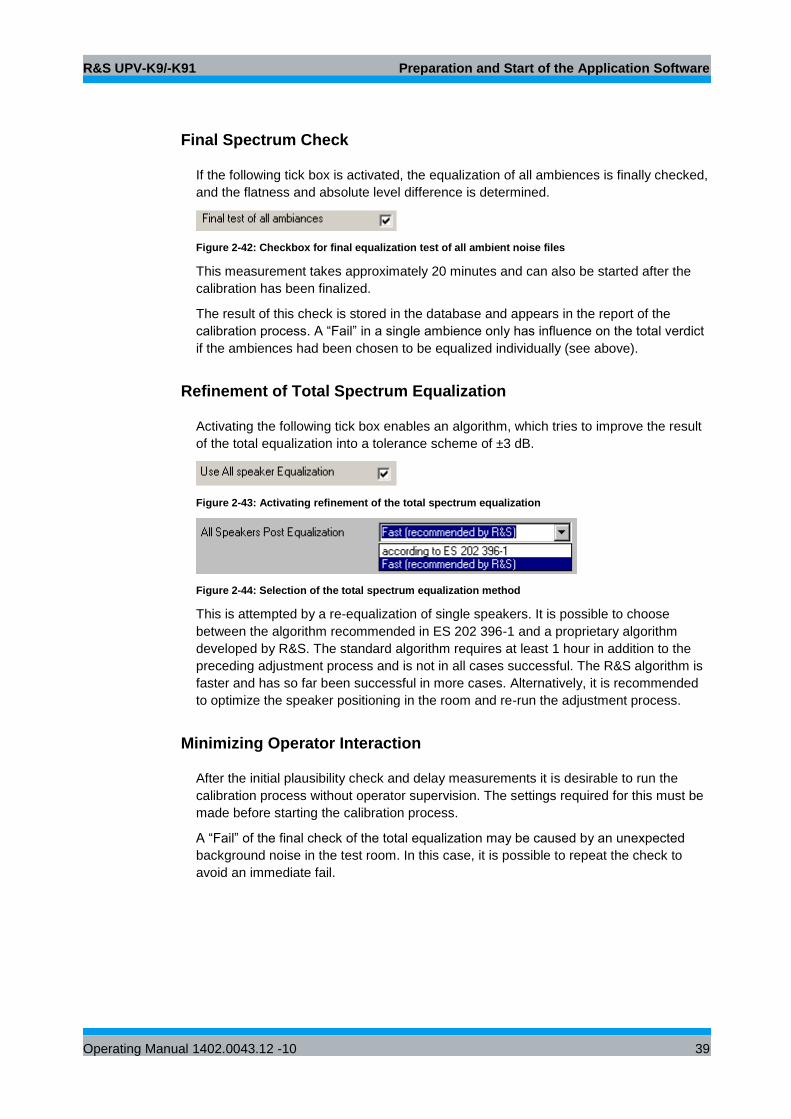
Additional Delay Modification for Each Speaker
According to ETSI ES 202 396-1, in all test rooms each loudspeaker signal should be
delayed additionally with an individual value in order to increase the diffusity of the
noise field and avoid comb filter effects. The operator can modify the individual delays,
which are added to the delays determined in the delay measurement step. Maximum
allowed value is 50 ms.
Figure 2-40: Entry of additional speaker delay
It is also possible to disable the additional delay. Then only the delays determined in
the delay measurement step are applied.
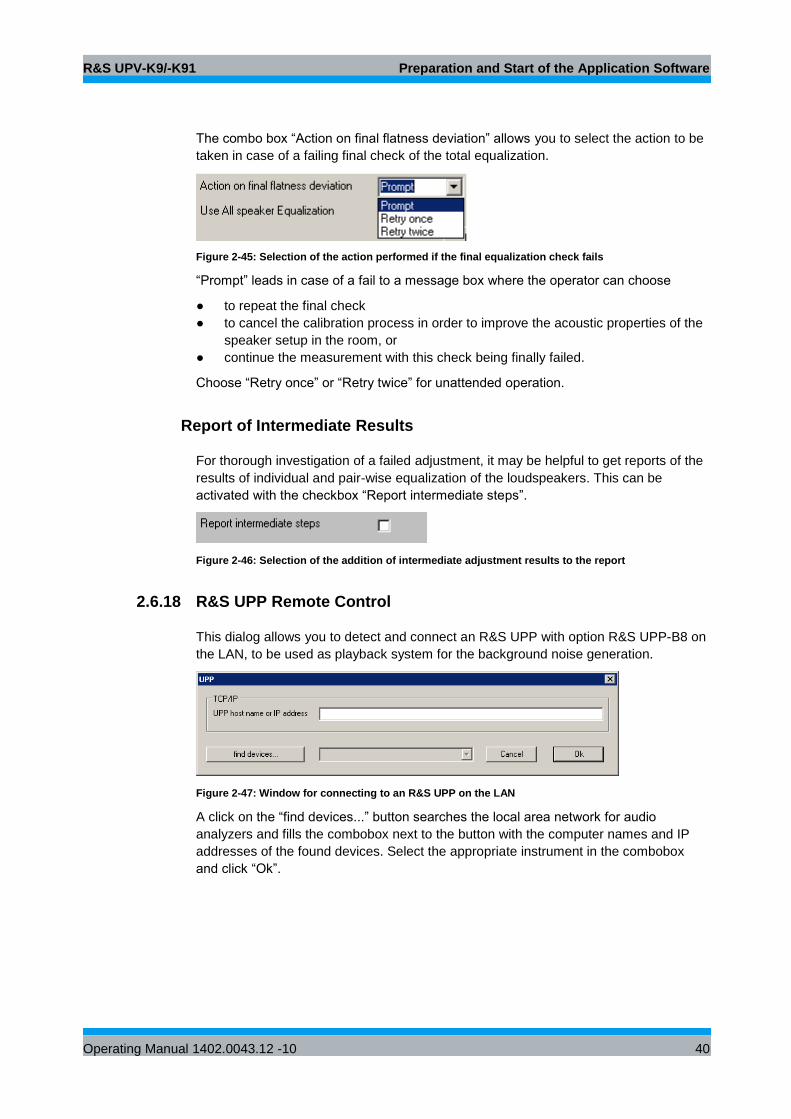
Maximum Iteration Count for Equalization Steps
The following control can be used to set the number of iteration steps for the
equalization of individual speakers and of speaker pairs.
Figure 2-41: Entry of maximum iteration count
Additional iteration steps improve the equalization accuracy on the cost of increased
measurement time. The iteration process continues until either a flatness better than 1
dB is achieved or the maximum number of iteration steps id reached.
More than three iteration steps cannot be expected to improve the equalization
significantly. Maximum input number is 5 iterations. A value of 1 disables iteration
altogether. In this case, the equalization function is calculated from the first measured
frequency response.
R&S UPV-K9/-K91 Preparation and Start of the Application Software
Operating Manual 1402.0043.12 -10 39
Final Spectrum Check
If the following tick box is activated, the equalization of all ambiences is finally checked,
and the flatness and absolute level difference is determined.
Figure 2-42: Checkbox for final equalization test of all ambient noise files
This measurement takes approximately 20 minutes and can also be started after the
calibration has been finalized.
The result of this check is stored in the database and appears in the report of the
calibration process. A “Fail” in a single ambience only has influence on the total verdict
if the ambiences had been chosen to be equalized individually (see above).
Refinement of Total Spectrum Equalization
Activating the following tick box enables an algorithm, which tries to improve the result
of the total equalization into a tolerance scheme of ±3 dB.
Figure 2-43: Activating refinement of the total spectrum equalization
Figure 2-44: Selection of the total spectrum equalization method
This is attempted by a re-equalization of single speakers. It is possible to choose
between the algorithm recommended in ES 202 396-1 and a proprietary algorithm
developed by R&S. The standard algorithm requires at least 1 hour in addition to the
preceding adjustment process and is not in all cases successful. The R&S algorithm is
faster and has so far been successful in more cases. Alternatively, it is recommended
to optimize the speaker positioning in the room and re-run the adjustment process.
Minimizing Operator Interaction
After the initial plausibility check and delay measurements it is desirable to run the
calibration process without operator supervision. The settings required for this must be
made before starting the calibration process.
A “Fail” of the final check of the total equalization may be caused by an unexpected
background noise in the test room. In this case, it is possible to repeat the check to
avoid an immediate fail.
R&S UPV-K9/-K91 Preparation and Start of the Application Software
Operating Manual 1402.0043.12 -10 40
The combo box “Action on final flatness deviation” allows you to select the action to be
taken in case of a failing final check of the total equalization.
Figure 2-45: Selection of the action performed if the final equalization check fails
“Prompt” leads in case of a fail to a message box where the operator can choose
● to repeat the final check
● to cancel the calibration process in order to improve the acoustic properties of the
speaker setup in the room, or
● continue the measurement with this check being finally failed.
Choose “Retry once” or “Retry twice” for unattended operation.
Report of Intermediate Results
For thorough investigation of a failed adjustment, it may be helpful to get reports of the
results of individual and pair-wise equalization of the loudspeakers. This can be
activated with the checkbox “Report intermediate steps”.
Figure 2-46: Selection of the addition of intermediate adjustment results to the report
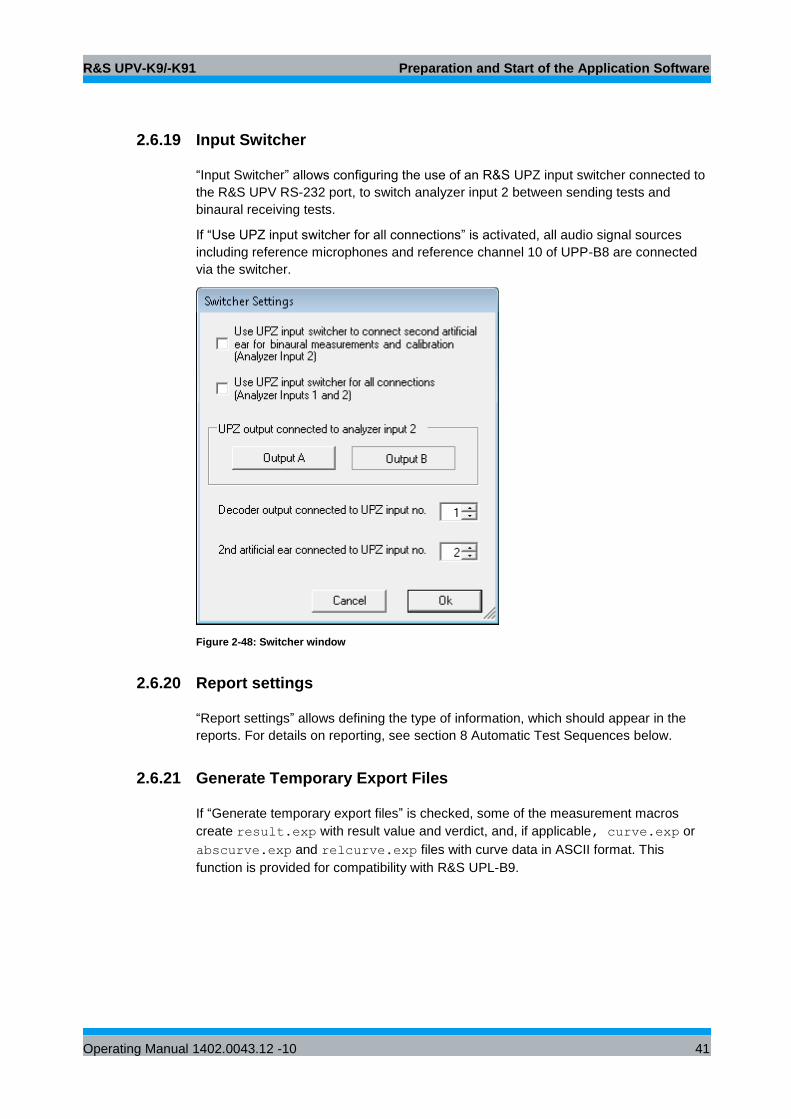
2.6.18 R&S UPP Remote Control
This dialog allows you to detect and connect an R&S UPP with option R&S UPP-B8 on
the LAN, to be used as playback system for the background noise generation.
Figure 2-47: Window for connecting to an R&S UPP on the LAN
A click on the “find devices...” button searches the local area network for audio
analyzers and fills the combobox next to the button with the computer names and IP
addresses of the found devices. Select the appropriate instrument in the combobox
and click “Ok”.
R&S UPV-K9/-K91 Preparation and Start of the Application Software
Operating Manual 1402.0043.12 -10 41
2.6.19 Input Switcher
“Input Switcher” allows configuring the use of an R&S UPZ input switcher connected to
the R&S UPV RS-232 port, to switch analyzer input 2 between sending tests and
binaural receiving tests.
If “Use UPZ input switcher for all connections” is activated, all audio signal sources
including reference microphones and reference channel 10 of UPP-B8 are connected
via the switcher.
Figure 2-48: Switcher window
2.6.20 Report settings
“Report settings” allows defining the type of information, which should appear in the
reports. For details on reporting, see section 8 Automatic Test Sequences below.
2.6.21 Generate Temporary Export Files
If “Generate temporary export files” is checked, some of the measurement macros
create result.exp with result value and verdict, and, if applicable, curve.exp or
abscurve.exp and relcurve.exp files with curve data in ASCII format. This
function is provided for compatibility with R&S UPL-B9.
R&S UPV-K9/-K91 Preparation and Start of the Application Software
Operating Manual 1402.0043.12 -10 42
2.6.22 Generate Temporary Image Files
Item “Generate temporary image files” causes the measurement macros to store a
screenshot of the measurement window after completion of the test to a file
Image.TIF for use by a remote controlling host.
2.6.23 Store Results of Further Measurements
If “Store results of further measurements” is checked, curves and calculated values like
loudness ratings are also stored for additional measurements started with the “Add
Measurement” key. They will appear in reports of the respective measurements.
2.6.24 Do not Change Scale for Further Meas.
Menu item “Do not change scale for further meas.” deactivates the automatic Y-axis
scaling if the curve of an additional measurement leaves the plot area partially or
totally.
2.6.25 Store Loaded Curve Data to Results
If “Store loaded curve data to results” is checked, curves loaded from file with the
“Load Curve” softkey are stored to the results database and will appear in reports of
the respective measurements.
2.6.26 Enable Remote Control
Menu item “Enable remote control” activates the interface of the program for remote
control using the client ControlK9.exe.
R&S UPV-K9/-K91 Calibration
Operating Manual 1402.0043.12 -10 43
3 Calibration
3.1 Calibration Devices
R&S UPV-K9 allows you to simultaneously storing calibration values for multiple
individuals of the same type. This allows switching devices without the requirement for
re-calibration. However, regular re-calibration is recommended in order to assure the
correct function of the used devices.
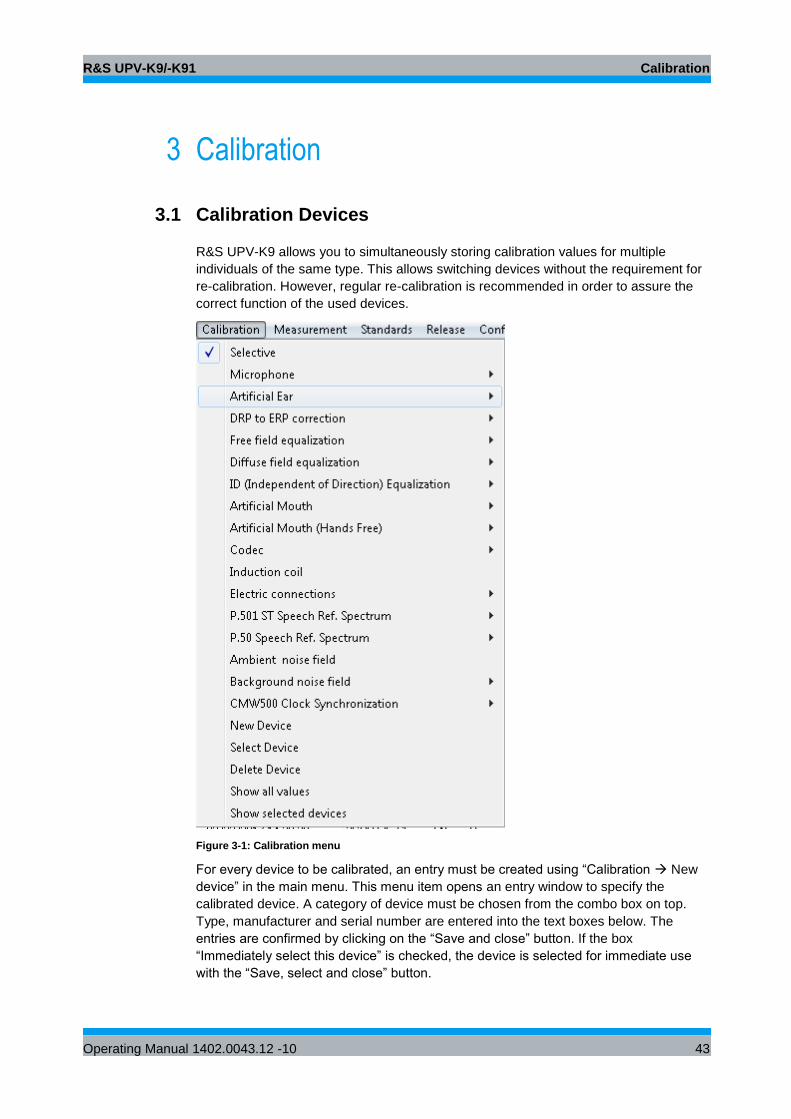
Figure 3-1: Calibration menu
For every device to be calibrated, an entry must be created using “Calibration New
device” in the main menu. This menu item opens an entry window to specify the
calibrated device. A category of device must be chosen from the combo box on top.
Type, manufacturer and serial number are entered into the text boxes below. The
entries are confirmed by clicking on the “Save and close” button. If the box
“Immediately select this device” is checked, the device is selected for immediate use
with the “Save, select and close” button.
R&S UPV-K9/-K91 Calibration
Operating Manual 1402.0043.12 -10 44
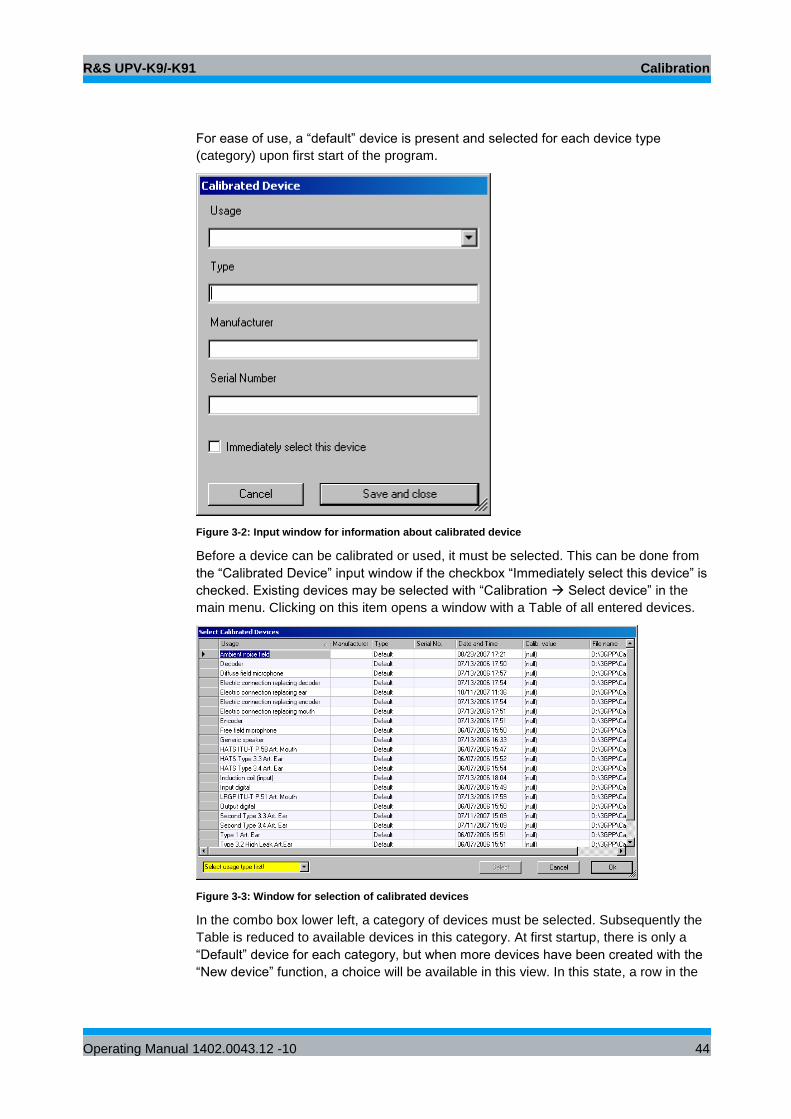
For ease of use, a “default” device is present and selected for each device type
(category) upon first start of the program.
Figure 3-2: Input window for information about calibrated device
Before a device can be calibrated or used, it must be selected. This can be done from
the “Calibrated Device” input window if the checkbox “Immediately select this device” is
checked. Existing devices may be selected with “Calibration Select device” in the
main menu. Clicking on this item opens a window with a Table of all entered devices.
Figure 3-3: Window for selection of calibrated devices
In the combo box lower left, a category of devices must be selected. Subsequently the
Table is reduced to available devices in this category. At first startup, there is only a
“Default” device for each category, but when more devices have been created with the
“New device” function, a choice will be available in this view. In this state, a row in the
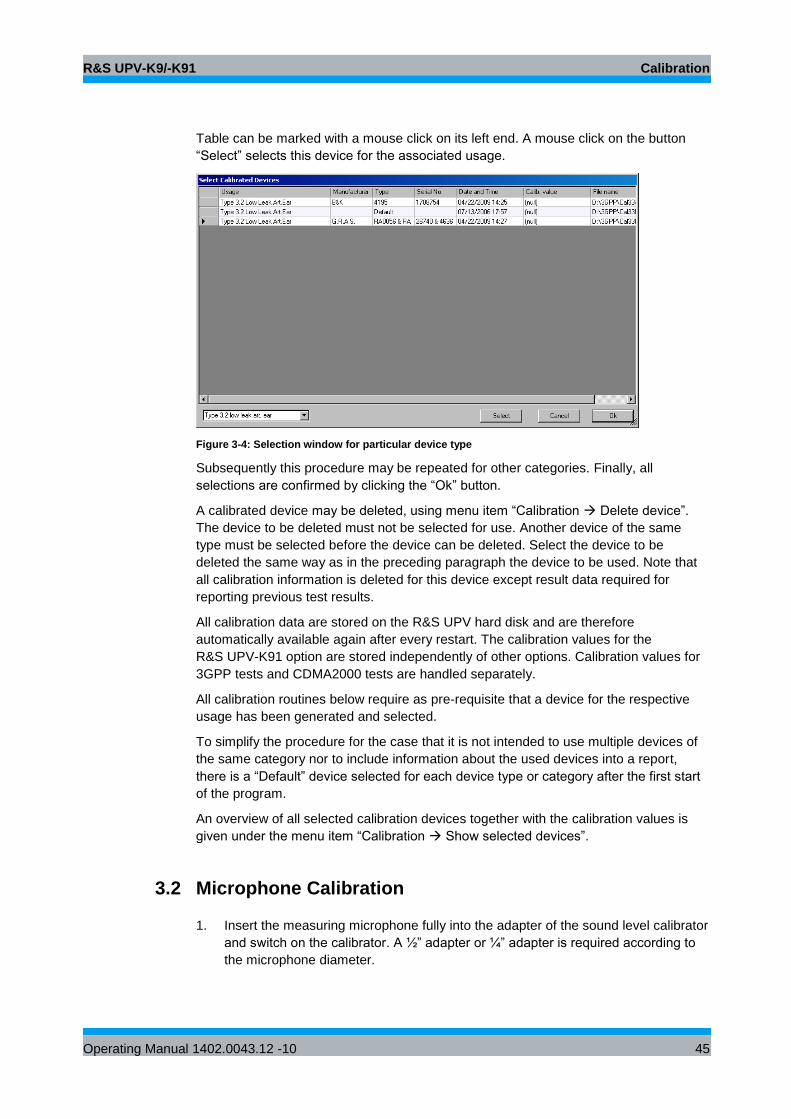
R&S UPV-K9/-K91 Calibration
Operating Manual 1402.0043.12 -10 45
Table can be marked with a mouse click on its left end. A mouse click on the button
“Select” selects this device for the associated usage.
Figure 3-4: Selection window for particular device type
Subsequently this procedure may be repeated for other categories. Finally, all
selections are confirmed by clicking the “Ok” button.
A calibrated device may be deleted, using menu item “Calibration Delete device”.
The device to be deleted must not be selected for use. Another device of the same
type must be selected before the device can be deleted. Select the device to be
deleted the same way as in the preceding paragraph the device to be used. Note that
all calibration information is deleted for this device except result data required for
reporting previous test results.
All calibration data are stored on the R&S UPV hard disk and are therefore
automatically available again after every restart. The calibration values for the
R&S UPV-K91 option are stored independently of other options. Calibration values for
3GPP tests and CDMA2000 tests are handled separately.
All calibration routines below require as pre-requisite that a device for the respective
usage has been generated and selected.
To simplify the procedure for the case that it is not intended to use multiple devices of
the same category nor to include information about the used devices into a report,
there is a “Default” device selected for each device type or category after the first start
of the program.
An overview of all selected calibration devices together with the calibration values is
given under the menu item “Calibration Show selected devices”.
3.2 Microphone Calibration
1. Insert the measuring microphone fully into the adapter of the sound level calibrator
and switch on the calibrator. A ½” adapter or ¼” adapter is required according to
the microphone diameter.
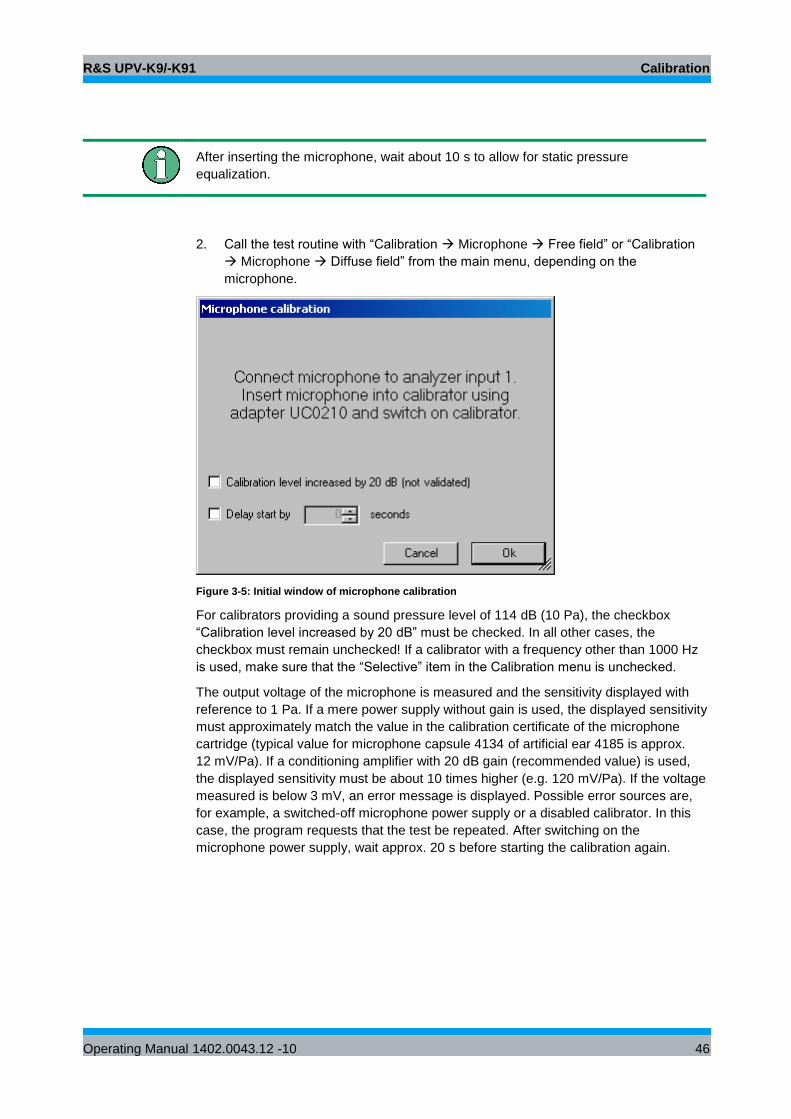
R&S UPV-K9/-K91 Calibration
Operating Manual 1402.0043.12 -10 46
After inserting the microphone, wait about 10 s to allow for static pressure
equalization.
2. Call the test routine with “Calibration Microphone Free field” or “Calibration
Microphone Diffuse field” from the main menu, depending on the
microphone.
Figure 3-5: Initial window of microphone calibration
For calibrators providing a sound pressure level of 114 dB (10 Pa), the checkbox
“Calibration level increased by 20 dB” must be checked. In all other cases, the
checkbox must remain unchecked! If a calibrator with a frequency other than 1000 Hz
is used, make sure that the “Selective” item in the Calibration menu is unchecked.
The output voltage of the microphone is measured and the sensitivity displayed with
reference to 1 Pa. If a mere power supply without gain is used, the displayed sensitivity
must approximately match the value in the calibration certificate of the microphone
cartridge (typical value for microphone capsule 4134 of artificial ear 4185 is approx.
12 mV/Pa). If a conditioning amplifier with 20 dB gain (recommended value) is used,
the displayed sensitivity must be about 10 times higher (e.g. 120 mV/Pa). If the voltage
measured is below 3 mV, an error message is displayed. Possible error sources are,
for example, a switched-off microphone power supply or a disabled calibrator. In this
case, the program requests that the test be repeated. After switching on the
microphone power supply, wait approx. 20 s before starting the calibration again.

R&S UPV-K9/-K91 Calibration
Operating Manual 1402.0043.12 -10 47
3.3 Calibration of Artificial Ear
Prior to the measurements, the absolute sensitivity of the microphone in the artificial
ear must be determined using a sound level calibrator such as the Brüel & Kjær 4231
with a sound pressure level of 94 dBSPL or a sound pressure of 1 Pa at 1 kHz.
3.3.1 Calibration of Ear Type 1
1. Switch off the microphone power supply.
The 200 V polarization voltage of the microphone may cause a slight electric shock.
The current is harmless, but the microphone preamplifier may be damaged.
2. Remove the microphone from the artificial ear.
3. Screw back the microphone capsule and switch on the operating voltage.
4. Insert the microphone fully into the adapter of the sound level calibrator and
switch on the calibrator.
After inserting the microphone, wait about 10 s to allow for static pressure
compensation.
5. Select “Calibration Artificial ear Type 1” from the main menu.
For calibrators providing a sound pressure level of 114 dB (10 Pa), the checkbox
“Calibration level increased by 20 dB” must be checked. In all other cases, the
checkbox must remain unchecked!
The output voltage of the microphone is measured and the sensitivity displayed with
reference to 1 Pa. If a mere power supply without gain is used, the displayed sensitivity
must approximately match the value in the calibration certificate of the microphone
cartridge (typical value for microphone capsule 4134 of artificial ear 4185 is approx.
12 mV/Pa). If a conditioning amplifier with 20 dB gain (recommended value) is used,
the displayed sensitivity must be about 10 times higher (e.g. 120 mV/Pa). If the voltage
measured is below 3 mV or fluctuating by more than 0.2 dB, an error message is
displayed. Possible error sources are, for example, a switched-off microphone power
supply or a disabled calibrator. In this case, the program requests that the test be
repeated. After switching on the microphone power supply, wait approx. 20 s before
restarting the calibration.
The reference value measured is stored in a file on the hard disk and used for all
subsequent measurements when the same artificial ear type 1 is used as currently
selected.
R&S UPV-K9/-K91 Calibration
Operating Manual 1402.0043.12 -10 48
3.3.2 Calibration of Ear Type 3.2 Low Leakage
1. Connect the sound level calibrator tightly to the artificial ear using the adapter
DP0939 and switch on the calibrator.
2. Select “Calibration Artificial ear Type 3.2 Low Leak” from the main menu.
For calibrators providing a sound pressure level of 114 dB (10 Pa), the checkbox
“Calibration level increased by 20 dB” must be checked. In all other cases, the
checkbox must remain unchecked!
The output voltage of the microphone in the ear is measured and the sensitivity
displayed with reference to 1 Pa. If the voltage measured is below 3 mV or fluctuating
by more than 0.2 dB, an error message is displayed. Possible error sources are, for
example, a switched-off microphone power supply or a disabled calibrator. In this case,
the program requests that the test be repeated. After switching on the microphone
power supply, wait approx. 20 s before restarting the calibration.
The measured reference value is stored in a file on the hard disk and used for all
subsequent measurements when the same ear type 3.2L is used as currently selected.
Reading the DRP-ERP Correction Data of the Artificial Ear of Type 3.2L:
The frequency response of the artificial ear of type 3.2L is supplied on a floppy
together with the artificial ear. The data is used for transforming the measurement
values from the drum reference point to the ear reference point.
1. Connect a USB floppy disk drive with the calibration disk to the R&S UPV, copy
the file OES_LL.ADA from the manufacturer’s calibration disk to a USB stick or a
CD-ROM or make this file available on a network drive via LAN.
2. Call the routine “Calibration DRP to ERP Correction Type 3.2 Low leak”.
Browse to the file OES_LL.ADA and click “Open”.
The calibration file is read. The modified data is stored on the R&S UPV hard disk. This
procedure needs only be repeated after a change of the calibration data, e.g. after a
recalibration of the ear by the manufacturer, or when the “3GPP” directory has been
renamed or removed
3.3.3 Calibration of Ear Type 3.2 High Leakage
1. Connect the sound level calibrator tightly to the artificial ear using the adapter
DP0939 and switch on the calibrator.
2. Select “Calibration Artificial ear Type 3.2 High Leak” from the main menu.
For calibrators providing a sound pressure level of 114 dB (10 Pa), the checkbox
“Calibration level increased by 20 dB” must be checked. In all other cases, the
checkbox must remain unchecked!
The output voltage of the microphone in the ear is measured and the sensitivity
displayed with reference to 1 Pa. If the voltage measured is below 3 mV or fluctuating
by more than 0.2 dB, an error message is displayed. Possible error sources are, for
example, a switched-off microphone power supply or a disabled calibrator.
R&S UPV-K9/-K91 Calibration
Operating Manual 1402.0043.12 -10 49
In this case, the program requests that the test be repeated. After switching on the
microphone power supply, wait approx. 20 s before restarting the measurement.
The measured reference value is stored in a file on the hard disk and used for all
subsequent measurements when the same ear type 3.2H is used as currently
selected.
Reading the DRP-ERP Correction Data of the Artificial Ear of Type 3.2H:
The frequency response of the artificial ear of type 3.2H is supplied on a floppy
together with the artificial ear. The data is used for transforming the measurement
values from the drum reference point to the ear reference point.
1. Connect a USB floppy disk drive with the calibration disk to the R&S UPV, copy
the file OES_HL.ADA from the manufacturer’s calibration disk to a USB stick or a
CD-ROM or make this file available on a network drive via LAN.
2. Call the routine “Calibration DRP to ERP Correction Type 3.2 High leak”.
Browse to the file OES_HL.ADA and click “Open”.
The calibration file is read. The modified data is stored on the R&S UPV hard disk. This
procedure needs only be repeated after a change of the calibration data, e.g. after a
recalibration of the ear by the manufacturer, or when the “3GPP” directory has been
renamed or removed.
3.3.4 Calibration of Ear Type 3.3
Calibration of artificial ear type 3.3 and 3.4 is possible with head-and-torso simulators
(HATS) 4128 from Brüel & Kjær and HMS II from Head Acoustics. As the calibration
level depends on the HATS type, this has to be selected on start of the calibration. For
HMS II the calibrator type to be used has to be selected as well.
Follow the instructions of the manufacturer of the HATS for the calibration of the
artificial ear. Here the procedure is described for B&K 4128.
1. Remove the pinna from the artificial ear according to the manufacturer’s
instructions
2. Connect the sound level calibrator tightly to the artificial ear using the adapter UA-
1546 and switch the calibrator on.
3. Select “Calibration Artificial ear HATS Type 3.3” from the main menu.
The type 3.3 ear calibration requires the calibrator with adapter UA-1546 to be held
manually against the ear.
For Head Acoustics HMS II, calibrator B&K 4231 must be used in conjunction with the
short steel calibration adapter.
If the HATS is installed remote from the R&S UPV, the checkbox “Delay start by …
seconds” can be checked and a time interval can be entered by which the start of the
calibration measurement is delayed. The countdown is displayed on the R&S UPV
screen.
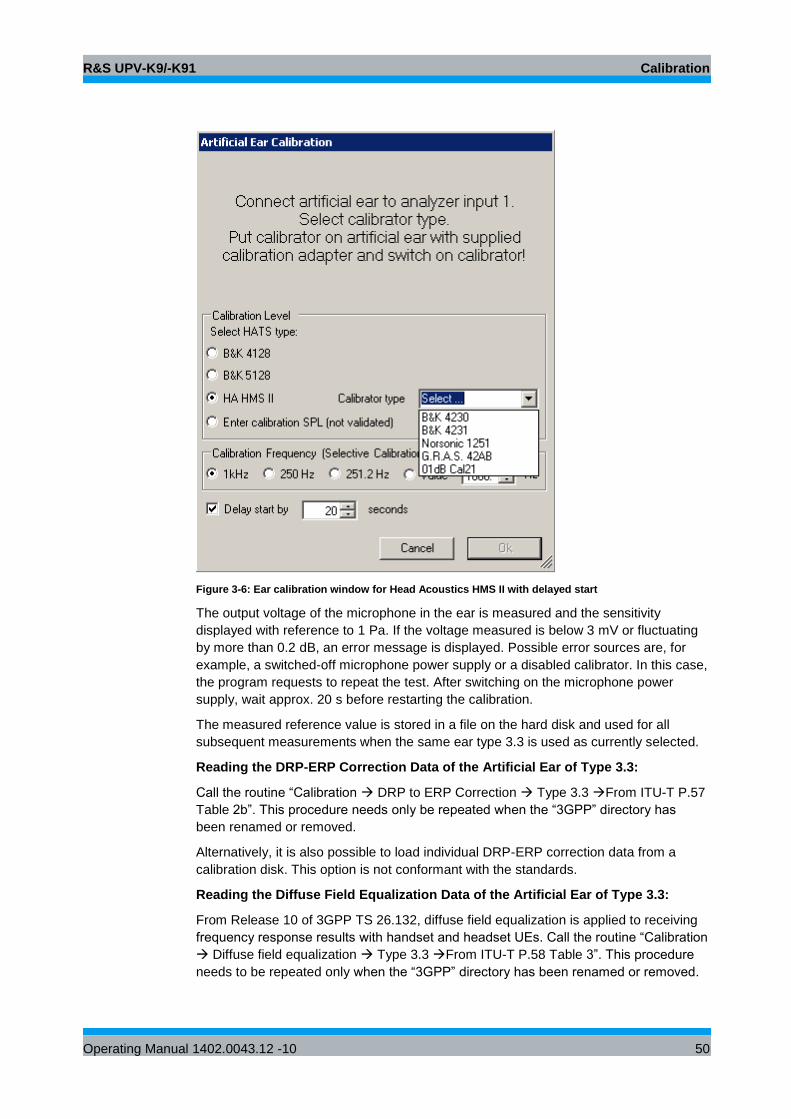
R&S UPV-K9/-K91 Calibration
Operating Manual 1402.0043.12 -10 50
Figure 3-6: Ear calibration window for Head Acoustics HMS II with delayed start
The output voltage of the microphone in the ear is measured and the sensitivity
displayed with reference to 1 Pa. If the voltage measured is below 3 mV or fluctuating
by more than 0.2 dB, an error message is displayed. Possible error sources are, for
example, a switched-off microphone power supply or a disabled calibrator. In this case,
the program requests to repeat the test. After switching on the microphone power
supply, wait approx. 20 s before restarting the calibration.
The measured reference value is stored in a file on the hard disk and used for all
subsequent measurements when the same ear type 3.3 is used as currently selected.
Reading the DRP-ERP Correction Data of the Artificial Ear of Type 3.3:
Call the routine “Calibration DRP to ERP Correction Type 3.3 From ITU-T P.57
Table 2b”. This procedure needs only be repeated when the “3GPP” directory has
been renamed or removed.
Alternatively, it is also possible to load individual DRP-ERP correction data from a
calibration disk. This option is not conformant with the standards.
Reading the Diffuse Field Equalization Data of the Artificial Ear of Type 3.3:
From Release 10 of 3GPP TS 26.132, diffuse field equalization is applied to receiving
frequency response results with handset and headset UEs. Call the routine “Calibration
Diffuse field equalization Type 3.3 From ITU-T P.58 Table 3”. This procedure
needs to be repeated only when the “3GPP” directory has been renamed or removed.
R&S UPV-K9/-K91 Calibration
Operating Manual 1402.0043.12 -10 51
Alternatively, it is also possible to load individual diffuse field equalization data from a
calibration disk. This option is not conformant with the standards.
Reading the Free Field Equalization Data of the Artificial Ear of Type 3.3:
For hands-free tests, free field equalization is applied to receiving frequency response
results. Call the routine “Calibration Free field equalization Type 3.3 artificial ear
From ITU-T P.58 Table 2”. This procedure needs only be repeated when the “3GPP”
directory has been renamed or removed.
Alternatively, it is also possible to load individual free field equalization data from a
calibration disk. This option is not conformant with the standards.
3.3.5 Calibration of Ear Type 3.4
The calibration of the HATS ear with the alternative type 3.4 pinna is done likewise,
similar to the type 3.3 ear calibration.
3.4 Calibration of Artificial Mouth for Handset Tests
Before a mobile phone can be tested, the absolute sensitivity and frequency response
of the artificial mouth have to be measured and corrected with the aid of a previously
calibrated free field or diffuse-field (pressure-field) microphone. The measuring
microphone removed from artificial ear type 1 can be used for this purpose or an
additional microphone capsule is screwed to the microphone preamplifier. The
standard microphone is used as a reference for determining the frequency response of
the mouth. The frequency response of the microphone can be ignored in the test
frequency range (100 Hz to 8 kHz) (see also calibration certificate of microphone
capsule).
Since interfering sound falsifies the corrections, the artificial mouth must be calibrated
in the anechoic and isolated test chamber. In order to reject any noise present in the
test chamber, it is recommended to activate item “Selective” in the calibration menu.
First, a calibrated measuring microphone has to be selected.
1. Select a reference microphone type with “Calibration Artificial mouth Select
reference mic”.
For the selected microphone type, a device must be selected and calibrated (see
above). This device must be connected to R&S UPV analyzer input 1 via power
supply/conditioning amplifier.
For calibration of a P.51 type artificial mouth using a diffuse field type microphone (e.g.
B&K 4131 or 4134) or a microphone from a Type1 artificial ear, fit the microphone at
right angles to the mouth at the mouth reference point (MRP) using the gauge supplied
with the mouth (positioning at right angles is necessary because diffuse field or
pressure-calibrated microphones have a flat frequency response to sound from
random incident direction and therefore exhibit an emphasis on high frequencies with
frontal sound incidence).
R&S UPV-K9/-K91 Calibration
Operating Manual 1402.0043.12 -10 52
For calibration of a P.51 type artificial mouth using a free field microphone, the
microphone must be mounted in the axis of the sound outlet of the artificial mouth.
For calibration of the HATS (P.58 type) artificial mouth, a ¼” microphone is clamped in
the fixture attached to the HATS. For the super-wideband frequency range a diffuse
field or pressure field microphone is required.
2. Call the calibration routine with “Calibration Artificial mouth LRGP ITU-T
P.51 Without Reference Spectrum”, “Calibration Artificial mouth LRGP
ITU-T P.51 with P.50 Ref. Spectrum” or “Calibration Artificial mouth
LRGP ITU-T P.51 with P.501 NB/WB ST Speech Ref. Spectrum” or
“Calibration Artificial mouth LRGP ITU-T P.51 with P.501 SWB/FB ST
Speech Ref. Spectrum”, “Calibration Artificial mouth HATS ITU-T P.58
Without Reference Spectrum” or “Calibration Artificial mouth HATS ITU-T
P.58 with P.50 Ref. Spectrum” or “HATS ITU-T P.58 with P.501 NB/WB ST
Speech Ref. Spectrum” or “HATS ITU-T P.58 with P.501 SWB/FB ST Speech
Ref. Spectrum” from the main menu.
The sound pressure generated at the MRP is set to exactly -4.7 dBPa in an automatic
measurement routine at 1 kHz. The generator voltage required is stored in a file on the
hard disk and used as a reference for all subsequent settings with the same artificial
mouth. If the sound pressure cannot be adjusted to -4.7 dBPa, an error message is
displayed with a request to check the connection of the artificial mouth and to repeat
the measurement. A possible error source would be that the transformer supplied is
not connected between the generator and the artificial mouth.
The uncorrected frequency response of the artificial mouth is measured and displayed.
Next, the frequency response is measured with the inverse frequency response
correction automatically selected in the generator (equalization). Residual errors
caused by nonlinearities of the speaker in the mouth are measured and taken into
account in the final equalization file as fine correction.
To verify the results, the absolute sound pressure versus frequency is measured at a
sound pressure of 4.7 dBPa (reference value for most of the measurements). The
absolute sound pressure at each frequency must be within a tolerance band of
0.2 dB. Correct calibration without interfering sound yields an almost straight line in
the middle between the two limit lines.
If mouth calibration with reference spectrum measurement is chosen, the test signal is
subsequently filtered with the inverse mouth frequency response, and the resulting
spectrum at the MRP is recorded as reference for sending frequency response tests.
If a mouth calibration is performed without reference spectrum measurement,
previously recorded reference spectra are invalidated. A sending measurement using
artificial voice according to ITU-T P.50 can only performed after an additional reference
spectrum calibration (see below).
To calibrate the artificial mouth for all different sending tests available, proceed as
follows:
1. Choose the largest required frequency range in “Calibration Artificial Mouth
Frequency Range”. Smaller frequency ranges are included in larger ones
and do not have to be calibrated separately.
R&S UPV-K9/-K91 Calibration
Operating Manual 1402.0043.12 -10 53
2. Perform the artificial mouth calibration for hands-free tests, which includes the
MMS reference spectrum calibration and mouth calibration for handset tests.A
separate calibration for handset tests is not required.
3. Perform the sending reference spectrum calibration for artificial voice
according to ITU-T P.50 and for real voice according to ITU-T P.501. The
reference spectrum calibration has to be performed separately for handset
tests and hands-free tests, and for NB / WB frequency range and SWB / FB
frequency range, respectively.
3.5 P.50 Speech Spectrum Calibration
For tests using artificial voice according to ITU-T P.50 as test signal, the spectrum of
the test signal has to be measured and stored as reference spectrum for the transfer
function (gain) calculation. For sending and sidetone tests, the signal has to be filtered
in addition with the inverse frequency response of the artificial mouth. A calibrated
reference microphone must be placed at the Mouth Reference Point (MRP) for this
purpose. It is recommended to perform the reference spectrum calibration directly after
the mouth calibration, using sub-menu item “Calibration Artificial Mouth … With
P.50 Ref. Spectrum”.
The reference spectrum calibration for the receiving direction does not require external
equipment or wiring. The reference signal at the output from the R&S UPV generator to
the speech input of the system simulator is measured via internal connection to the
R&S UPV analyzer input. For narrow-band tests in receiving direction, a band-limited
version of the test signal is used. Each version of the test signal has to be calibrated
separately.
For ambient noise rejection according to Release 10 of 3GPP TS 26.132, a separate
speech reference spectrum calibration is necessary because the active speech level at
the MRP is specified to be +1.3 dBPa instead of -4.7 dBPa for this test. The test
routines can be found in sub-menu “Calibration __> P.50 Speech Ref. Spectrum
Sending for ANR”.
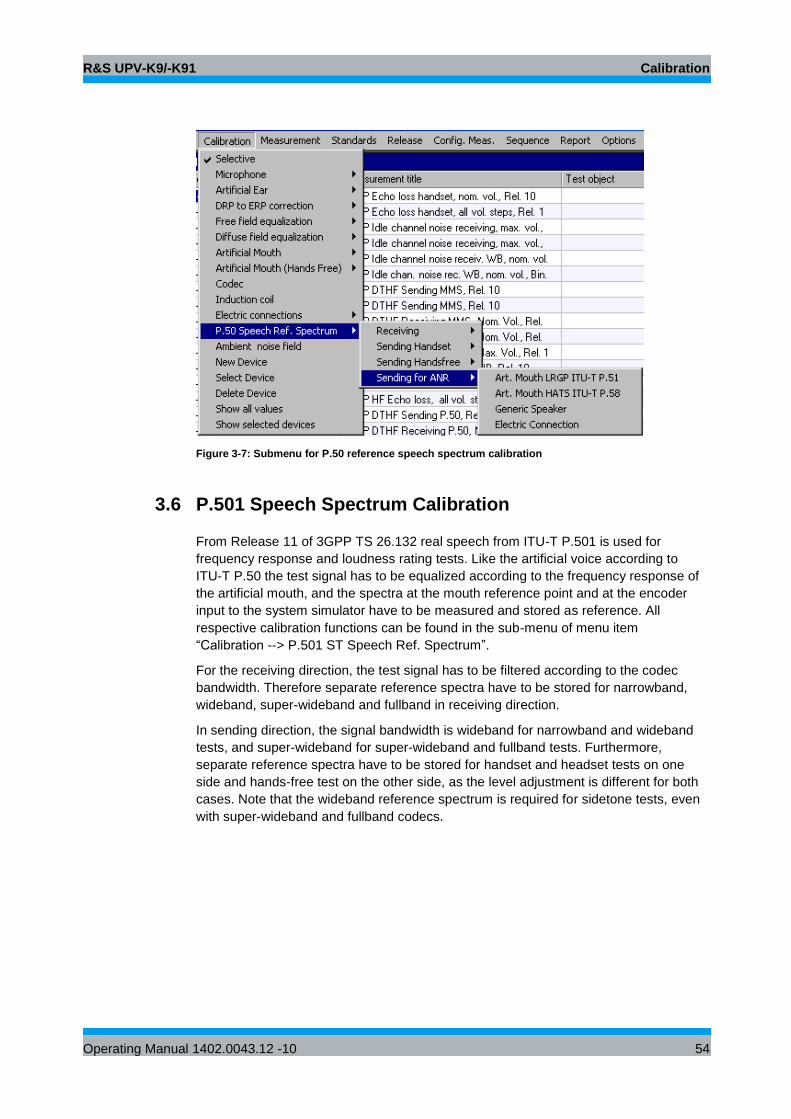
R&S UPV-K9/-K91 Calibration
Operating Manual 1402.0043.12 -10 54
Figure 3-7: Submenu for P.50 reference speech spectrum calibration
3.6 P.501 Speech Spectrum Calibration
From Release 11 of 3GPP TS 26.132 real speech from ITU-T P.501 is used for
frequency response and loudness rating tests. Like the artificial voice according to
ITU-T P.50 the test signal has to be equalized according to the frequency response of
the artificial mouth, and the spectra at the mouth reference point and at the encoder
input to the system simulator have to be measured and stored as reference. All
respective calibration functions can be found in the sub-menu of menu item
“Calibration --> P.501 ST Speech Ref. Spectrum”.
For the receiving direction, the test signal has to be filtered according to the codec
bandwidth. Therefore separate reference spectra have to be stored for narrowband,
wideband, super-wideband and fullband in receiving direction.
In sending direction, the signal bandwidth is wideband for narrowband and wideband
tests, and super-wideband for super-wideband and fullband tests. Furthermore,
separate reference spectra have to be stored for handset and headset tests on one
side and hands-free test on the other side, as the level adjustment is different for both
cases. Note that the wideband reference spectrum is required for sidetone tests, even
with super-wideband and fullband codecs.
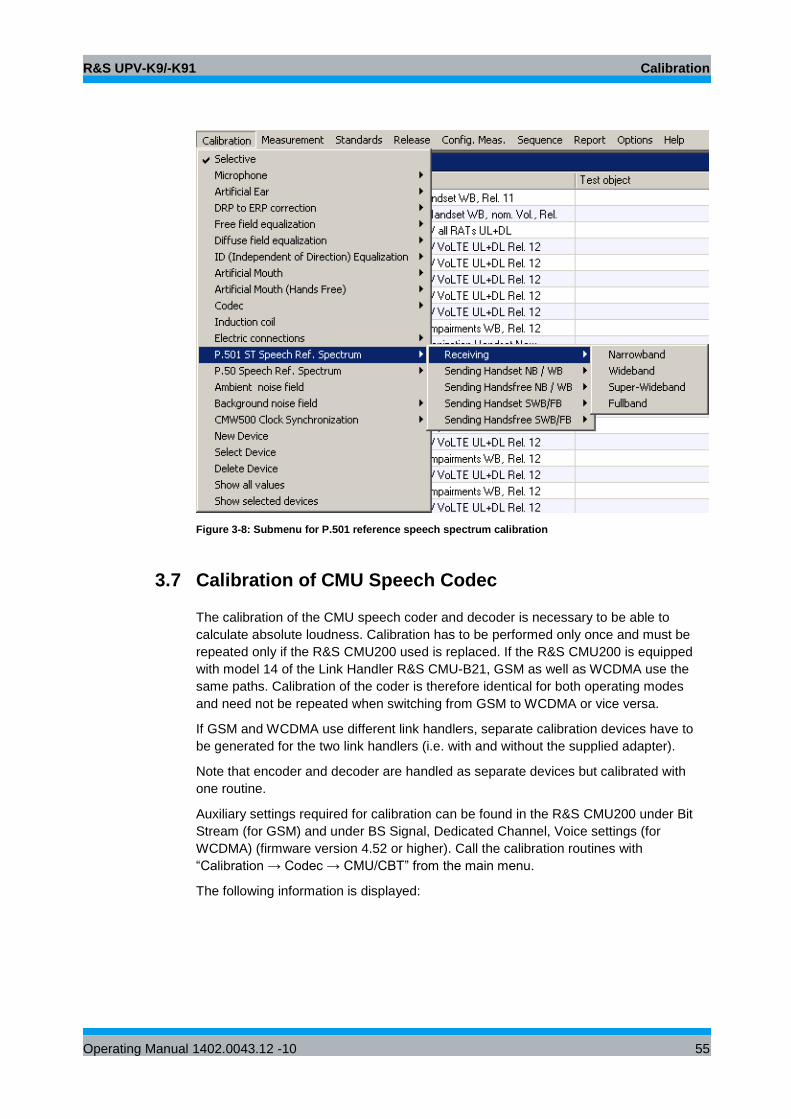
R&S UPV-K9/-K91 Calibration
Operating Manual 1402.0043.12 -10 55
Figure 3-8: Submenu for P.501 reference speech spectrum calibration
3.7 Calibration of CMU Speech Codec
The calibration of the CMU speech coder and decoder is necessary to be able to
calculate absolute loudness. Calibration has to be performed only once and must be
repeated only if the R&S CMU200 used is replaced. If the R&S CMU200 is equipped
with model 14 of the Link Handler R&S CMU-B21, GSM as well as WCDMA use the
same paths. Calibration of the coder is therefore identical for both operating modes
and need not be repeated when switching from GSM to WCDMA or vice versa.
If GSM and WCDMA use different link handlers, separate calibration devices have to
be generated for the two link handlers (i.e. with and without the supplied adapter).
Note that encoder and decoder are handled as separate devices but calibrated with
one routine.
Auxiliary settings required for calibration can be found in the R&S CMU200 under Bit
Stream (for GSM) and under BS Signal, Dedicated Channel, Voice settings (for
WCDMA) (firmware version 4.52 or higher). Call the calibration routines with
“Calibration → Codec → CMU/CBT” from the main menu.
The following information is displayed:
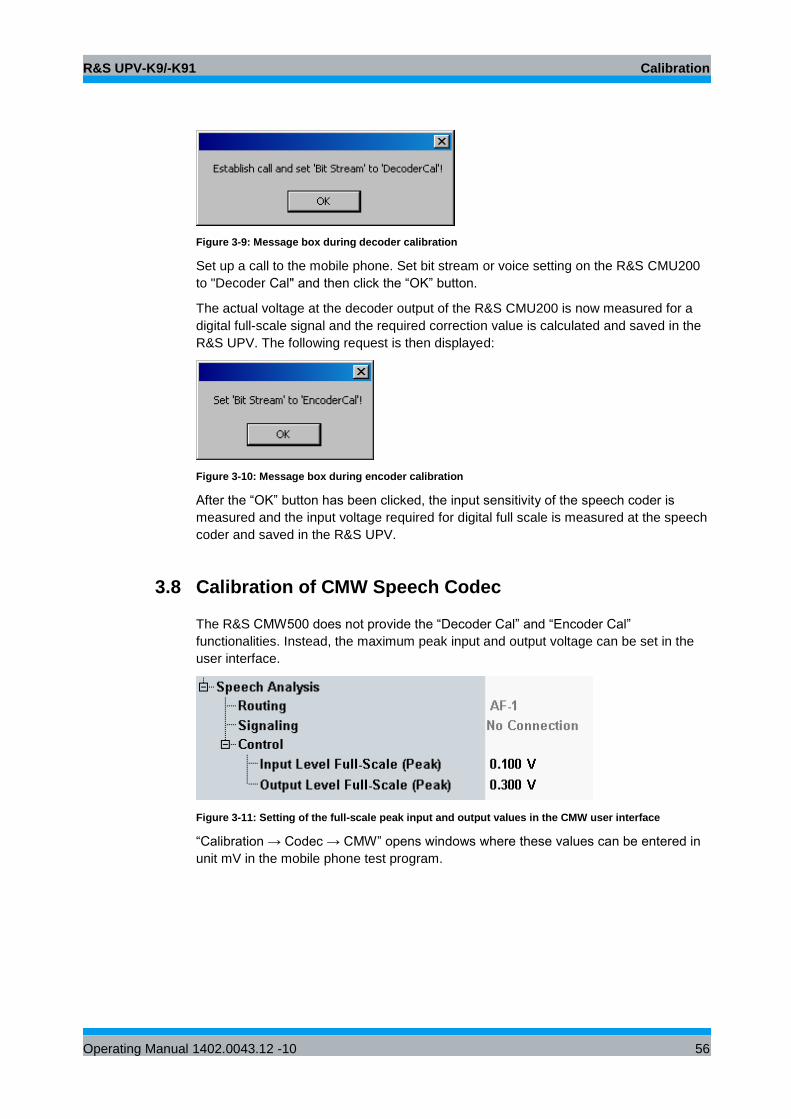
R&S UPV-K9/-K91 Calibration
Operating Manual 1402.0043.12 -10 56
Figure 3-9: Message box during decoder calibration
Set up a call to the mobile phone. Set bit stream or voice setting on the R&S CMU200
to "Decoder Cal" and then click the “OK” button.
The actual voltage at the decoder output of the R&S CMU200 is now measured for a
digital full-scale signal and the required correction value is calculated and saved in the
R&S UPV. The following request is then displayed:
Figure 3-10: Message box during encoder calibration
After the “OK” button has been clicked, the input sensitivity of the speech coder is
measured and the input voltage required for digital full scale is measured at the speech
coder and saved in the R&S UPV.
3.8 Calibration of CMW Speech Codec
The R&S CMW500 does not provide the “Decoder Cal” and “Encoder Cal”
functionalities. Instead, the maximum peak input and output voltage can be set in the
user interface.
Figure 3-11: Setting of the full-scale peak input and output values in the CMW user interface
“Calibration → Codec → CMW” opens windows where these values can be entered in
unit mV in the mobile phone test program.
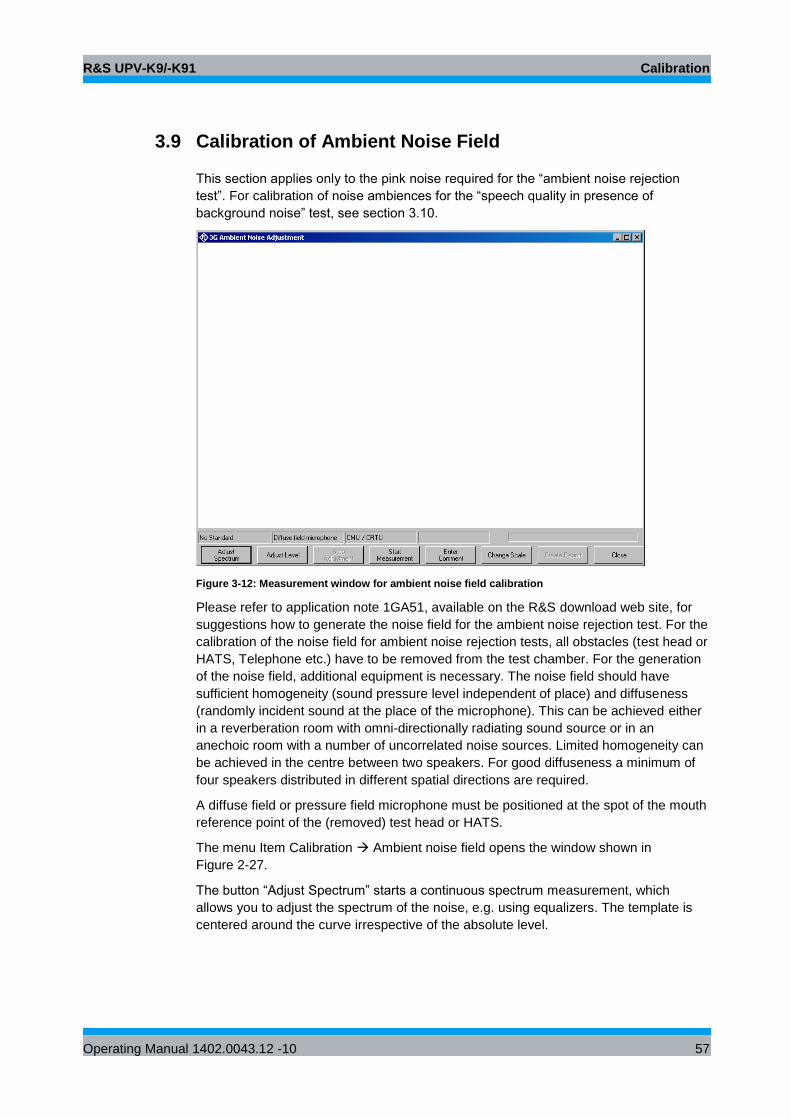
R&S UPV-K9/-K91 Calibration
Operating Manual 1402.0043.12 -10 57
3.9 Calibration of Ambient Noise Field
This section applies only to the pink noise required for the “ambient noise rejection
test”. For calibration of noise ambiences for the “speech quality in presence of
background noise” test, see section 3.10.
Figure 3-12: Measurement window for ambient noise field calibration
Please refer to application note 1GA51, available on the R&S download web site, for
suggestions how to generate the noise field for the ambient noise rejection test. For the
calibration of the noise field for ambient noise rejection tests, all obstacles (test head or
HATS, Telephone etc.) have to be removed from the test chamber. For the generation
of the noise field, additional equipment is necessary. The noise field should have
sufficient homogeneity (sound pressure level independent of place) and diffuseness
(randomly incident sound at the place of the microphone). This can be achieved either
in a reverberation room with omni-directionally radiating sound source or in an
anechoic room with a number of uncorrelated noise sources. Limited homogeneity can
be achieved in the centre between two speakers. For good diffuseness a minimum of
four speakers distributed in different spatial directions are required.
A diffuse field or pressure field microphone must be positioned at the spot of the mouth
reference point of the (removed) test head or HATS.
The menu Item Calibration Ambient noise field opens the window shown in
Figure 2-27.
The button “Adjust Spectrum” starts a continuous spectrum measurement, which
allows you to adjust the spectrum of the noise, e.g. using equalizers. The template is
centered around the curve irrespective of the absolute level.
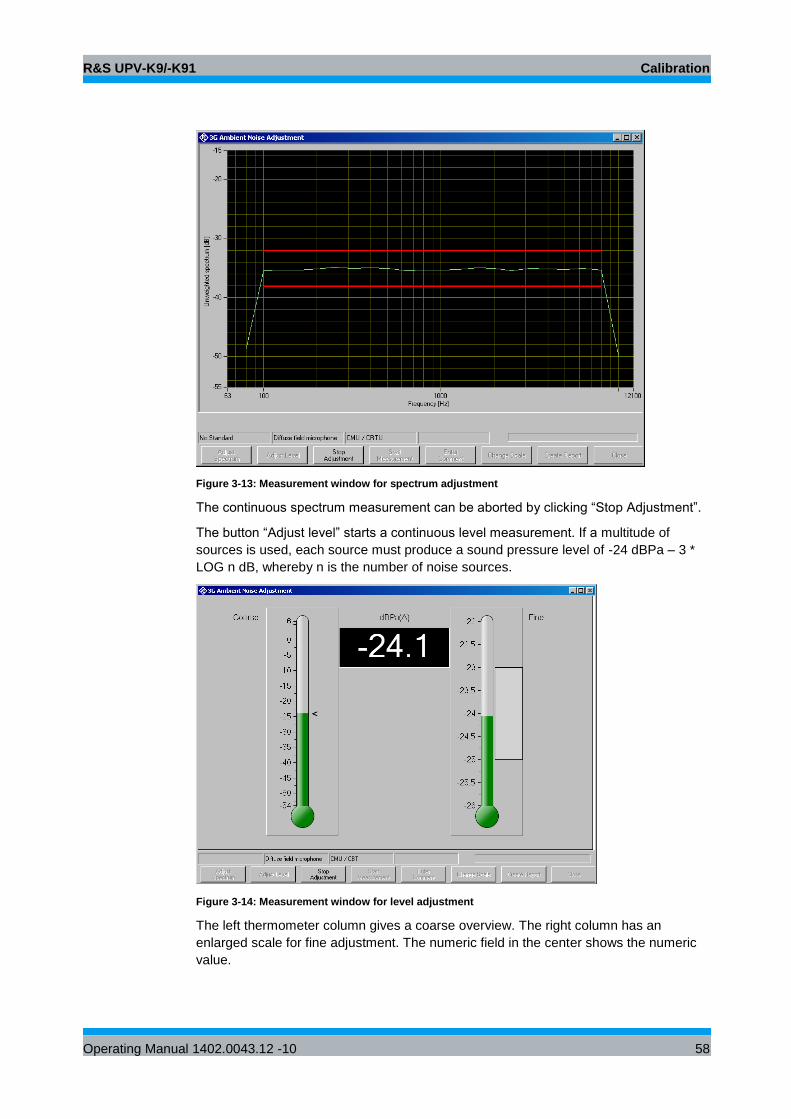
R&S UPV-K9/-K91 Calibration
Operating Manual 1402.0043.12 -10 58
Figure 3-13: Measurement window for spectrum adjustment
The continuous spectrum measurement can be aborted by clicking “Stop Adjustment”.
The button “Adjust level” starts a continuous level measurement. If a multitude of
sources is used, each source must produce a sound pressure level of -24 dBPa – 3 *
LOG n dB, whereby n is the number of noise sources.
Figure 3-14: Measurement window for level adjustment
The left thermometer column gives a coarse overview. The right column has an
enlarged scale for fine adjustment. The numeric field in the center shows the numeric
value.
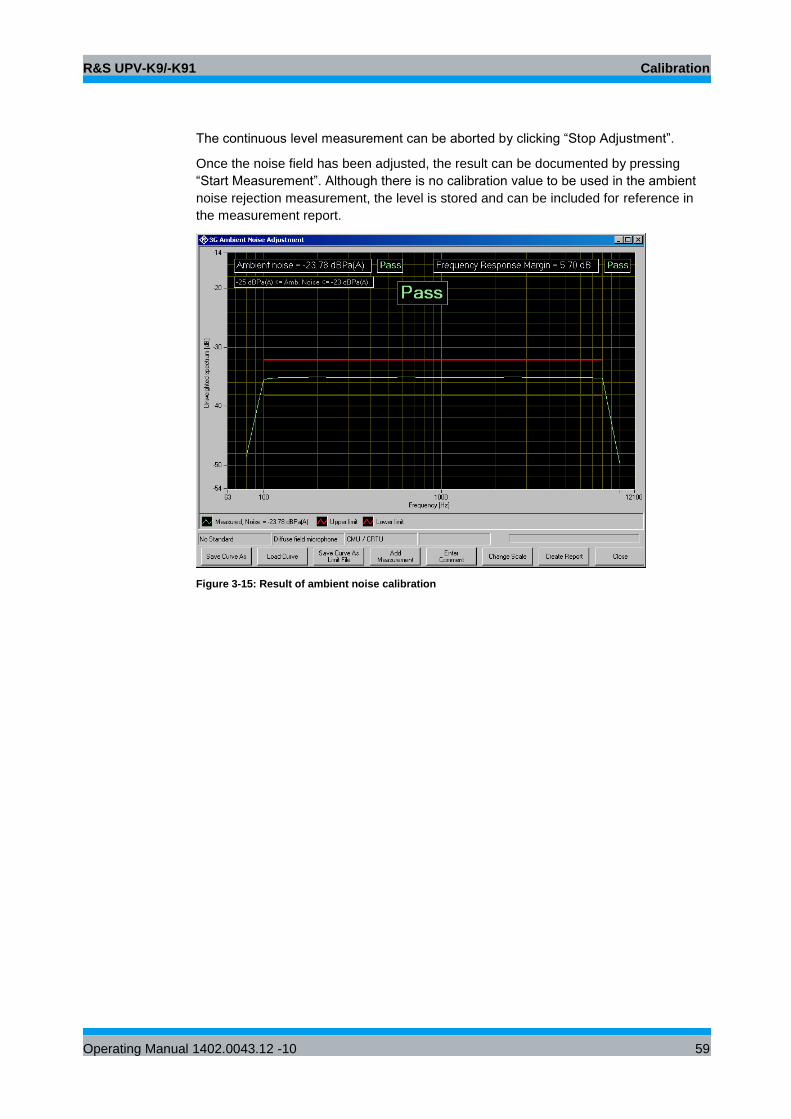
R&S UPV-K9/-K91 Calibration
Operating Manual 1402.0043.12 -10 59
The continuous level measurement can be aborted by clicking “Stop Adjustment”.
Once the noise field has been adjusted, the result can be documented by pressing
“Start Measurement”. Although there is no calibration value to be used in the ambient
noise rejection measurement, the level is stored and can be included for reference in
the measurement report.
Figure 3-15: Result of ambient noise calibration
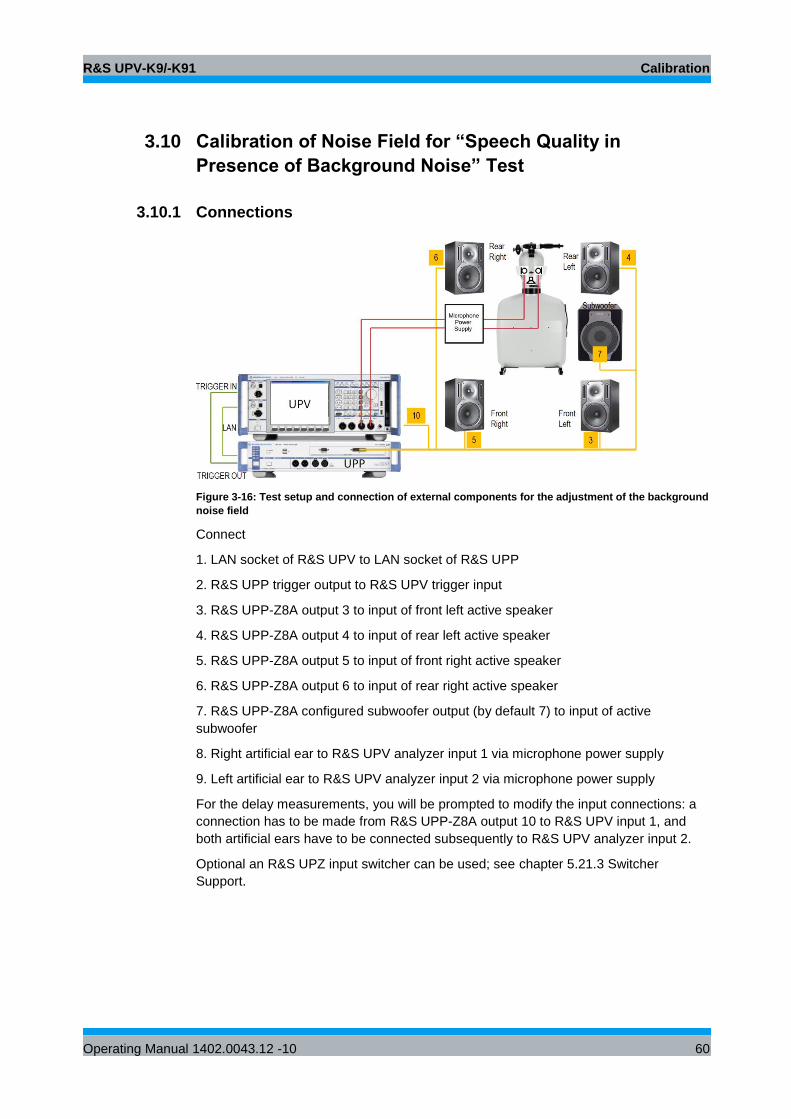
R&S UPV-K9/-K91 Calibration
Operating Manual 1402.0043.12 -10 60
3.10 Calibration of Noise Field for “Speech Quality in
Presence of Background Noise” Test
3.10.1 Connections
Figure 3-16: Test setup and connection of external components for the adjustment of the background
noise field
Connect
1. LAN socket of R&S UPV to LAN socket of R&S UPP
2. R&S UPP trigger output to R&S UPV trigger input
3. R&S UPP-Z8A output 3 to input of front left active speaker
4. R&S UPP-Z8A output 4 to input of rear left active speaker
5. R&S UPP-Z8A output 5 to input of front right active speaker
6. R&S UPP-Z8A output 6 to input of rear right active speaker
7. R&S UPP-Z8A configured subwoofer output (by default 7) to input of active
subwoofer
8. Right artificial ear to R&S UPV analyzer input 1 via microphone power supply
9. Left artificial ear to R&S UPV analyzer input 2 via microphone power supply
For the delay measurements, you will be prompted to modify the input connections: a
connection has to be made from R&S UPP-Z8A output 10 to R&S UPV input 1, and
both artificial ears have to be connected subsequently to R&S UPV analyzer input 2.
Optional an R&S UPZ input switcher can be used; see chapter 5.21.3 Switcher
Support.
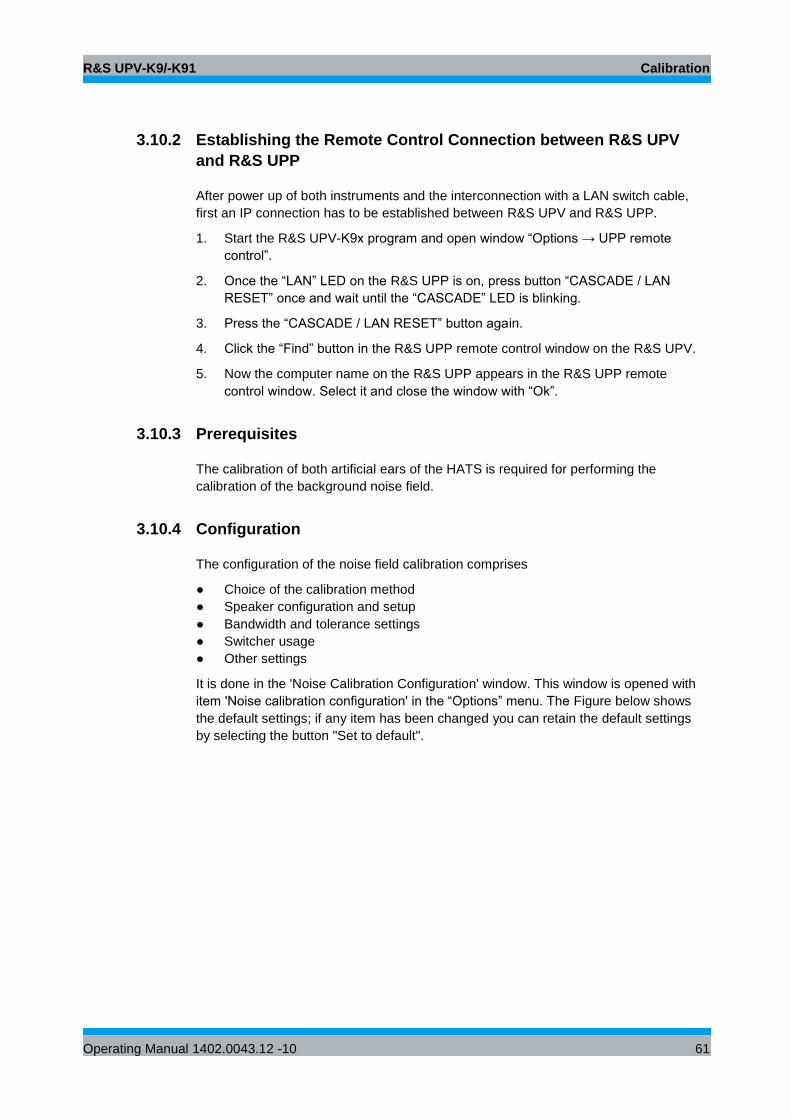
R&S UPV-K9/-K91 Calibration
Operating Manual 1402.0043.12 -10 61
3.10.2 Establishing the Remote Control Connection between R&S UPV
and R&S UPP
After power up of both instruments and the interconnection with a LAN switch cable,
first an IP connection has to be established between R&S UPV and R&S UPP.
1. Start the R&S UPV-K9x program and open window “Options → UPP remote
control”.
2. Once the “LAN” LED on the R&S UPP is on, press button “CASCADE / LAN
RESET” once and wait until the “CASCADE” LED is blinking.
3. Press the “CASCADE / LAN RESET” button again.
4. Click the “Find” button in the R&S UPP remote control window on the R&S UPV.
5. Now the computer name on the R&S UPP appears in the R&S UPP remote
control window. Select it and close the window with “Ok”.
3.10.3 Prerequisites
The calibration of both artificial ears of the HATS is required for performing the
calibration of the background noise field.
3.10.4 Configuration
The configuration of the noise field calibration comprises
● Choice of the calibration method
● Speaker configuration and setup
● Bandwidth and tolerance settings
● Switcher usage
● Other settings
It is done in the 'Noise Calibration Configuration' window. This window is opened with
item 'Noise calibration configuration' in the “Options” menu. The Figure below shows
the default settings; if any item has been changed you can retain the default settings
by selecting the button "Set to default".
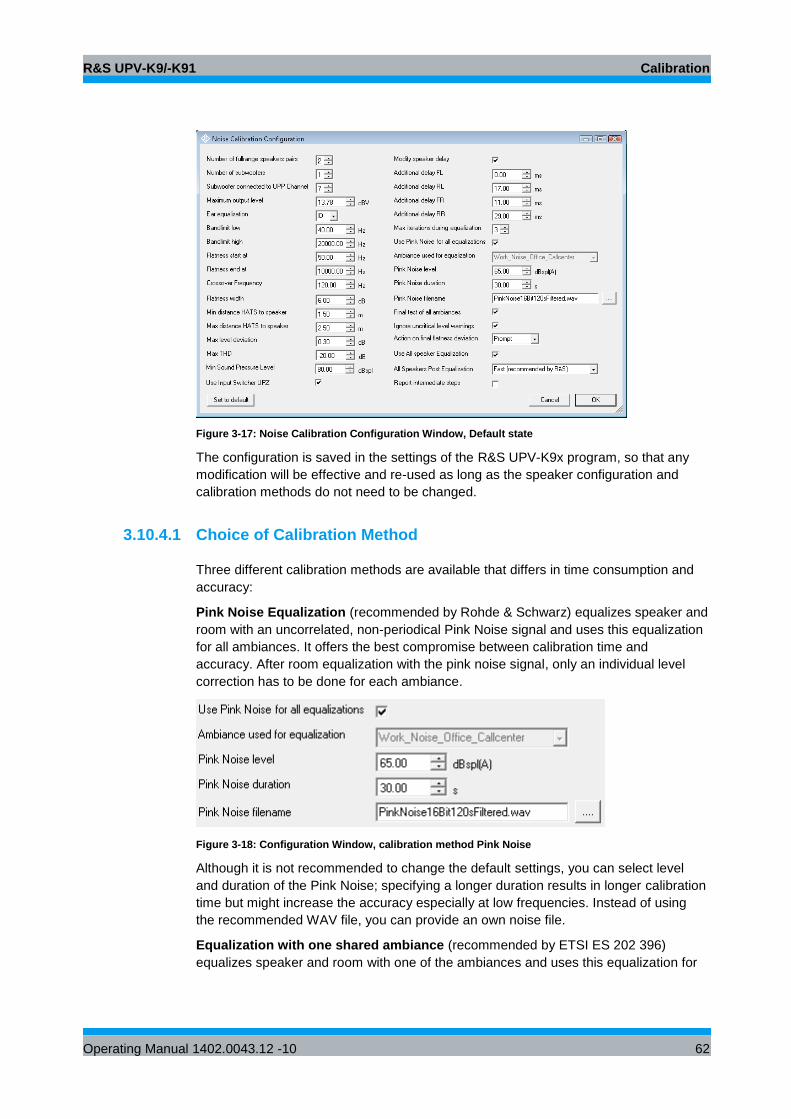
R&S UPV-K9/-K91 Calibration
Operating Manual 1402.0043.12 -10 62
Figure 3-17: Noise Calibration Configuration Window, Default state
The configuration is saved in the settings of the R&S UPV-K9x program, so that any
modification will be effective and re-used as long as the speaker configuration and
calibration methods do not need to be changed.
3.10.4.1 Choice of Calibration Method
Three different calibration methods are available that differs in time consumption and
accuracy:
Pink Noise Equalization (recommended by Rohde & Schwarz) equalizes speaker and
room with an uncorrelated, non-periodical Pink Noise signal and uses this equalization
for all ambiances. It offers the best compromise between calibration time and
accuracy. After room equalization with the pink noise signal, only an individual level
correction has to be done for each ambiance.
Figure 3-18: Configuration Window, calibration method Pink Noise
Although it is not recommended to change the default settings, you can select level
and duration of the Pink Noise; specifying a longer duration results in longer calibration
time but might increase the accuracy especially at low frequencies. Instead of using
the recommended WAV file, you can provide an own noise file.
Equalization with one shared ambiance (recommended by ETSI ES 202 396)
equalizes speaker and room with one of the ambiances and uses this equalization for
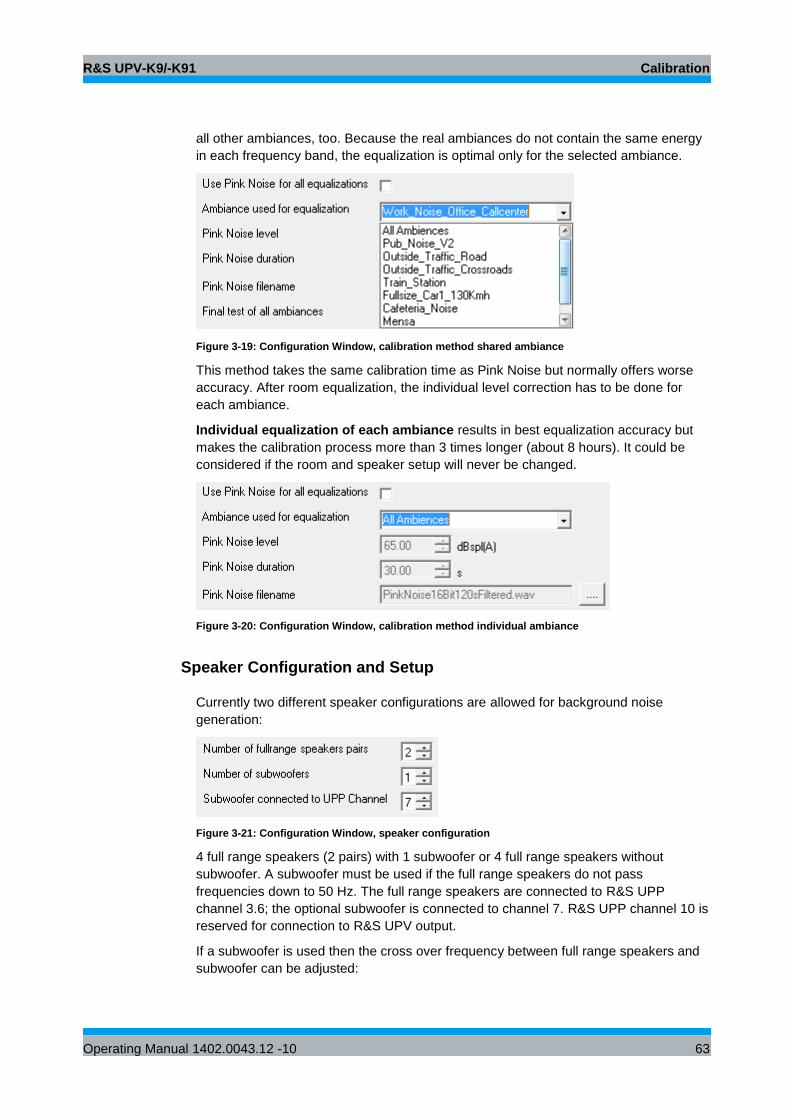
R&S UPV-K9/-K91 Calibration
Operating Manual 1402.0043.12 -10 63
all other ambiances, too. Because the real ambiances do not contain the same energy
in each frequency band, the equalization is optimal only for the selected ambiance.
Figure 3-19: Configuration Window, calibration method shared ambiance
This method takes the same calibration time as Pink Noise but normally offers worse
accuracy. After room equalization, the individual level correction has to be done for
each ambiance.
Individual equalization of each ambiance results in best equalization accuracy but
makes the calibration process more than 3 times longer (about 8 hours). It could be
considered if the room and speaker setup will never be changed.
Figure 3-20: Configuration Window, calibration method individual ambiance
Speaker Configuration and Setup
Currently two different speaker configurations are allowed for background noise
generation:
Figure 3-21: Configuration Window, speaker configuration
4 full range speakers (2 pairs) with 1 subwoofer or 4 full range speakers without
subwoofer. A subwoofer must be used if the full range speakers do not pass
frequencies down to 50 Hz. The full range speakers are connected to R&S UPP
channel 3.6; the optional subwoofer is connected to channel 7. R&S UPP channel 10 is
reserved for connection to R&S UPV output.
If a subwoofer is used then the cross over frequency between full range speakers and
subwoofer can be adjusted:
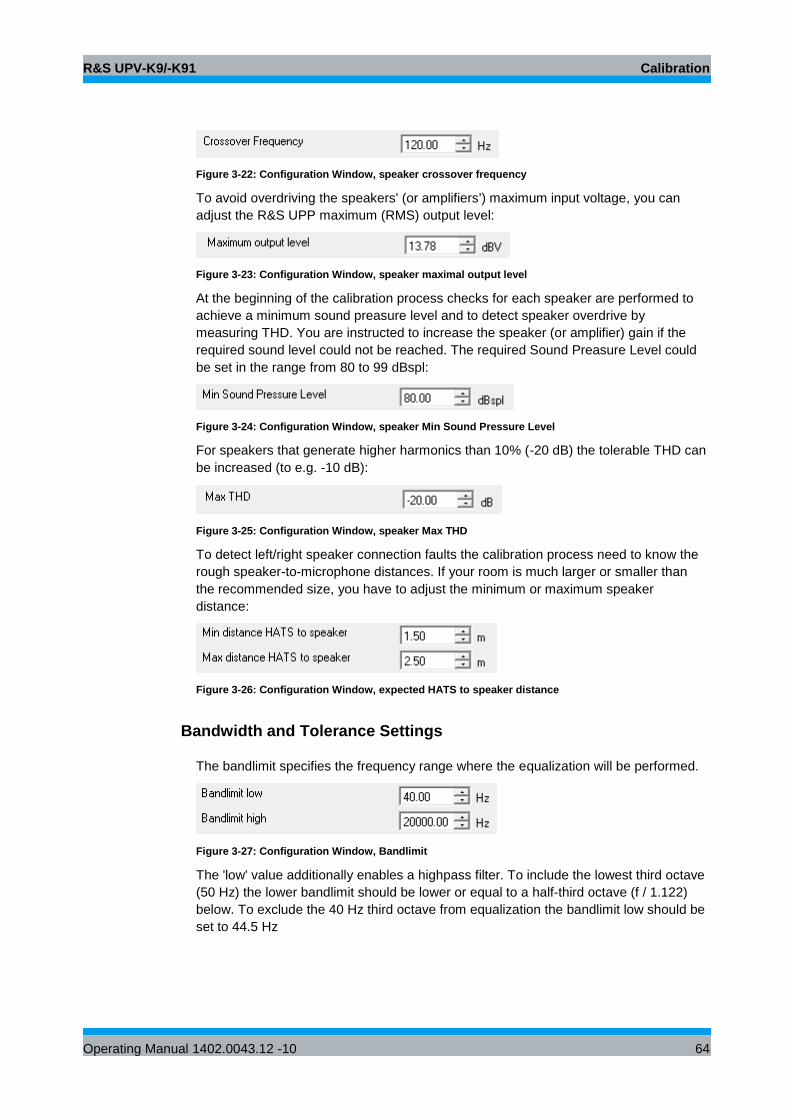
R&S UPV-K9/-K91 Calibration
Operating Manual 1402.0043.12 -10 64
Figure 3-22: Configuration Window, speaker crossover frequency
To avoid overdriving the speakers' (or amplifiers') maximum input voltage, you can
adjust the R&S UPP maximum (RMS) output level:
Figure 3-23: Configuration Window, speaker maximal output level
At the beginning of the calibration process checks for each speaker are performed to
achieve a minimum sound preasure level and to detect speaker overdrive by
measuring THD. You are instructed to increase the speaker (or amplifier) gain if the
required sound level could not be reached. The required Sound Preasure Level could
be set in the range from 80 to 99 dBspl:
Figure 3-24: Configuration Window, speaker Min Sound Pressure Level
For speakers that generate higher harmonics than 10% (-20 dB) the tolerable THD can
be increased (to e.g. -10 dB):
Figure 3-25: Configuration Window, speaker Max THD
To detect left/right speaker connection faults the calibration process need to know the
rough speaker-to-microphone distances. If your room is much larger or smaller than
the recommended size, you have to adjust the minimum or maximum speaker
distance:
Figure 3-26: Configuration Window, expected HATS to speaker distance
Bandwidth and Tolerance Settings
The bandlimit specifies the frequency range where the equalization will be performed.
Figure 3-27: Configuration Window, Bandlimit
The 'low' value additionally enables a highpass filter. To include the lowest third octave
(50 Hz) the lower bandlimit should be lower or equal to a half-third octave (f / 1.122)
below. To exclude the 40 Hz third octave from equalization the bandlimit low should be
set to 44.5 Hz
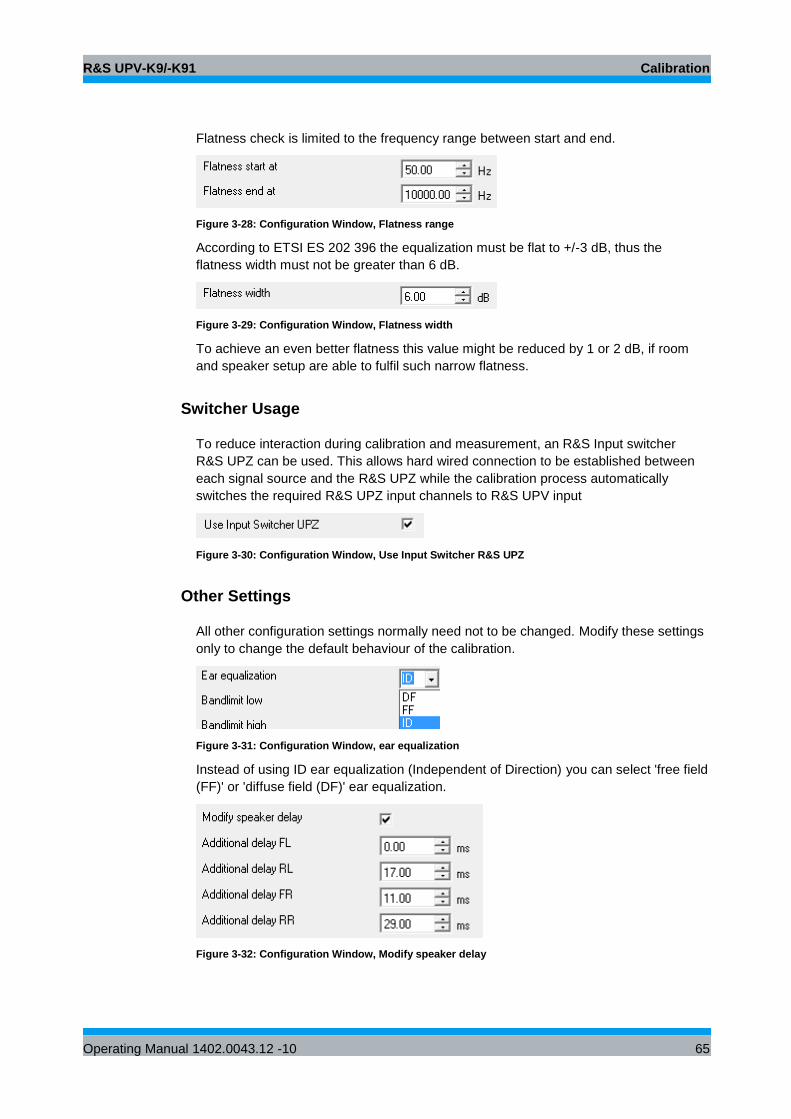
R&S UPV-K9/-K91 Calibration
Operating Manual 1402.0043.12 -10 65
Flatness check is limited to the frequency range between start and end.
Figure 3-28: Configuration Window, Flatness range
According to ETSI ES 202 396 the equalization must be flat to +/-3 dB, thus the
flatness width must not be greater than 6 dB.
Figure 3-29: Configuration Window, Flatness width
To achieve an even better flatness this value might be reduced by 1 or 2 dB, if room
and speaker setup are able to fulfil such narrow flatness.
Switcher Usage
To reduce interaction during calibration and measurement, an R&S Input switcher
R&S UPZ can be used. This allows hard wired connection to be established between
each signal source and the R&S UPZ while the calibration process automatically
switches the required R&S UPZ input channels to R&S UPV input
Figure 3-30: Configuration Window, Use Input Switcher R&S UPZ
Other Settings
All other configuration settings normally need not to be changed. Modify these settings
only to change the default behaviour of the calibration.
Figure 3-31: Configuration Window, ear equalization
Instead of using ID ear equalization (Independent of Direction) you can select 'free field
(FF)' or 'diffuse field (DF)' ear equalization.
Figure 3-32: Configuration Window, Modify speaker delay
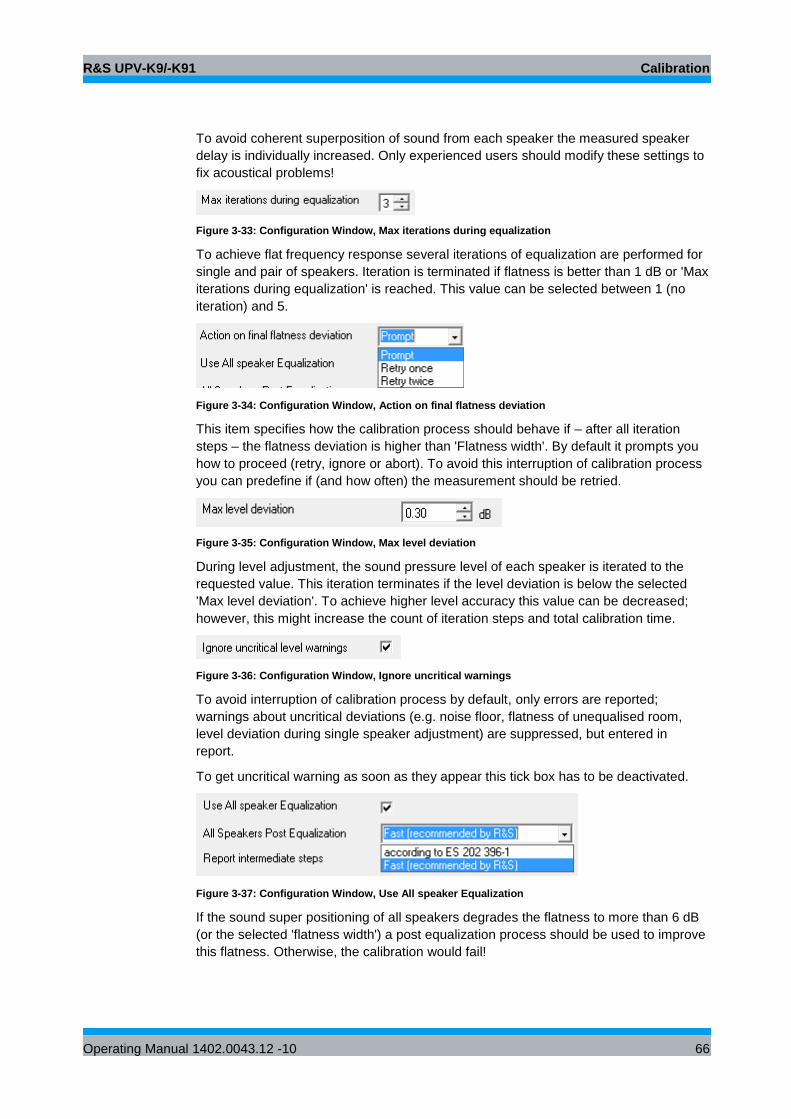
R&S UPV-K9/-K91 Calibration
Operating Manual 1402.0043.12 -10 66
To avoid coherent superposition of sound from each speaker the measured speaker
delay is individually increased. Only experienced users should modify these settings to
fix acoustical problems!
Figure 3-33: Configuration Window, Max iterations during equalization
To achieve flat frequency response several iterations of equalization are performed for
single and pair of speakers. Iteration is terminated if flatness is better than 1 dB or 'Max
iterations during equalization' is reached. This value can be selected between 1 (no
iteration) and 5.
Figure 3-34: Configuration Window, Action on final flatness deviation
This item specifies how the calibration process should behave if – after all iteration
steps – the flatness deviation is higher than 'Flatness width'. By default it prompts you
how to proceed (retry, ignore or abort). To avoid this interruption of calibration process
you can predefine if (and how often) the measurement should be retried.
Figure 3-35: Configuration Window, Max level deviation
During level adjustment, the sound pressure level of each speaker is iterated to the
requested value. This iteration terminates if the level deviation is below the selected
'Max level deviation'. To achieve higher level accuracy this value can be decreased;
however, this might increase the count of iteration steps and total calibration time.
Figure 3-36: Configuration Window, Ignore uncritical warnings
To avoid interruption of calibration process by default, only errors are reported;
warnings about uncritical deviations (e.g. noise floor, flatness of unequalised room,
level deviation during single speaker adjustment) are suppressed, but entered in
report.
To get uncritical warning as soon as they appear this tick box has to be deactivated.
Figure 3-37: Configuration Window, Use All speaker Equalization
If the sound super positioning of all speakers degrades the flatness to more than 6 dB
(or the selected 'flatness width') a post equalization process should be used to improve
this flatness. Otherwise, the calibration would fail!
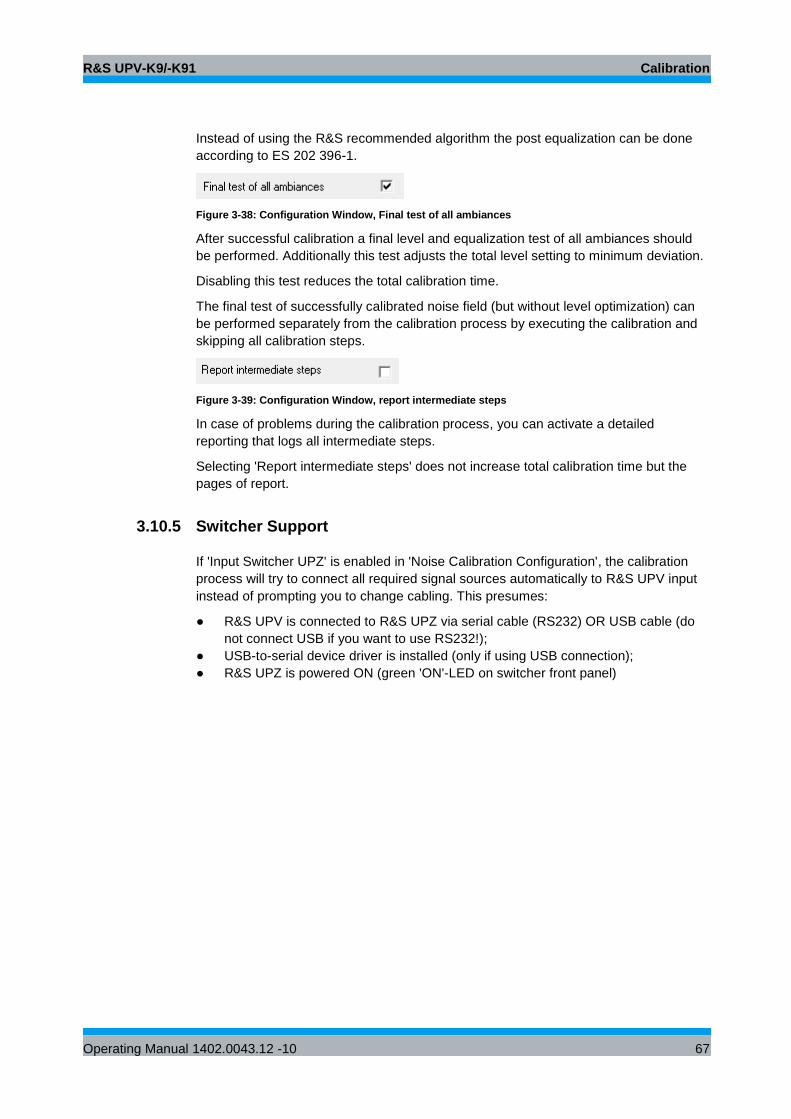
R&S UPV-K9/-K91 Calibration
Operating Manual 1402.0043.12 -10 67
Instead of using the R&S recommended algorithm the post equalization can be done
according to ES 202 396-1.
Figure 3-38: Configuration Window, Final test of all ambiances
After successful calibration a final level and equalization test of all ambiances should
be performed. Additionally this test adjusts the total level setting to minimum deviation.
Disabling this test reduces the total calibration time.
The final test of successfully calibrated noise field (but without level optimization) can
be performed separately from the calibration process by executing the calibration and
skipping all calibration steps.
Figure 3-39: Configuration Window, report intermediate steps
In case of problems during the calibration process, you can activate a detailed
reporting that logs all intermediate steps.
Selecting 'Report intermediate steps' does not increase total calibration time but the
pages of report.
3.10.5 Switcher Support
If 'Input Switcher UPZ' is enabled in 'Noise Calibration Configuration', the calibration
process will try to connect all required signal sources automatically to R&S UPV input
instead of prompting you to change cabling. This presumes:
● R&S UPV is connected to R&S UPZ via serial cable (RS232) OR USB cable (do
not connect USB if you want to use RS232!);
● USB-to-serial device driver is installed (only if using USB connection);
● R&S UPZ is powered ON (green 'ON'-LED on switcher front panel)
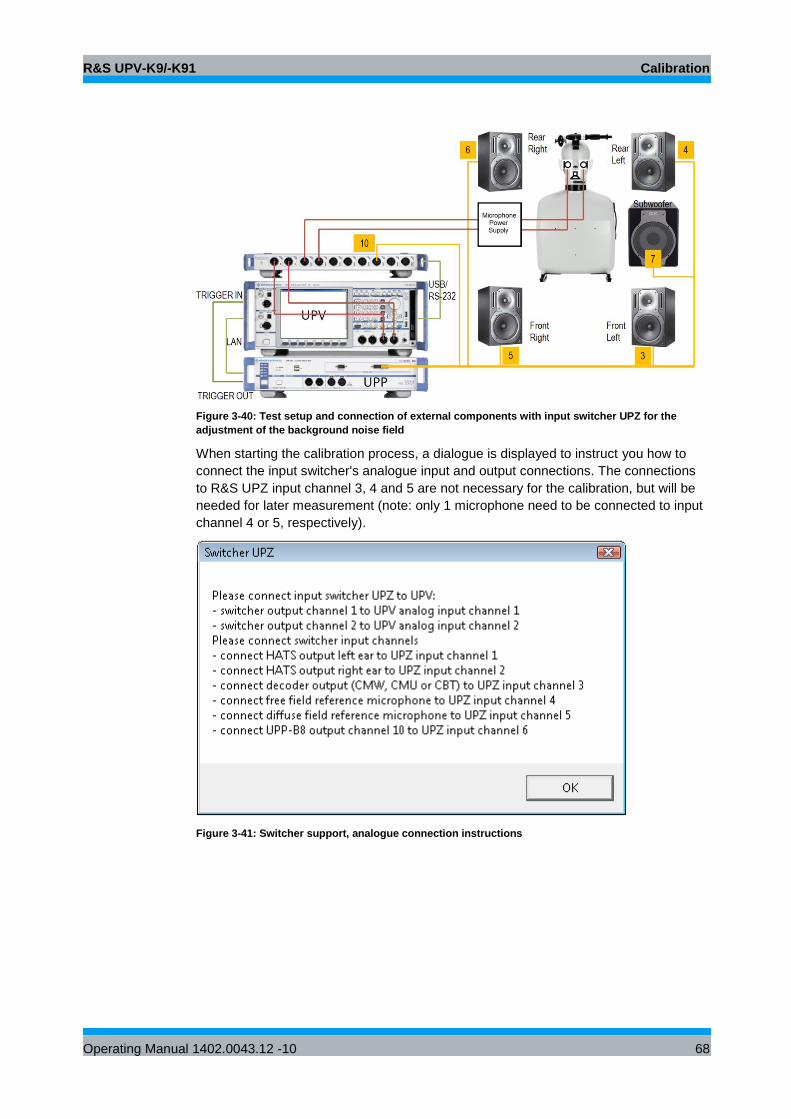
R&S UPV-K9/-K91 Calibration
Operating Manual 1402.0043.12 -10 68
Figure 3-40: Test setup and connection of external components with input switcher UPZ for the
adjustment of the background noise field
When starting the calibration process, a dialogue is displayed to instruct you how to
connect the input switcher's analogue input and output connections. The connections
to R&S UPZ input channel 3, 4 and 5 are not necessary for the calibration, but will be
needed for later measurement (note: only 1 microphone need to be connected to input
channel 4 or 5, respectively).
Figure 3-41: Switcher support, analogue connection instructions
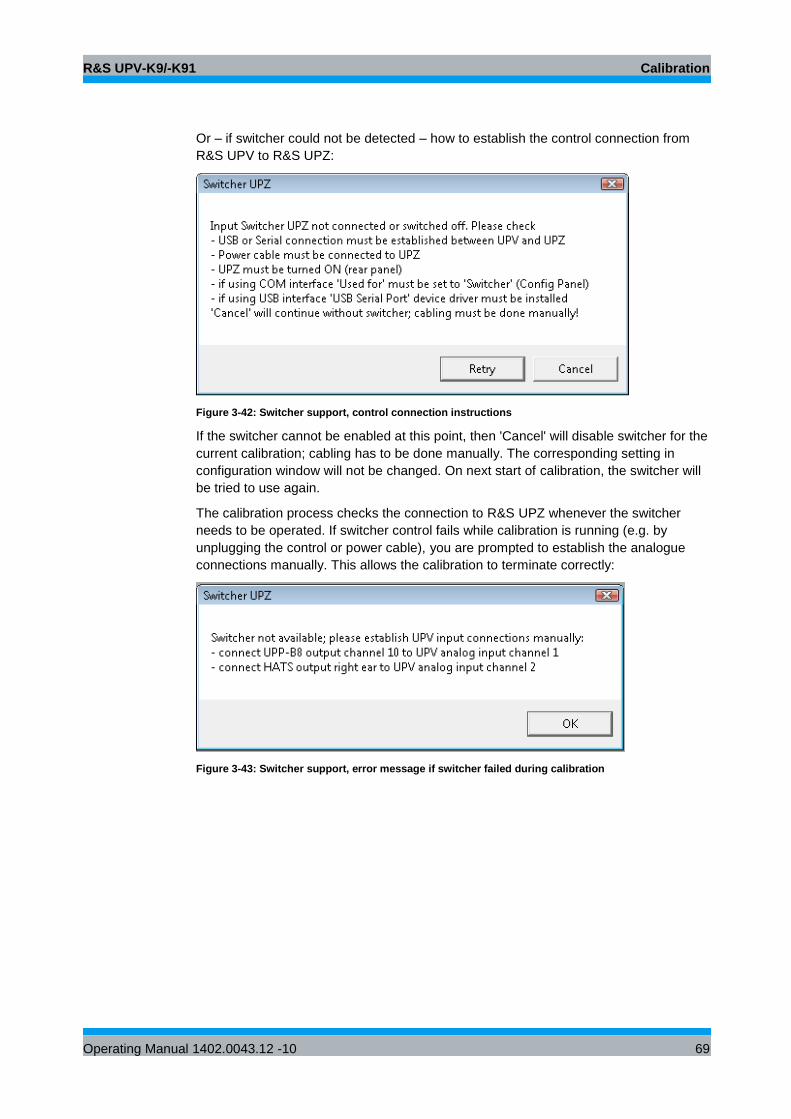
R&S UPV-K9/-K91 Calibration
Operating Manual 1402.0043.12 -10 69
Or – if switcher could not be detected – how to establish the control connection from
R&S UPV to R&S UPZ:
Figure 3-42: Switcher support, control connection instructions
If the switcher cannot be enabled at this point, then 'Cancel' will disable switcher for the
current calibration; cabling has to be done manually. The corresponding setting in
configuration window will not be changed. On next start of calibration, the switcher will
be tried to use again.
The calibration process checks the connection to R&S UPZ whenever the switcher
needs to be operated. If switcher control fails while calibration is running (e.g. by
unplugging the control or power cable), you are prompted to establish the analogue
connections manually. This allows the calibration to terminate correctly:
Figure 3-43: Switcher support, error message if switcher failed during calibration
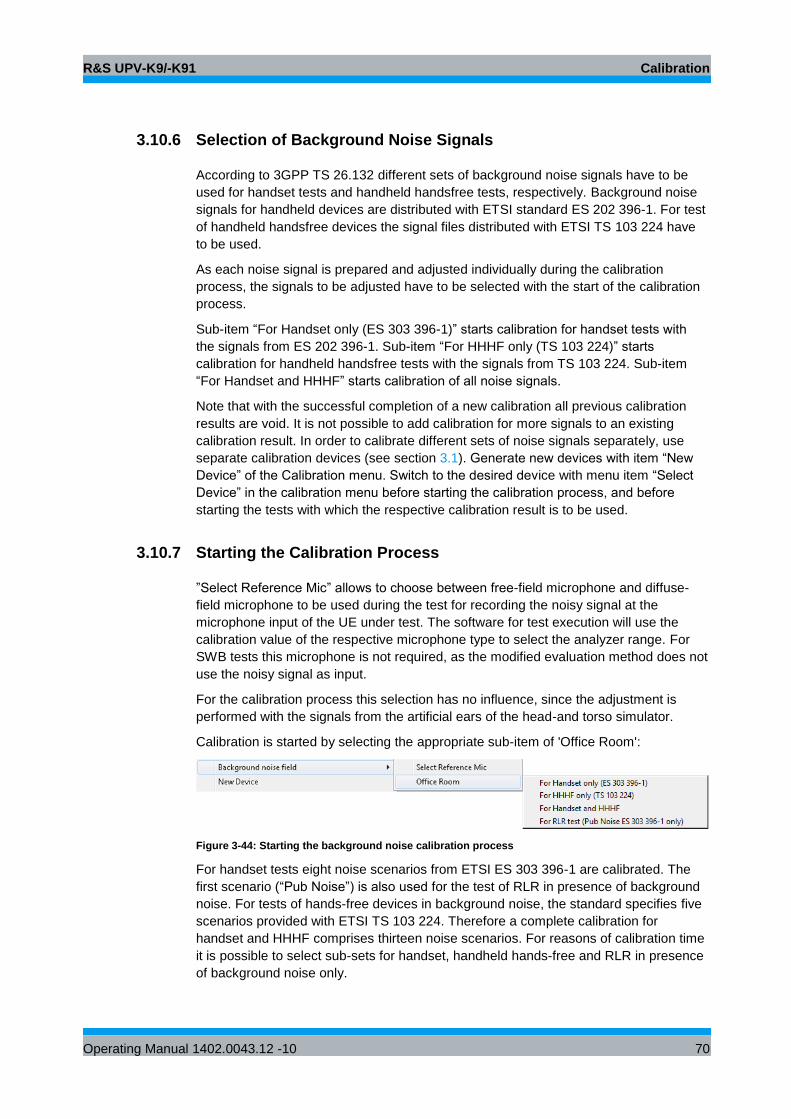
R&S UPV-K9/-K91 Calibration
Operating Manual 1402.0043.12 -10 70
3.10.6 Selection of Background Noise Signals
According to 3GPP TS 26.132 different sets of background noise signals have to be
used for handset tests and handheld handsfree tests, respectively. Background noise
signals for handheld devices are distributed with ETSI standard ES 202 396-1. For test
of handheld handsfree devices the signal files distributed with ETSI TS 103 224 have
to be used.
As each noise signal is prepared and adjusted individually during the calibration
process, the signals to be adjusted have to be selected with the start of the calibration
process.
Sub-item “For Handset only (ES 303 396-1)” starts calibration for handset tests with
the signals from ES 202 396-1. Sub-item “For HHHF only (TS 103 224)” starts
calibration for handheld handsfree tests with the signals from TS 103 224. Sub-item
“For Handset and HHHF” starts calibration of all noise signals.
Note that with the successful completion of a new calibration all previous calibration
results are void. It is not possible to add calibration for more signals to an existing
calibration result. In order to calibrate different sets of noise signals separately, use
separate calibration devices (see section 3.1). Generate new devices with item “New
Device” of the Calibration menu. Switch to the desired device with menu item “Select
Device” in the calibration menu before starting the calibration process, and before
starting the tests with which the respective calibration result is to be used.
3.10.7 Starting the Calibration Process
”Select Reference Mic” allows to choose between free-field microphone and diffuse-
field microphone to be used during the test for recording the noisy signal at the
microphone input of the UE under test. The software for test execution will use the
calibration value of the respective microphone type to select the analyzer range. For
SWB tests this microphone is not required, as the modified evaluation method does not
use the noisy signal as input.
For the calibration process this selection has no influence, since the adjustment is
performed with the signals from the artificial ears of the head-and torso simulator.
Calibration is started by selecting the appropriate sub-item of 'Office Room':
Figure 3-44: Starting the background noise calibration process
For handset tests eight noise scenarios from ETSI ES 303 396-1 are calibrated. The
first scenario (“Pub Noise”) is also used for the test of RLR in presence of background
noise. For tests of hands-free devices in background noise, the standard specifies five
scenarios provided with ETSI TS 103 224. Therefore a complete calibration for
handset and HHHF comprises thirteen noise scenarios. For reasons of calibration time
it is possible to select sub-sets for handset, handheld hands-free and RLR in presence
of background noise only.
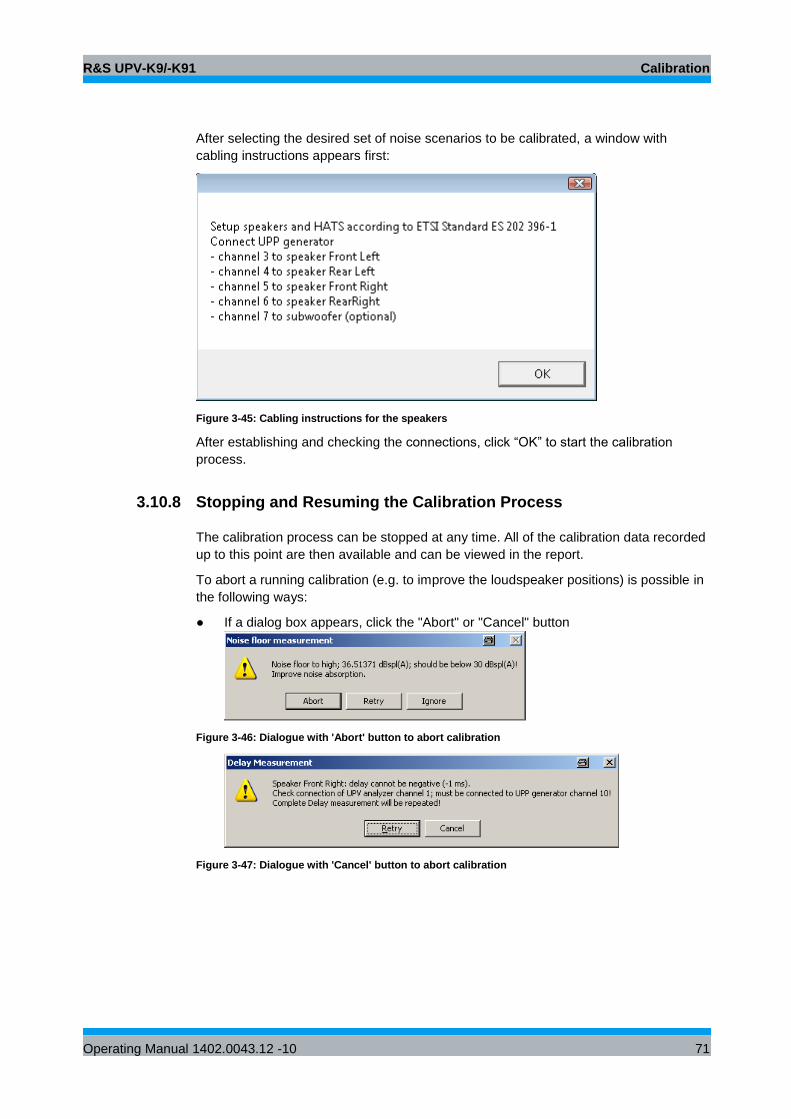
R&S UPV-K9/-K91 Calibration
Operating Manual 1402.0043.12 -10 71
After selecting the desired set of noise scenarios to be calibrated, a window with
cabling instructions appears first:
Figure 3-45: Cabling instructions for the speakers
After establishing and checking the connections, click “OK” to start the calibration
process.
3.10.8 Stopping and Resuming the Calibration Process
The calibration process can be stopped at any time. All of the calibration data recorded
up to this point are then available and can be viewed in the report.
To abort a running calibration (e.g. to improve the loudspeaker positions) is possible in
the following ways:
● If a dialog box appears, click the "Abort" or "Cancel" button
Figure 3-46: Dialogue with 'Abort' button to abort calibration
Figure 3-47: Dialogue with 'Cancel' button to abort calibration
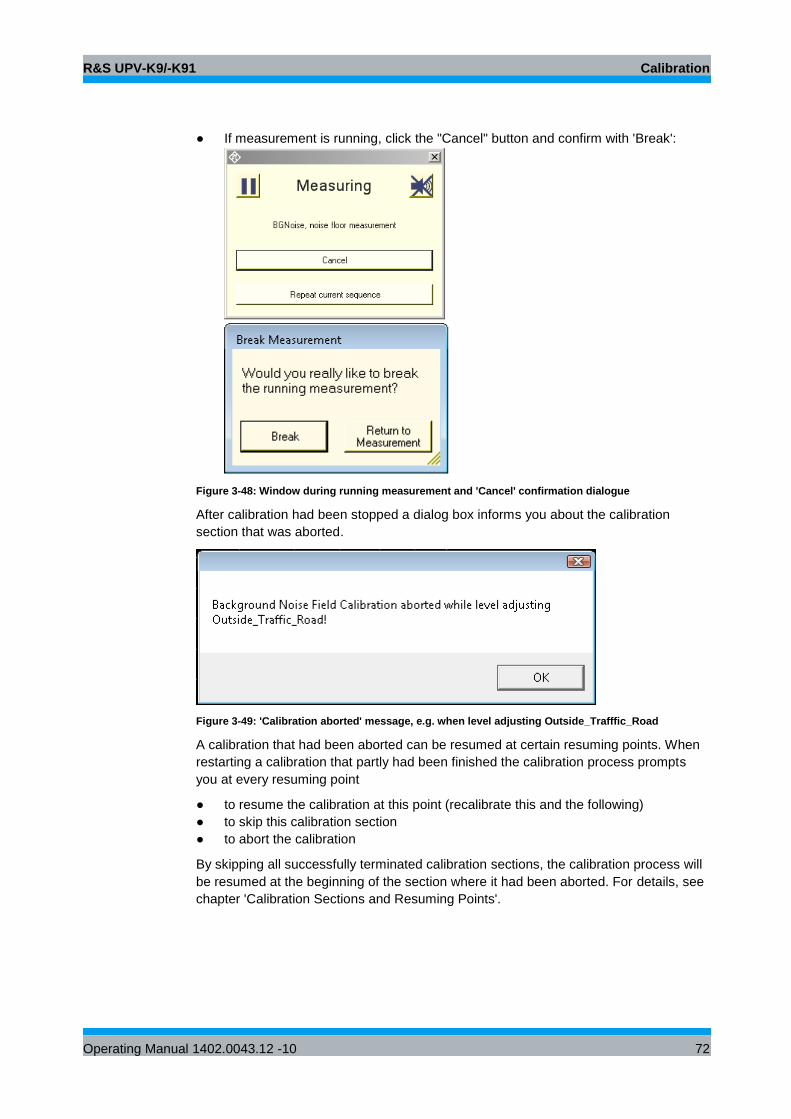
R&S UPV-K9/-K91 Calibration
Operating Manual 1402.0043.12 -10 72
● If measurement is running, click the "Cancel" button and confirm with 'Break':
Figure 3-48: Window during running measurement and 'Cancel' confirmation dialogue
After calibration had been stopped a dialog box informs you about the calibration
section that was aborted.
Figure 3-49: 'Calibration aborted' message, e.g. when level adjusting Outside_Trafffic_Road
A calibration that had been aborted can be resumed at certain resuming points. When
restarting a calibration that partly had been finished the calibration process prompts
you at every resuming point
● to resume the calibration at this point (recalibrate this and the following)
● to skip this calibration section
● to abort the calibration
By skipping all successfully terminated calibration sections, the calibration process will
be resumed at the beginning of the section where it had been aborted. For details, see
chapter 'Calibration Sections and Resuming Points'.
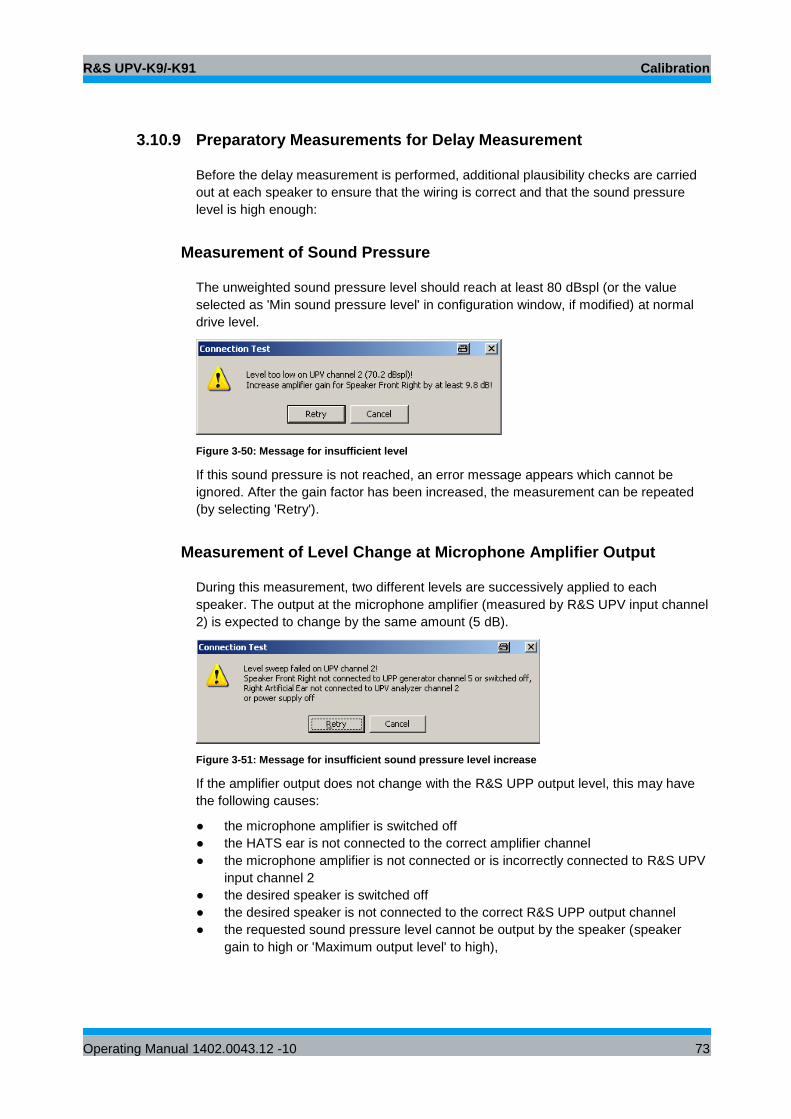
R&S UPV-K9/-K91 Calibration
Operating Manual 1402.0043.12 -10 73
3.10.9 Preparatory Measurements for Delay Measurement
Before the delay measurement is performed, additional plausibility checks are carried
out at each speaker to ensure that the wiring is correct and that the sound pressure
level is high enough:
Measurement of Sound Pressure
The unweighted sound pressure level should reach at least 80 dBspl (or the value
selected as 'Min sound pressure level' in configuration window, if modified) at normal
drive level.
Figure 3-50: Message for insufficient level
If this sound pressure is not reached, an error message appears which cannot be
ignored. After the gain factor has been increased, the measurement can be repeated
(by selecting 'Retry').
Measurement of Level Change at Microphone Amplifier Output
During this measurement, two different levels are successively applied to each
speaker. The output at the microphone amplifier (measured by R&S UPV input channel
2) is expected to change by the same amount (5 dB).
Figure 3-51: Message for insufficient sound pressure level increase
If the amplifier output does not change with the R&S UPP output level, this may have
the following causes:
● the microphone amplifier is switched off
● the HATS ear is not connected to the correct amplifier channel
● the microphone amplifier is not connected or is incorrectly connected to R&S UPV
input channel 2
● the desired speaker is switched off
● the desired speaker is not connected to the correct R&S UPP output channel
● the requested sound pressure level cannot be output by the speaker (speaker
gain to high or 'Maximum output level' to high),
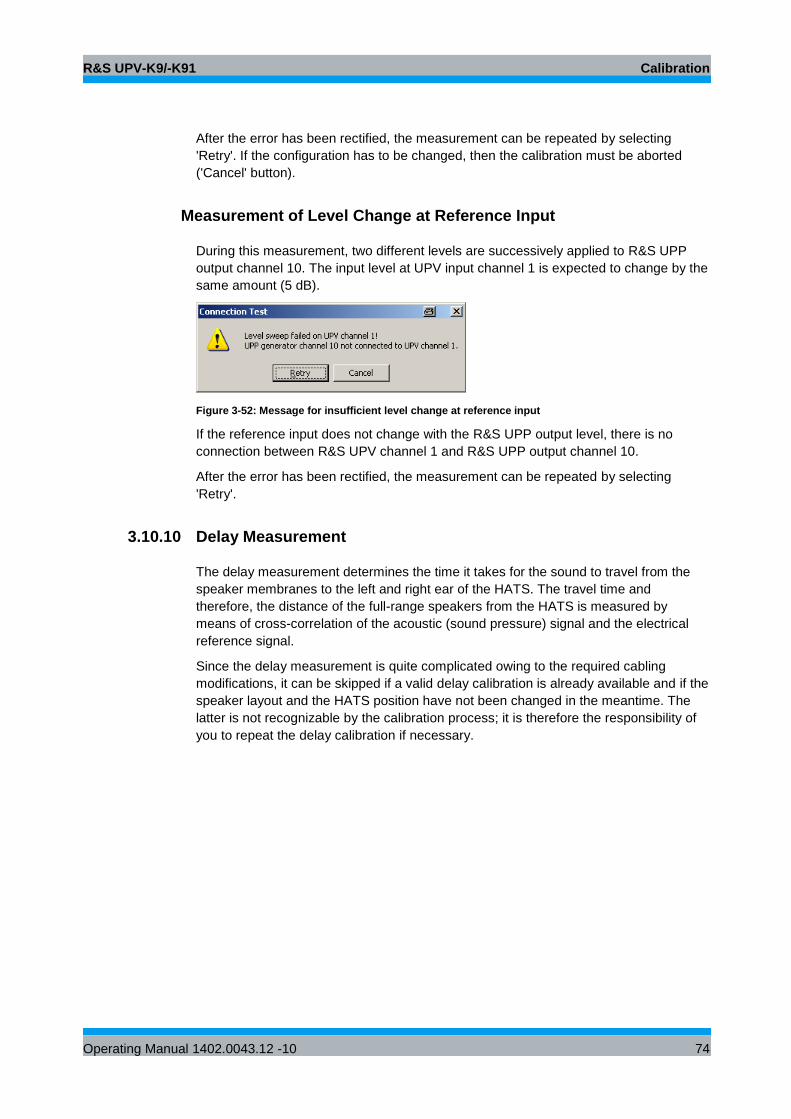
R&S UPV-K9/-K91 Calibration
Operating Manual 1402.0043.12 -10 74
After the error has been rectified, the measurement can be repeated by selecting
'Retry'. If the configuration has to be changed, then the calibration must be aborted
('Cancel' button).
Measurement of Level Change at Reference Input
During this measurement, two different levels are successively applied to R&S UPP
output channel 10. The input level at UPV input channel 1 is expected to change by the
same amount (5 dB).
Figure 3-52: Message for insufficient level change at reference input
If the reference input does not change with the R&S UPP output level, there is no
connection between R&S UPV channel 1 and R&S UPP output channel 10.
After the error has been rectified, the measurement can be repeated by selecting
'Retry'.
3.10.10 Delay Measurement
The delay measurement determines the time it takes for the sound to travel from the
speaker membranes to the left and right ear of the HATS. The travel time and
therefore, the distance of the full-range speakers from the HATS is measured by
means of cross-correlation of the acoustic (sound pressure) signal and the electrical
reference signal.
Since the delay measurement is quite complicated owing to the required cabling
modifications, it can be skipped if a valid delay calibration is already available and if the
speaker layout and the HATS position have not been changed in the meantime. The
latter is not recognizable by the calibration process; it is therefore the responsibility of
you to repeat the delay calibration if necessary.
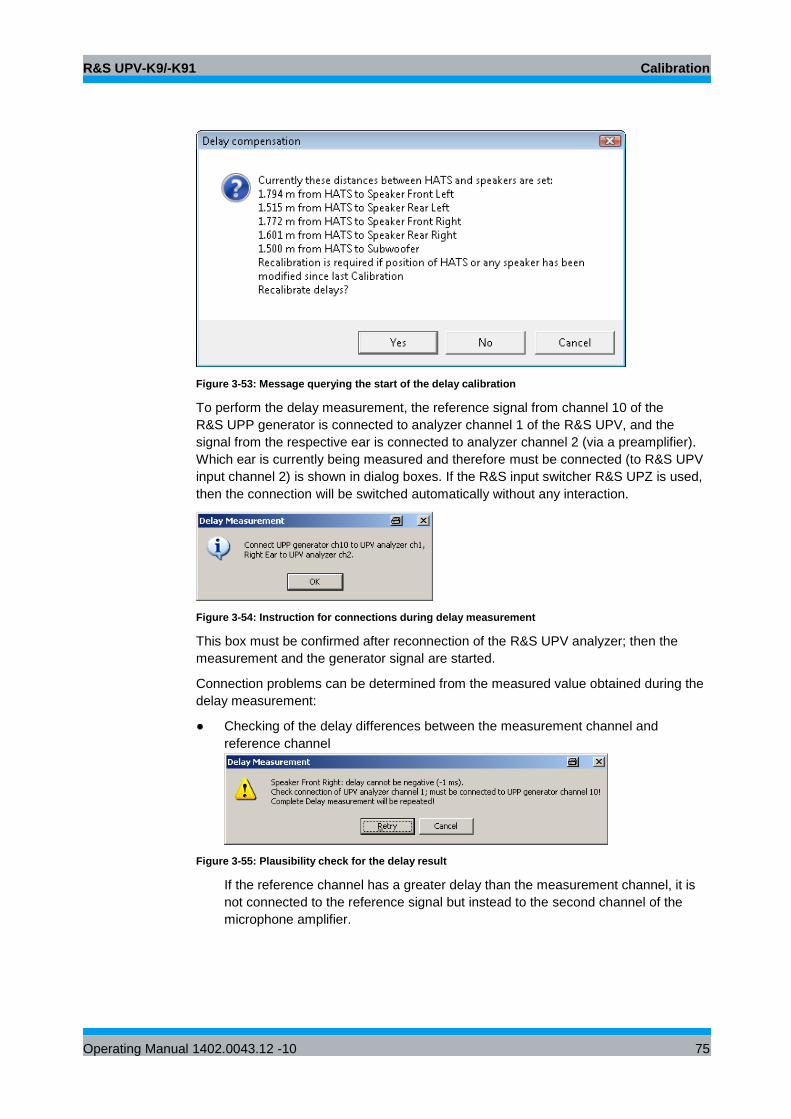
R&S UPV-K9/-K91 Calibration
Operating Manual 1402.0043.12 -10 75
Figure 3-53: Message querying the start of the delay calibration
To perform the delay measurement, the reference signal from channel 10 of the
R&S UPP generator is connected to analyzer channel 1 of the R&S UPV, and the
signal from the respective ear is connected to analyzer channel 2 (via a preamplifier).
Which ear is currently being measured and therefore must be connected (to R&S UPV
input channel 2) is shown in dialog boxes. If the R&S input switcher R&S UPZ is used,
then the connection will be switched automatically without any interaction.
Figure 3-54: Instruction for connections during delay measurement
This box must be confirmed after reconnection of the R&S UPV analyzer; then the
measurement and the generator signal are started.
Connection problems can be determined from the measured value obtained during the
delay measurement:
● Checking of the delay differences between the measurement channel and
reference channel
Figure 3-55: Plausibility check for the delay result
If the reference channel has a greater delay than the measurement channel, it is
not connected to the reference signal but instead to the second channel of the
microphone amplifier.
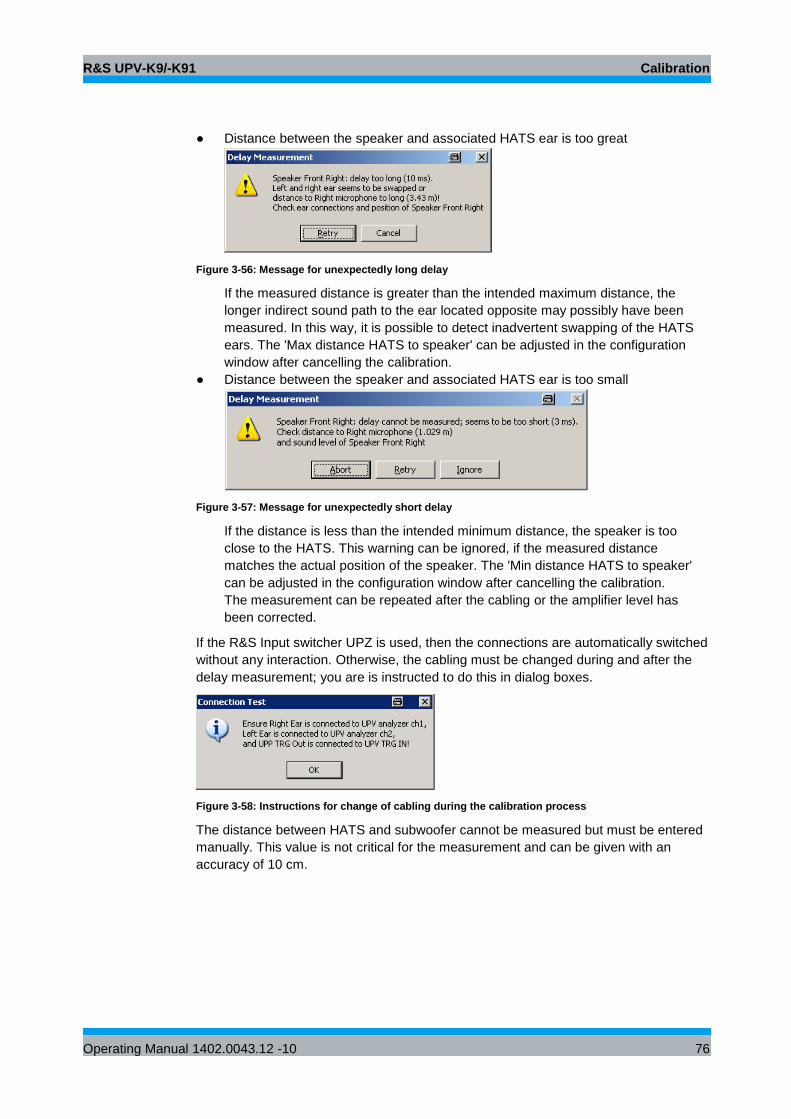
R&S UPV-K9/-K91 Calibration
Operating Manual 1402.0043.12 -10 76
● Distance between the speaker and associated HATS ear is too great
Figure 3-56: Message for unexpectedly long delay
If the measured distance is greater than the intended maximum distance, the
longer indirect sound path to the ear located opposite may possibly have been
measured. In this way, it is possible to detect inadvertent swapping of the HATS
ears. The 'Max distance HATS to speaker' can be adjusted in the configuration
window after cancelling the calibration.
● Distance between the speaker and associated HATS ear is too small
Figure 3-57: Message for unexpectedly short delay
If the distance is less than the intended minimum distance, the speaker is too
close to the HATS. This warning can be ignored, if the measured distance
matches the actual position of the speaker. The 'Min distance HATS to speaker'
can be adjusted in the configuration window after cancelling the calibration.
The measurement can be repeated after the cabling or the amplifier level has
been corrected.
If the R&S Input switcher UPZ is used, then the connections are automatically switched
without any interaction. Otherwise, the cabling must be changed during and after the
delay measurement; you are is instructed to do this in dialog boxes.
Figure 3-58: Instructions for change of cabling during the calibration process
The distance between HATS and subwoofer cannot be measured but must be entered
manually. This value is not critical for the measurement and can be given with an
accuracy of 10 cm.
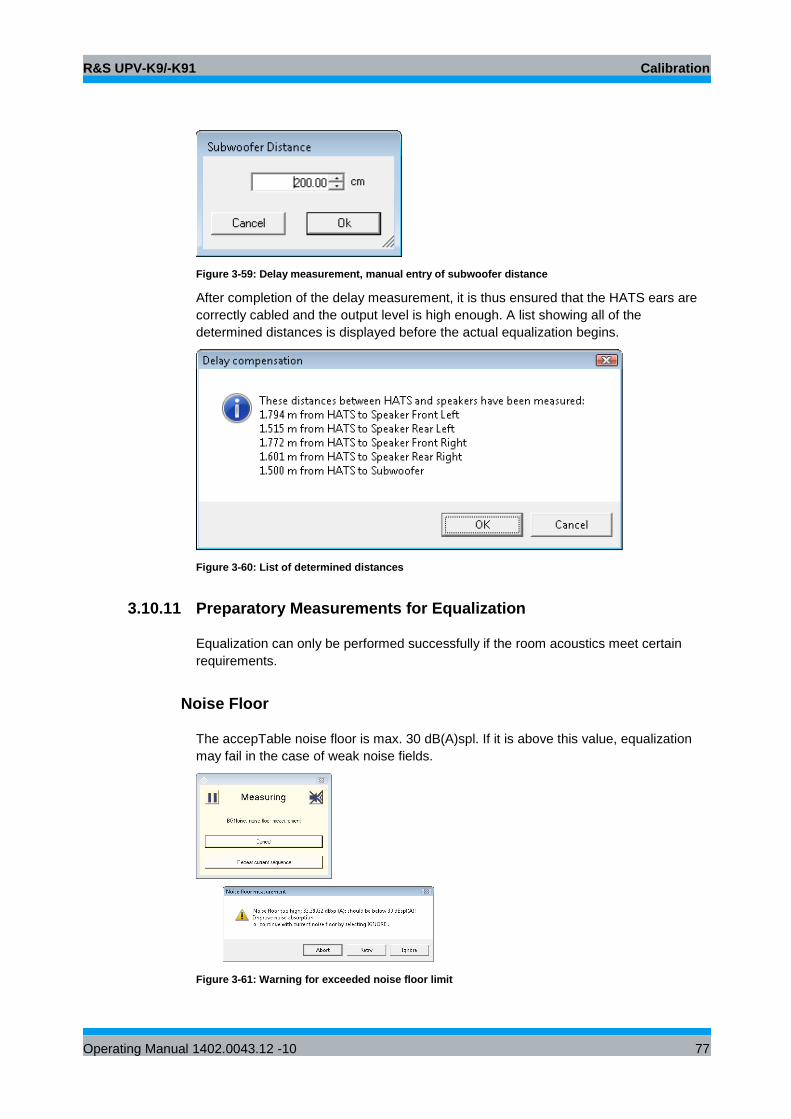
R&S UPV-K9/-K91 Calibration
Operating Manual 1402.0043.12 -10 77
Figure 3-59: Delay measurement, manual entry of subwoofer distance
After completion of the delay measurement, it is thus ensured that the HATS ears are
correctly cabled and the output level is high enough. A list showing all of the
determined distances is displayed before the actual equalization begins.
Figure 3-60: List of determined distances
3.10.11 Preparatory Measurements for Equalization
Equalization can only be performed successfully if the room acoustics meet certain
requirements.
Noise Floor
The accepTable noise floor is max. 30 dB(A)spl. If it is above this value, equalization
may fail in the case of weak noise fields.
Figure 3-61: Warning for exceeded noise floor limit
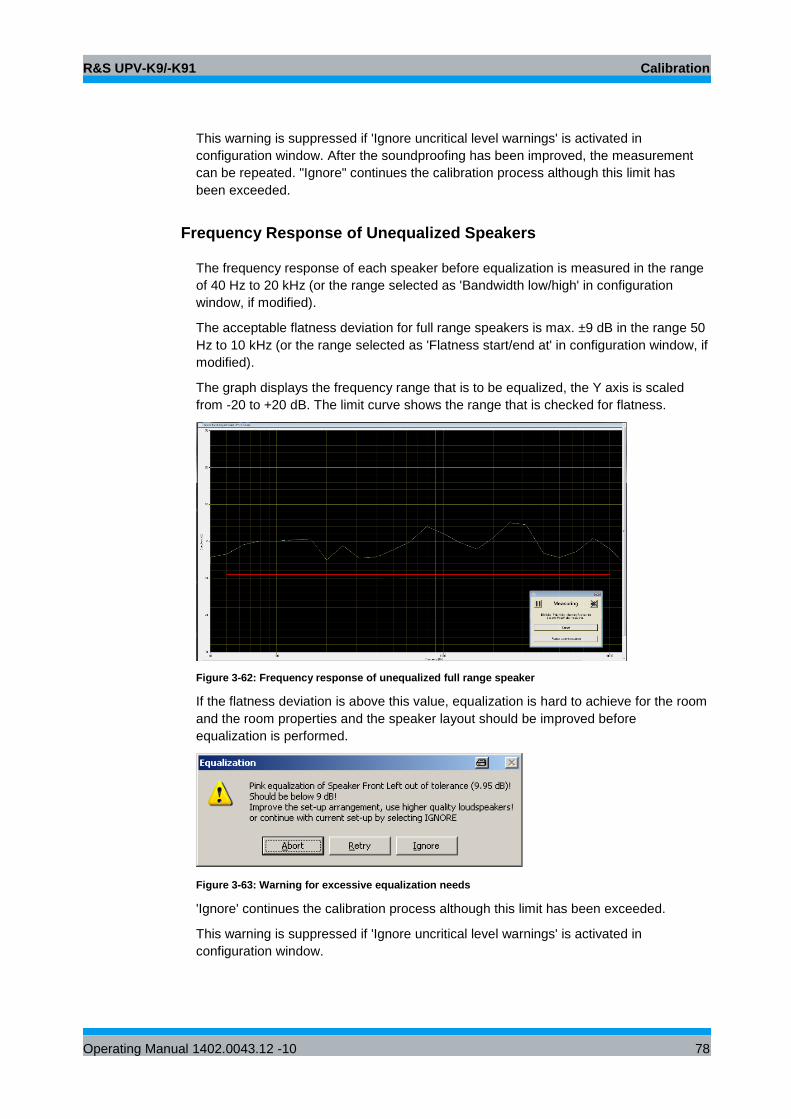
R&S UPV-K9/-K91 Calibration
Operating Manual 1402.0043.12 -10 78
This warning is suppressed if 'Ignore uncritical level warnings' is activated in
configuration window. After the soundproofing has been improved, the measurement
can be repeated. "Ignore" continues the calibration process although this limit has
been exceeded.
Frequency Response of Unequalized Speakers
The frequency response of each speaker before equalization is measured in the range
of 40 Hz to 20 kHz (or the range selected as 'Bandwidth low/high' in configuration
window, if modified).
The acceptable flatness deviation for full range speakers is max. ±9 dB in the range 50
Hz to 10 kHz (or the range selected as 'Flatness start/end at' in configuration window, if
modified).
The graph displays the frequency range that is to be equalized, the Y axis is scaled
from -20 to +20 dB. The limit curve shows the range that is checked for flatness.
Figure 3-62: Frequency response of unequalized full range speaker
If the flatness deviation is above this value, equalization is hard to achieve for the room
and the room properties and the speaker layout should be improved before
equalization is performed.
Figure 3-63: Warning for excessive equalization needs
'Ignore' continues the calibration process although this limit has been exceeded.
This warning is suppressed if 'Ignore uncritical level warnings' is activated in
configuration window.
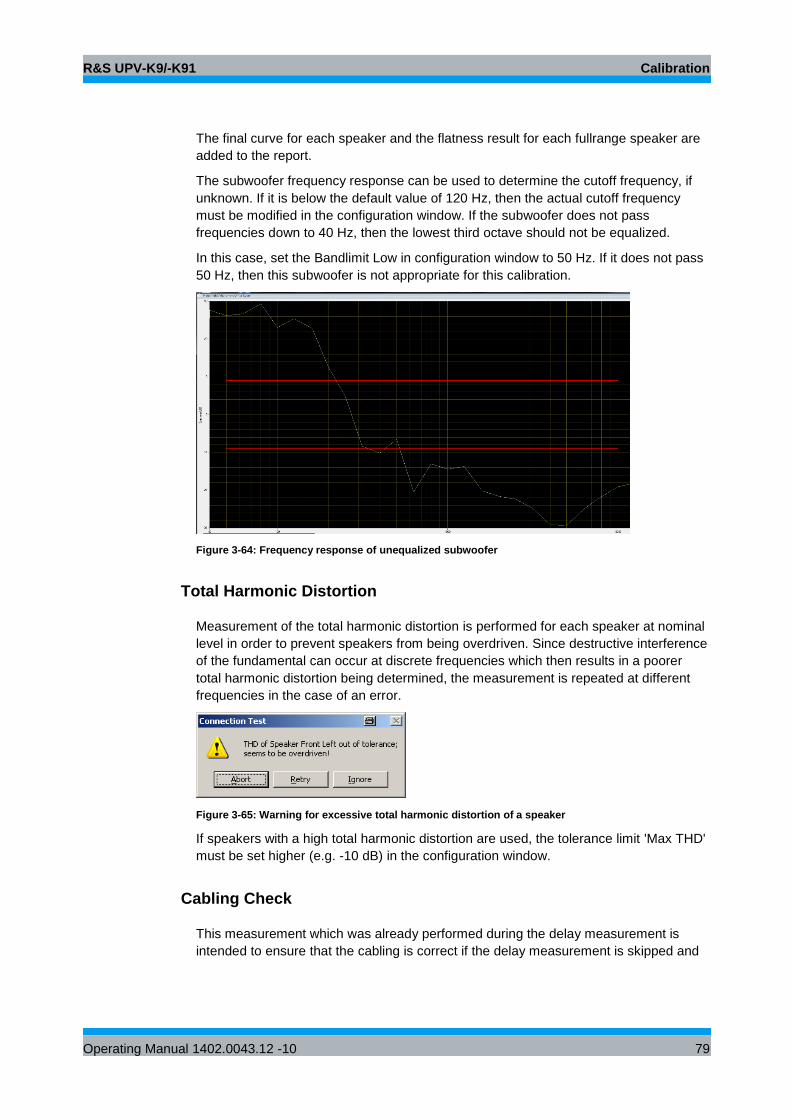
R&S UPV-K9/-K91 Calibration
Operating Manual 1402.0043.12 -10 79
The final curve for each speaker and the flatness result for each fullrange speaker are
added to the report.
The subwoofer frequency response can be used to determine the cutoff frequency, if
unknown. If it is below the default value of 120 Hz, then the actual cutoff frequency
must be modified in the configuration window. If the subwoofer does not pass
frequencies down to 40 Hz, then the lowest third octave should not be equalized.
In this case, set the Bandlimit Low in configuration window to 50 Hz. If it does not pass
50 Hz, then this subwoofer is not appropriate for this calibration.
Figure 3-64: Frequency response of unequalized subwoofer
Total Harmonic Distortion
Measurement of the total harmonic distortion is performed for each speaker at nominal
level in order to prevent speakers from being overdriven. Since destructive interference
of the fundamental can occur at discrete frequencies which then results in a poorer
total harmonic distortion being determined, the measurement is repeated at different
frequencies in the case of an error.
Figure 3-65: Warning for excessive total harmonic distortion of a speaker
If speakers with a high total harmonic distortion are used, the tolerance limit 'Max THD'
must be set higher (e.g. -10 dB) in the configuration window.
Cabling Check
This measurement which was already performed during the delay measurement is
intended to ensure that the cabling is correct if the delay measurement is skipped and
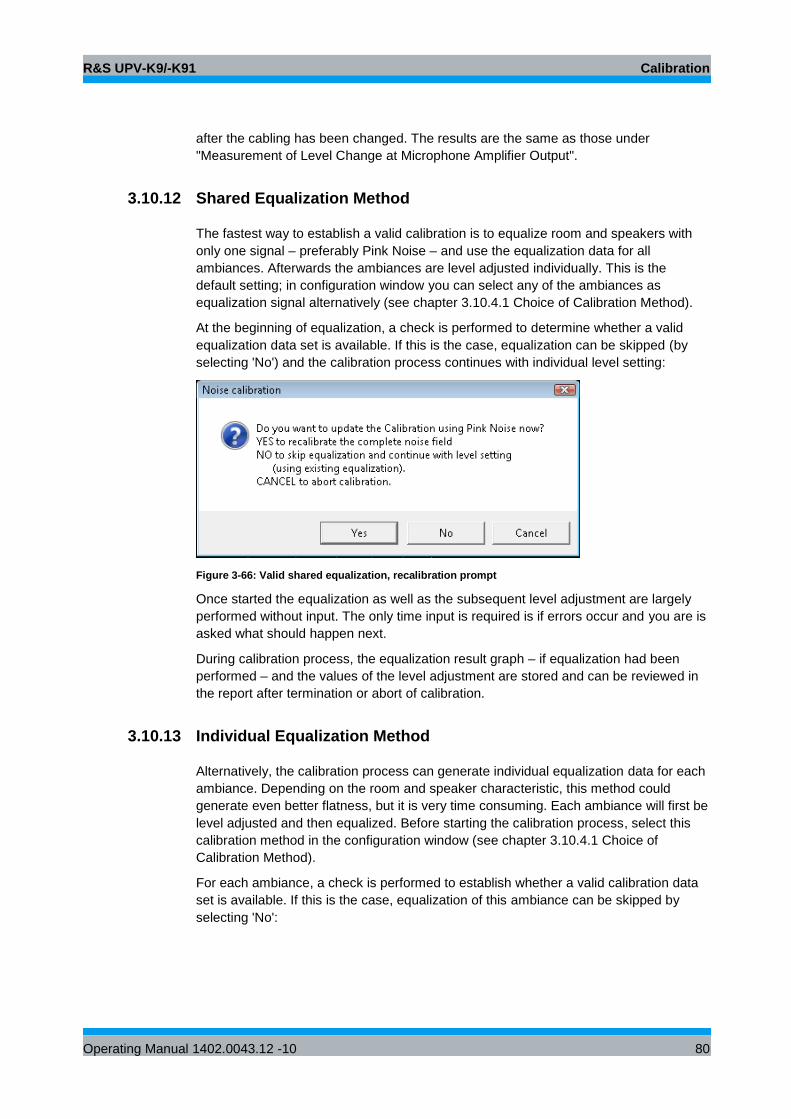
R&S UPV-K9/-K91 Calibration
Operating Manual 1402.0043.12 -10 80
after the cabling has been changed. The results are the same as those under
"Measurement of Level Change at Microphone Amplifier Output".
3.10.12 Shared Equalization Method
The fastest way to establish a valid calibration is to equalize room and speakers with
only one signal – preferably Pink Noise – and use the equalization data for all
ambiances. Afterwards the ambiances are level adjusted individually. This is the
default setting; in configuration window you can select any of the ambiances as
equalization signal alternatively (see chapter 3.10.4.1 Choice of Calibration Method).
At the beginning of equalization, a check is performed to determine whether a valid
equalization data set is available. If this is the case, equalization can be skipped (by
selecting 'No') and the calibration process continues with individual level setting:
Figure 3-66: Valid shared equalization, recalibration prompt
Once started the equalization as well as the subsequent level adjustment are largely
performed without input. The only time input is required is if errors occur and you are is
asked what should happen next.
During calibration process, the equalization result graph – if equalization had been
performed – and the values of the level adjustment are stored and can be reviewed in
the report after termination or abort of calibration.
3.10.13 Individual Equalization Method
Alternatively, the calibration process can generate individual equalization data for each
ambiance. Depending on the room and speaker characteristic, this method could
generate even better flatness, but it is very time consuming. Each ambiance will first be
level adjusted and then equalized. Before starting the calibration process, select this
calibration method in the configuration window (see chapter 3.10.4.1 Choice of
Calibration Method).
For each ambiance, a check is performed to establish whether a valid calibration data
set is available. If this is the case, equalization of this ambiance can be skipped by
selecting 'No':
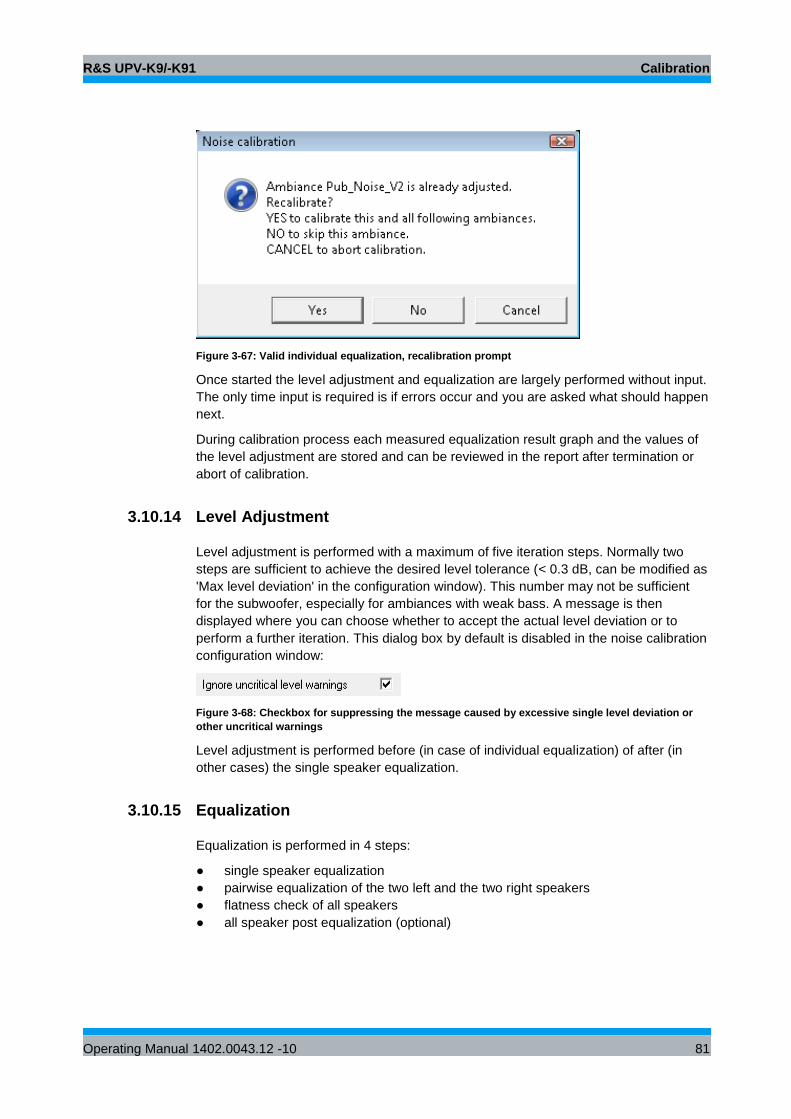
R&S UPV-K9/-K91 Calibration
Operating Manual 1402.0043.12 -10 81
Figure 3-67: Valid individual equalization, recalibration prompt
Once started the level adjustment and equalization are largely performed without input.
The only time input is required is if errors occur and you are asked what should happen
next.
During calibration process each measured equalization result graph and the values of
the level adjustment are stored and can be reviewed in the report after termination or
abort of calibration.
3.10.14 Level Adjustment
Level adjustment is performed with a maximum of five iteration steps. Normally two
steps are sufficient to achieve the desired level tolerance (< 0.3 dB, can be modified as
'Max level deviation' in the configuration window). This number may not be sufficient
for the subwoofer, especially for ambiances with weak bass. A message is then
displayed where you can choose whether to accept the actual level deviation or to
perform a further iteration. This dialog box by default is disabled in the noise calibration
configuration window:
Figure 3-68: Checkbox for suppressing the message caused by excessive single level deviation or
other uncritical warnings
Level adjustment is performed before (in case of individual equalization) of after (in
other cases) the single speaker equalization.
3.10.15 Equalization
Equalization is performed in 4 steps:
● single speaker equalization
● pairwise equalization of the two left and the two right speakers
● flatness check of all speakers
● all speaker post equalization (optional)
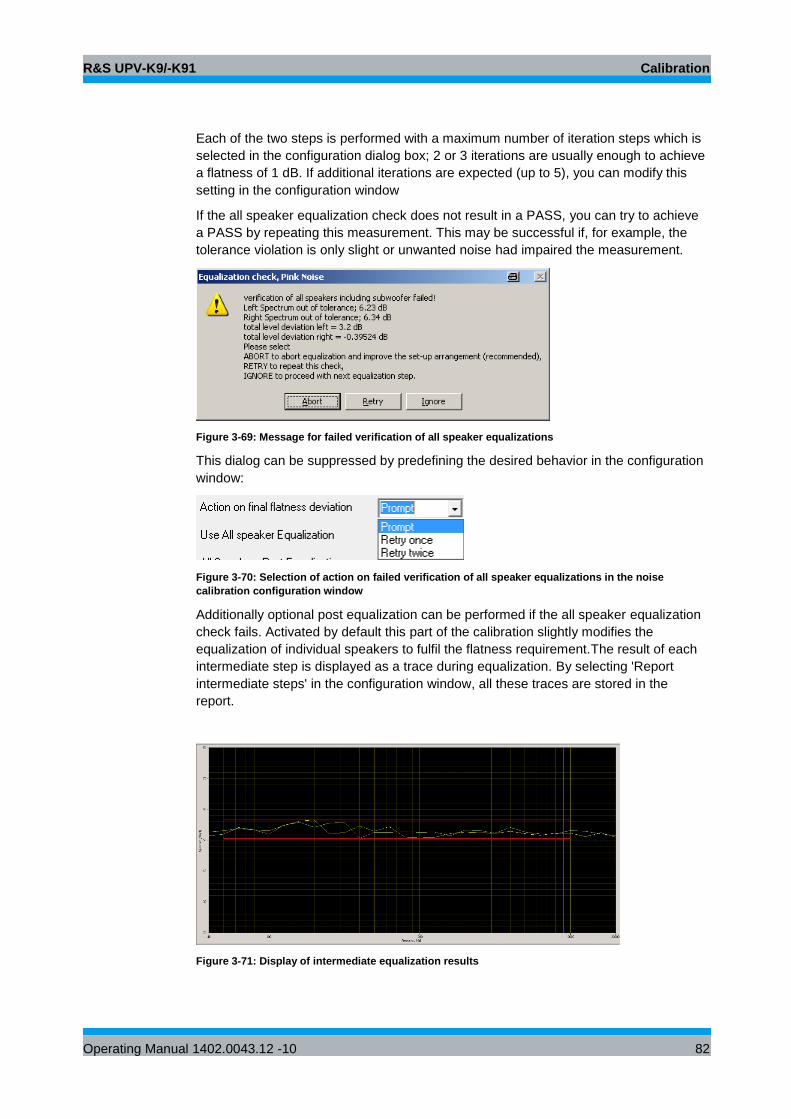
R&S UPV-K9/-K91 Calibration
Operating Manual 1402.0043.12 -10 82
Each of the two steps is performed with a maximum number of iteration steps which is
selected in the configuration dialog box; 2 or 3 iterations are usually enough to achieve
a flatness of 1 dB. If additional iterations are expected (up to 5), you can modify this
setting in the configuration window
If the all speaker equalization check does not result in a PASS, you can try to achieve
a PASS by repeating this measurement. This may be successful if, for example, the
tolerance violation is only slight or unwanted noise had impaired the measurement.
Figure 3-69: Message for failed verification of all speaker equalizations
This dialog can be suppressed by predefining the desired behavior in the configuration
window:
Figure 3-70: Selection of action on failed verification of all speaker equalizations in the noise
calibration configuration window
Additionally optional post equalization can be performed if the all speaker equalization
check fails. Activated by default this part of the calibration slightly modifies the
equalization of individual speakers to fulfil the flatness requirement.The result of each
intermediate step is displayed as a trace during equalization. By selecting 'Report
intermediate steps' in the configuration window, all these traces are stored in the
report.
Figure 3-71: Display of intermediate equalization results
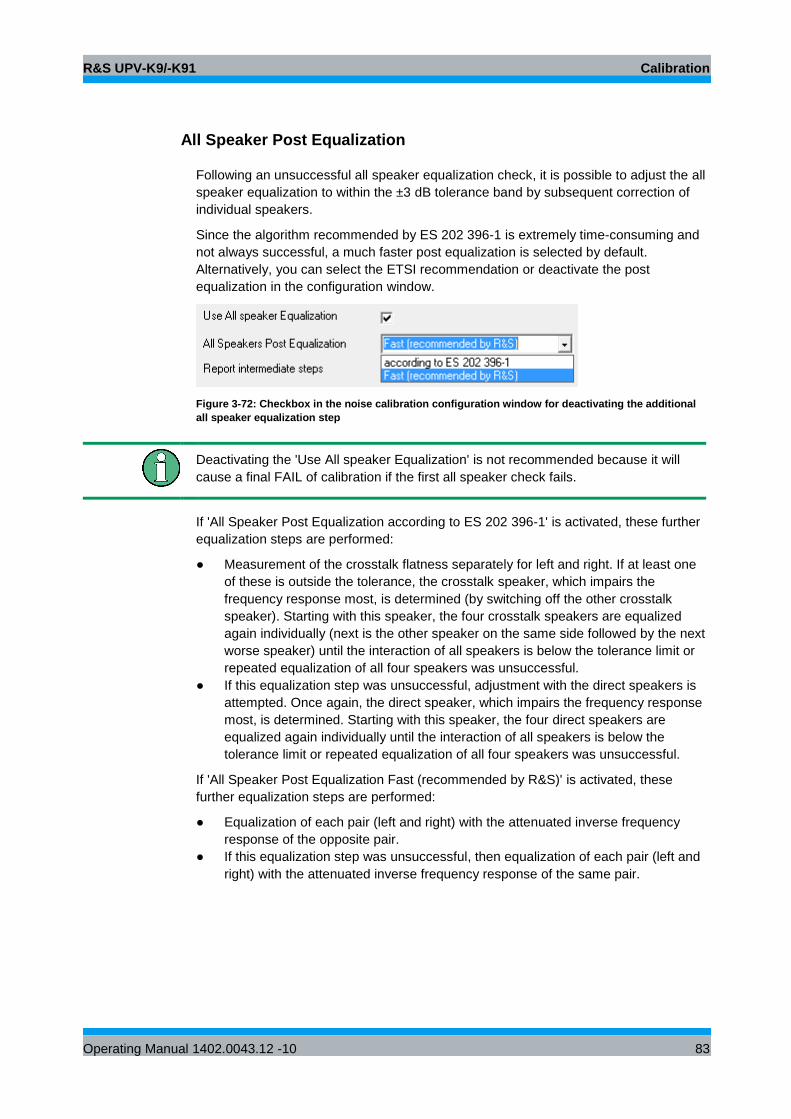
R&S UPV-K9/-K91 Calibration
Operating Manual 1402.0043.12 -10 83
All Speaker Post Equalization
Following an unsuccessful all speaker equalization check, it is possible to adjust the all
speaker equalization to within the ±3 dB tolerance band by subsequent correction of
individual speakers.
Since the algorithm recommended by ES 202 396-1 is extremely time-consuming and
not always successful, a much faster post equalization is selected by default.
Alternatively, you can select the ETSI recommendation or deactivate the post
equalization in the configuration window.
Figure 3-72: Checkbox in the noise calibration configuration window for deactivating the additional
all speaker equalization step
Deactivating the 'Use All speaker Equalization' is not recommended because it will
cause a final FAIL of calibration if the first all speaker check fails.
If 'All Speaker Post Equalization according to ES 202 396-1' is activated, these further
equalization steps are performed:
● Measurement of the crosstalk flatness separately for left and right. If at least one
of these is outside the tolerance, the crosstalk speaker, which impairs the
frequency response most, is determined (by switching off the other crosstalk
speaker). Starting with this speaker, the four crosstalk speakers are equalized
again individually (next is the other speaker on the same side followed by the next
worse speaker) until the interaction of all speakers is below the tolerance limit or
repeated equalization of all four speakers was unsuccessful.
● If this equalization step was unsuccessful, adjustment with the direct speakers is
attempted. Once again, the direct speaker, which impairs the frequency response
most, is determined. Starting with this speaker, the four direct speakers are
equalized again individually until the interaction of all speakers is below the
tolerance limit or repeated equalization of all four speakers was unsuccessful.
If 'All Speaker Post Equalization Fast (recommended by R&S)' is activated, these
further equalization steps are performed:
● Equalization of each pair (left and right) with the attenuated inverse frequency
response of the opposite pair.
● If this equalization step was unsuccessful, then equalization of each pair (left and
right) with the attenuated inverse frequency response of the same pair.
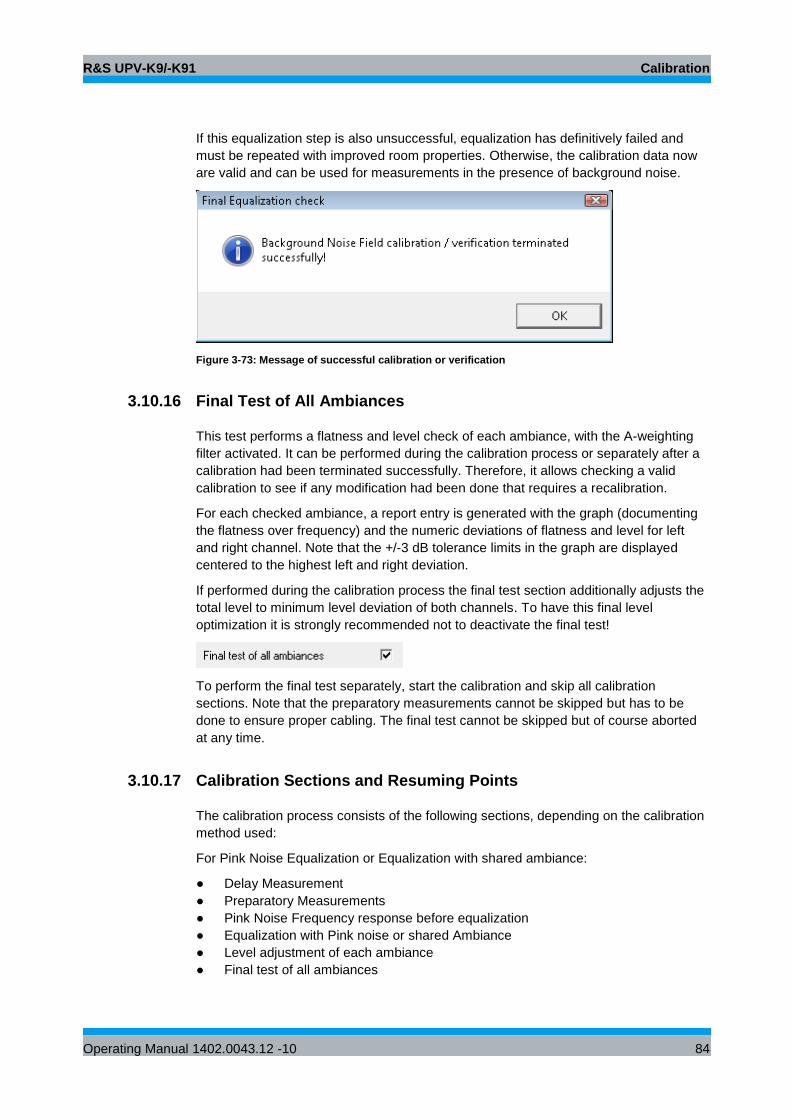
R&S UPV-K9/-K91 Calibration
Operating Manual 1402.0043.12 -10 84
If this equalization step is also unsuccessful, equalization has definitively failed and
must be repeated with improved room properties. Otherwise, the calibration data now
are valid and can be used for measurements in the presence of background noise.
Figure 3-73: Message of successful calibration or verification
3.10.16 Final Test of All Ambiances
This test performs a flatness and level check of each ambiance, with the A-weighting
filter activated. It can be performed during the calibration process or separately after a
calibration had been terminated successfully. Therefore, it allows checking a valid
calibration to see if any modification had been done that requires a recalibration.
For each checked ambiance, a report entry is generated with the graph (documenting
the flatness over frequency) and the numeric deviations of flatness and level for left
and right channel. Note that the +/-3 dB tolerance limits in the graph are displayed
centered to the highest left and right deviation.
If performed during the calibration process the final test section additionally adjusts the
total level to minimum level deviation of both channels. To have this final level
optimization it is strongly recommended not to deactivate the final test!
To perform the final test separately, start the calibration and skip all calibration
sections. Note that the preparatory measurements cannot be skipped but has to be
done to ensure proper cabling. The final test cannot be skipped but of course aborted
at any time.
3.10.17 Calibration Sections and Resuming Points
The calibration process consists of the following sections, depending on the calibration
method used:
For Pink Noise Equalization or Equalization with shared ambiance:
● Delay Measurement
● Preparatory Measurements
● Pink Noise Frequency response before equalization
● Equalization with Pink noise or shared Ambiance
● Level adjustment of each ambiance
● Final test of all ambiances
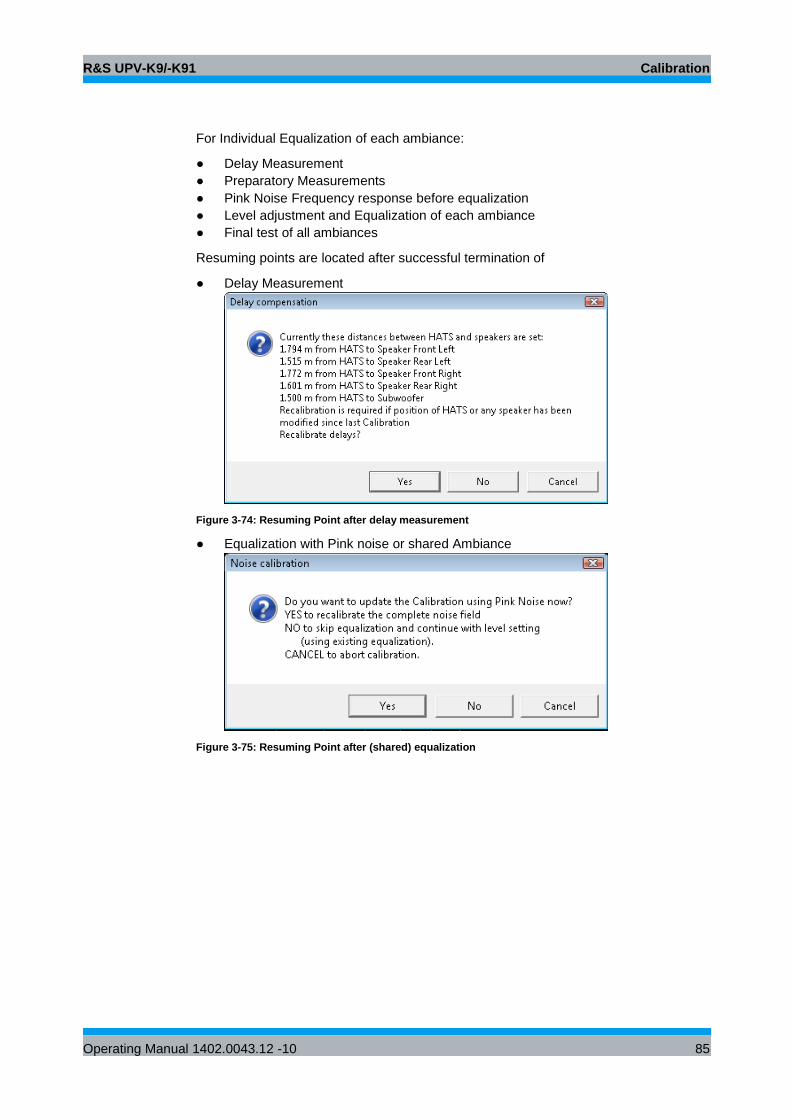
R&S UPV-K9/-K91 Calibration
Operating Manual 1402.0043.12 -10 85
For Individual Equalization of each ambiance:
● Delay Measurement
● Preparatory Measurements
● Pink Noise Frequency response before equalization
● Level adjustment and Equalization of each ambiance
● Final test of all ambiances
Resuming points are located after successful termination of
● Delay Measurement
Figure 3-74: Resuming Point after delay measurement
● Equalization with Pink noise or shared Ambiance
Figure 3-75: Resuming Point after (shared) equalization
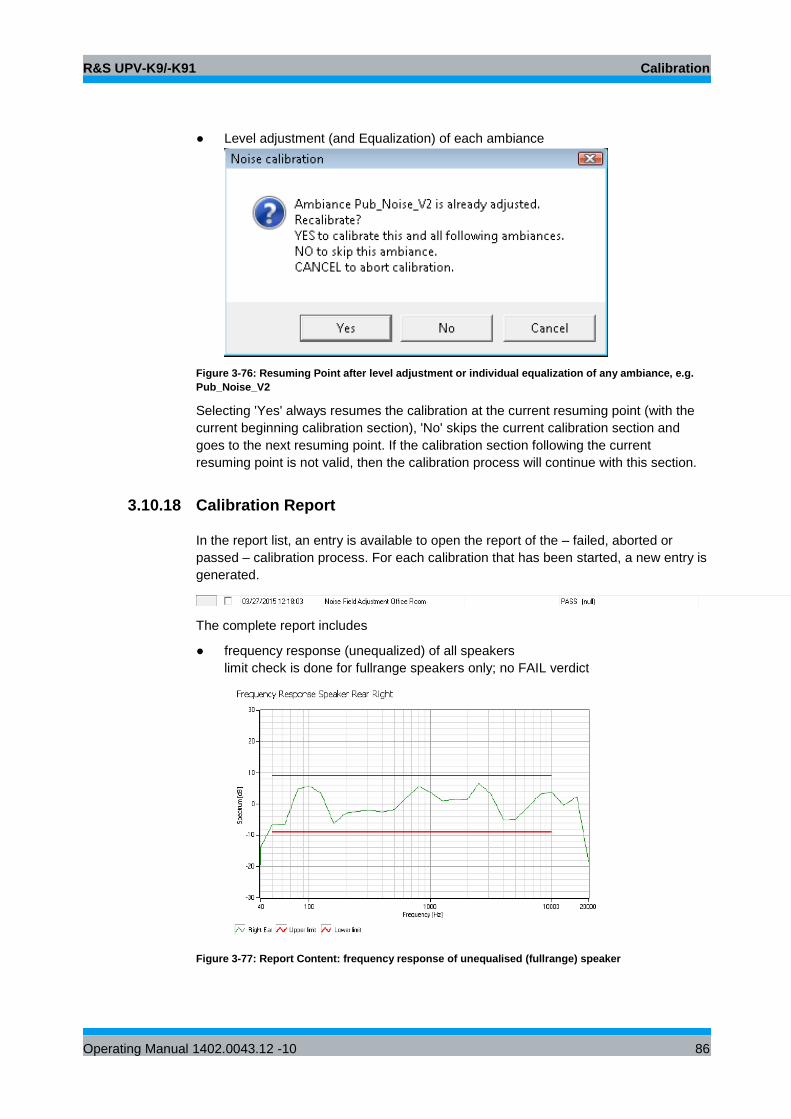
R&S UPV-K9/-K91 Calibration
Operating Manual 1402.0043.12 -10 86
● Level adjustment (and Equalization) of each ambiance
Figure 3-76: Resuming Point after level adjustment or individual equalization of any ambiance, e.g.
Pub_Noise_V2
Selecting 'Yes' always resumes the calibration at the current resuming point (with the
current beginning calibration section), 'No' skips the current calibration section and
goes to the next resuming point. If the calibration section following the current
resuming point is not valid, then the calibration process will continue with this section.
3.10.18 Calibration Report
In the report list, an entry is available to open the report of the – failed, aborted or
passed – calibration process. For each calibration that has been started, a new entry is
generated.
The complete report includes
● frequency response (unequalized) of all speakers
limit check is done for fullrange speakers only; no FAIL verdict
Figure 3-77: Report Content: frequency response of unequalised (fullrange) speaker
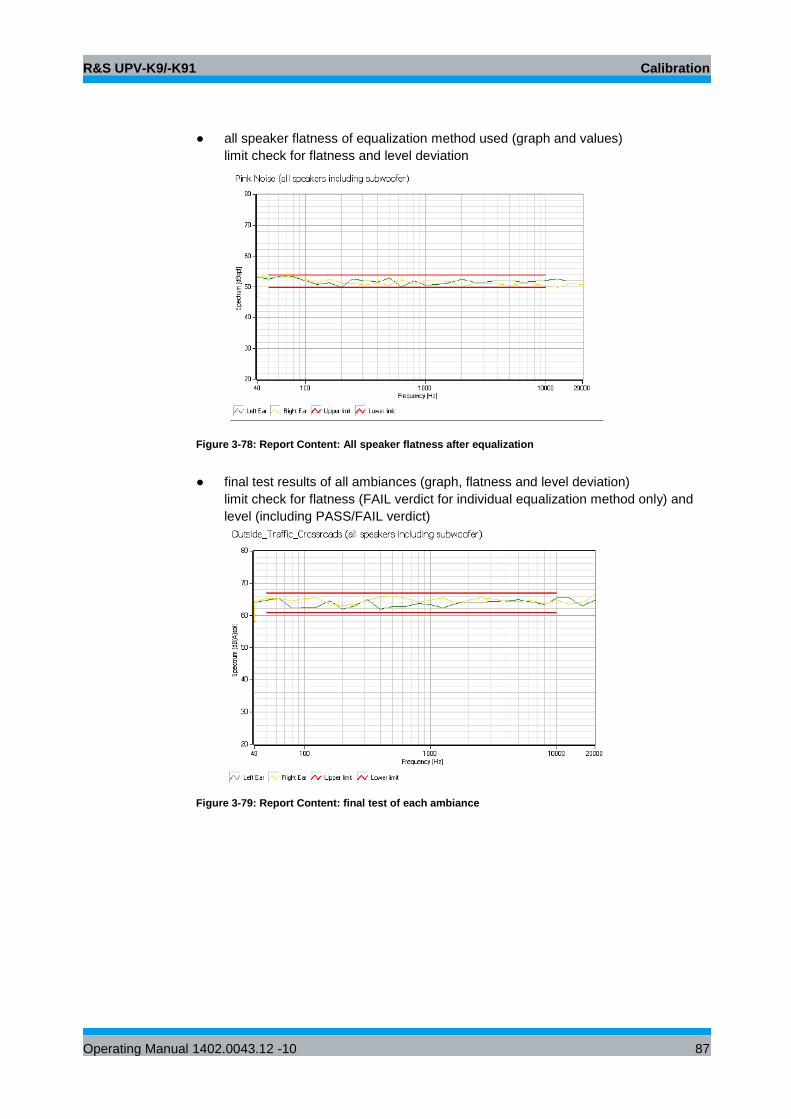
R&S UPV-K9/-K91 Calibration
Operating Manual 1402.0043.12 -10 87
● all speaker flatness of equalization method used (graph and values)
limit check for flatness and level deviation
Figure 3-78: Report Content: All speaker flatness after equalization
● final test results of all ambiances (graph, flatness and level deviation)
limit check for flatness (FAIL verdict for individual equalization method only) and
level (including PASS/FAIL verdict)
Figure 3-79: Report Content: final test of each ambiance
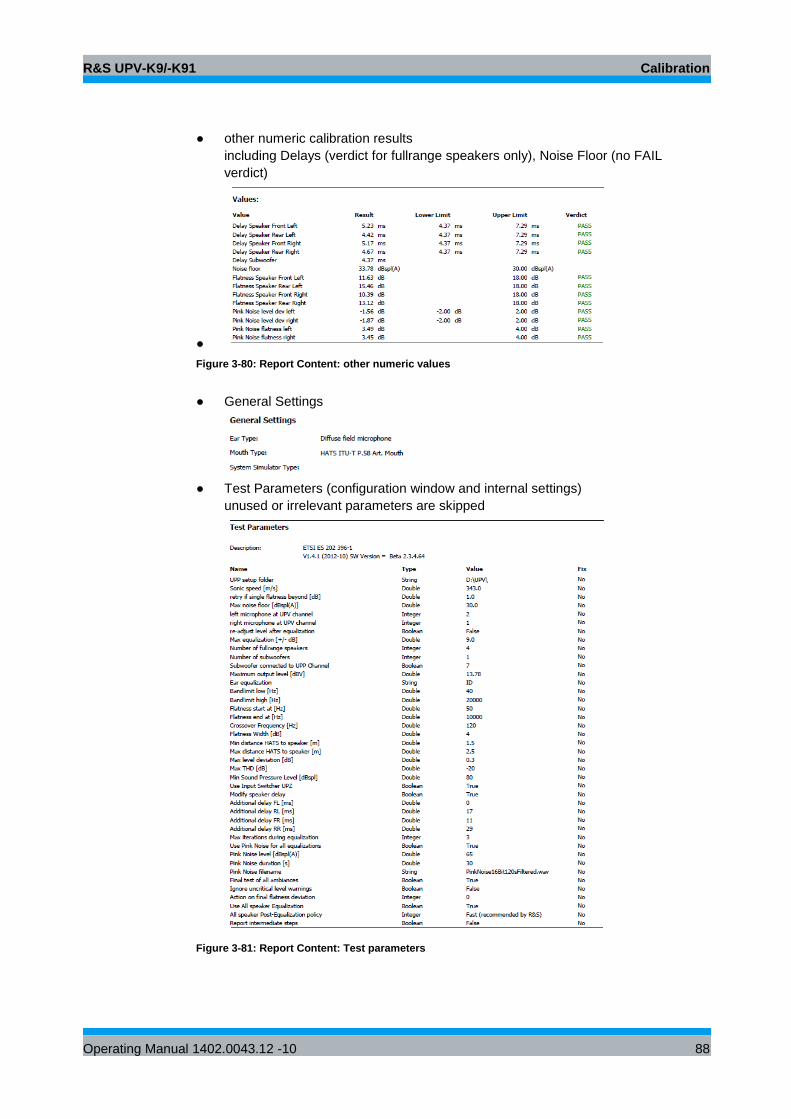
R&S UPV-K9/-K91 Calibration
Operating Manual 1402.0043.12 -10 88
● other numeric calibration results
including Delays (verdict for fullrange speakers only), Noise Floor (no FAIL
verdict)
●
Figure 3-80: Report Content: other numeric values
● General Settings
● Test Parameters (configuration window and internal settings)
unused or irrelevant parameters are skipped
Figure 3-81: Report Content: Test parameters
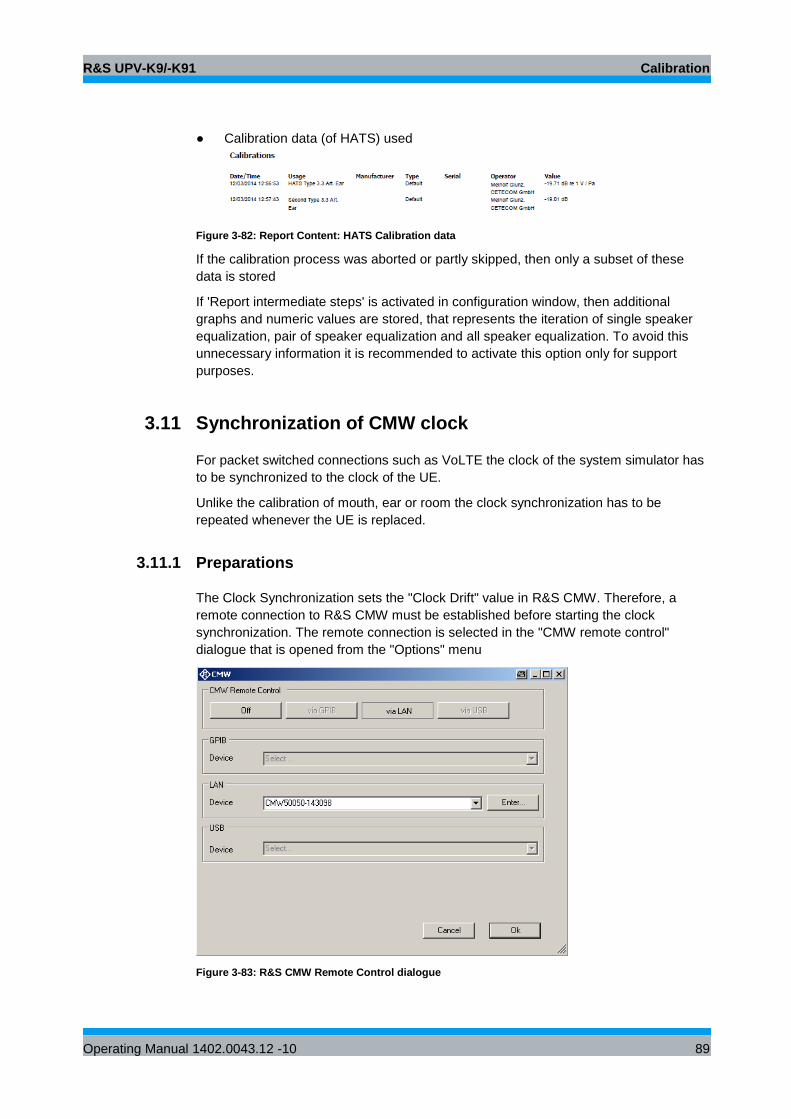
R&S UPV-K9/-K91 Calibration
Operating Manual 1402.0043.12 -10 89
● Calibration data (of HATS) used
Figure 3-82: Report Content: HATS Calibration data
If the calibration process was aborted or partly skipped, then only a subset of these
data is stored
If 'Report intermediate steps' is activated in configuration window, then additional
graphs and numeric values are stored, that represents the iteration of single speaker
equalization, pair of speaker equalization and all speaker equalization. To avoid this
unnecessary information it is recommended to activate this option only for support
purposes.
3.11 Synchronization of CMW clock
For packet switched connections such as VoLTE the clock of the system simulator has
to be synchronized to the clock of the UE.
Unlike the calibration of mouth, ear or room the clock synchronization has to be
repeated whenever the UE is replaced.
3.11.1 Preparations
The Clock Synchronization sets the "Clock Drift" value in R&S CMW. Therefore, a
remote connection to R&S CMW must be established before starting the clock
synchronization. The remote connection is selected in the "CMW remote control"
dialogue that is opened from the "Options" menu
Figure 3-83: R&S CMW Remote Control dialogue
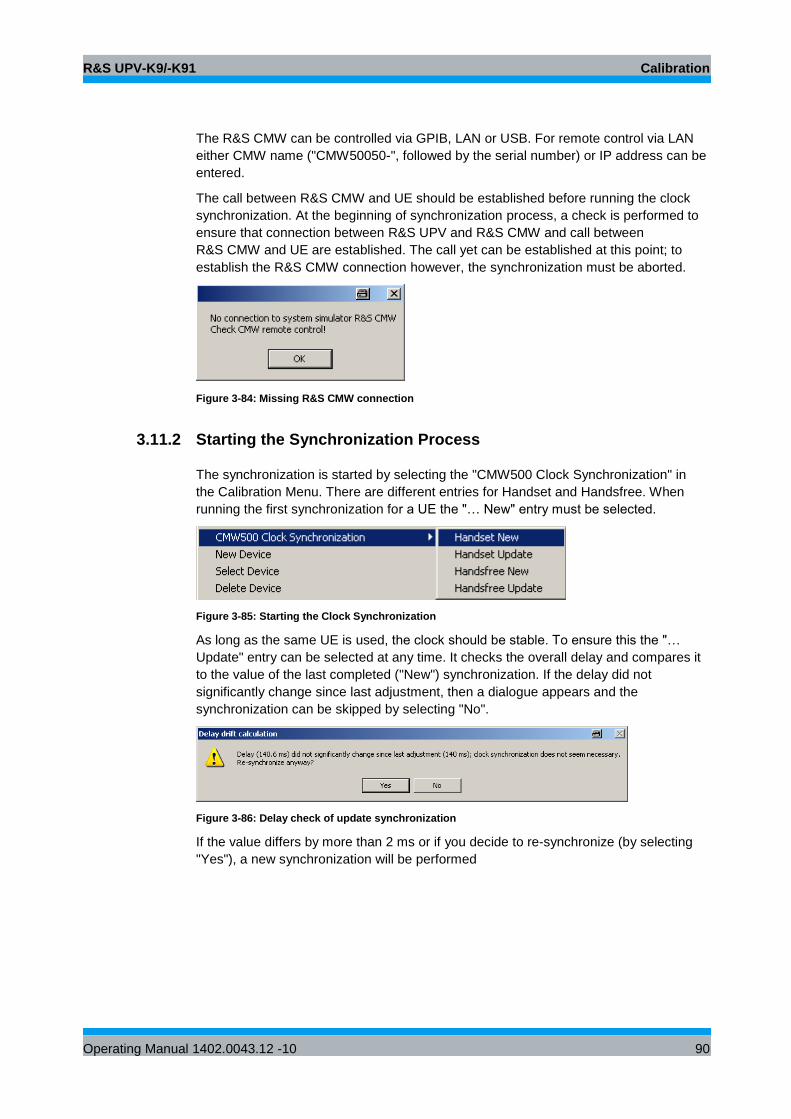
R&S UPV-K9/-K91 Calibration
Operating Manual 1402.0043.12 -10 90
The R&S CMW can be controlled via GPIB, LAN or USB. For remote control via LAN
either CMW name ("CMW50050-", followed by the serial number) or IP address can be
entered.
The call between R&S CMW and UE should be established before running the clock
synchronization. At the beginning of synchronization process, a check is performed to
ensure that connection between R&S UPV and R&S CMW and call between
R&S CMW and UE are established. The call yet can be established at this point; to
establish the R&S CMW connection however, the synchronization must be aborted.
Figure 3-84: Missing R&S CMW connection
3.11.2 Starting the Synchronization Process
The synchronization is started by selecting the "CMW500 Clock Synchronization" in
the Calibration Menu. There are different entries for Handset and Handsfree. When
running the first synchronization for a UE the "… New" entry must be selected.
Figure 3-85: Starting the Clock Synchronization
As long as the same UE is used, the clock should be stable. To ensure this the "…
Update" entry can be selected at any time. It checks the overall delay and compares it
to the value of the last completed ("New") synchronization. If the delay did not
significantly change since last adjustment, then a dialogue appears and the
synchronization can be skipped by selecting "No".
Figure 3-86: Delay check of update synchronization
If the value differs by more than 2 ms or if you decide to re-synchronize (by selecting
"Yes"), a new synchronization will be performed
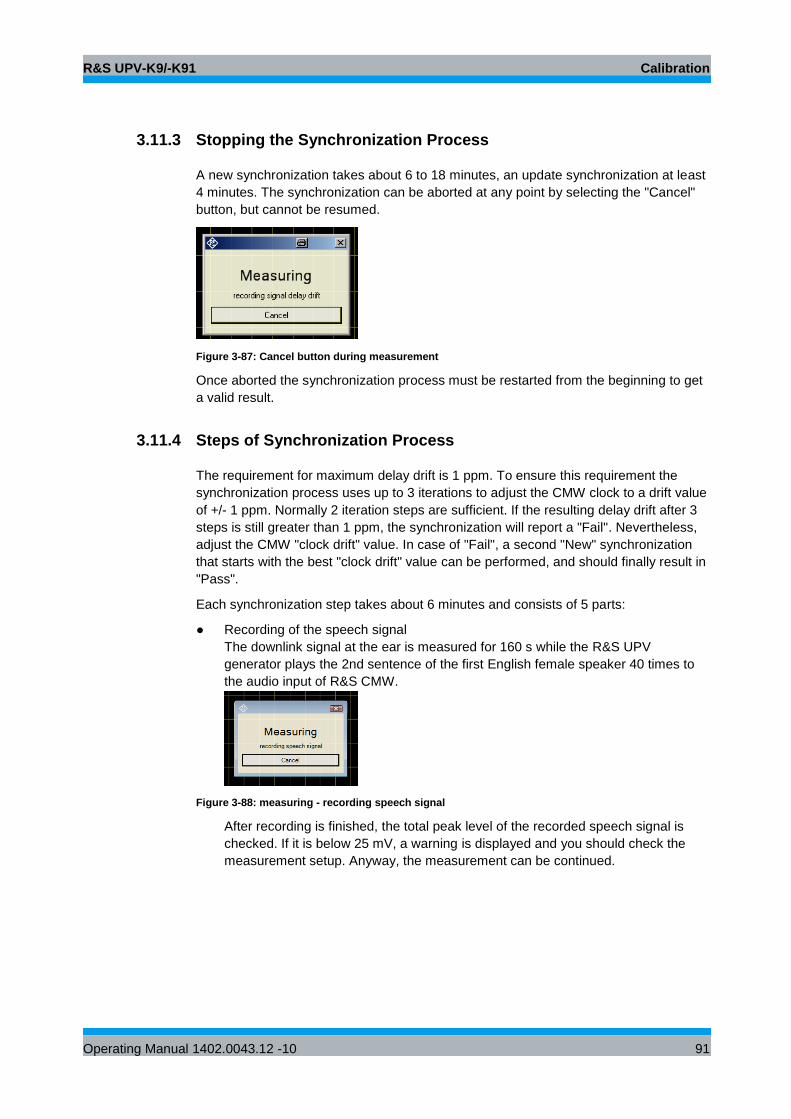
R&S UPV-K9/-K91 Calibration
Operating Manual 1402.0043.12 -10 91
3.11.3 Stopping the Synchronization Process
A new synchronization takes about 6 to 18 minutes, an update synchronization at least
4 minutes. The synchronization can be aborted at any point by selecting the "Cancel"
button, but cannot be resumed.
Figure 3-87: Cancel button during measurement
Once aborted the synchronization process must be restarted from the beginning to get
a valid result.
3.11.4 Steps of Synchronization Process
The requirement for maximum delay drift is 1 ppm. To ensure this requirement the
synchronization process uses up to 3 iterations to adjust the CMW clock to a drift value
of +/- 1 ppm. Normally 2 iteration steps are sufficient. If the resulting delay drift after 3
steps is still greater than 1 ppm, the synchronization will report a "Fail". Nevertheless,
adjust the CMW "clock drift" value. In case of "Fail", a second "New" synchronization
that starts with the best "clock drift" value can be performed, and should finally result in
"Pass".
Each synchronization step takes about 6 minutes and consists of 5 parts:
● Recording of the speech signal
The downlink signal at the ear is measured for 160 s while the R&S UPV
generator plays the 2nd sentence of the first English female speaker 40 times to
the audio input of R&S CMW.
Figure 3-88: measuring - recording speech signal
After recording is finished, the total peak level of the recorded speech signal is
checked. If it is below 25 mV, a warning is displayed and you should check the
measurement setup. Anyway, the measurement can be continued.
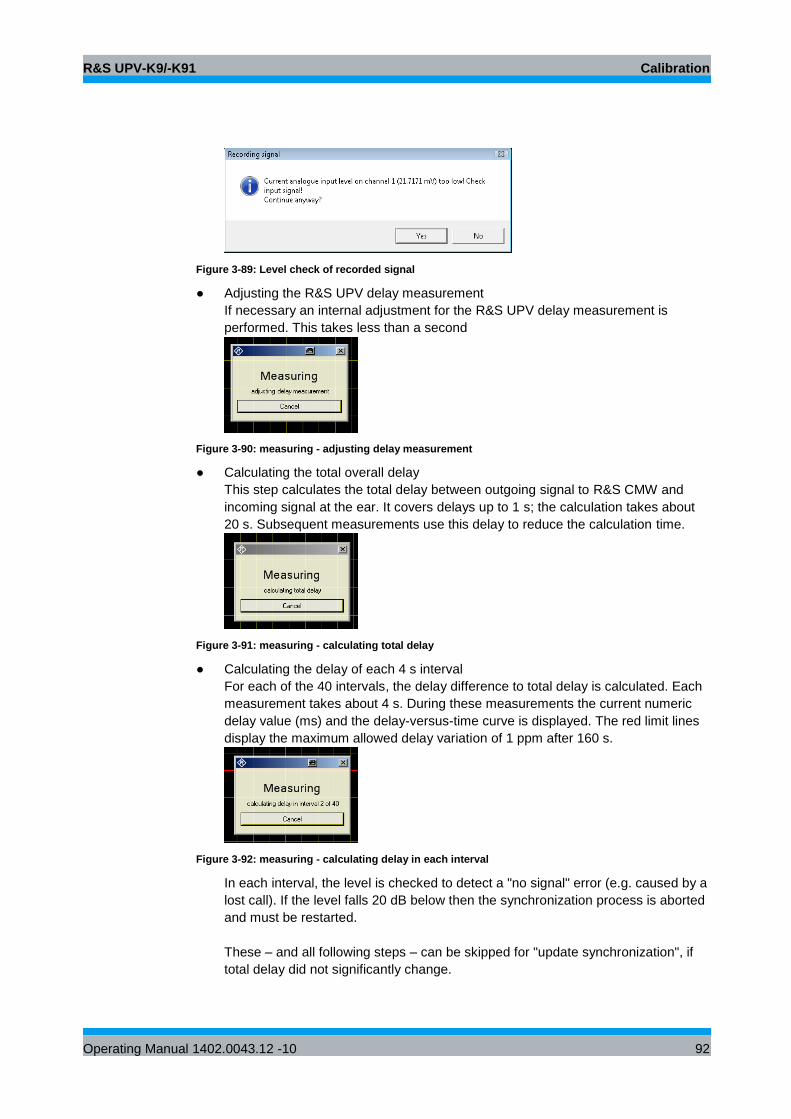
R&S UPV-K9/-K91 Calibration
Operating Manual 1402.0043.12 -10 92
Figure 3-89: Level check of recorded signal
● Adjusting the R&S UPV delay measurement
If necessary an internal adjustment for the R&S UPV delay measurement is
performed. This takes less than a second
Figure 3-90: measuring - adjusting delay measurement
● Calculating the total overall delay
This step calculates the total delay between outgoing signal to R&S CMW and
incoming signal at the ear. It covers delays up to 1 s; the calculation takes about
20 s. Subsequent measurements use this delay to reduce the calculation time.
Figure 3-91: measuring - calculating total delay
● Calculating the delay of each 4 s interval
For each of the 40 intervals, the delay difference to total delay is calculated. Each
measurement takes about 4 s. During these measurements the current numeric
delay value (ms) and the delay-versus-time curve is displayed. The red limit lines
display the maximum allowed delay variation of 1 ppm after 160 s.
Figure 3-92: measuring - calculating delay in each interval
In each interval, the level is checked to detect a "no signal" error (e.g. caused by a
lost call). If the level falls 20 dB below then the synchronization process is aborted
and must be restarted.
These – and all following steps – can be skipped for "update synchronization", if
total delay did not significantly change.
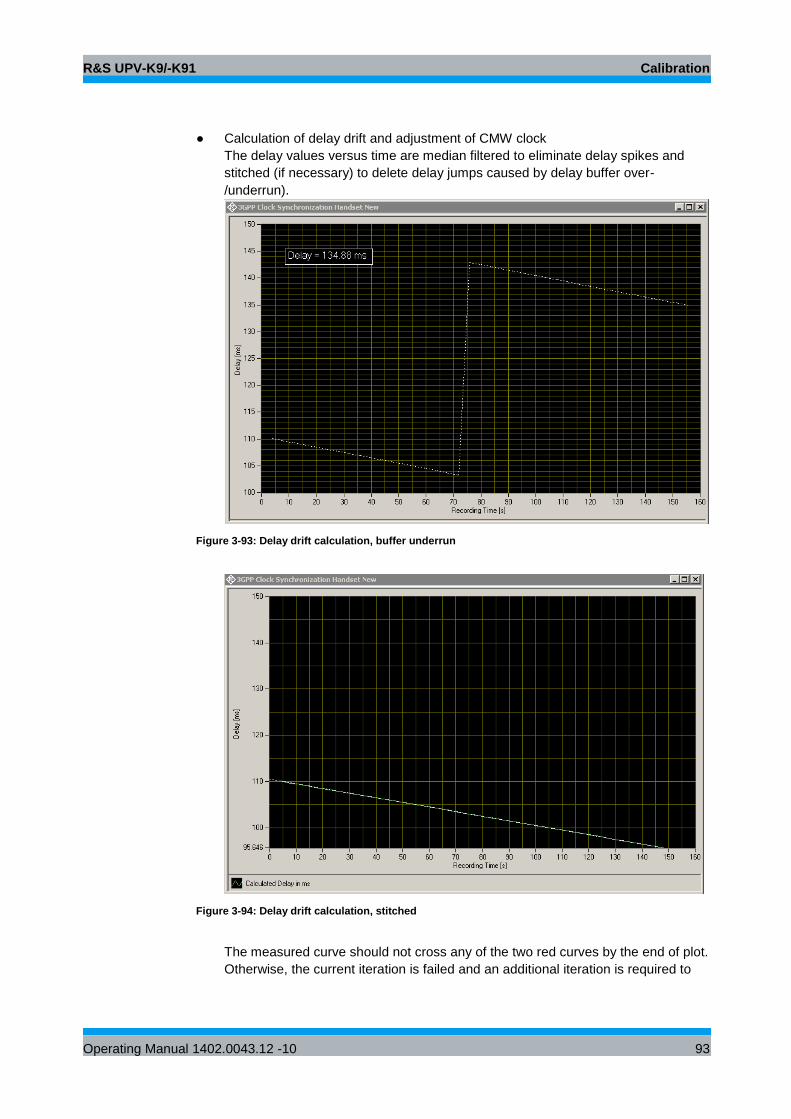
R&S UPV-K9/-K91 Calibration
Operating Manual 1402.0043.12 -10 93
● Calculation of delay drift and adjustment of CMW clock
The delay values versus time are median filtered to eliminate delay spikes and
stitched (if necessary) to delete delay jumps caused by delay buffer over-
/underrun).
Figure 3-93: Delay drift calculation, buffer underrun
Figure 3-94: Delay drift calculation, stitched
The measured curve should not cross any of the two red curves by the end of plot.
Otherwise, the current iteration is failed and an additional iteration is required to
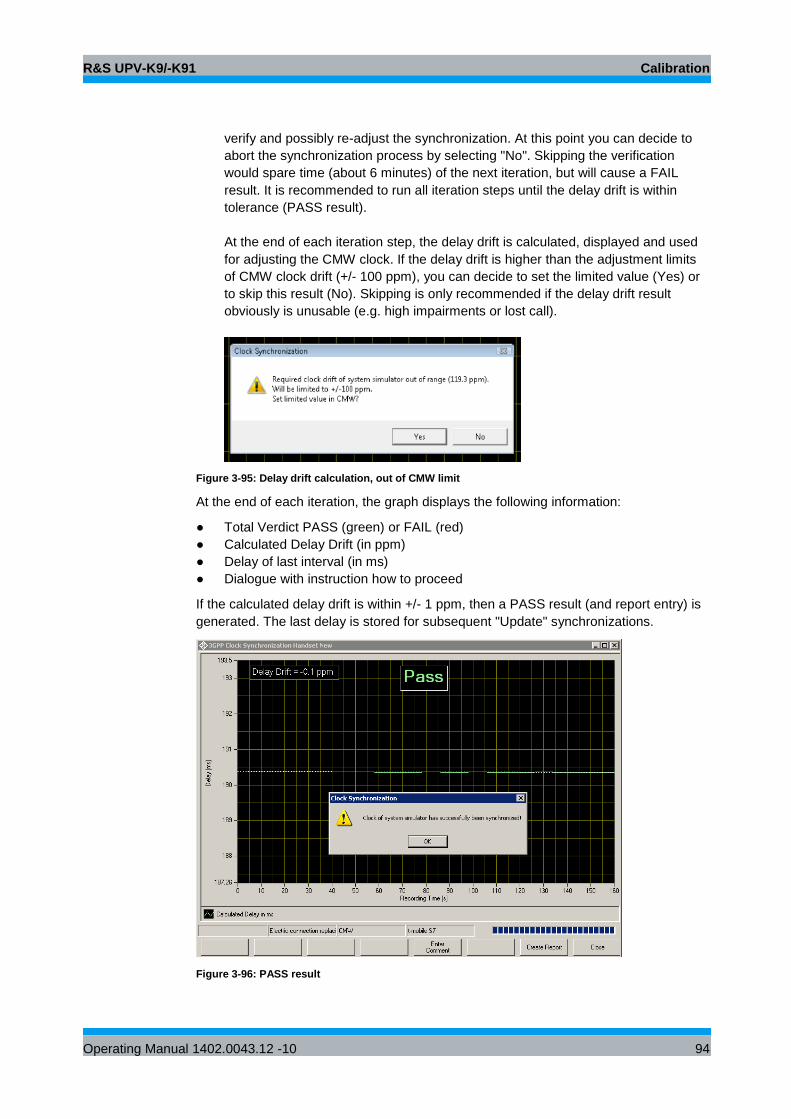
R&S UPV-K9/-K91 Calibration
Operating Manual 1402.0043.12 -10 94
verify and possibly re-adjust the synchronization. At this point you can decide to
abort the synchronization process by selecting "No". Skipping the verification
would spare time (about 6 minutes) of the next iteration, but will cause a FAIL
result. It is recommended to run all iteration steps until the delay drift is within
tolerance (PASS result).
At the end of each iteration step, the delay drift is calculated, displayed and used
for adjusting the CMW clock. If the delay drift is higher than the adjustment limits
of CMW clock drift (+/- 100 ppm), you can decide to set the limited value (Yes) or
to skip this result (No). Skipping is only recommended if the delay drift result
obviously is unusable (e.g. high impairments or lost call).
Figure 3-95: Delay drift calculation, out of CMW limit
At the end of each iteration, the graph displays the following information:
● Total Verdict PASS (green) or FAIL (red)
● Calculated Delay Drift (in ppm)
● Delay of last interval (in ms)
● Dialogue with instruction how to proceed
If the calculated delay drift is within +/- 1 ppm, then a PASS result (and report entry) is
generated. The last delay is stored for subsequent "Update" synchronizations.
Figure 3-96: PASS result
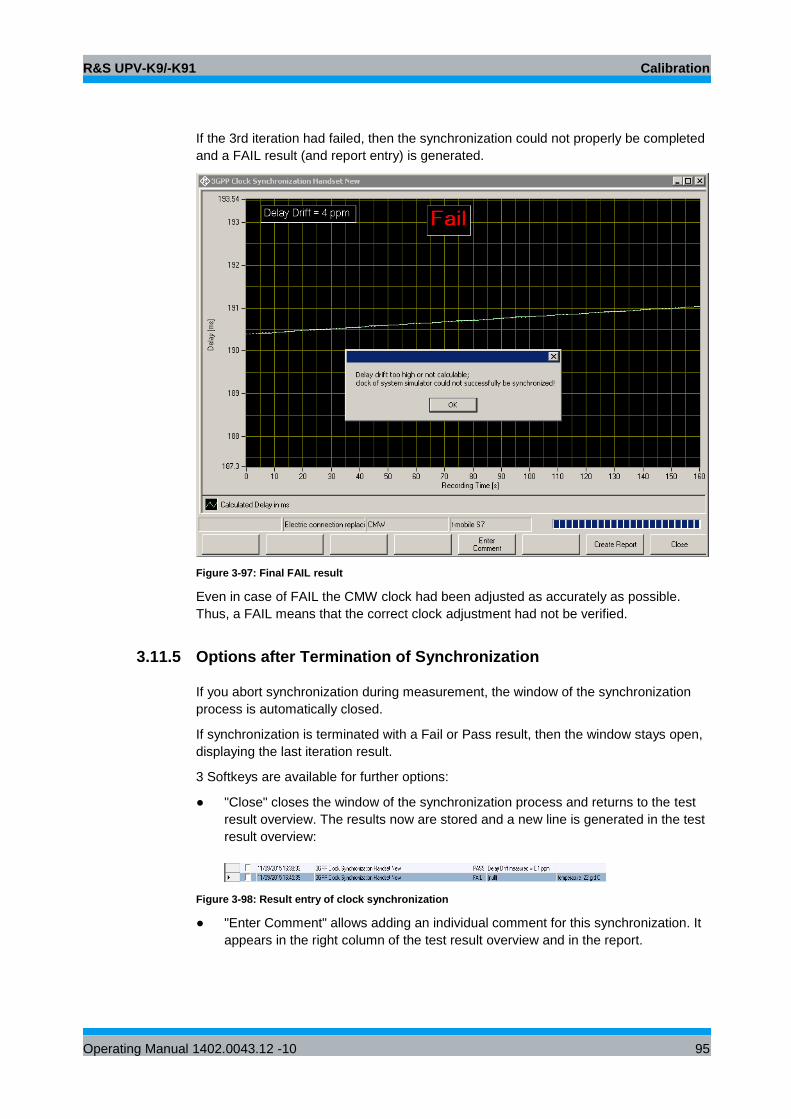
R&S UPV-K9/-K91 Calibration
Operating Manual 1402.0043.12 -10 95
If the 3rd iteration had failed, then the synchronization could not properly be completed
and a FAIL result (and report entry) is generated.
Figure 3-97: Final FAIL result
Even in case of FAIL the CMW clock had been adjusted as accurately as possible.
Thus, a FAIL means that the correct clock adjustment had not be verified.
3.11.5 Options after Termination of Synchronization
If you abort synchronization during measurement, the window of the synchronization
process is automatically closed.
If synchronization is terminated with a Fail or Pass result, then the window stays open,
displaying the last iteration result.
3 Softkeys are available for further options:
● "Close" closes the window of the synchronization process and returns to the test
result overview. The results now are stored and a new line is generated in the test
result overview:
Figure 3-98: Result entry of clock synchronization
● "Enter Comment" allows adding an individual comment for this synchronization. It
appears in the right column of the test result overview and in the report.
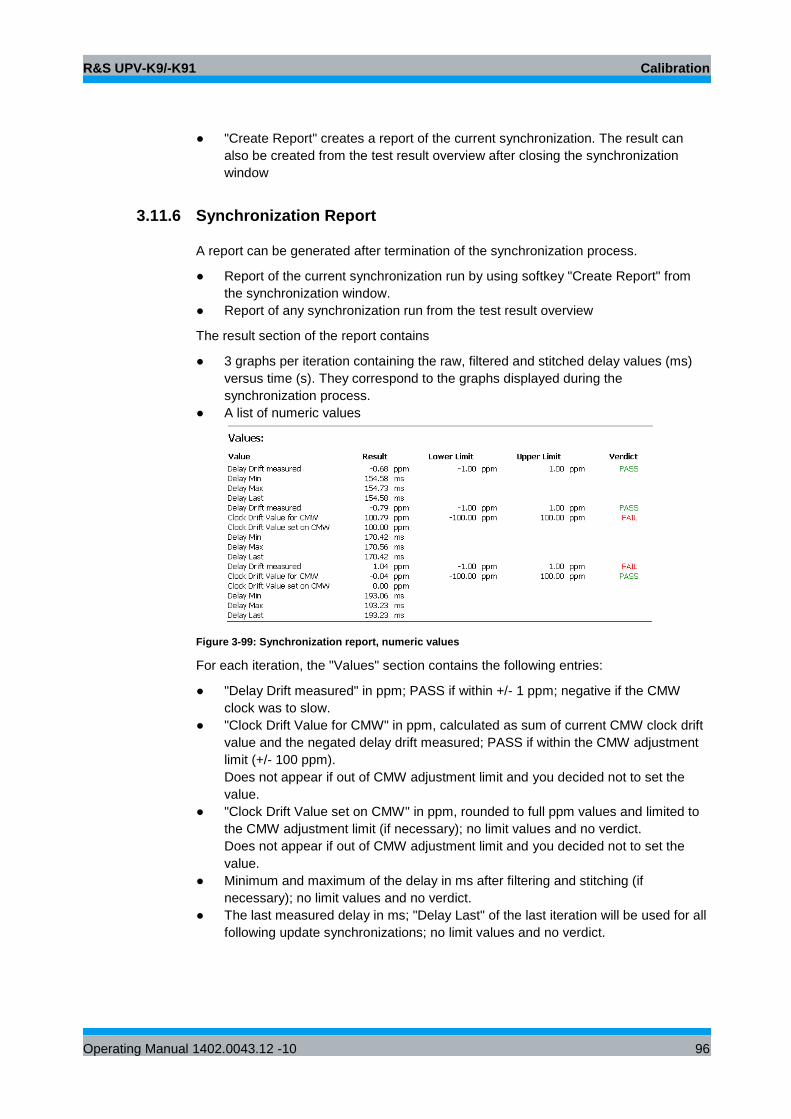
R&S UPV-K9/-K91 Calibration
Operating Manual 1402.0043.12 -10 96
● "Create Report" creates a report of the current synchronization. The result can
also be created from the test result overview after closing the synchronization
window
3.11.6 Synchronization Report
A report can be generated after termination of the synchronization process.
● Report of the current synchronization run by using softkey "Create Report" from
the synchronization window.
● Report of any synchronization run from the test result overview
The result section of the report contains
● 3 graphs per iteration containing the raw, filtered and stitched delay values (ms)
versus time (s). They correspond to the graphs displayed during the
synchronization process.
● A list of numeric values
Figure 3-99: Synchronization report, numeric values
For each iteration, the "Values" section contains the following entries:
● "Delay Drift measured" in ppm; PASS if within +/- 1 ppm; negative if the CMW
clock was to slow.
● "Clock Drift Value for CMW" in ppm, calculated as sum of current CMW clock drift
value and the negated delay drift measured; PASS if within the CMW adjustment
limit (+/- 100 ppm).
Does not appear if out of CMW adjustment limit and you decided not to set the
value.
● "Clock Drift Value set on CMW" in ppm, rounded to full ppm values and limited to
the CMW adjustment limit (if necessary); no limit values and no verdict.
Does not appear if out of CMW adjustment limit and you decided not to set the
value.
● Minimum and maximum of the delay in ms after filtering and stitching (if
necessary); no limit values and no verdict.
● The last measured delay in ms; "Delay Last" of the last iteration will be used for all
following update synchronizations; no limit values and no verdict.
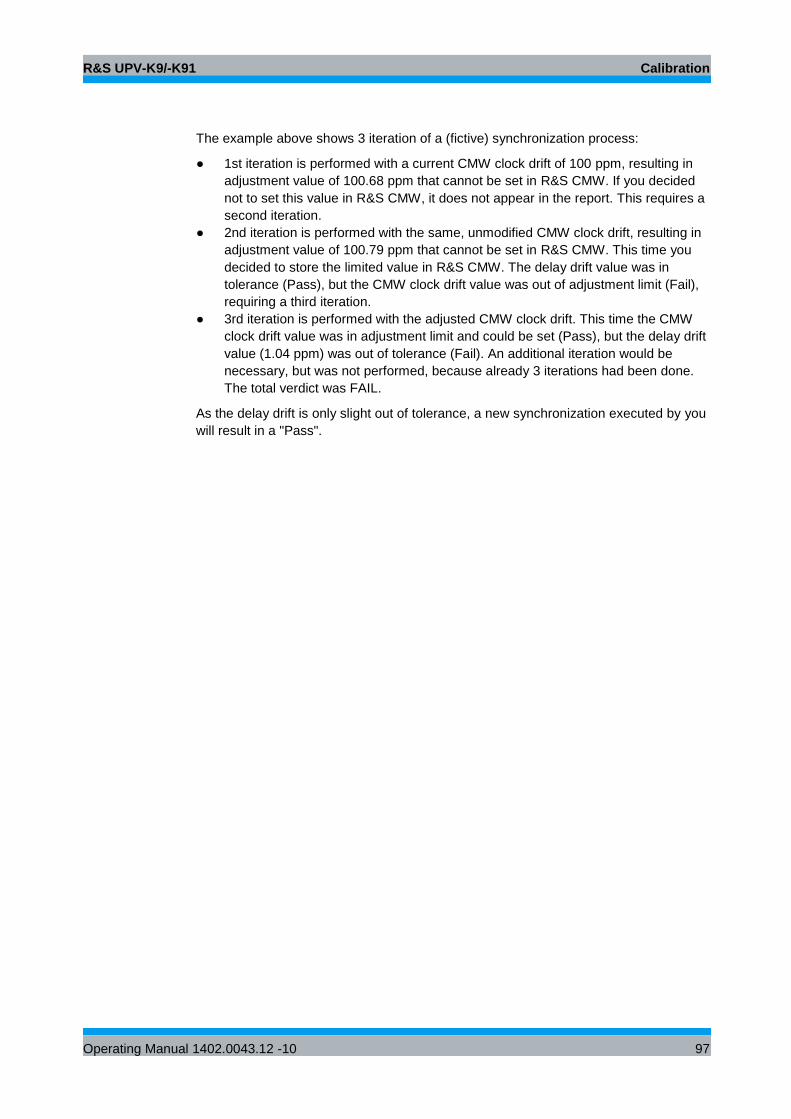
R&S UPV-K9/-K91 Calibration
Operating Manual 1402.0043.12 -10 97
The example above shows 3 iteration of a (fictive) synchronization process:
● 1st iteration is performed with a current CMW clock drift of 100 ppm, resulting in
adjustment value of 100.68 ppm that cannot be set in R&S CMW. If you decided
not to set this value in R&S CMW, it does not appear in the report. This requires a
second iteration.
● 2nd iteration is performed with the same, unmodified CMW clock drift, resulting in
adjustment value of 100.79 ppm that cannot be set in R&S CMW. This time you
decided to store the limited value in R&S CMW. The delay drift value was in
tolerance (Pass), but the CMW clock drift value was out of adjustment limit (Fail),
requiring a third iteration.
● 3rd iteration is performed with the adjusted CMW clock drift. This time the CMW
clock drift value was in adjustment limit and could be set (Pass), but the delay drift
value (1.04 ppm) was out of tolerance (Fail). An additional iteration would be
necessary, but was not performed, because already 3 iterations had been done.
The total verdict was FAIL.
As the delay drift is only slight out of tolerance, a new synchronization executed by you
will result in a "Pass".
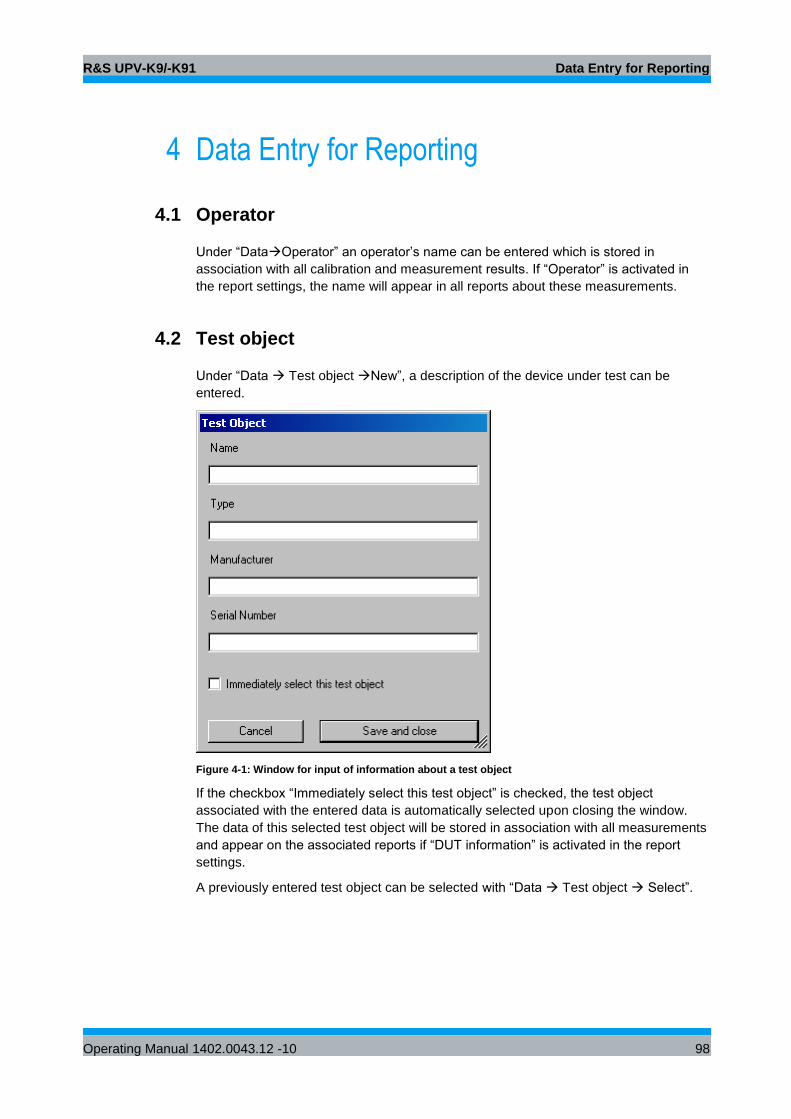
R&S UPV-K9/-K91 Data Entry for Reporting
Operating Manual 1402.0043.12 -10 98
4 Data Entry for Reporting
4.1 Operator
Under “DataOperator” an operator’s name can be entered which is stored in
association with all calibration and measurement results. If “Operator” is activated in
the report settings, the name will appear in all reports about these measurements.
4.2 Test object
Under “Data Test object New”, a description of the device under test can be
entered.
Figure 4-1: Window for input of information about a test object
If the checkbox “Immediately select this test object” is checked, the test object
associated with the entered data is automatically selected upon closing the window.
The data of this selected test object will be stored in association with all measurements
and appear on the associated reports if “DUT information” is activated in the report
settings.
A previously entered test object can be selected with “Data Test object Select”.
R&S UPV-K9/-K91 Measurements
Operating Manual 1402.0043.12 -10 99
5 Measurements
5.1 General
Special problems caused by the coding and decoding algorithms of mobile phones are
encountered when measuring acoustic characteristics. Voice codecs are used to attain
the lowest possible data rate. Mobile phone voice codecs are optimized for transmitting
human speech with low data rate. Not the actual voice signals but only the filter and
fundamental parameters required for signal reconstruction are transmitted.
Purely sinusoidal tones normally used for audio measurements cannot be transmitted
with such a system. Therefore, the coder and decoder had initially been excluded from
the measurement, which required a specially prepared test mobile phone with a
specific test interface.
In modern mobile phones, this interface is not available anymore. Measurements are
generally performed via the air interface with the speech coder and decoder included.
As mentioned above, measurements using sinusoidal tones cannot be performed
because the static sinusoidal input signal becomes a more or less stochastic output
signal as a result of coding, particularly in the medium and high audio frequency
ranges.
Signals similar to voice therefore have to be used for the measurement, i.e. either
artificial voice according to ITU-T P.50 or a multitone signal according to ITU-T P.501
is possible. At the same time, modulation of the signal in time must largely correspond
to voice, since many modern mobile phones use algorithms for interference
suppression, which use the modulation to distinguish the useful from the interfering
signal.
The test routines in the R&S UPV-K91 use an amplitude-modulated multitone signal
according to ITU-T P.501 as described in 3GPP TS 26.132 or alternatively artificial
voice according to ITU-T P.50 (update key UPV-K9101 or UPV-K9102 required).
5.2 Starting Measurements
Measurements can be started from the “Measurement” menu. This menu contains
either all available measurements, or the measurements belonging to the selected
standard if the checkbox “Allow only selected measurements” in the “Options Select
standard” window is checked.
The menu “Standards” allows you to start any measurement, whereby the
measurements are structured into submenus according to the standards to which they
belong. This allows a quick and easy access to all available measurements.
If “Sort” on top of the menu is checked, the standards are sorted according to the
devices Handset and headset, binaural headset, handheld handsfree and desktop and
vehicle-mounted handsfree plus Utilities and a sub-menu “More” which contains all
available testcases not assigned to any of the standards.
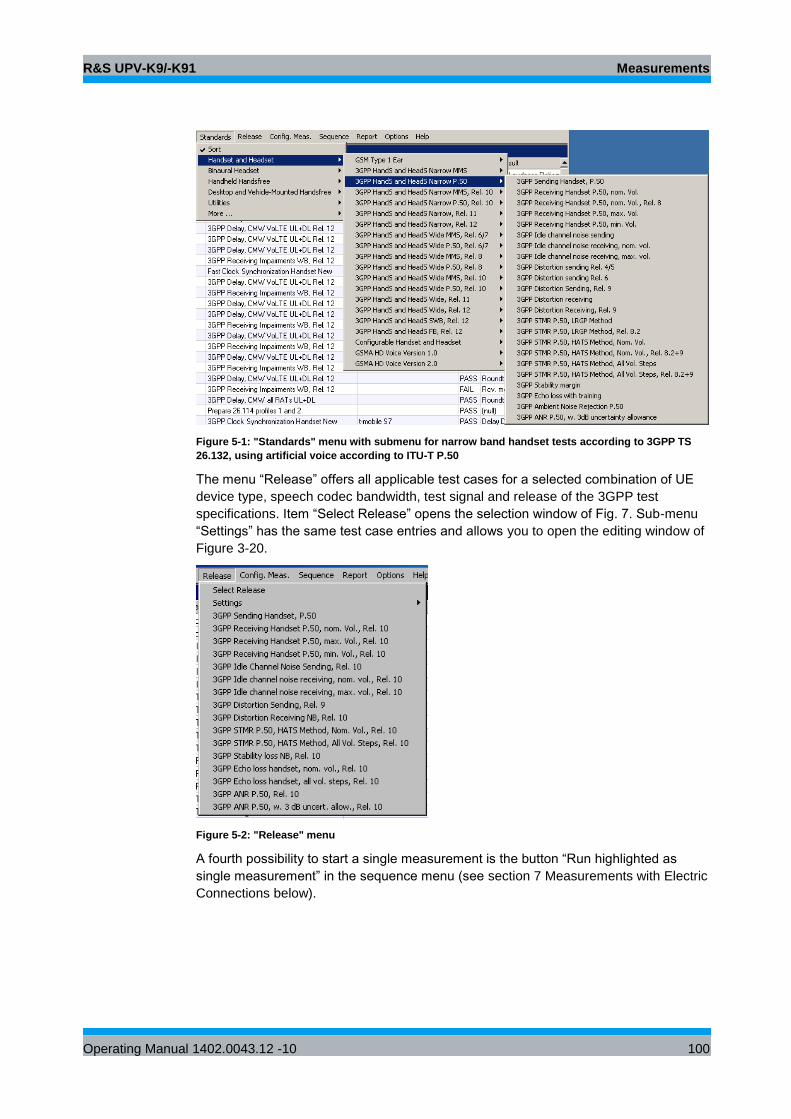
R&S UPV-K9/-K91 Measurements
Operating Manual 1402.0043.12 -10 100
Figure 5-1: "Standards" menu with submenu for narrow band handset tests according to 3GPP TS
26.132, using artificial voice according to ITU-T P.50
The menu “Release” offers all applicable test cases for a selected combination of UE
device type, speech codec bandwidth, test signal and release of the 3GPP test
specifications. Item “Select Release” opens the selection window of Fig. 7. Sub-menu
“Settings” has the same test case entries and allows you to open the editing window of
Figure 3-20.
Figure 5-2: "Release" menu
A fourth possibility to start a single measurement is the button “Run highlighted as
single measurement” in the sequence menu (see section 7 Measurements with Electric
Connections below).
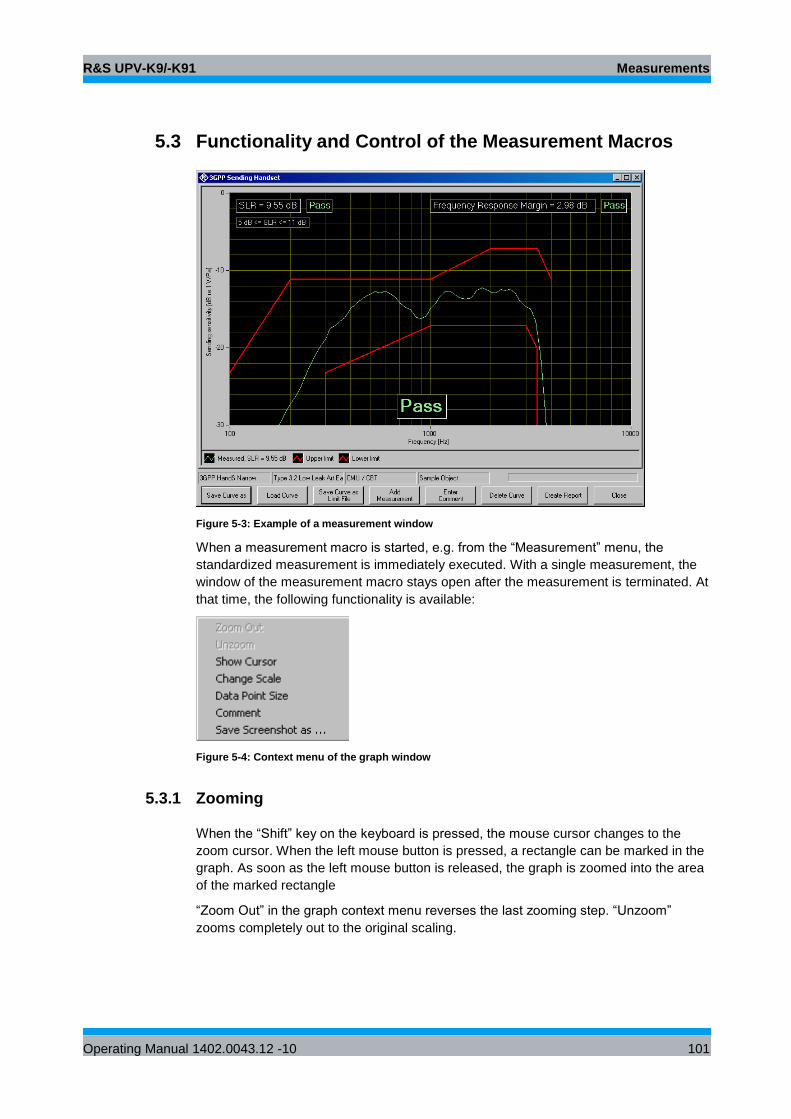
R&S UPV-K9/-K91 Measurements
Operating Manual 1402.0043.12 -10 101
5.3 Functionality and Control of the Measurement Macros
Figure 5-3: Example of a measurement window
When a measurement macro is started, e.g. from the “Measurement” menu, the
standardized measurement is immediately executed. With a single measurement, the
window of the measurement macro stays open after the measurement is terminated. At
that time, the following functionality is available:
Figure 5-4: Context menu of the graph window
5.3.1 Zooming
When the “Shift” key on the keyboard is pressed, the mouse cursor changes to the
zoom cursor. When the left mouse button is pressed, a rectangle can be marked in the
graph. As soon as the left mouse button is released, the graph is zoomed into the area
of the marked rectangle
“Zoom Out” in the graph context menu reverses the last zooming step. “Unzoom”
zooms completely out to the original scaling.
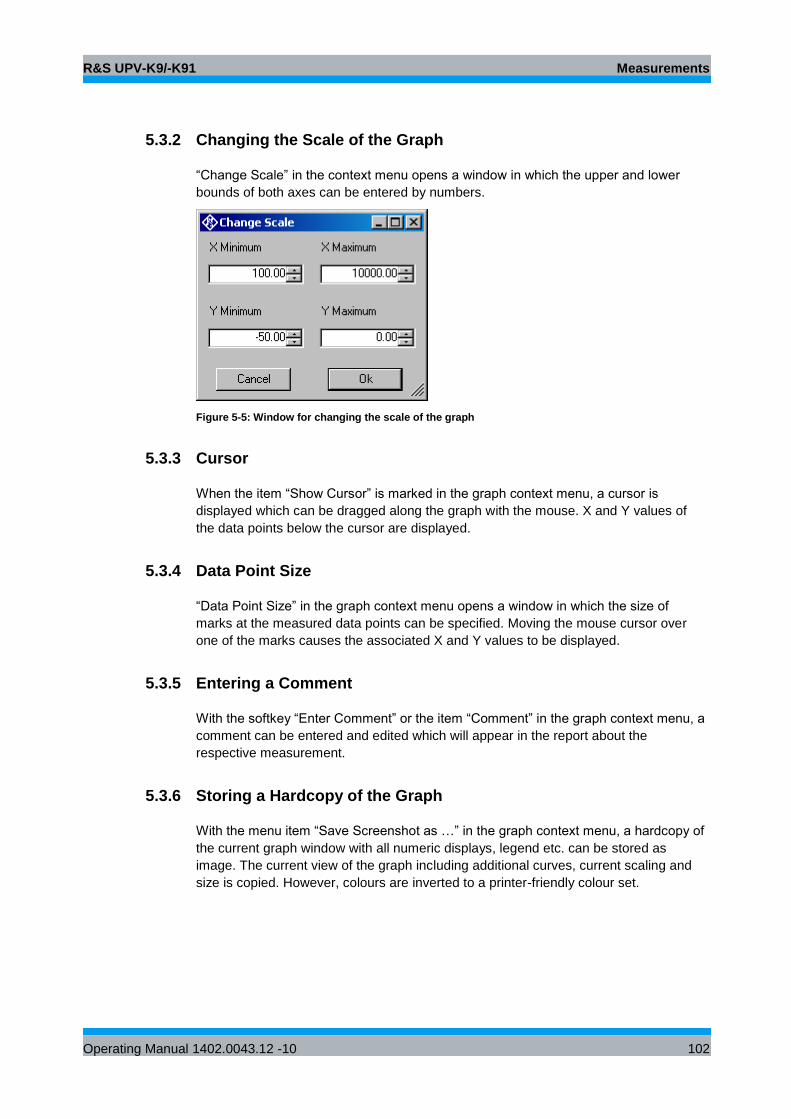
R&S UPV-K9/-K91 Measurements
Operating Manual 1402.0043.12 -10 102
5.3.2 Changing the Scale of the Graph
“Change Scale” in the context menu opens a window in which the upper and lower
bounds of both axes can be entered by numbers.
Figure 5-5: Window for changing the scale of the graph
5.3.3 Cursor
When the item “Show Cursor” is marked in the graph context menu, a cursor is
displayed which can be dragged along the graph with the mouse. X and Y values of
the data points below the cursor are displayed.
5.3.4 Data Point Size
“Data Point Size” in the graph context menu opens a window in which the size of
marks at the measured data points can be specified. Moving the mouse cursor over
one of the marks causes the associated X and Y values to be displayed.
5.3.5 Entering a Comment
With the softkey “Enter Comment” or the item “Comment” in the graph context menu, a
comment can be entered and edited which will appear in the report about the
respective measurement.
5.3.6 Storing a Hardcopy of the Graph
With the menu item “Save Screenshot as …” in the graph context menu, a hardcopy of
the current graph window with all numeric displays, legend etc. can be stored as
image. The current view of the graph including additional curves, current scaling and
size is copied. However, colours are inverted to a printer-friendly colour set.
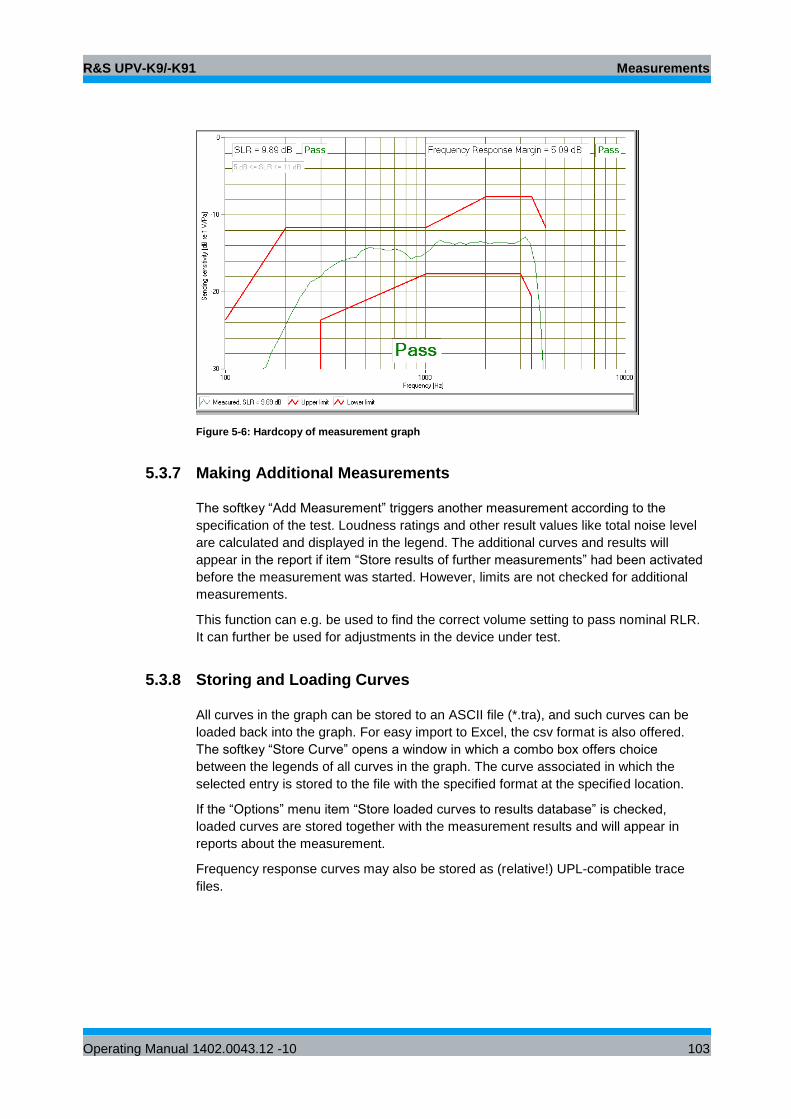
R&S UPV-K9/-K91 Measurements
Operating Manual 1402.0043.12 -10 103
Figure 5-6: Hardcopy of measurement graph
5.3.7 Making Additional Measurements
The softkey “Add Measurement” triggers another measurement according to the
specification of the test. Loudness ratings and other result values like total noise level
are calculated and displayed in the legend. The additional curves and results will
appear in the report if item “Store results of further measurements” had been activated
before the measurement was started. However, limits are not checked for additional
measurements.
This function can e.g. be used to find the correct volume setting to pass nominal RLR.
It can further be used for adjustments in the device under test.
5.3.8 Storing and Loading Curves
All curves in the graph can be stored to an ASCII file (*.tra), and such curves can be
loaded back into the graph. For easy import to Excel, the csv format is also offered.
The softkey “Store Curve” opens a window in which a combo box offers choice
between the legends of all curves in the graph. The curve associated in which the
selected entry is stored to the file with the specified format at the specified location.
If the “Options” menu item “Store loaded curves to results database” is checked,
loaded curves are stored together with the measurement results and will appear in
reports about the measurement.
Frequency response curves may also be stored as (relative!) UPL-compatible trace
files.
R&S UPV-K9/-K91 Measurements
Operating Manual 1402.0043.12 -10 104
5.3.9 Storing Curves as Limit Curves
With “Store As Limit Curve”, a curve can be selected and stored into an R&S UPV
format limit file with a specified shift in Y axis direction. This functionality can be used
to generate limit curves from “golden” devices for evaluation purpose.
5.3.10 Deleting Additional Curves in the Measurement Graph
By pressing or clicking “Delete Curve”, an additional curve in the measurement graph
can be removed. A window pops up with a combo box in which the curve to be deleted
can be selected. Note that it is not possible to delete the curve of the first
measurement, as this is the measurement for which the verdict is given. The selected
curve disappears from the graph on the screen and is removed from the database
such that it does not appear in reports anymore.
5.3.11 Creating a Report
The softkey “Create Report” causes a report to be prepared. The report preview
window (see below) opens and shows the preview of the report. Buttons in the preview
window allow to print the report or to export it to PDF, WORD, EXCEL or Rich Text
format.
5.3.12 Closing the Measurement Window
The softkey “Close” closes the measurement window. The control is returned to the
R&S UPV-K9 main window. All relevant data associated with the measurement is
imported to the results data. A new entry appears for the measurement as new row on
the bottom of the overview data grid in the main window.
5.4 Applicability of Measurements and Equipment Depending
on the Release
The 3GPP standard is constantly updated according to technical advances etc.
Therefore, different versions of the specifications exist in parallel, the so-called
releases. Use the “Release” menu to display testcases applicable for a certain release.
Furthermore, a separate spreadsheet “TestCaseList_23147.xls” is provided which lists
all tests and their applicability for the different releases. This test case list also serves
as a reference for the file names used as parameters when starting a test case
remotely.
R&S UPV-K9/-K91 Measurements
Operating Manual 1402.0043.12 -10 105
5.5 Sending Frequency Response and Loudness Rating
5.5.1 Sending Frequency Response
The sending frequency response is specified as the transmission ratio in dB of the
voltage at the decoder output to the input noise pressure at the artificial mouth.
With ear types 3.1 and 3.2, the mobile phone under test is installed in the LRGP
(loudness rating guard-ring position) according to ITU-T P.76, and the receiver is
sealed to the artificial ear. With ear types 3.3 and 3.4, the mobile phone is mounted on
the HATS using the handset positioner. The adjustment angles on the handset
positioner are not specified in the standard but should be noted for later reference.
A test signal with a sound pressure of -4.7 dBPa are created with the artificial mouth at
the MRP (mouth reference point), and the corresponding output voltage is measured at
the R&S CMU200 speech decoder output and evaluated.
The sending frequency response must be within the limit lines specified according to
Table 1 of 3GPP TS 26.131. The absolute sensitivity is not yet taken into account. The
valid limit lines depend on the release of the specification and are different for
narrowband and wideband speech.
The offset of the measured frequency response to the upper or lower limit line is
calculated and then the whole limit template is shifted to be centered with respect to
the measured curve. Then another limit check is performed. If the shifted curve is now
within the limit lines, PASS is output, otherwise FAIL is displayed. The limit check is
performed at each measured frequency. If the measured value and the end point of a
limit line are not at the same frequency, it may happen that the trace slightly crosses a
corner of the limit line although there are no limit violations. The remaining margin is
displayed. A negative margin shows the amount of limit violation.
5.5.2 Sending Loudness Rating
The sending loudness rating (SLR) takes into account the absolute loudness in the
transmit direction and weights the tones in compliance with the average speech
spectrum and the normal sensitivity of the average human ear.
To this end, the frequencies (Hz) of bands 4 to 17 (narrowband) or bands 1 to 20
(wideband), resp., are evaluated according to Table 1 of ITU-T P.79.
Table 3: Frequencies (Hz) of bands 1 to 20 acc. to Table 3 of ITU-T P.79
Band 1 2 3 4 5 6 7
f (Hz) 100 125 160 200 250 315 400
Band 8 9 10 11 12 13 14
f (Hz) 500 630 800 1000 1250 1600 2000
Band 15 16 17 18 19 20
f (Hz) 2500 3150 4000 5000 6300 8000
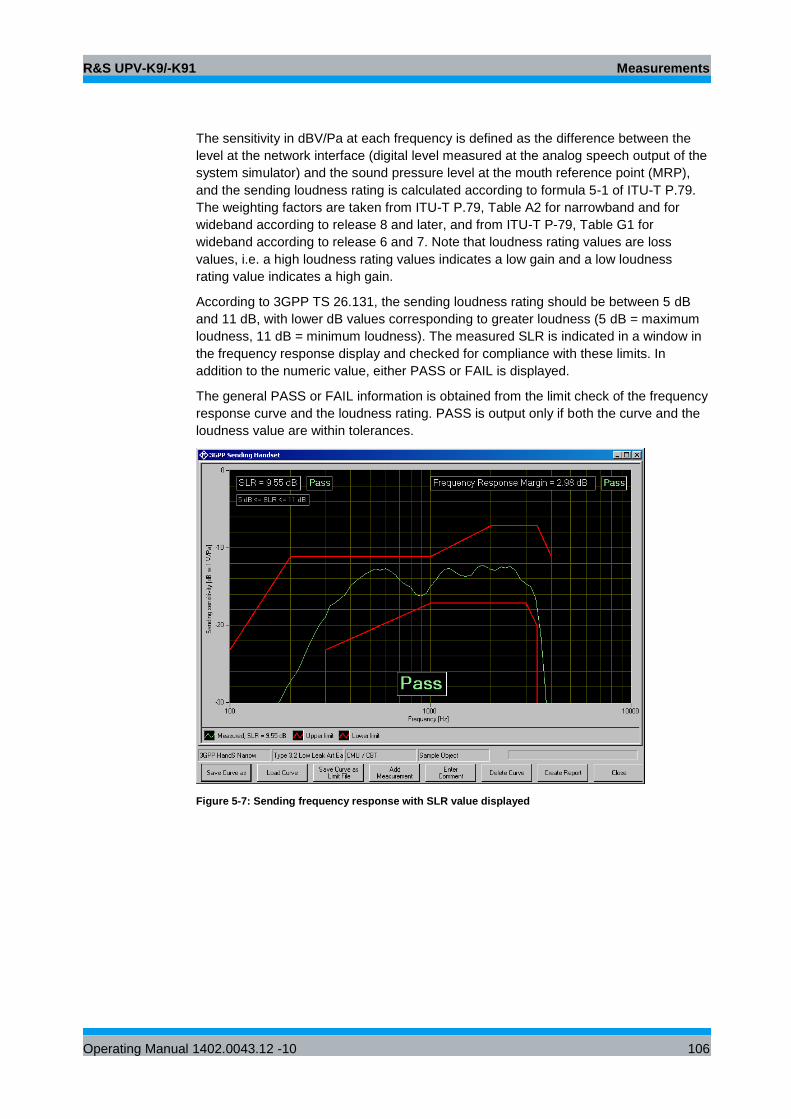
R&S UPV-K9/-K91 Measurements
Operating Manual 1402.0043.12 -10 106
The sensitivity in dBV/Pa at each frequency is defined as the difference between the
level at the network interface (digital level measured at the analog speech output of the
system simulator) and the sound pressure level at the mouth reference point (MRP),
and the sending loudness rating is calculated according to formula 5-1 of ITU-T P.79.
The weighting factors are taken from ITU-T P.79, Table A2 for narrowband and for
wideband according to release 8 and later, and from ITU-T P-79, Table G1 for
wideband according to release 6 and 7. Note that loudness rating values are loss
values, i.e. a high loudness rating values indicates a low gain and a low loudness
rating value indicates a high gain.
According to 3GPP TS 26.131, the sending loudness rating should be between 5 dB
and 11 dB, with lower dB values corresponding to greater loudness (5 dB = maximum
loudness, 11 dB = minimum loudness). The measured SLR is indicated in a window in
the frequency response display and checked for compliance with these limits. In
addition to the numeric value, either PASS or FAIL is displayed.
The general PASS or FAIL information is obtained from the limit check of the frequency
response curve and the loudness rating. PASS is output only if both the curve and the
loudness value are within tolerances.
Figure 5-7: Sending frequency response with SLR value displayed
R&S UPV-K9/-K91 Measurements
Operating Manual 1402.0043.12 -10 107
5.5.3 Sending Tests Using Artificial Voice According to ITU-T P.50 or
Single-Talk Speech according to ITU-T P.501 as Test Signal
Modulated multisine as test signal is proven to pass GSM and 3GPP codecs
“enhanced full rate” and AMR (adaptive multi-rate) with 12.2 kbit/s without significant
degradation. However, most recent background noise reduction algorithms employ
more sophisticated indicators than just variation over time to distinguish between voice
signals and background noise signals. As a consequence, the spectrum of the
modulated multisine signal may be altered by such algorithms, which results in a
change in the measured frequency response. For this reason all sending, receiving,
sidetone and ambient noise rejection tests are alternatively offered with artificial voice
according to ITU-T P.50 or Single-Talk Speech according to ITU-T P.501 as test
signal, although background noise reduction is mainly employed in the sending path of
mobile phones (update key UPV-K9101 or higher required for P.50, update key UPV-
K9103 or higher required for P.501).
The P.50 test signal simulates the spectrum and time structure of human voice without
having any semantic content. It consists of 10 seconds “female” voice and 10 seconds
“male” voice.
The P.501 single-talk test signal contains six sentences recorded with male voices and
six sentences recorded with female voices.
Other than with the modulated multisine, the reference spectra at the respective inputs
of the transmission path are measured in advance and stored in files. Therefore, the
speech spectrum calibration of the respective test signal for sending direction is a
prerequisite for this test (see chapter 3 Calibration).
To make sure that the spectral transform is performed on the same portion of the test
signal during reference spectrum measurement and output spectrum measurement,
the output spectrum measurement is preceded by a delay measurement employing a
sine burst. The start of the measurement is then delayed against the playback of the
test signal by the measured amount of delay in the transmission path. If the
transmission path is interrupted, e.g. due to a dropped call, the test stops with a
suitable warning message.
5.6 Receiving Frequency Response and Loudness Rating
The following three groups of measurement definitions are available, as the
permissible limit values of the loudness rating depend on the volume set in the mobile
phone under test: “…, nom. Vol” checks loudness rating limits for nominal loudness
setting and at the same time compliance with the frequency response limit template.
“…, max. Vol.” checks the receiving loudness rating at the highest volume setting
against a minimum. “…, min. Vol.” checks the receiving loudness rating at the lowest
volume setting against a maximum. (Note: As the loudness rating is a loss value, a
high RLR is associated with a soft speech signal and a low RLR is associated with a
loud speech signal).
R&S UPV-K9/-K91 Measurements
Operating Manual 1402.0043.12 -10 108
5.6.1 Receiving Frequency Response
The receiving frequency response is specified as the transmission ratio in dB of the
sound pressure in the artificial ear to the rms value at the network interface, applied as
input voltage at the speech coder input of the R&S CMU200. The measured sound
pressure is either referenced to the ear reference point (ERP) or (from release 10) to
DRP with diffuse field correction. For ear type 1, the measuring microphone is directly
applied to the ERP and no further correction is required. For ear types 3.x, the
measuring microphone is applied to the drum reference point (DRP), which is the
reason why any measured value has to be converted to the ERP by means of
calibration factors. For special purpose there are separate measurements supplied
with R&S UPV-K91, which measure the sound pressure referenced to the DRP.
The mobile phone under test is installed in the LRGP (ITU-T P.76) or on the HATS. In
case of ear type 1, the receiver is sealed to knife edge of the artificial ear. In case of
ear type 3.2, the receiver is sealed to the rubber gasket of the artificial ear. If the low
leak version of this ear type is used, care must be taken that the defined leak opening
at the circumference of the artificial ear is not accidentally covered. On the HATS with
artificial ear type 3.3, a certain application force, e.g. 8N has to be set on the handset
fixture.
The speech coder is driven such that a signal with a system reference level
of -16 dBm0 is obtained. The sound pressure in the artificial ear is measured and
evaluated.
Ear type 1 will no longer be used for measurements on 3GPP mobile phones.
Therefore, 3GPP TS 26.131 defines limit values only for ear types 3.x, whereas the
limit values specified in 3GPP TS 51.010 (previously GSM 11.10) are still valid for ear
type 1.
Use tests “3GPP GSM Rel. 4 Receiving Handset, nom. Vol”, “3GPP GSM Rel. 4
Receiving Handset, max. Vol”, “3GPP GSM Rel. 4 Receiving Handset, min. Vol” for
receiving tests with type 1 artificial ear. From Release 9 only ear types 3.3 and 3.4 are
allowed for standard-conformal tests. From Release 10 only ear type 3.3 is allowed.
Frequency response limits have been adjusted accordingly. Use the appropriate
versions of the receiving testcase.
When ear type 1 is used, the receiving frequency response must be within the limit
lines specified in Table 30.2 of 3GPP TS 51.010. When ear type 3.x is used, it must be
within the limit lines specified in 3GPP TS 26.131. In the frequency response curve, the
limit template is shifted to be centered with respect to the displayed absolute
sensitivity.
The margins of the measured frequency response to the upper and lower limit lines are
calculated separately, and then the whole template is shifted such that the resulting
margins to upper and lower limit are equal. Then another limit check is performed. If
the shifted curve is now within the limit lines, PASS is output, otherwise FAIL is
displayed. The limit check is performed at each measured frequency. If the measured
value and the end point of a limit line are not at the same frequency, it may happen
that the trace slightly crosses a corner of the limit line although there are no limit
violations. The remaining margin is displayed. A negative margin shows the amount of
limit violation.
R&S UPV-K9/-K91 Measurements
Operating Manual 1402.0043.12 -10 109
5.6.2 Receiving Loudness Rating
The receiving loudness rating (RLR) takes into account the absolute loudness in the
receive direction and weights the spectral components in compliance with the
difference between an average speech spectrum and the normal threshold of hearing
in quiet of the average human ear.
To this end, the frequencies (Hz) of bands 4 to 17 (narrowband) or bands 1 to 20
(wideband), resp., are evaluated according to Table 1 of ITU-T P.79 (see Table 3)
The sensitivity at each frequency is specified as the ratio dBPa/V, calculated from the
level difference between the level at the network interface (measured at the analog
R&S CMU200 speech decoder output) and the sound pressure level at the artificial
ear, referenced to the ERP, and the receiving loudness rating is calculated according
to formula 5-1 of ITU-T P.79. The weighting factors are taken from ITU-T P-79,
Table A2 for narrowband and for wideband according to release 8, and from ITU-T P-
79, Table G1 for wideband according to release 6 and 7.
Due to the output gain tolerance of the R&S CMU200 speech decoder, the individual
sensitivity of the R&S CMU200 used has to be taken into account in order to calculate
the receiving loudness rating (see section 3 Calibration above).
The receiving loudness rating depends on the volume setting on the mobile phone
under test and, according to 3GPP TS 26.131, should be between -1 dB and +5 dB for
narrowband and for wideband according to release 8 and later, and between 2 dB and
8 dB for wideband according to release 6 and 7, obtained at a rated (“nominal”)
loudness setting, with lower dB values corresponding to a higher loudness.
The RLR must not fall below -13 dB (-10 dB for wideband in release 6 and 7) when
maximum loudness is set on the mobile phone. To prevent damage to the human ear,
the maximum receiving loudness must not exceed a certain value.
The measured RLR is indicated in a window in the frequency response display and
checked for compliance with these limits. In addition to the numeric value, either PASS
or FAIL is displayed.
With “3GPP Receiving Handset, nom. Vol”, the general PASS or FAIL information is
obtained from the limit check of the frequency response curve and the loudness rating.
PASS is output only if both the curve and the loudness value are within tolerances.
“3GPP Receiving Handset, max. Vol” checks only the RLR against a minimum
of -13 dB. The frequency response curve is shown for information only.
“3GPP Receiving Handset, min. Vol” checks the RLR against a maximum of +18 dB.
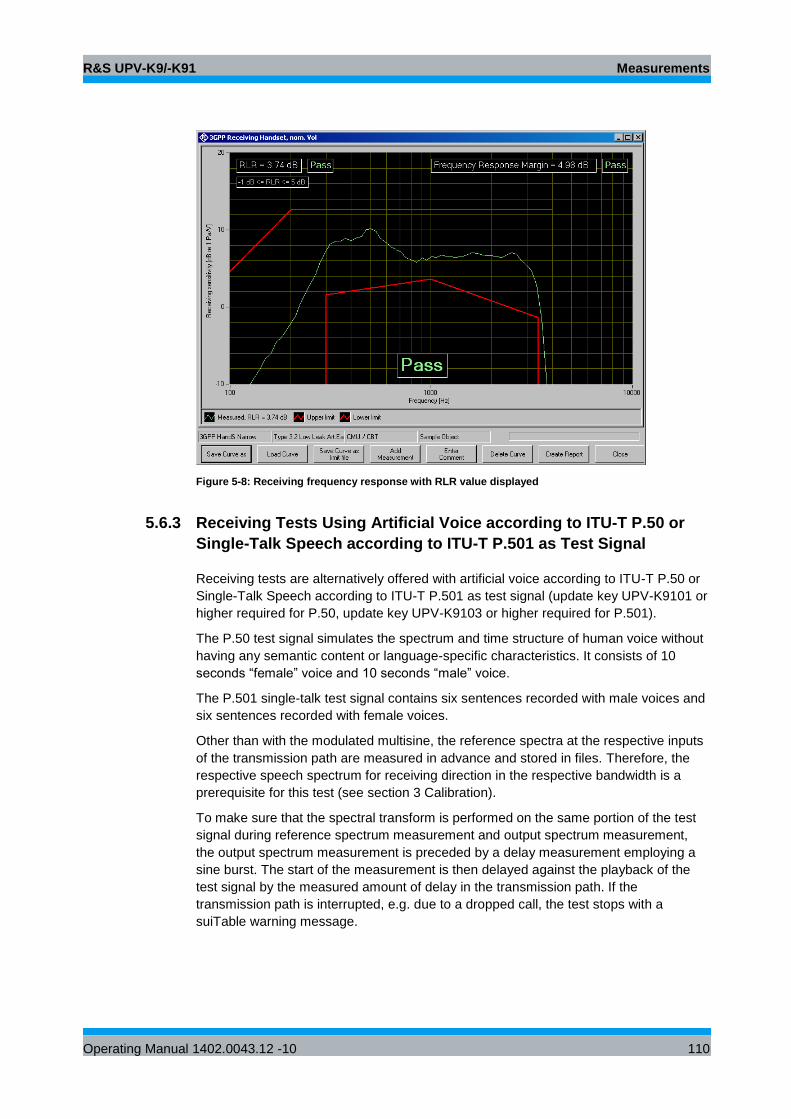
R&S UPV-K9/-K91 Measurements
Operating Manual 1402.0043.12 -10 110
Figure 5-8: Receiving frequency response with RLR value displayed
5.6.3 Receiving Tests Using Artificial Voice according to ITU-T P.50 or
Single-Talk Speech according to ITU-T P.501 as Test Signal
Receiving tests are alternatively offered with artificial voice according to ITU-T P.50 or
Single-Talk Speech according to ITU-T P.501 as test signal (update key UPV-K9101 or
higher required for P.50, update key UPV-K9103 or higher required for P.501).
The P.50 test signal simulates the spectrum and time structure of human voice without
having any semantic content or language-specific characteristics. It consists of 10
seconds “female” voice and 10 seconds “male” voice.
The P.501 single-talk test signal contains six sentences recorded with male voices and
six sentences recorded with female voices.
Other than with the modulated multisine, the reference spectra at the respective inputs
of the transmission path are measured in advance and stored in files. Therefore, the
respective speech spectrum for receiving direction in the respective bandwidth is a
prerequisite for this test (see section 3 Calibration).
To make sure that the spectral transform is performed on the same portion of the test
signal during reference spectrum measurement and output spectrum measurement,
the output spectrum measurement is preceded by a delay measurement employing a
sine burst. The start of the measurement is then delayed against the playback of the
test signal by the measured amount of delay in the transmission path. If the
transmission path is interrupted, e.g. due to a dropped call, the test stops with a
suiTable warning message.
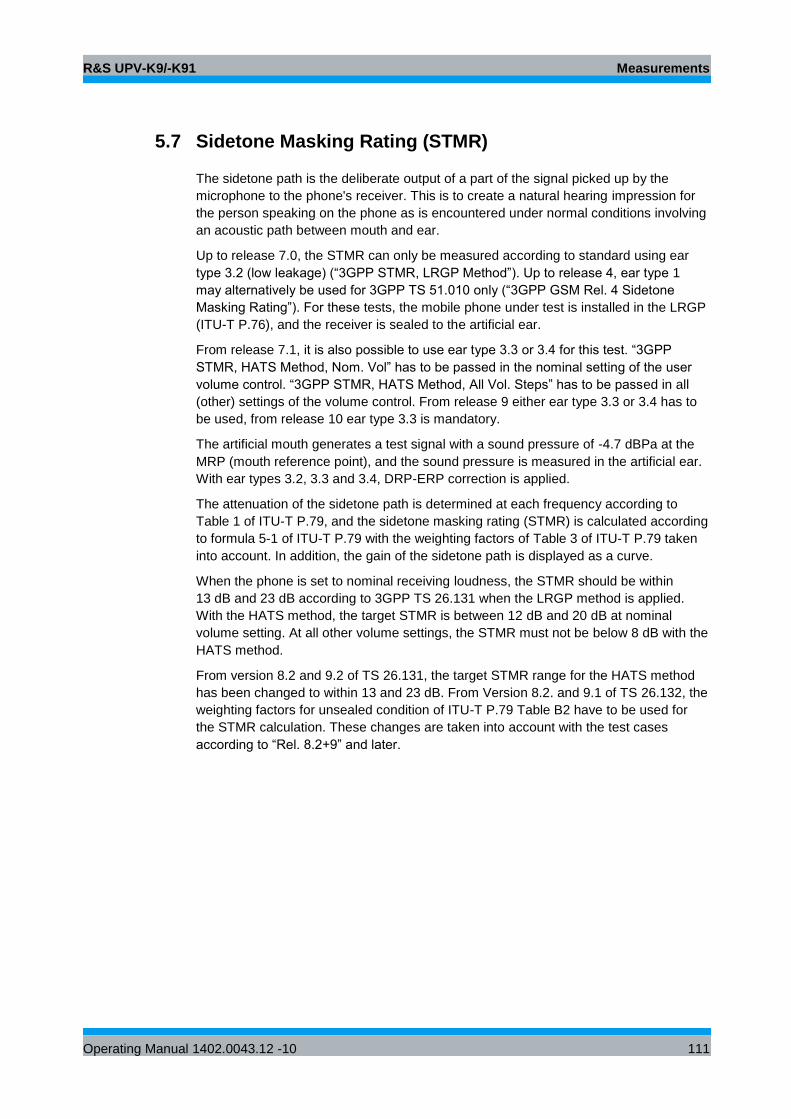
R&S UPV-K9/-K91 Measurements
Operating Manual 1402.0043.12 -10 111
5.7 Sidetone Masking Rating (STMR)
The sidetone path is the deliberate output of a part of the signal picked up by the
microphone to the phone's receiver. This is to create a natural hearing impression for
the person speaking on the phone as is encountered under normal conditions involving
an acoustic path between mouth and ear.
Up to release 7.0, the STMR can only be measured according to standard using ear
type 3.2 (low leakage) (“3GPP STMR, LRGP Method”). Up to release 4, ear type 1
may alternatively be used for 3GPP TS 51.010 only (“3GPP GSM Rel. 4 Sidetone
Masking Rating”). For these tests, the mobile phone under test is installed in the LRGP
(ITU-T P.76), and the receiver is sealed to the artificial ear.
From release 7.1, it is also possible to use ear type 3.3 or 3.4 for this test. “3GPP
STMR, HATS Method, Nom. Vol” has to be passed in the nominal setting of the user
volume control. “3GPP STMR, HATS Method, All Vol. Steps” has to be passed in all
(other) settings of the volume control. From release 9 either ear type 3.3 or 3.4 has to
be used, from release 10 ear type 3.3 is mandatory.
The artificial mouth generates a test signal with a sound pressure of -4.7 dBPa at the
MRP (mouth reference point), and the sound pressure is measured in the artificial ear.
With ear types 3.2, 3.3 and 3.4, DRP-ERP correction is applied.
The attenuation of the sidetone path is determined at each frequency according to
Table 1 of ITU-T P.79, and the sidetone masking rating (STMR) is calculated according
to formula 5-1 of ITU-T P.79 with the weighting factors of Table 3 of ITU-T P.79 taken
into account. In addition, the gain of the sidetone path is displayed as a curve.
When the phone is set to nominal receiving loudness, the STMR should be within
13 dB and 23 dB according to 3GPP TS 26.131 when the LRGP method is applied.
With the HATS method, the target STMR is between 12 dB and 20 dB at nominal
volume setting. At all other volume settings, the STMR must not be below 8 dB with the
HATS method.
From version 8.2 and 9.2 of TS 26.131, the target STMR range for the HATS method
has been changed to within 13 and 23 dB. From Version 8.2. and 9.1 of TS 26.132, the
weighting factors for unsealed condition of ITU-T P.79 Table B2 have to be used for
the STMR calculation. These changes are taken into account with the test cases
according to “Rel. 8.2+9” and later.
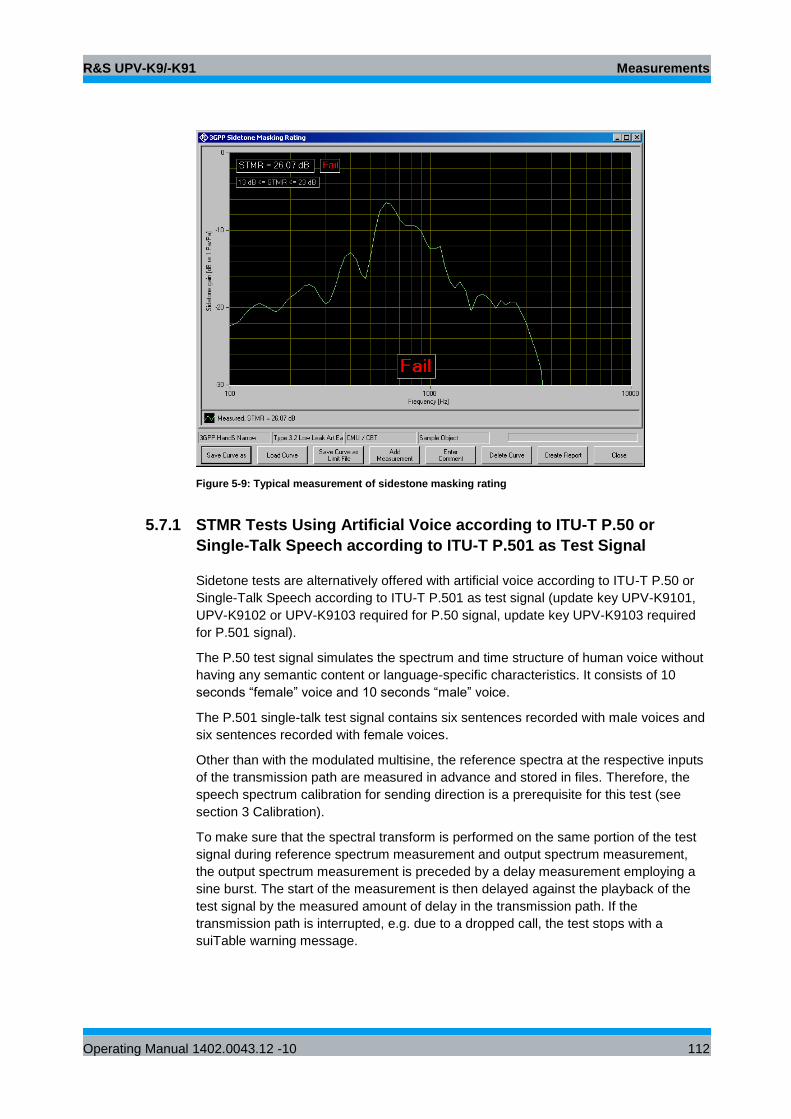
R&S UPV-K9/-K91 Measurements
Operating Manual 1402.0043.12 -10 112
Figure 5-9: Typical measurement of sidestone masking rating
5.7.1 STMR Tests Using Artificial Voice according to ITU-T P.50 or
Single-Talk Speech according to ITU-T P.501 as Test Signal
Sidetone tests are alternatively offered with artificial voice according to ITU-T P.50 or
Single-Talk Speech according to ITU-T P.501 as test signal (update key UPV-K9101,
UPV-K9102 or UPV-K9103 required for P.50 signal, update key UPV-K9103 required
for P.501 signal).
The P.50 test signal simulates the spectrum and time structure of human voice without
having any semantic content or language-specific characteristics. It consists of 10
seconds “female” voice and 10 seconds “male” voice.
The P.501 single-talk test signal contains six sentences recorded with male voices and
six sentences recorded with female voices.
Other than with the modulated multisine, the reference spectra at the respective inputs
of the transmission path are measured in advance and stored in files. Therefore, the
speech spectrum calibration for sending direction is a prerequisite for this test (see
section 3 Calibration).
To make sure that the spectral transform is performed on the same portion of the test
signal during reference spectrum measurement and output spectrum measurement,
the output spectrum measurement is preceded by a delay measurement employing a
sine burst. The start of the measurement is then delayed against the playback of the
test signal by the measured amount of delay in the transmission path. If the
transmission path is interrupted, e.g. due to a dropped call, the test stops with a
suiTable warning message.
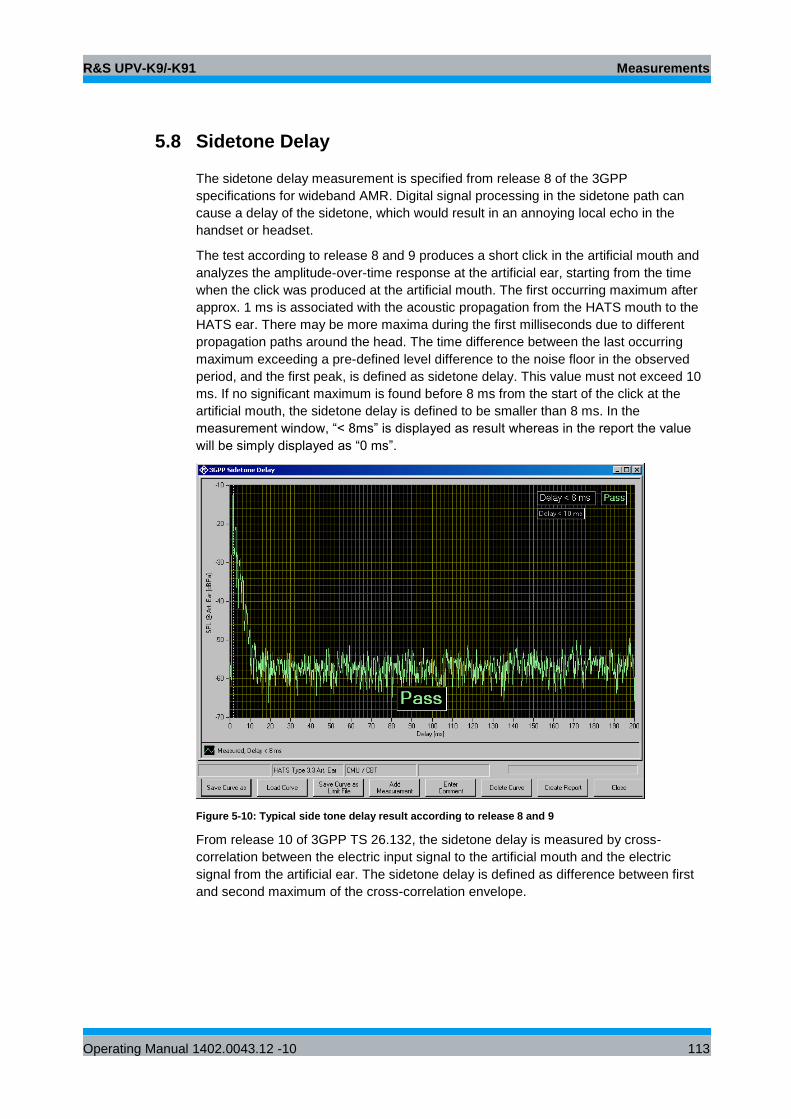
R&S UPV-K9/-K91 Measurements
Operating Manual 1402.0043.12 -10 113
5.8 Sidetone Delay
The sidetone delay measurement is specified from release 8 of the 3GPP
specifications for wideband AMR. Digital signal processing in the sidetone path can
cause a delay of the sidetone, which would result in an annoying local echo in the
handset or headset.
The test according to release 8 and 9 produces a short click in the artificial mouth and
analyzes the amplitude-over-time response at the artificial ear, starting from the time
when the click was produced at the artificial mouth. The first occurring maximum after
approx. 1 ms is associated with the acoustic propagation from the HATS mouth to the
HATS ear. There may be more maxima during the first milliseconds due to different
propagation paths around the head. The time difference between the last occurring
maximum exceeding a pre-defined level difference to the noise floor in the observed
period, and the first peak, is defined as sidetone delay. This value must not exceed 10
ms. If no significant maximum is found before 8 ms from the start of the click at the
artificial mouth, the sidetone delay is defined to be smaller than 8 ms. In the
measurement window, “< 8ms” is displayed as result whereas in the report the value
will be simply displayed as “0 ms”.
Figure 5-10: Typical side tone delay result according to release 8 and 9
From release 10 of 3GPP TS 26.132, the sidetone delay is measured by cross-
correlation between the electric input signal to the artificial mouth and the electric
signal from the artificial ear. The sidetone delay is defined as difference between first
and second maximum of the cross-correlation envelope.
R&S UPV-K9/-K91 Measurements
Operating Manual 1402.0043.12 -10 114
Test signal is a composite source signal (CSS) according to ITU-T P.501, which
consists of a voiced part and a pseudo-noise multisine part. Before the test, the test
signal is offline-filtered according to the mouth speaker equalization curve obtained
during mouth calibration. This offline filtering is only performed when the valid speaker
equalization curve is newer than the file with the filtered test signal.
Figure 5-11: Typical side tone delay result according to release 10
5.9 Roundtrip Delay
From Release 11 of 3GPP TS 26.131 and TS 26.132 the measurement of the roundtrip
delay is required. The roundtrip delay is defined as the sum of the contributions of the
UE under test to the uplink and downlink end-to-end delay. To obtain the roundtrip
delay value, the end-to-end delay can either be measured separately for uplink and
downlink, or the loopback delay can be measured by establishing a loopback of the
voice data in the system simulator. In both cases, the contribution of the system
simulator has to be subtracted from the measured end-to-end delay.
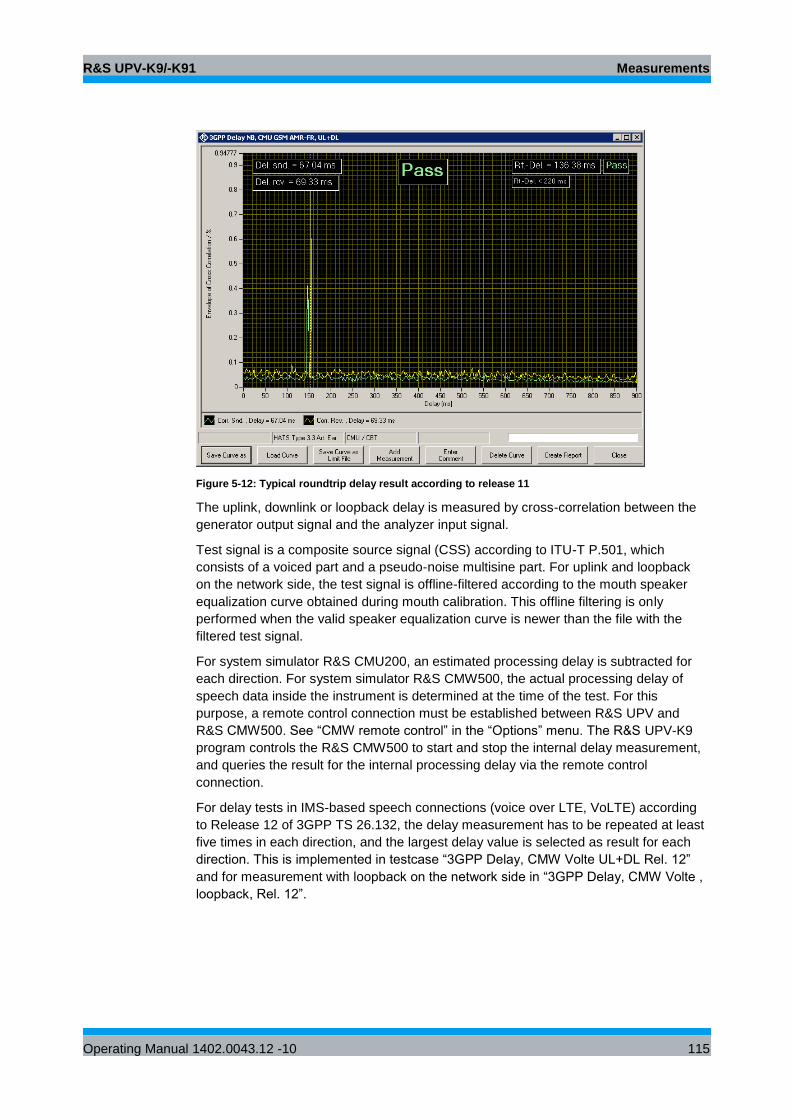
R&S UPV-K9/-K91 Measurements
Operating Manual 1402.0043.12 -10 115
Figure 5-12: Typical roundtrip delay result according to release 11
The uplink, downlink or loopback delay is measured by cross-correlation between the
generator output signal and the analyzer input signal.
Test signal is a composite source signal (CSS) according to ITU-T P.501, which
consists of a voiced part and a pseudo-noise multisine part. For uplink and loopback
on the network side, the test signal is offline-filtered according to the mouth speaker
equalization curve obtained during mouth calibration. This offline filtering is only
performed when the valid speaker equalization curve is newer than the file with the
filtered test signal.
For system simulator R&S CMU200, an estimated processing delay is subtracted for
each direction. For system simulator R&S CMW500, the actual processing delay of
speech data inside the instrument is determined at the time of the test. For this
purpose, a remote control connection must be established between R&S UPV and
R&S CMW500. See “CMW remote control” in the “Options” menu. The R&S UPV-K9
program controls the R&S CMW500 to start and stop the internal delay measurement,
and queries the result for the internal processing delay via the remote control
connection.
For delay tests in IMS-based speech connections (voice over LTE, VoLTE) according
to Release 12 of 3GPP TS 26.132, the delay measurement has to be repeated at least
five times in each direction, and the largest delay value is selected as result for each
direction. This is implemented in testcase “3GPP Delay, CMW Volte UL+DL Rel. 12”
and for measurement with loopback on the network side in “3GPP Delay, CMW Volte ,
loopback, Rel. 12”.
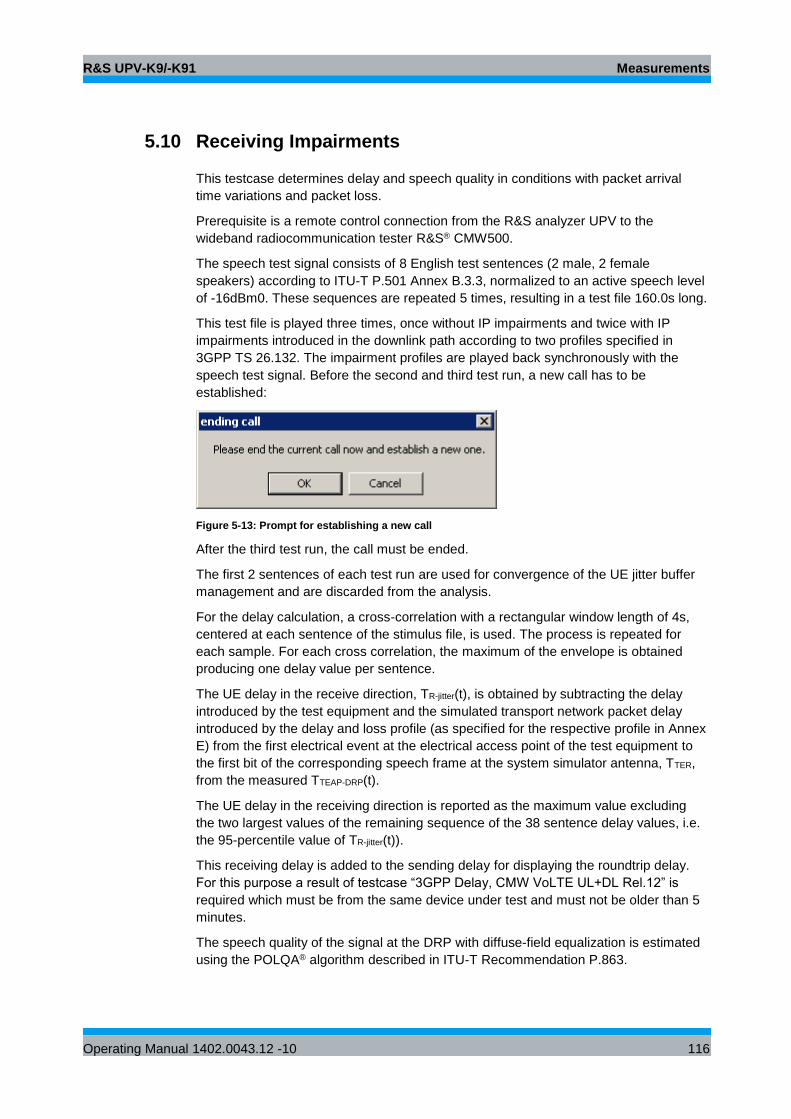
R&S UPV-K9/-K91 Measurements
Operating Manual 1402.0043.12 -10 116
5.10 Receiving Impairments
This testcase determines delay and speech quality in conditions with packet arrival
time variations and packet loss.
Prerequisite is a remote control connection from the R&S analyzer UPV to the
wideband radiocommunication tester R&S® CMW500.
The speech test signal consists of 8 English test sentences (2 male, 2 female
speakers) according to ITU-T P.501 Annex B.3.3, normalized to an active speech level
of -16dBm0. These sequences are repeated 5 times, resulting in a test file 160.0s long.
This test file is played three times, once without IP impairments and twice with IP
impairments introduced in the downlink path according to two profiles specified in
3GPP TS 26.132. The impairment profiles are played back synchronously with the
speech test signal. Before the second and third test run, a new call has to be
established:
Figure 5-13: Prompt for establishing a new call
After the third test run, the call must be ended.
The first 2 sentences of each test run are used for convergence of the UE jitter buffer
management and are discarded from the analysis.
For the delay calculation, a cross-correlation with a rectangular window length of 4s,
centered at each sentence of the stimulus file, is used. The process is repeated for
each sample. For each cross correlation, the maximum of the envelope is obtained
producing one delay value per sentence.
The UE delay in the receive direction, TR-jitter(t), is obtained by subtracting the delay
introduced by the test equipment and the simulated transport network packet delay
introduced by the delay and loss profile (as specified for the respective profile in Annex
E) from the first electrical event at the electrical access point of the test equipment to
the first bit of the corresponding speech frame at the system simulator antenna, TTER,
from the measured TTEAP-DRP(t).
The UE delay in the receiving direction is reported as the maximum value excluding
the two largest values of the remaining sequence of the 38 sentence delay values, i.e.
the 95-percentile value of TR-jitter(t)).
This receiving delay is added to the sending delay for displaying the roundtrip delay.
For this purpose a result of testcase “3GPP Delay, CMW VoLTE UL+DL Rel.12” is
required which must be from the same device under test and must not be older than 5
minutes.
The speech quality of the signal at the DRP with diffuse-field equalization is estimated
using the POLQA® algorithm described in ITU-T Recommendation P.863.
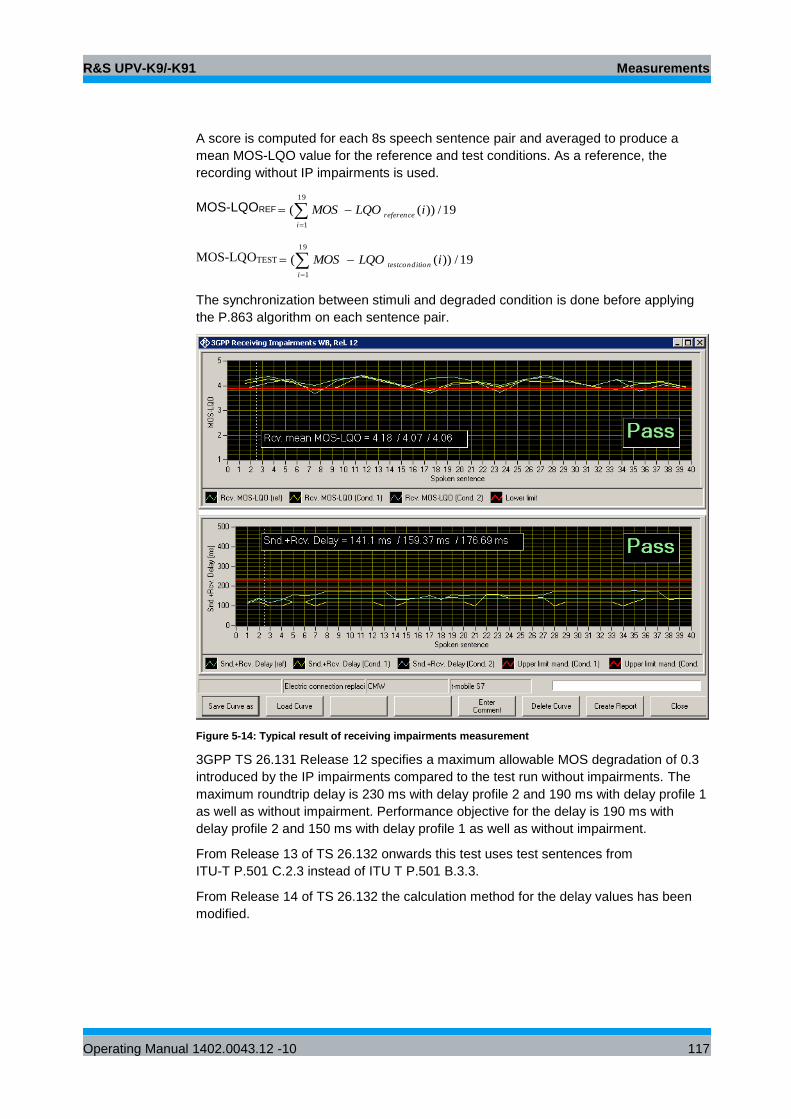
R&S UPV-K9/-K91 Measurements
Operating Manual 1402.0043.12 -10 117
A score is computed for each 8s speech sentence pair and averaged to produce a
mean MOS-LQO value for the reference and test conditions. As a reference, the
recording without IP impairments is used.
MOS-LQOREF 19/))((19
1
iLQOMOSi
reference
MOS-LQOTEST 19/))((19
1
iLQOMOSi
iontestcondit
The synchronization between stimuli and degraded condition is done before applying
the P.863 algorithm on each sentence pair.
Figure 5-14: Typical result of receiving impairments measurement
3GPP TS 26.131 Release 12 specifies a maximum allowable MOS degradation of 0.3
introduced by the IP impairments compared to the test run without impairments. The
maximum roundtrip delay is 230 ms with delay profile 2 and 190 ms with delay profile 1
as well as without impairment. Performance objective for the delay is 190 ms with
delay profile 2 and 150 ms with delay profile 1 as well as without impairment.
From Release 13 of TS 26.132 onwards this test uses test sentences from
ITU-T P.501 C.2.3 instead of ITU T P.501 B.3.3.
From Release 14 of TS 26.132 the calculation method for the delay values has been
modified.
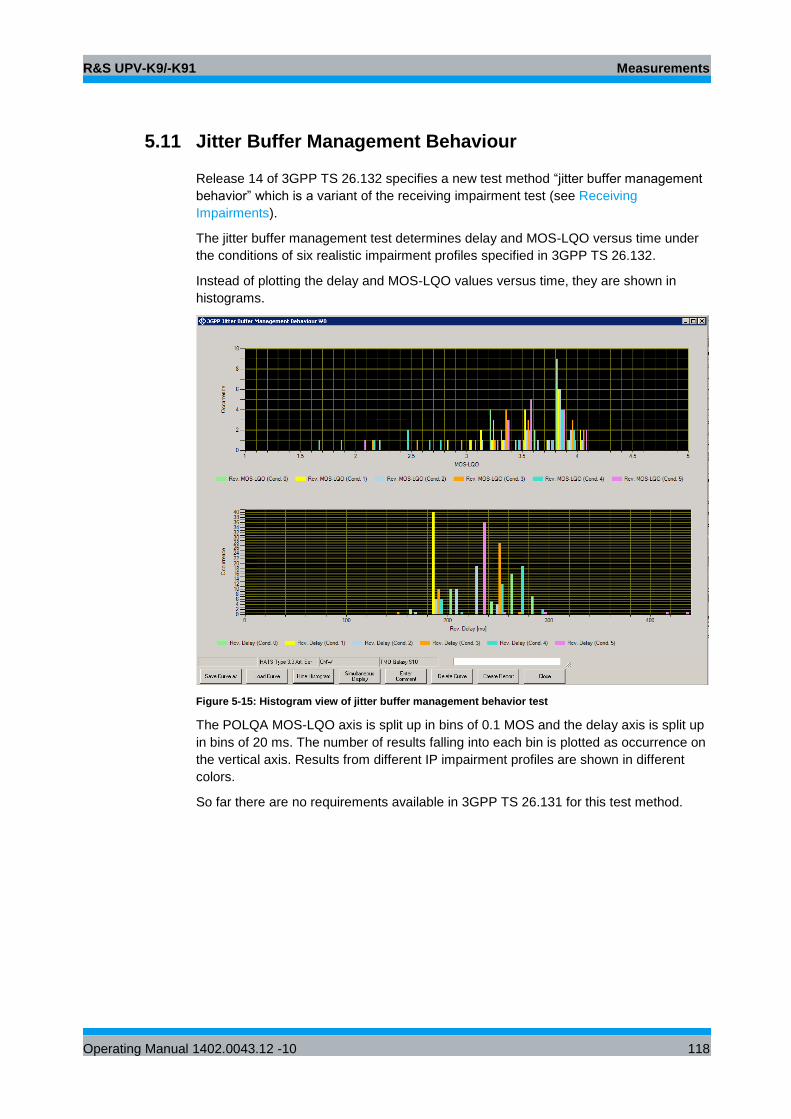
R&S UPV-K9/-K91 Measurements
Operating Manual 1402.0043.12 -10 118
5.11 Jitter Buffer Management Behaviour
Release 14 of 3GPP TS 26.132 specifies a new test method “jitter buffer management
behavior” which is a variant of the receiving impairment test (see Receiving
Impairments).
The jitter buffer management test determines delay and MOS-LQO versus time under
the conditions of six realistic impairment profiles specified in 3GPP TS 26.132.
Instead of plotting the delay and MOS-LQO values versus time, they are shown in
histograms.
Figure 5-15: Histogram view of jitter buffer management behavior test
The POLQA MOS-LQO axis is split up in bins of 0.1 MOS and the delay axis is split up
in bins of 20 ms. The number of results falling into each bin is plotted as occurrence on
the vertical axis. Results from different IP impairment profiles are shown in different
colors.
So far there are no requirements available in 3GPP TS 26.131 for this test method.
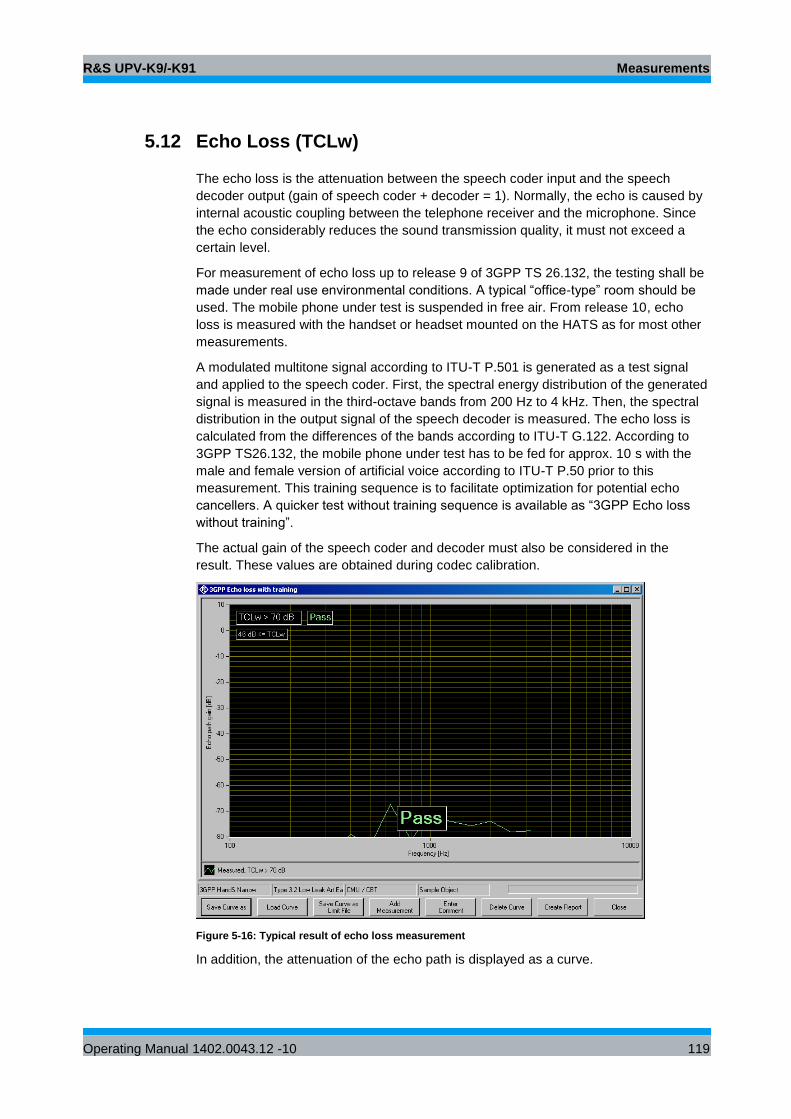
R&S UPV-K9/-K91 Measurements
Operating Manual 1402.0043.12 -10 119
5.12 Echo Loss (TCLw)
The echo loss is the attenuation between the speech coder input and the speech
decoder output (gain of speech coder + decoder = 1). Normally, the echo is caused by
internal acoustic coupling between the telephone receiver and the microphone. Since
the echo considerably reduces the sound transmission quality, it must not exceed a
certain level.
For measurement of echo loss up to release 9 of 3GPP TS 26.132, the testing shall be
made under real use environmental conditions. A typical “office-type” room should be
used. The mobile phone under test is suspended in free air. From release 10, echo
loss is measured with the handset or headset mounted on the HATS as for most other
measurements.
A modulated multitone signal according to ITU-T P.501 is generated as a test signal
and applied to the speech coder. First, the spectral energy distribution of the generated
signal is measured in the third-octave bands from 200 Hz to 4 kHz. Then, the spectral
distribution in the output signal of the speech decoder is measured. The echo loss is
calculated from the differences of the bands according to ITU-T G.122. According to
3GPP TS26.132, the mobile phone under test has to be fed for approx. 10 s with the
male and female version of artificial voice according to ITU-T P.50 prior to this
measurement. This training sequence is to facilitate optimization for potential echo
cancellers. A quicker test without training sequence is available as “3GPP Echo loss
without training”.
The actual gain of the speech coder and decoder must also be considered in the
result. These values are obtained during codec calibration.
Figure 5-16: Typical result of echo loss measurement
In addition, the attenuation of the echo path is displayed as a curve.
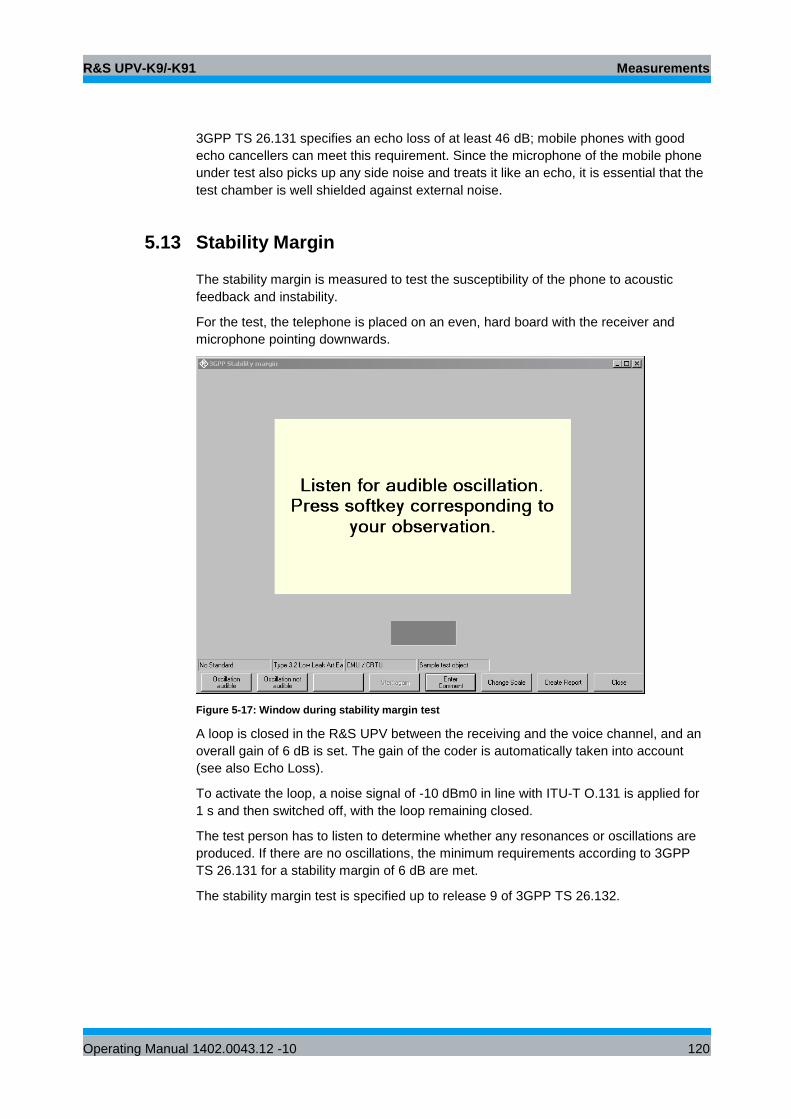
R&S UPV-K9/-K91 Measurements
Operating Manual 1402.0043.12 -10 120
3GPP TS 26.131 specifies an echo loss of at least 46 dB; mobile phones with good
echo cancellers can meet this requirement. Since the microphone of the mobile phone
under test also picks up any side noise and treats it like an echo, it is essential that the
test chamber is well shielded against external noise.
5.13 Stability Margin
The stability margin is measured to test the susceptibility of the phone to acoustic
feedback and instability.
For the test, the telephone is placed on an even, hard board with the receiver and
microphone pointing downwards.
Figure 5-17: Window during stability margin test
A loop is closed in the R&S UPV between the receiving and the voice channel, and an
overall gain of 6 dB is set. The gain of the coder is automatically taken into account
(see also Echo Loss).
To activate the loop, a noise signal of -10 dBm0 in line with ITU-T O.131 is applied for
1 s and then switched off, with the loop remaining closed.
The test person has to listen to determine whether any resonances or oscillations are
produced. If there are no oscillations, the minimum requirements according to 3GPP
TS 26.131 for a stability margin of 6 dB are met.
The stability margin test is specified up to release 9 of 3GPP TS 26.132.
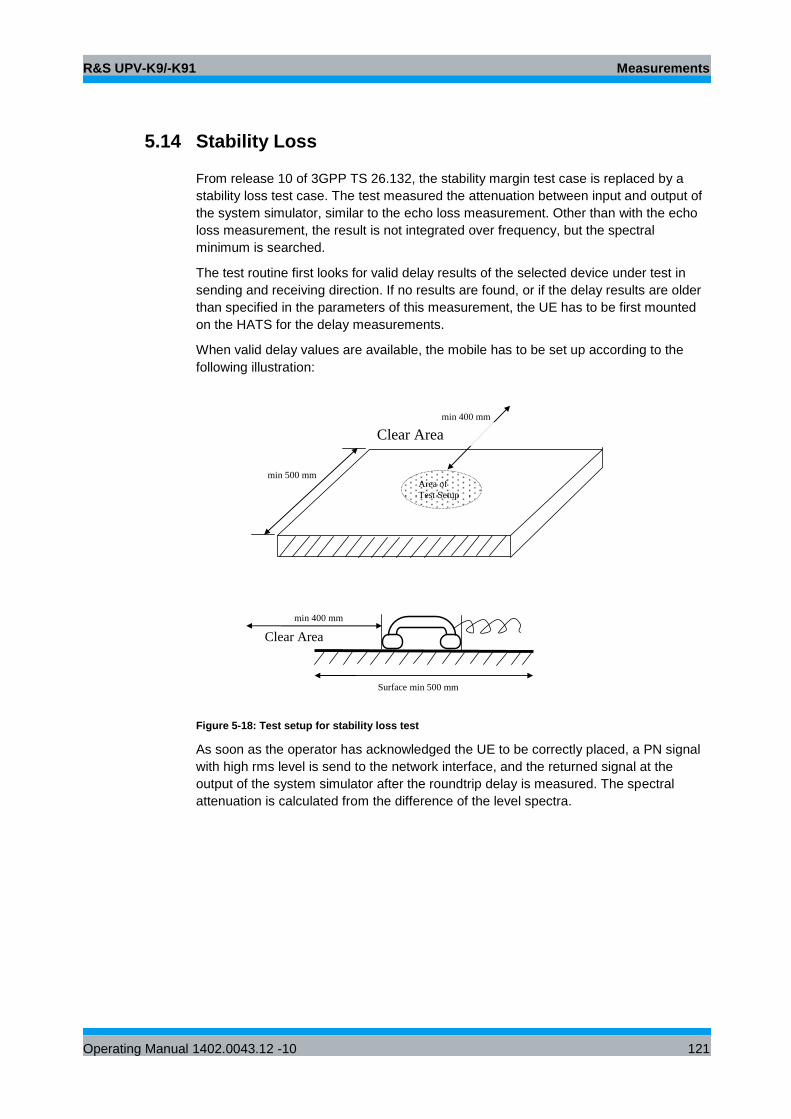
R&S UPV-K9/-K91 Measurements
Operating Manual 1402.0043.12 -10 121
5.14 Stability Loss
From release 10 of 3GPP TS 26.132, the stability margin test case is replaced by a
stability loss test case. The test measured the attenuation between input and output of
the system simulator, similar to the echo loss measurement. Other than with the echo
loss measurement, the result is not integrated over frequency, but the spectral
minimum is searched.
The test routine first looks for valid delay results of the selected device under test in
sending and receiving direction. If no results are found, or if the delay results are older
than specified in the parameters of this measurement, the UE has to be first mounted
on the HATS for the delay measurements.
When valid delay values are available, the mobile has to be set up according to the
following illustration:
Figure 5-18: Test setup for stability loss test
As soon as the operator has acknowledged the UE to be correctly placed, a PN signal
with high rms level is send to the network interface, and the returned signal at the
output of the system simulator after the roundtrip delay is measured. The spectral
attenuation is calculated from the difference of the level spectra.
Area of
Test Setup
min 500 mm
min 400 mm
Clear Area
min 400 mm
Clear Area
Surface min 500 mm
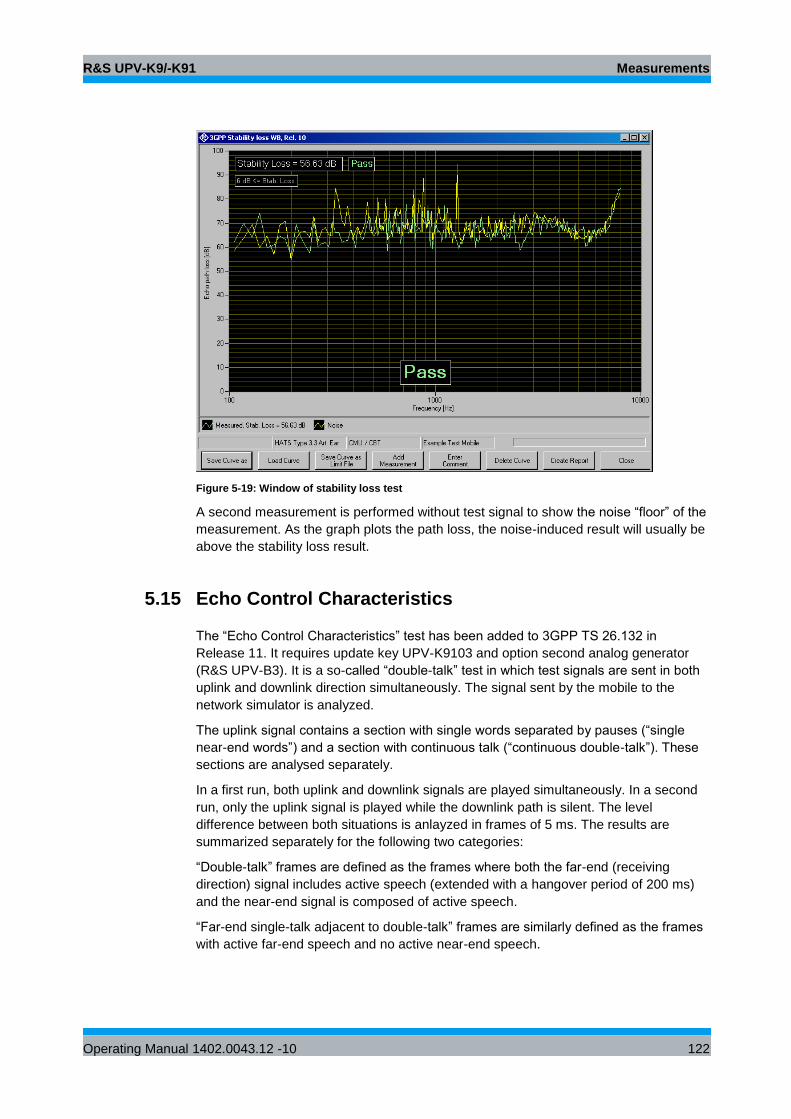
R&S UPV-K9/-K91 Measurements
Operating Manual 1402.0043.12 -10 122
Figure 5-19: Window of stability loss test
A second measurement is performed without test signal to show the noise “floor” of the
measurement. As the graph plots the path loss, the noise-induced result will usually be
above the stability loss result.
5.15 Echo Control Characteristics
The “Echo Control Characteristics” test has been added to 3GPP TS 26.132 in
Release 11. It requires update key UPV-K9103 and option second analog generator
(R&S UPV-B3). It is a so-called “double-talk” test in which test signals are sent in both
uplink and downlink direction simultaneously. The signal sent by the mobile to the
network simulator is analyzed.
The uplink signal contains a section with single words separated by pauses (“single
near-end words”) and a section with continuous talk (“continuous double-talk”). These
sections are analysed separately.
In a first run, both uplink and downlink signals are played simultaneously. In a second
run, only the uplink signal is played while the downlink path is silent. The level
difference between both situations is anlayzed in frames of 5 ms. The results are
summarized separately for the following two categories:
“Double-talk” frames are defined as the frames where both the far-end (receiving
direction) signal includes active speech (extended with a hangover period of 200 ms)
and the near-end signal is composed of active speech.
“Far-end single-talk adjacent to double-talk” frames are similarly defined as the frames
with active far-end speech and no active near-end speech.
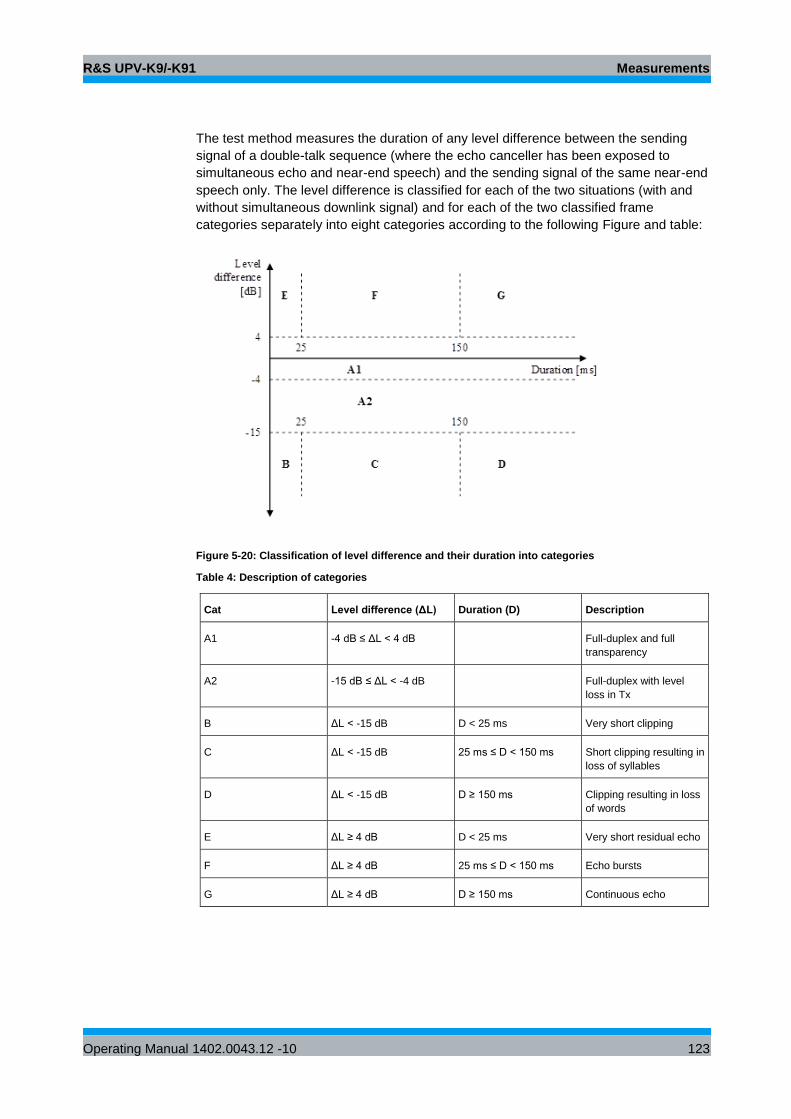
R&S UPV-K9/-K91 Measurements
Operating Manual 1402.0043.12 -10 123
The test method measures the duration of any level difference between the sending
signal of a double-talk sequence (where the echo canceller has been exposed to
simultaneous echo and near-end speech) and the sending signal of the same near-end
speech only. The level difference is classified for each of the two situations (with and
without simultaneous downlink signal) and for each of the two classified frame
categories separately into eight categories according to the following Figure and table:
Figure 5-20: Classification of level difference and their duration into categories
Table 4: Description of categories
Cat Level difference (ΔL) Duration (D) Description
A1 -4 dB ≤ ΔL < 4 dB Full-duplex and full
transparency
A2 -15 dB ≤ ΔL < -4 dB Full-duplex with level
loss in Tx
B ΔL < -15 dB D < 25 ms Very short clipping
C ΔL < -15 dB 25 ms ≤ D < 150 ms Short clipping resulting in
loss of syllables
D ΔL < -15 dB D ≥ 150 ms Clipping resulting in loss
of words
E ΔL ≥ 4 dB D < 25 ms Very short residual echo
F ΔL ≥ 4 dB 25 ms ≤ D < 150 ms Echo bursts
G ΔL ≥ 4 dB D ≥ 150 ms Continuous echo
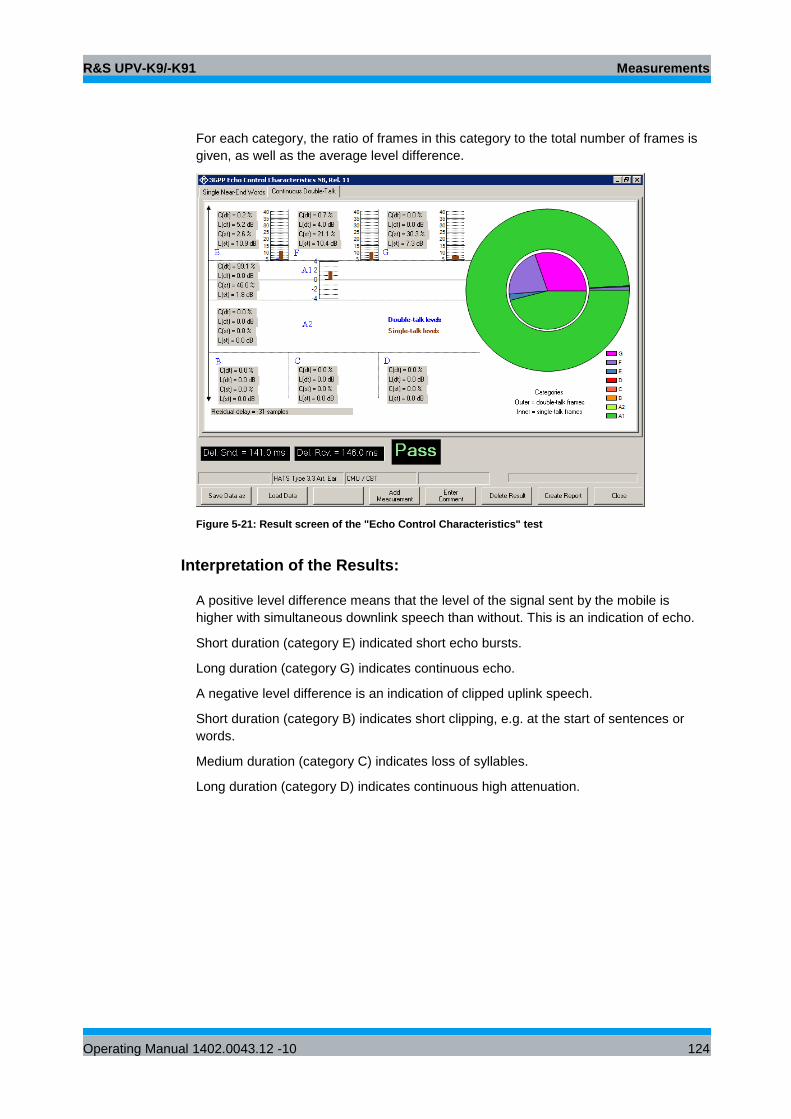
R&S UPV-K9/-K91 Measurements
Operating Manual 1402.0043.12 -10 124
For each category, the ratio of frames in this category to the total number of frames is
given, as well as the average level difference.
Figure 5-21: Result screen of the "Echo Control Characteristics" test
Interpretation of the Results:
A positive level difference means that the level of the signal sent by the mobile is
higher with simultaneous downlink speech than without. This is an indication of echo.
Short duration (category E) indicated short echo bursts.
Long duration (category G) indicates continuous echo.
A negative level difference is an indication of clipped uplink speech.
Short duration (category B) indicates short clipping, e.g. at the start of sentences or
words.
Medium duration (category C) indicates loss of syllables.
Long duration (category D) indicates continuous high attenuation.
R&S UPV-K9/-K91 Measurements
Operating Manual 1402.0043.12 -10 125
5.16 Sending Distortion
The SINAD (signal to noise and distortion) ratio in the transmit path is measured as a
function of the sound level.
A pulsed sinusoidal tone with a pulse length of approx. 360 ms is used for the
measurement. For tests according to up to release 8 (narrowband) and up to release 7
(wideband), the frequency of the tone is 1015 Hz. For measurements according to later
releases the frequency is 1020 Hz (see also Table 12 below). At these frequencies,
coding yields a sufficiently sTable output signal. Voice activity detection continues to
be active in the mobile phone under test due to this pulsating signal.
The mobile phone under test is installed in the LRGP or on the HATS.
The test signal is generated with the artificial mouth at the MRP (mouth reference
point) and the SINAD value of the received signal is measured at the R&S CMU200
decoder output.
The acoustic reference level (ARL) is defined as the sound pressure which creates a
signal level of -10 dBm0 in the transmit channel. An automatic routine varies the sound
pressure at the artificial mouth until the desired level is attained. This value is then
used as a reference for determining the SINAD value versus level.
The SINAD value is measured at sound pressures between -35 dB and +10 dB relative
to the acoustic reference level (ARL) and compared with the limits specified in Table 7
of 26.131 of 3GPP.
Signal processing of a modern mobile phone comprises a voice activity detector, which
determines whether a voice signal is present or whether the sending signal just
comprises background noise. With such mobile phones, the sending distortion test
according to 3GPP TS 26.132 before release 6.0.0 may be failed at low levels because
the 1 kHz sinewave test signal is classified as background noise and suppressed. For
this reason, the sending distortion measurement according to release 6.0.0 and
onwards omits levels below -25 dB and starts at high test tone levels gradually
reducing the level. For this release, use “3GPP Distortion sending, Rel. 6”, for earlier
releases use “3GPP Distortion sending, Rel. 4/5”.
The measurement is performed up to a maximum sound pressure of 10 dBPa at the
artificial mouth if the value 10 dB relative to ARL with 10 dBPa cannot be attained. The
actual trace may therefore end at a lower pressure. This occurs for mobile phones
under test which have a low sensitivity in the transmit direction.
If the measured trace is above the limit line, PASS is output, otherwise FAIL is
displayed.
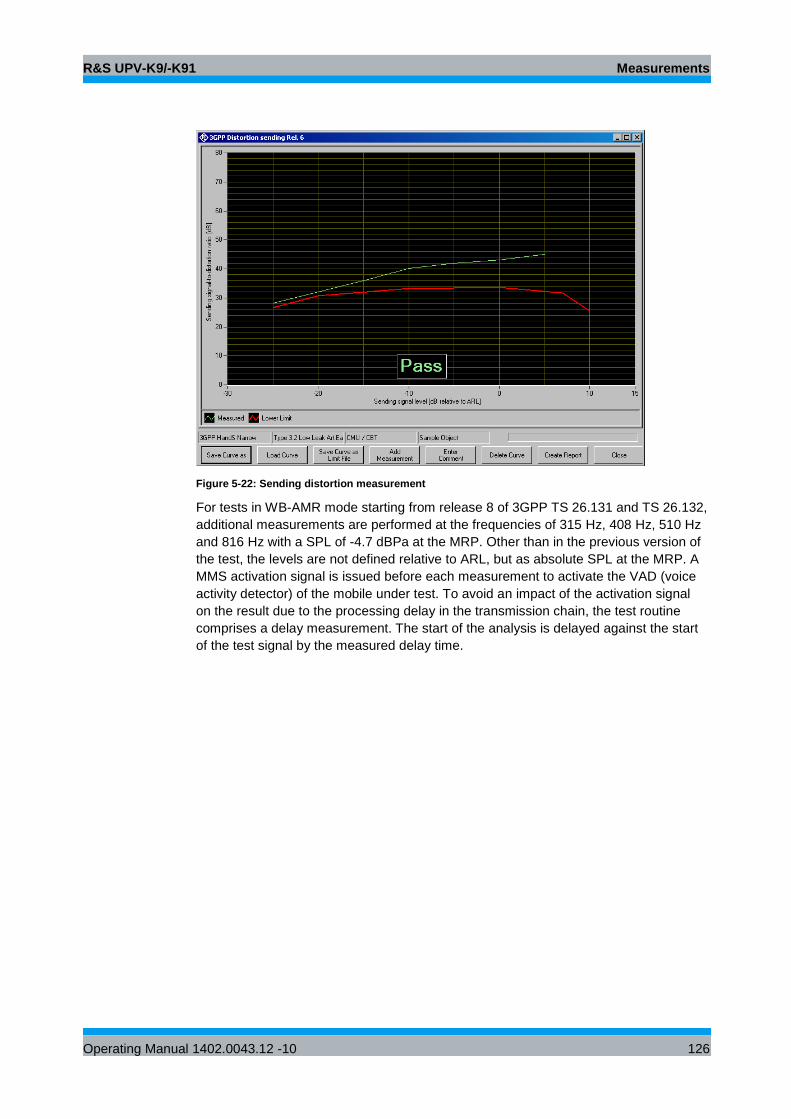
R&S UPV-K9/-K91 Measurements
Operating Manual 1402.0043.12 -10 126
Figure 5-22: Sending distortion measurement
For tests in WB-AMR mode starting from release 8 of 3GPP TS 26.131 and TS 26.132,
additional measurements are performed at the frequencies of 315 Hz, 408 Hz, 510 Hz
and 816 Hz with a SPL of -4.7 dBPa at the MRP. Other than in the previous version of
the test, the levels are not defined relative to ARL, but as absolute SPL at the MRP. A
MMS activation signal is issued before each measurement to activate the VAD (voice
activity detector) of the mobile under test. To avoid an impact of the activation signal
on the result due to the processing delay in the transmission chain, the test routine
comprises a delay measurement. The start of the analysis is delayed against the start
of the test signal by the measured delay time.
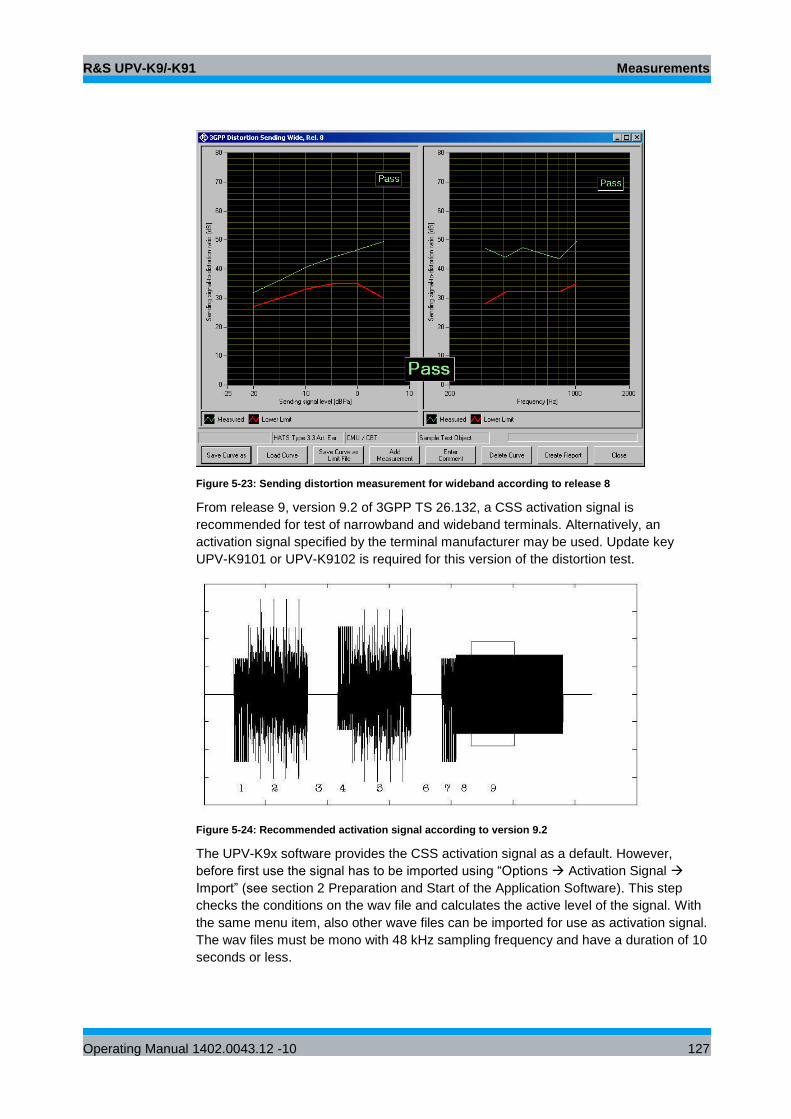
R&S UPV-K9/-K91 Measurements
Operating Manual 1402.0043.12 -10 127
Figure 5-23: Sending distortion measurement for wideband according to release 8
From release 9, version 9.2 of 3GPP TS 26.132, a CSS activation signal is
recommended for test of narrowband and wideband terminals. Alternatively, an
activation signal specified by the terminal manufacturer may be used. Update key
UPV-K9101 or UPV-K9102 is required for this version of the distortion test.
Figure 5-24: Recommended activation signal according to version 9.2
The UPV-K9x software provides the CSS activation signal as a default. However,
before first use the signal has to be imported using “Options Activation Signal
Import” (see section 2 Preparation and Start of the Application Software). This step
checks the conditions on the wav file and calculates the active level of the signal. With
the same menu item, also other wave files can be imported for use as activation signal.
The wav files must be mono with 48 kHz sampling frequency and have a duration of 10
seconds or less.
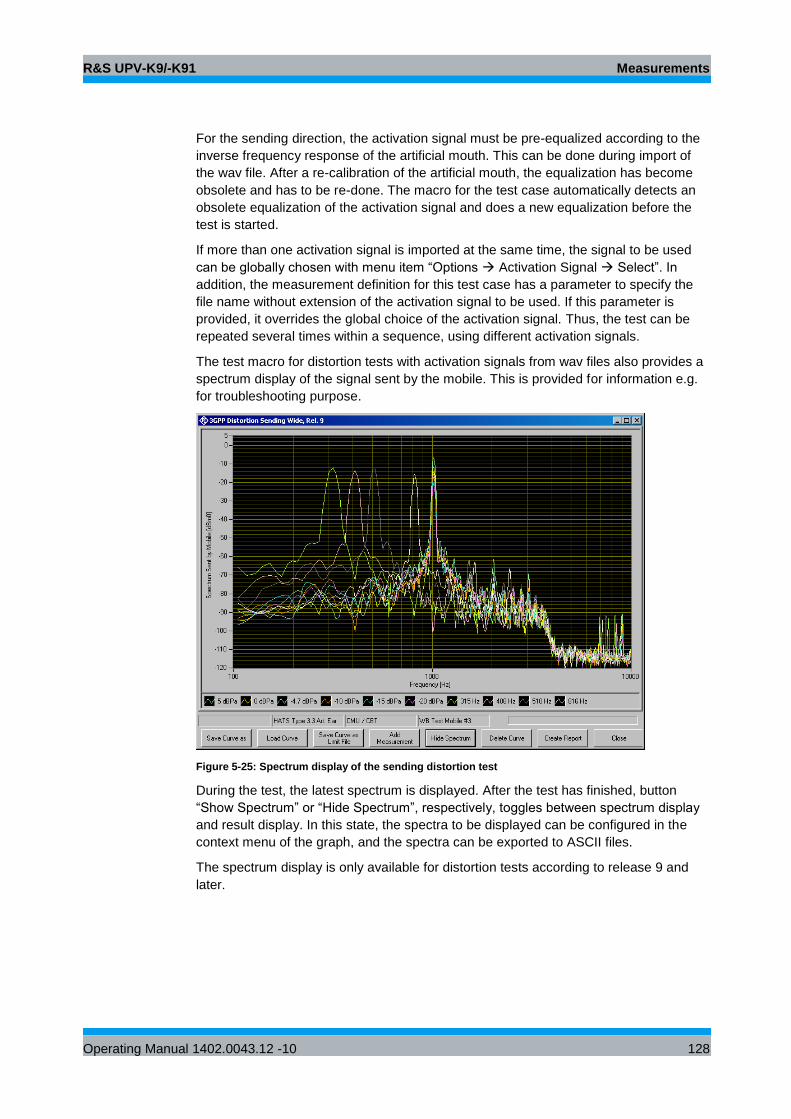
R&S UPV-K9/-K91 Measurements
Operating Manual 1402.0043.12 -10 128
For the sending direction, the activation signal must be pre-equalized according to the
inverse frequency response of the artificial mouth. This can be done during import of
the wav file. After a re-calibration of the artificial mouth, the equalization has become
obsolete and has to be re-done. The macro for the test case automatically detects an
obsolete equalization of the activation signal and does a new equalization before the
test is started.
If more than one activation signal is imported at the same time, the signal to be used
can be globally chosen with menu item “Options Activation Signal Select”. In
addition, the measurement definition for this test case has a parameter to specify the
file name without extension of the activation signal to be used. If this parameter is
provided, it overrides the global choice of the activation signal. Thus, the test can be
repeated several times within a sequence, using different activation signals.
The test macro for distortion tests with activation signals from wav files also provides a
spectrum display of the signal sent by the mobile. This is provided for information e.g.
for troubleshooting purpose.
Figure 5-25: Spectrum display of the sending distortion test
During the test, the latest spectrum is displayed. After the test has finished, button
“Show Spectrum” or “Hide Spectrum”, respectively, toggles between spectrum display
and result display. In this state, the spectra to be displayed can be configured in the
context menu of the graph, and the spectra can be exported to ASCII files.
The spectrum display is only available for distortion tests according to release 9 and
later.
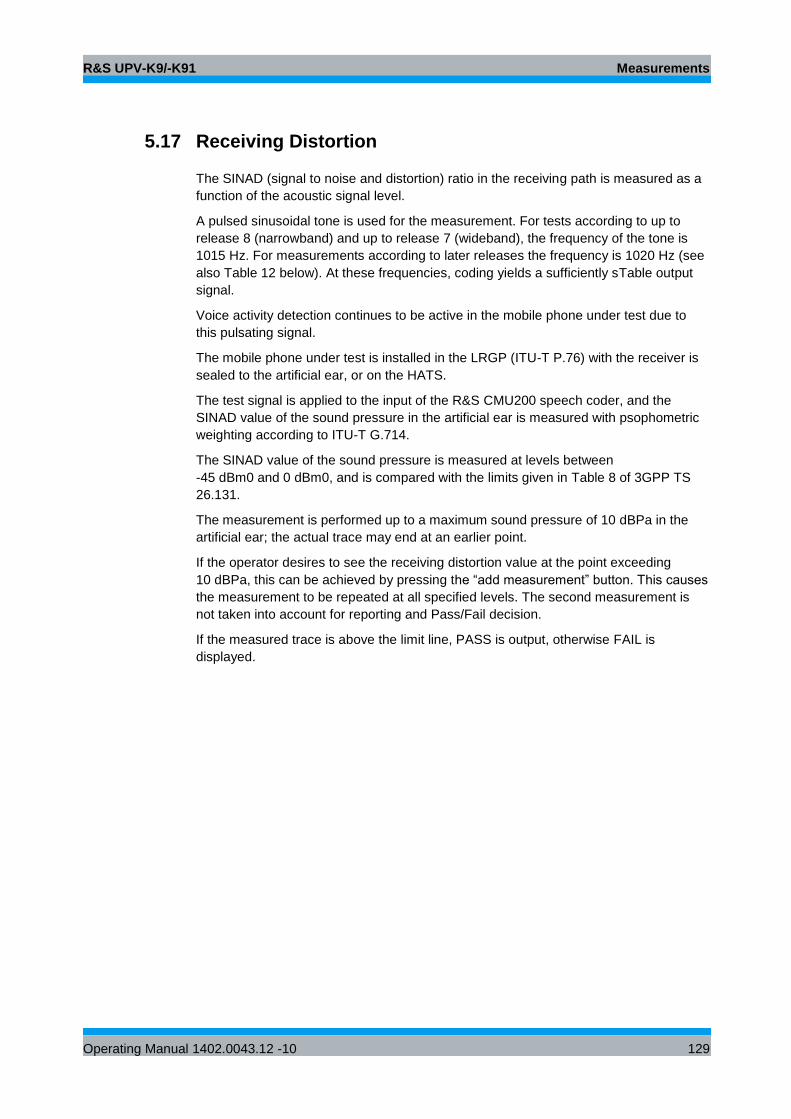
R&S UPV-K9/-K91 Measurements
Operating Manual 1402.0043.12 -10 129
5.17 Receiving Distortion
The SINAD (signal to noise and distortion) ratio in the receiving path is measured as a
function of the acoustic signal level.
A pulsed sinusoidal tone is used for the measurement. For tests according to up to
release 8 (narrowband) and up to release 7 (wideband), the frequency of the tone is
1015 Hz. For measurements according to later releases the frequency is 1020 Hz (see
also Table 12 below). At these frequencies, coding yields a sufficiently sTable output
signal.
Voice activity detection continues to be active in the mobile phone under test due to
this pulsating signal.
The mobile phone under test is installed in the LRGP (ITU-T P.76) with the receiver is
sealed to the artificial ear, or on the HATS.
The test signal is applied to the input of the R&S CMU200 speech coder, and the
SINAD value of the sound pressure in the artificial ear is measured with psophometric
weighting according to ITU-T G.714.
The SINAD value of the sound pressure is measured at levels between
-45 dBm0 and 0 dBm0, and is compared with the limits given in Table 8 of 3GPP TS
26.131.
The measurement is performed up to a maximum sound pressure of 10 dBPa in the
artificial ear; the actual trace may end at an earlier point.
If the operator desires to see the receiving distortion value at the point exceeding
10 dBPa, this can be achieved by pressing the “add measurement” button. This causes
the measurement to be repeated at all specified levels. The second measurement is
not taken into account for reporting and Pass/Fail decision.
If the measured trace is above the limit line, PASS is output, otherwise FAIL is
displayed.

R&S UPV-K9/-K91 Measurements
Operating Manual 1402.0043.12 -10 130
Figure 5-26: Typical result of receiving distortion measurement
For tests in WB-AMR mode starting from release 8 of 3GPP TS 26.131 and TS 26.132,
additional measurements are performed at the frequencies of 315 Hz, 408 Hz, 510 Hz
and 816 Hz with a digital level of -16 dBm0 at the network interface (encoder input). An
activation signal precedes the test signal. To avoid an impact of the activation signal on
the result due to the processing delay in the transmission chain, the test routine
comprises a delay measurement. The start of the analysis is delayed against the start
of the test signal by the measured delay time.
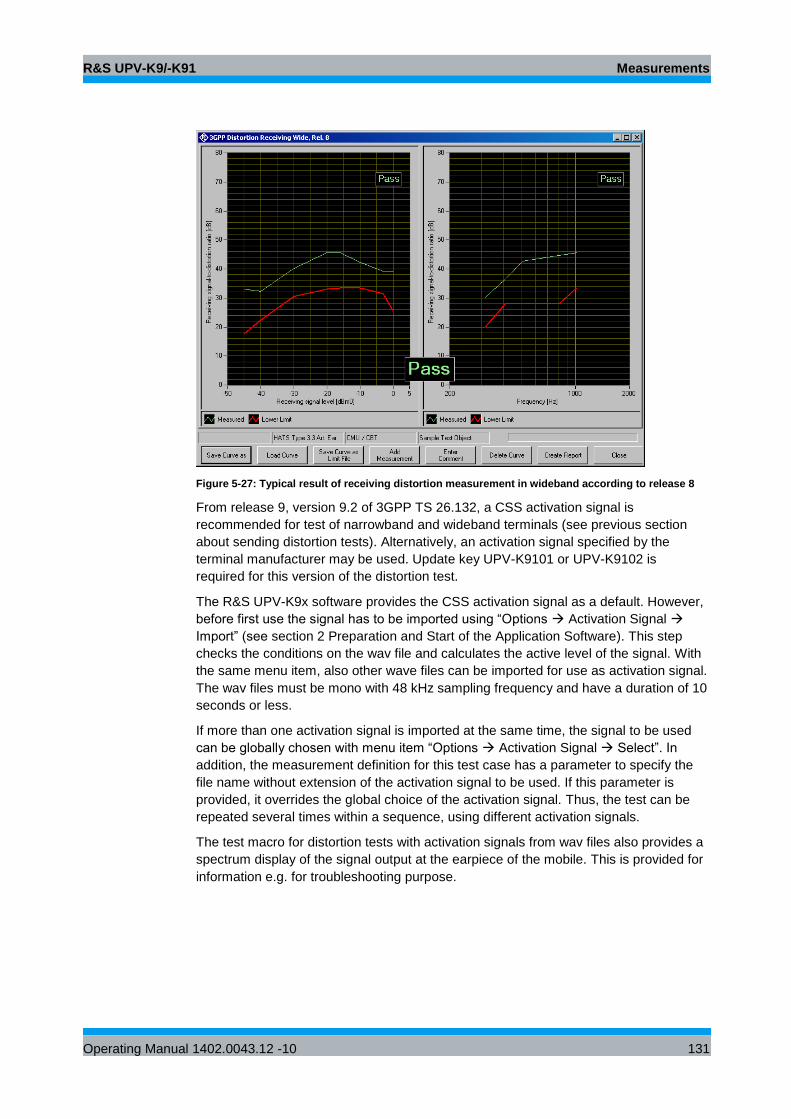
R&S UPV-K9/-K91 Measurements
Operating Manual 1402.0043.12 -10 131
Figure 5-27: Typical result of receiving distortion measurement in wideband according to release 8
From release 9, version 9.2 of 3GPP TS 26.132, a CSS activation signal is
recommended for test of narrowband and wideband terminals (see previous section
about sending distortion tests). Alternatively, an activation signal specified by the
terminal manufacturer may be used. Update key UPV-K9101 or UPV-K9102 is
required for this version of the distortion test.
The R&S UPV-K9x software provides the CSS activation signal as a default. However,
before first use the signal has to be imported using “Options Activation Signal
Import” (see section 2 Preparation and Start of the Application Software). This step
checks the conditions on the wav file and calculates the active level of the signal. With
the same menu item, also other wave files can be imported for use as activation signal.
The wav files must be mono with 48 kHz sampling frequency and have a duration of 10
seconds or less.
If more than one activation signal is imported at the same time, the signal to be used
can be globally chosen with menu item “Options Activation Signal Select”. In
addition, the measurement definition for this test case has a parameter to specify the
file name without extension of the activation signal to be used. If this parameter is
provided, it overrides the global choice of the activation signal. Thus, the test can be
repeated several times within a sequence, using different activation signals.
The test macro for distortion tests with activation signals from wav files also provides a
spectrum display of the signal output at the earpiece of the mobile. This is provided for
information e.g. for troubleshooting purpose.

R&S UPV-K9/-K91 Measurements
Operating Manual 1402.0043.12 -10 132
Figure 5-28: Spectrum display of the receiving distortion test
During the test, the latest spectrum is displayed. After the test has finished, button
“Show Spectrum” or “Hide Spectrum”, respectively, toggles between spectrum display
and result display. In this state, the spectra to be displayed can be configured in the
context menu of the graph, and the spectra can be exported to ASCII files.
The spectrum display is only available for distortion tests according to release 9 and
later.
5.18 Idle Channel Noise Sending
The noise voltage at the speech decoder output is measured with the phone set up in a
quiet environment (< 30 dB(A)).
The mobile phone under test is installed in the LRGP (ITU-T P.76) or on the HATS.
The decoder output voltage is measured, weighted and recalculated for the internal
level in dBm0p.
For the narrow band test, the weighting is done psophometrically according to ITU-T
G.223. For the wideband version of the test, A weighting according to IEC 60651 is
applied.
To keep the mobile phone under test in the normal operating mode, a pulsed signal is
applied. The noise level is measured during the signal pauses. The voice activity
decoder (VAD) is activated and the mobile phone remains in the active normal sending
mode.
The idle noise level should not exceed -64 dBm0p. The measured noise voltage is also
displayed as a spectrum, making it easier to find causes if the limit value is exceeded.

R&S UPV-K9/-K91 Measurements
Operating Manual 1402.0043.12 -10 133
Figure 5-29: Typical result of sending noise measurement
The idle channel noise test employs a sinewave activation signal to activate the
sending path of the mobile. To avoid the activation signal leaking into the
measurement, a delay measurement is performed first. If the signal path is interrupted,
e.g. due to a dropped call, the measurement is aborted with a suiTable message.
From release 10 of 3GPP TS 26.132, idle channel noise measurements also comprise
the determination of a spectral maximum to detect single-frequency disturbances. The
spectral maximum is determined by an 8192 points FFT in a 48 kHz sample rate
system. The test system averages five subsequent measurements, whereby spectral
maxima to be averaged can occur at different frequencies during averaging. This
version of the idle channel noise test requires update key UPV-K9102.
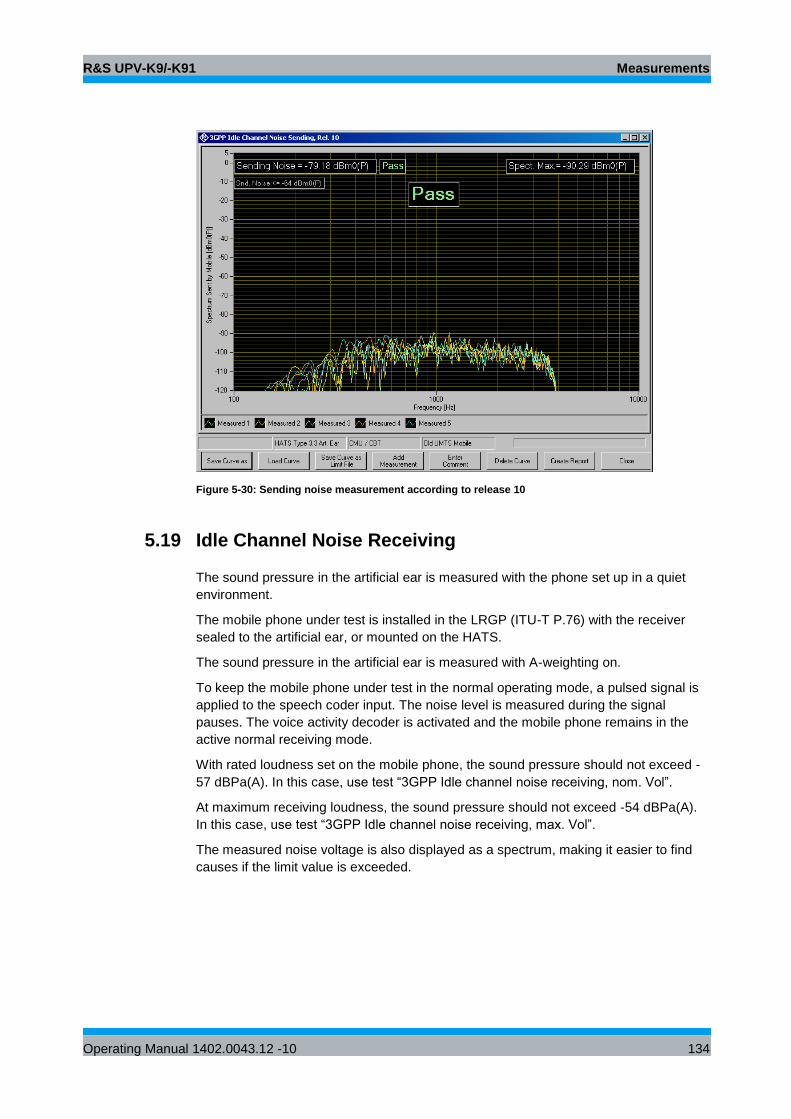
R&S UPV-K9/-K91 Measurements
Operating Manual 1402.0043.12 -10 134
Figure 5-30: Sending noise measurement according to release 10
5.19 Idle Channel Noise Receiving
The sound pressure in the artificial ear is measured with the phone set up in a quiet
environment.
The mobile phone under test is installed in the LRGP (ITU-T P.76) with the receiver
sealed to the artificial ear, or mounted on the HATS.
The sound pressure in the artificial ear is measured with A-weighting on.
To keep the mobile phone under test in the normal operating mode, a pulsed signal is
applied to the speech coder input. The noise level is measured during the signal
pauses. The voice activity decoder is activated and the mobile phone remains in the
active normal receiving mode.
With rated loudness set on the mobile phone, the sound pressure should not exceed -
57 dBPa(A). In this case, use test “3GPP Idle channel noise receiving, nom. Vol”.
At maximum receiving loudness, the sound pressure should not exceed -54 dBPa(A).
In this case, use test “3GPP Idle channel noise receiving, max. Vol”.
The measured noise voltage is also displayed as a spectrum, making it easier to find
causes if the limit value is exceeded.
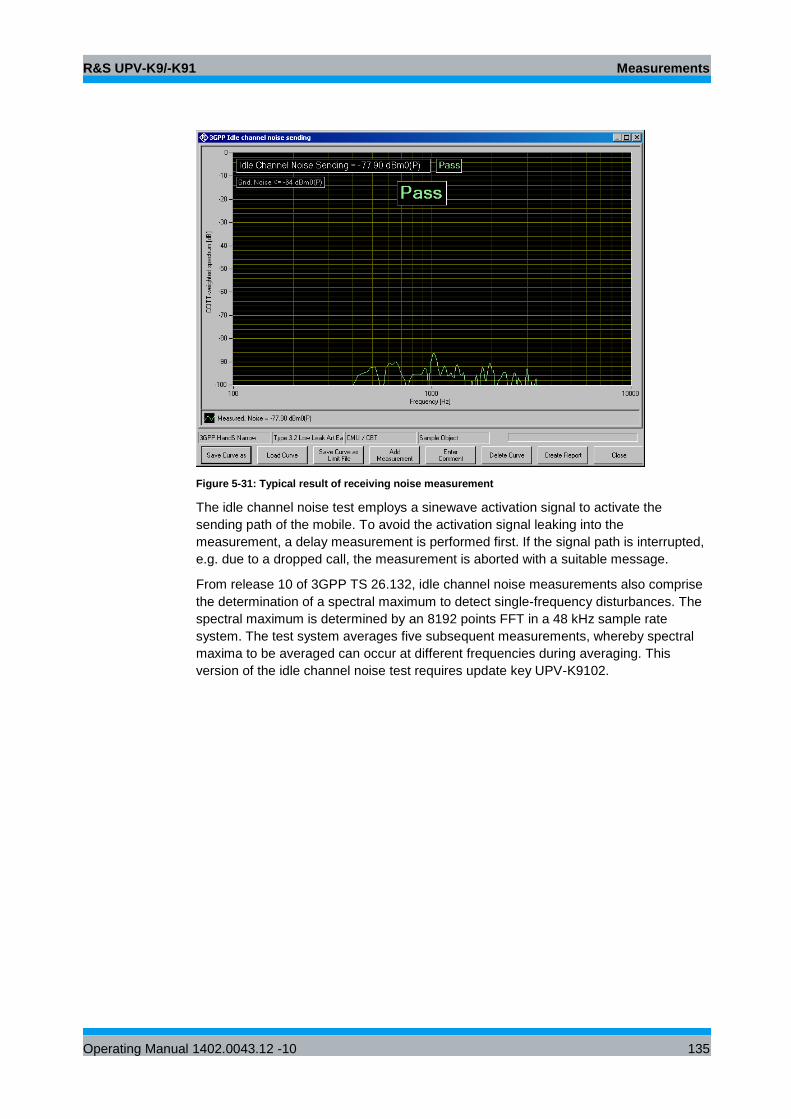
R&S UPV-K9/-K91 Measurements
Operating Manual 1402.0043.12 -10 135
Figure 5-31: Typical result of receiving noise measurement
The idle channel noise test employs a sinewave activation signal to activate the
sending path of the mobile. To avoid the activation signal leaking into the
measurement, a delay measurement is performed first. If the signal path is interrupted,
e.g. due to a dropped call, the measurement is aborted with a suitable message.
From release 10 of 3GPP TS 26.132, idle channel noise measurements also comprise
the determination of a spectral maximum to detect single-frequency disturbances. The
spectral maximum is determined by an 8192 points FFT in a 48 kHz sample rate
system. The test system averages five subsequent measurements, whereby spectral
maxima to be averaged can occur at different frequencies during averaging. This
version of the idle channel noise test requires update key UPV-K9102.
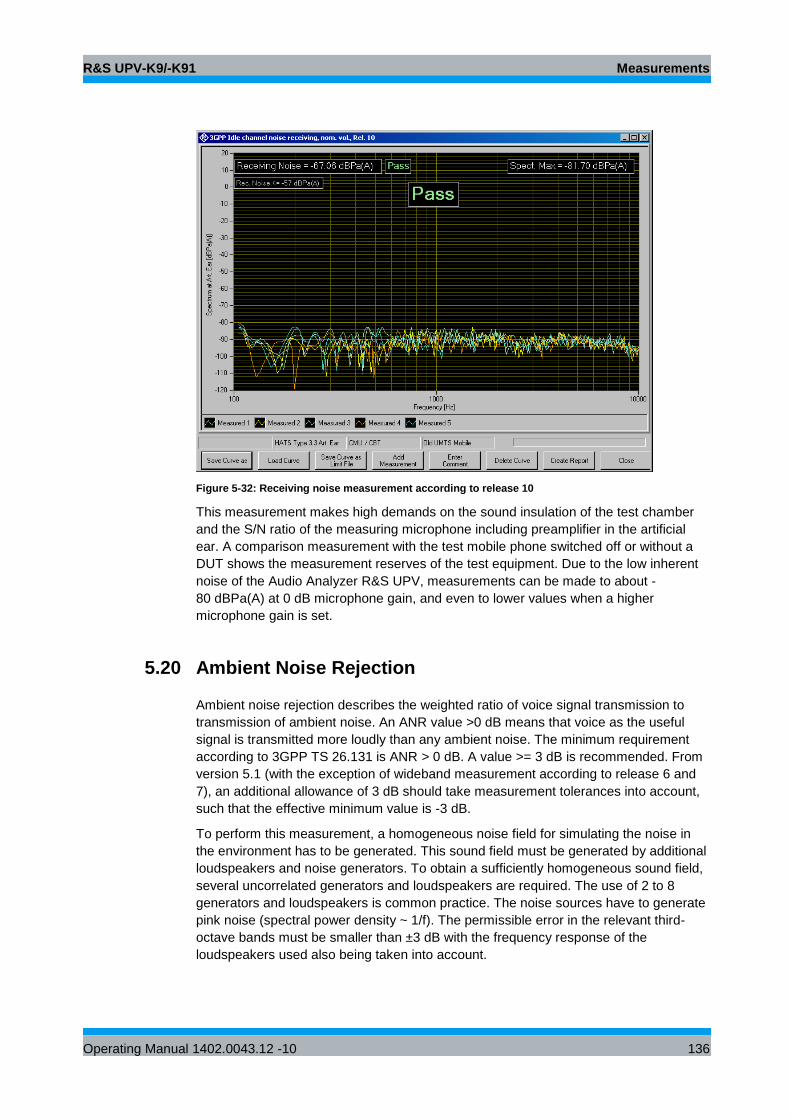
R&S UPV-K9/-K91 Measurements
Operating Manual 1402.0043.12 -10 136
Figure 5-32: Receiving noise measurement according to release 10
This measurement makes high demands on the sound insulation of the test chamber
and the S/N ratio of the measuring microphone including preamplifier in the artificial
ear. A comparison measurement with the test mobile phone switched off or without a
DUT shows the measurement reserves of the test equipment. Due to the low inherent
noise of the Audio Analyzer R&S UPV, measurements can be made to about -
80 dBPa(A) at 0 dB microphone gain, and even to lower values when a higher
microphone gain is set.
5.20 Ambient Noise Rejection
Ambient noise rejection describes the weighted ratio of voice signal transmission to
transmission of ambient noise. An ANR value >0 dB means that voice as the useful
signal is transmitted more loudly than any ambient noise. The minimum requirement
according to 3GPP TS 26.131 is ANR > 0 dB. A value >= 3 dB is recommended. From
version 5.1 (with the exception of wideband measurement according to release 6 and
7), an additional allowance of 3 dB should take measurement tolerances into account,
such that the effective minimum value is -3 dB.
To perform this measurement, a homogeneous noise field for simulating the noise in
the environment has to be generated. This sound field must be generated by additional
loudspeakers and noise generators. To obtain a sufficiently homogeneous sound field,
several uncorrelated generators and loudspeakers are required. The use of 2 to 8
generators and loudspeakers is common practice. The noise sources have to generate
pink noise (spectral power density ~ 1/f). The permissible error in the relevant third-
octave bands must be smaller than ±3 dB with the frequency response of the
loudspeakers used also being taken into account.
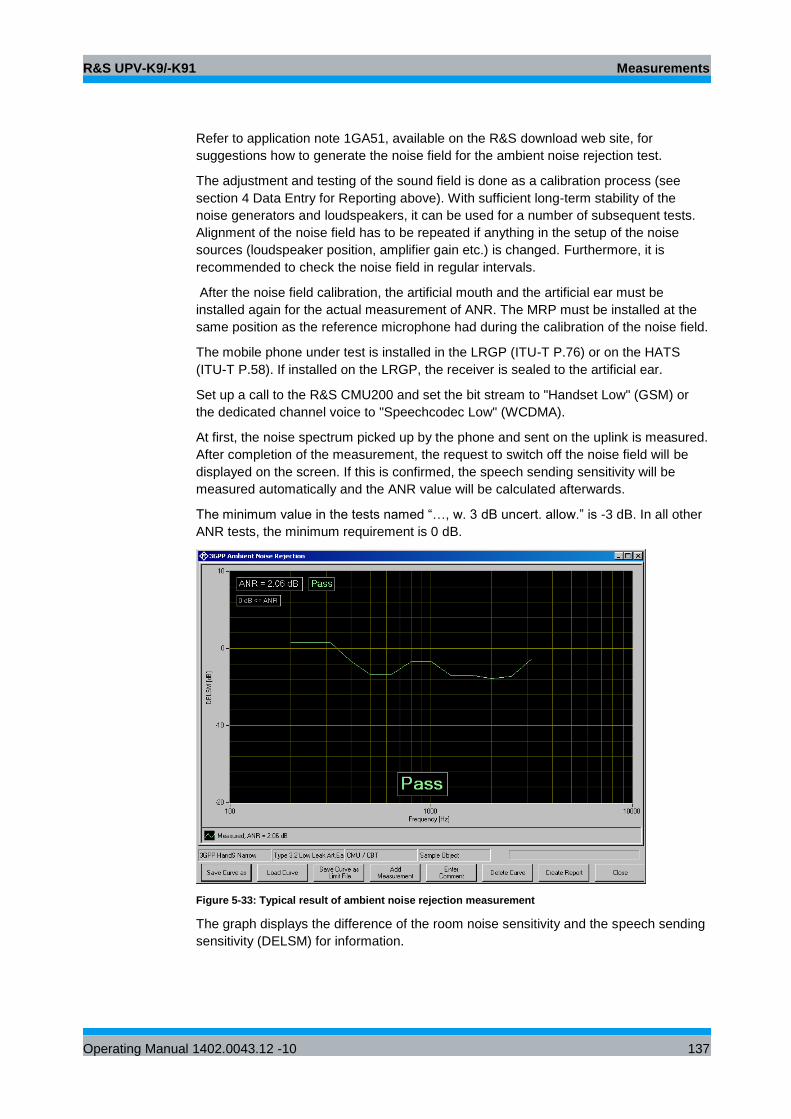
R&S UPV-K9/-K91 Measurements
Operating Manual 1402.0043.12 -10 137
Refer to application note 1GA51, available on the R&S download web site, for
suggestions how to generate the noise field for the ambient noise rejection test.
The adjustment and testing of the sound field is done as a calibration process (see
section 4 Data Entry for Reporting above). With sufficient long-term stability of the
noise generators and loudspeakers, it can be used for a number of subsequent tests.
Alignment of the noise field has to be repeated if anything in the setup of the noise
sources (loudspeaker position, amplifier gain etc.) is changed. Furthermore, it is
recommended to check the noise field in regular intervals.
After the noise field calibration, the artificial mouth and the artificial ear must be
installed again for the actual measurement of ANR. The MRP must be installed at the
same position as the reference microphone had during the calibration of the noise field.
The mobile phone under test is installed in the LRGP (ITU-T P.76) or on the HATS
(ITU-T P.58). If installed on the LRGP, the receiver is sealed to the artificial ear.
Set up a call to the R&S CMU200 and set the bit stream to "Handset Low" (GSM) or
the dedicated channel voice to "Speechcodec Low" (WCDMA).
At first, the noise spectrum picked up by the phone and sent on the uplink is measured.
After completion of the measurement, the request to switch off the noise field will be
displayed on the screen. If this is confirmed, the speech sending sensitivity will be
measured automatically and the ANR value will be calculated afterwards.
The minimum value in the tests named “…, w. 3 dB uncert. allow.” is -3 dB. In all other
ANR tests, the minimum requirement is 0 dB.
Figure 5-33: Typical result of ambient noise rejection measurement
The graph displays the difference of the room noise sensitivity and the speech sending
sensitivity (DELSM) for information.
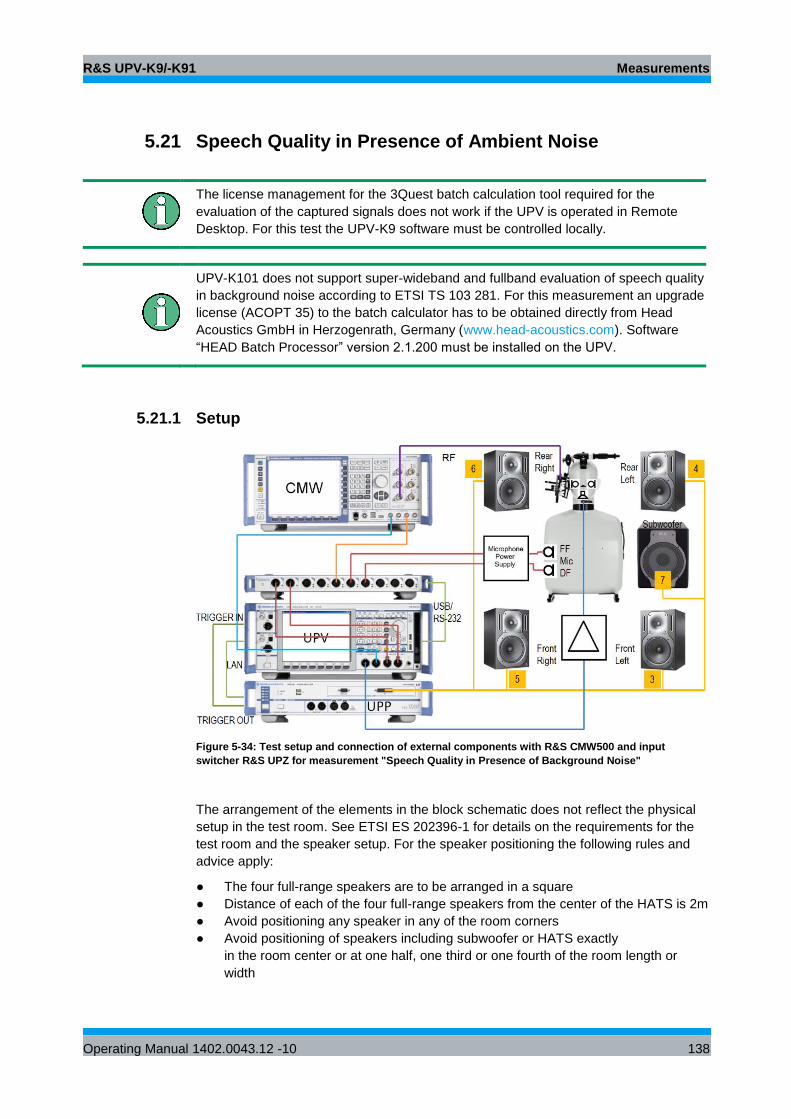
R&S UPV-K9/-K91 Measurements
Operating Manual 1402.0043.12 -10 138
5.21 Speech Quality in Presence of Ambient Noise
The license management for the 3Quest batch calculation tool required for the
evaluation of the captured signals does not work if the UPV is operated in Remote
Desktop. For this test the UPV-K9 software must be controlled locally.
UPV-K101 does not support super-wideband and fullband evaluation of speech quality
in background noise according to ETSI TS 103 281. For this measurement an upgrade
license (ACOPT 35) to the batch calculator has to be obtained directly from Head
Acoustics GmbH in Herzogenrath, Germany (www.head-acoustics.com). Software
“HEAD Batch Processor” version 2.1.200 must be installed on the UPV.
5.21.1 Setup
Figure 5-34: Test setup and connection of external components with R&S CMW500 and input
switcher R&S UPZ for measurement "Speech Quality in Presence of Background Noise"
The arrangement of the elements in the block schematic does not reflect the physical
setup in the test room. See ETSI ES 202396-1 for details on the requirements for the
test room and the speaker setup. For the speaker positioning the following rules and
advice apply:
● The four full-range speakers are to be arranged in a square
● Distance of each of the four full-range speakers from the center of the HATS is 2m
● Avoid positioning any speaker in any of the room corners
● Avoid positioning of speakers including subwoofer or HATS exactly
in the room center or at one half, one third or one fourth of the room length or
width
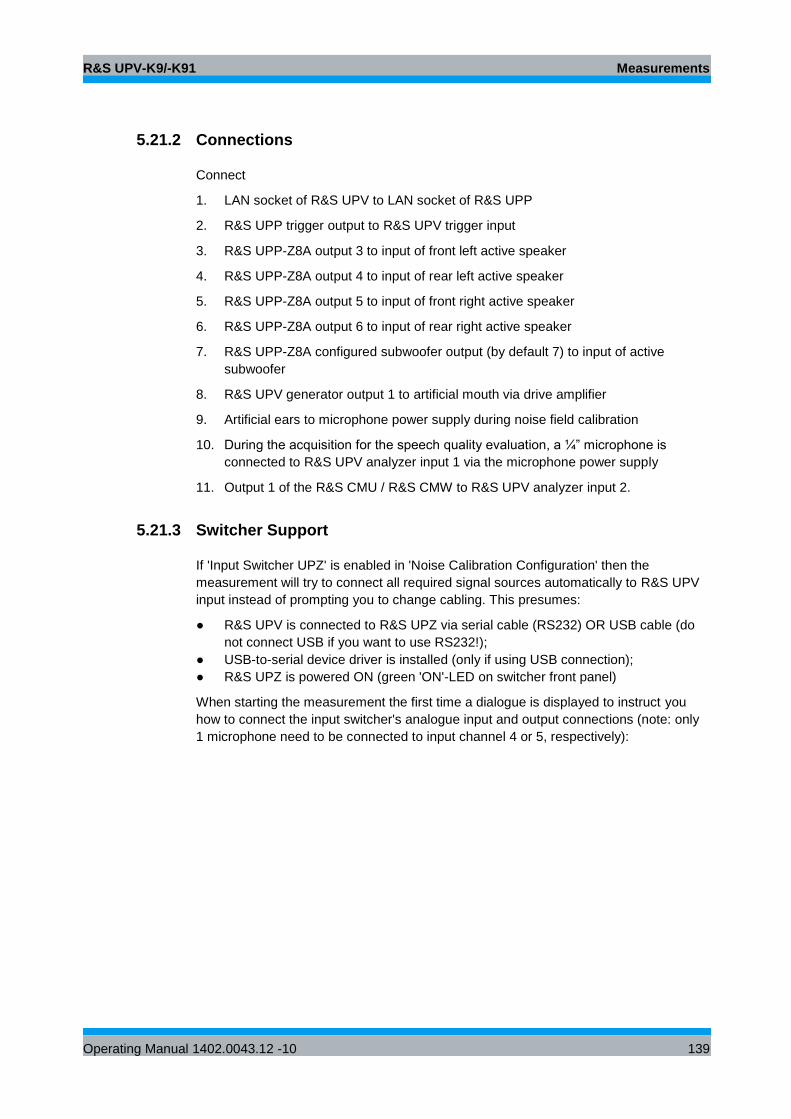
R&S UPV-K9/-K91 Measurements
Operating Manual 1402.0043.12 -10 139
5.21.2 Connections
Connect
1. LAN socket of R&S UPV to LAN socket of R&S UPP
2. R&S UPP trigger output to R&S UPV trigger input
3. R&S UPP-Z8A output 3 to input of front left active speaker
4. R&S UPP-Z8A output 4 to input of rear left active speaker
5. R&S UPP-Z8A output 5 to input of front right active speaker
6. R&S UPP-Z8A output 6 to input of rear right active speaker
7. R&S UPP-Z8A configured subwoofer output (by default 7) to input of active
subwoofer
8. R&S UPV generator output 1 to artificial mouth via drive amplifier
9. Artificial ears to microphone power supply during noise field calibration
10. During the acquisition for the speech quality evaluation, a ¼” microphone is
connected to R&S UPV analyzer input 1 via the microphone power supply
11. Output 1 of the R&S CMU / R&S CMW to R&S UPV analyzer input 2.
5.21.3 Switcher Support
If 'Input Switcher UPZ' is enabled in 'Noise Calibration Configuration' then the
measurement will try to connect all required signal sources automatically to R&S UPV
input instead of prompting you to change cabling. This presumes:
● R&S UPV is connected to R&S UPZ via serial cable (RS232) OR USB cable (do
not connect USB if you want to use RS232!);
● USB-to-serial device driver is installed (only if using USB connection);
● R&S UPZ is powered ON (green 'ON'-LED on switcher front panel)
When starting the measurement the first time a dialogue is displayed to instruct you
how to connect the input switcher's analogue input and output connections (note: only
1 microphone need to be connected to input channel 4 or 5, respectively):
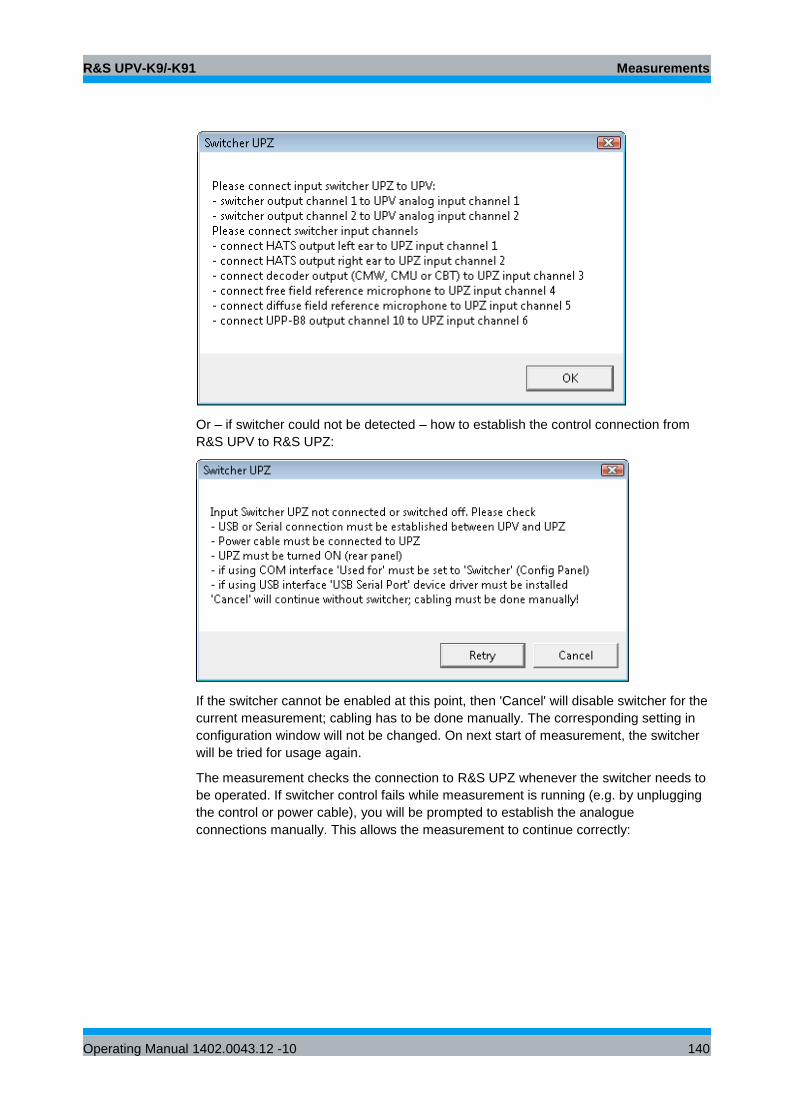
R&S UPV-K9/-K91 Measurements
Operating Manual 1402.0043.12 -10 140
Or – if switcher could not be detected – how to establish the control connection from
R&S UPV to R&S UPZ:
If the switcher cannot be enabled at this point, then 'Cancel' will disable switcher for the
current measurement; cabling has to be done manually. The corresponding setting in
configuration window will not be changed. On next start of measurement, the switcher
will be tried for usage again.
The measurement checks the connection to R&S UPZ whenever the switcher needs to
be operated. If switcher control fails while measurement is running (e.g. by unplugging
the control or power cable), you will be prompted to establish the analogue
connections manually. This allows the measurement to continue correctly:
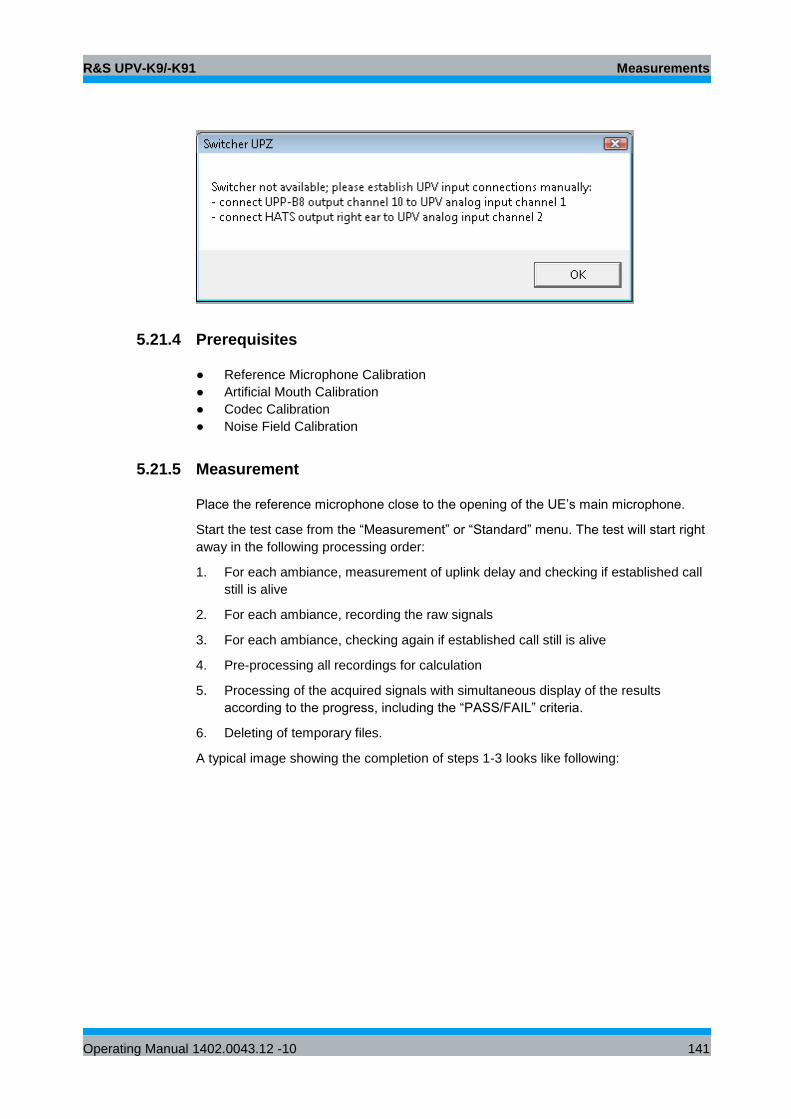
R&S UPV-K9/-K91 Measurements
Operating Manual 1402.0043.12 -10 141
5.21.4 Prerequisites
● Reference Microphone Calibration
● Artificial Mouth Calibration
● Codec Calibration
● Noise Field Calibration
5.21.5 Measurement
Place the reference microphone close to the opening of the UE’s main microphone.
Start the test case from the “Measurement” or “Standard” menu. The test will start right
away in the following processing order:
1. For each ambiance, measurement of uplink delay and checking if established call
still is alive
2. For each ambiance, recording the raw signals
3. For each ambiance, checking again if established call still is alive
4. Pre-processing all recordings for calculation
5. Processing of the acquired signals with simultaneous display of the results
according to the progress, including the “PASS/FAIL” criteria.
6. Deleting of temporary files.
A typical image showing the completion of steps 1-3 looks like following:
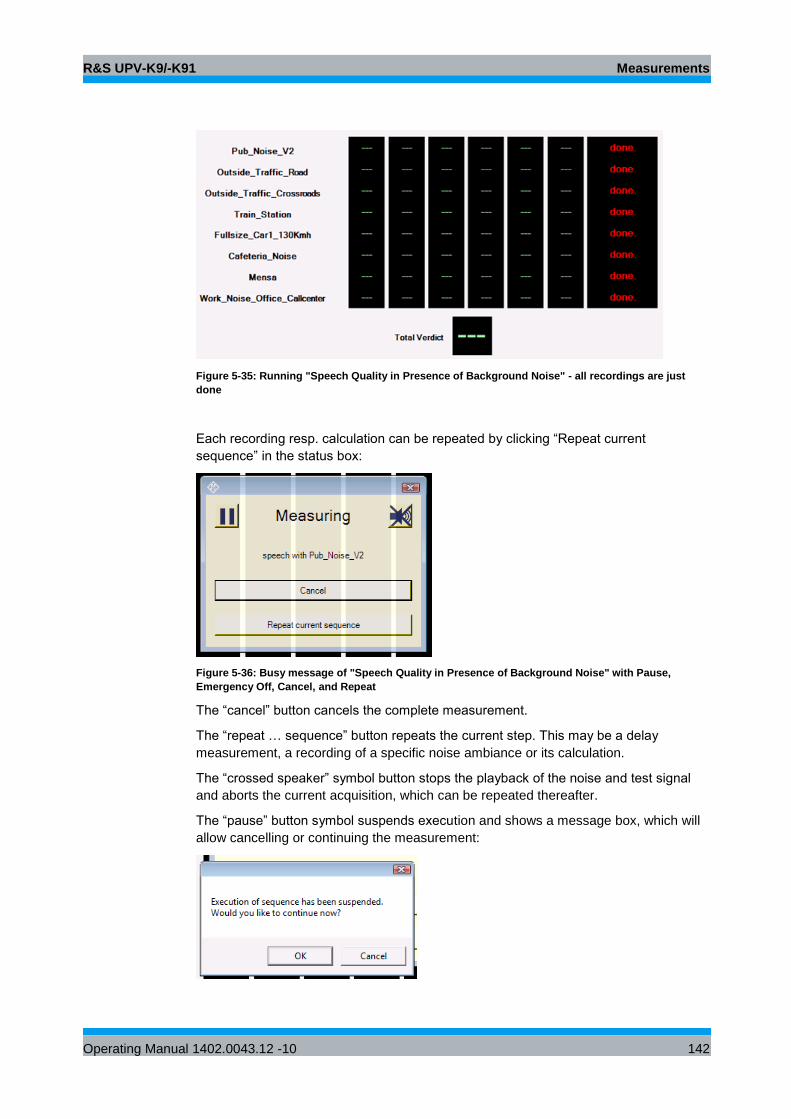
R&S UPV-K9/-K91 Measurements
Operating Manual 1402.0043.12 -10 142
Figure 5-35: Running "Speech Quality in Presence of Background Noise" - all recordings are just
done
Each recording resp. calculation can be repeated by clicking “Repeat current
sequence” in the status box:
Figure 5-36: Busy message of "Speech Quality in Presence of Background Noise" with Pause,
Emergency Off, Cancel, and Repeat
The “cancel” button cancels the complete measurement.
The “repeat … sequence” button repeats the current step. This may be a delay
measurement, a recording of a specific noise ambiance or its calculation.
The “crossed speaker” symbol button stops the playback of the noise and test signal
and aborts the current acquisition, which can be repeated thereafter.
The “pause” button symbol suspends execution and shows a message box, which will
allow cancelling or continuing the measurement:
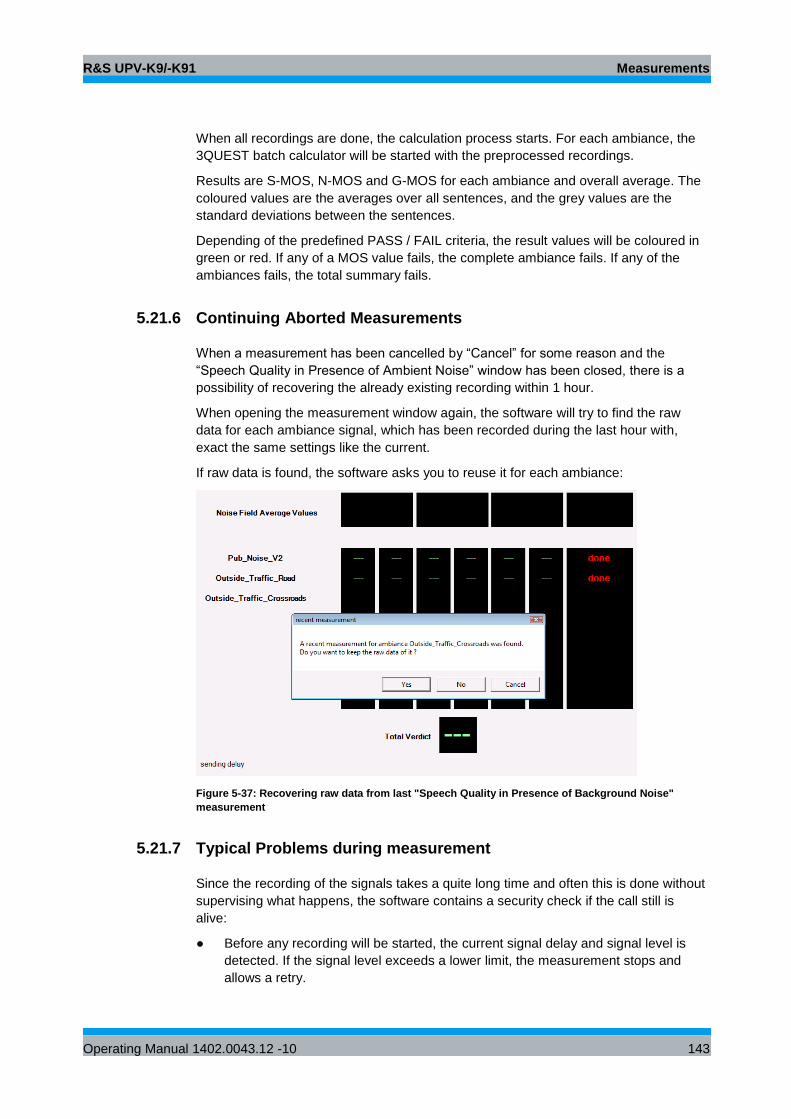
R&S UPV-K9/-K91 Measurements
Operating Manual 1402.0043.12 -10 143
When all recordings are done, the calculation process starts. For each ambiance, the
3QUEST batch calculator will be started with the preprocessed recordings.
Results are S-MOS, N-MOS and G-MOS for each ambiance and overall average. The
coloured values are the averages over all sentences, and the grey values are the
standard deviations between the sentences.
Depending of the predefined PASS / FAIL criteria, the result values will be coloured in
green or red. If any of a MOS value fails, the complete ambiance fails. If any of the
ambiances fails, the total summary fails.
5.21.6 Continuing Aborted Measurements
When a measurement has been cancelled by “Cancel” for some reason and the
“Speech Quality in Presence of Ambient Noise” window has been closed, there is a
possibility of recovering the already existing recording within 1 hour.
When opening the measurement window again, the software will try to find the raw
data for each ambiance signal, which has been recorded during the last hour with,
exact the same settings like the current.
If raw data is found, the software asks you to reuse it for each ambiance:
Figure 5-37: Recovering raw data from last "Speech Quality in Presence of Background Noise"
measurement
5.21.7 Typical Problems during measurement
Since the recording of the signals takes a quite long time and often this is done without
supervising what happens, the software contains a security check if the call still is
alive:
● Before any recording will be started, the current signal delay and signal level is
detected. If the signal level exceeds a lower limit, the measurement stops and
allows a retry.
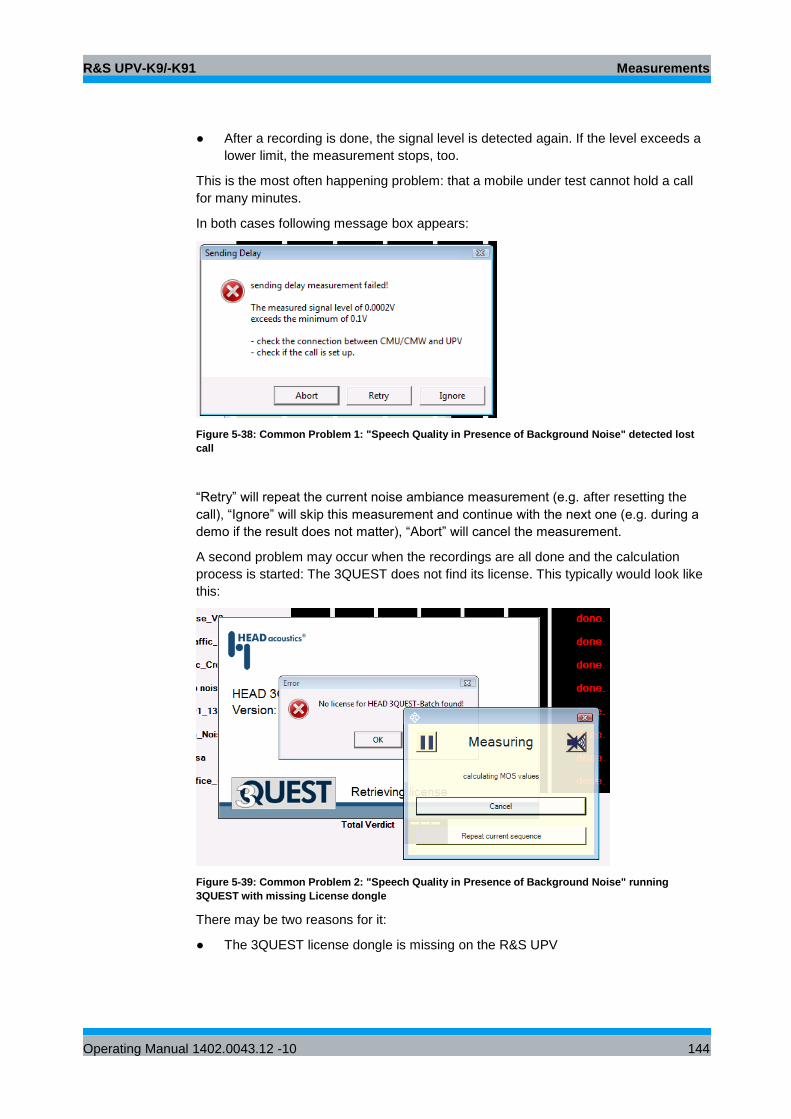
R&S UPV-K9/-K91 Measurements
Operating Manual 1402.0043.12 -10 144
● After a recording is done, the signal level is detected again. If the level exceeds a
lower limit, the measurement stops, too.
This is the most often happening problem: that a mobile under test cannot hold a call
for many minutes.
In both cases following message box appears:
Figure 5-38: Common Problem 1: "Speech Quality in Presence of Background Noise" detected lost
call
“Retry” will repeat the current noise ambiance measurement (e.g. after resetting the
call), “Ignore” will skip this measurement and continue with the next one (e.g. during a
demo if the result does not matter), “Abort” will cancel the measurement.
A second problem may occur when the recordings are all done and the calculation
process is started: The 3QUEST does not find its license. This typically would look like
this:
Figure 5-39: Common Problem 2: "Speech Quality in Presence of Background Noise" running
3QUEST with missing License dongle
There may be two reasons for it:
● The 3QUEST license dongle is missing on the R&S UPV
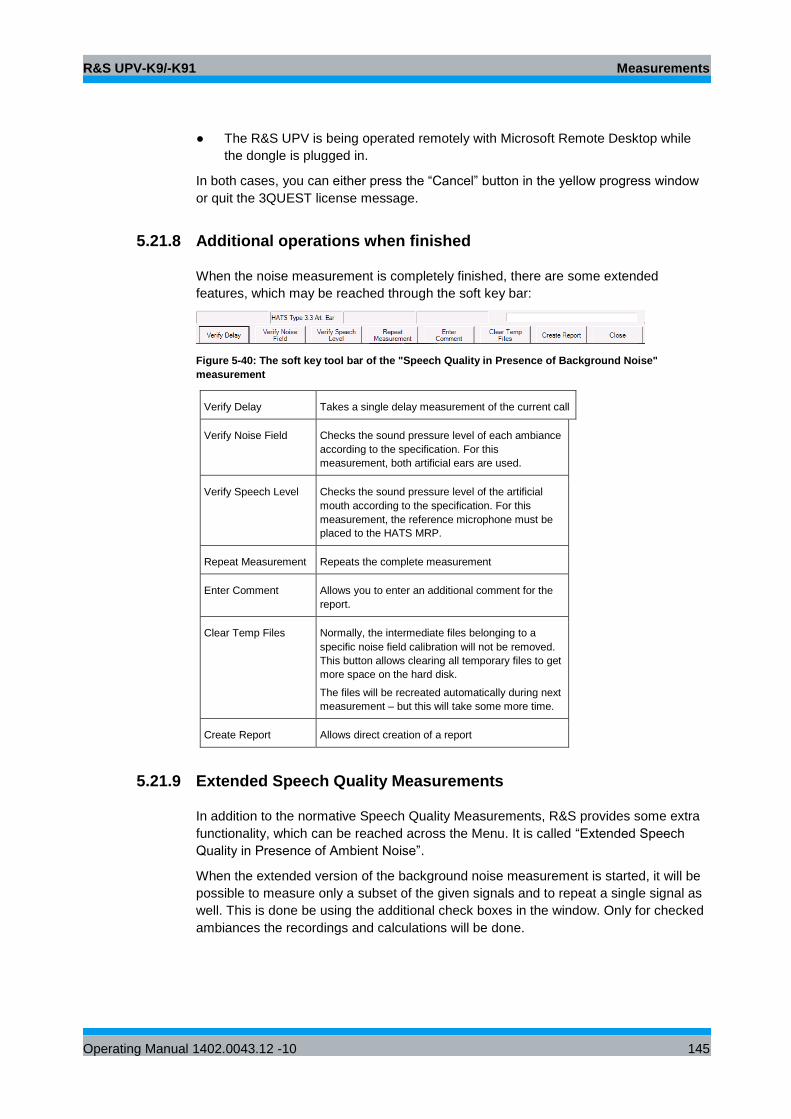
R&S UPV-K9/-K91 Measurements
Operating Manual 1402.0043.12 -10 145
● The R&S UPV is being operated remotely with Microsoft Remote Desktop while
the dongle is plugged in.
In both cases, you can either press the “Cancel” button in the yellow progress window
or quit the 3QUEST license message.
5.21.8 Additional operations when finished
When the noise measurement is completely finished, there are some extended
features, which may be reached through the soft key bar:
Figure 5-40: The soft key tool bar of the "Speech Quality in Presence of Background Noise"
measurement
Verify Delay Takes a single delay measurement of the current call
Verify Noise Field Checks the sound pressure level of each ambiance
according to the specification. For this
measurement, both artificial ears are used.
Verify Speech Level Checks the sound pressure level of the artificial
mouth according to the specification. For this
measurement, the reference microphone must be
placed to the HATS MRP.
Repeat Measurement Repeats the complete measurement
Enter Comment Allows you to enter an additional comment for the
report.
Clear Temp Files Normally, the intermediate files belonging to a
specific noise field calibration will not be removed.
This button allows clearing all temporary files to get
more space on the hard disk.
The files will be recreated automatically during next
measurement – but this will take some more time.
Create Report Allows direct creation of a report
5.21.9 Extended Speech Quality Measurements
In addition to the normative Speech Quality Measurements, R&S provides some extra
functionality, which can be reached across the Menu. It is called “Extended Speech
Quality in Presence of Ambient Noise”.
When the extended version of the background noise measurement is started, it will be
possible to measure only a subset of the given signals and to repeat a single signal as
well. This is done be using the additional check boxes in the window. Only for checked
ambiances the recordings and calculations will be done.
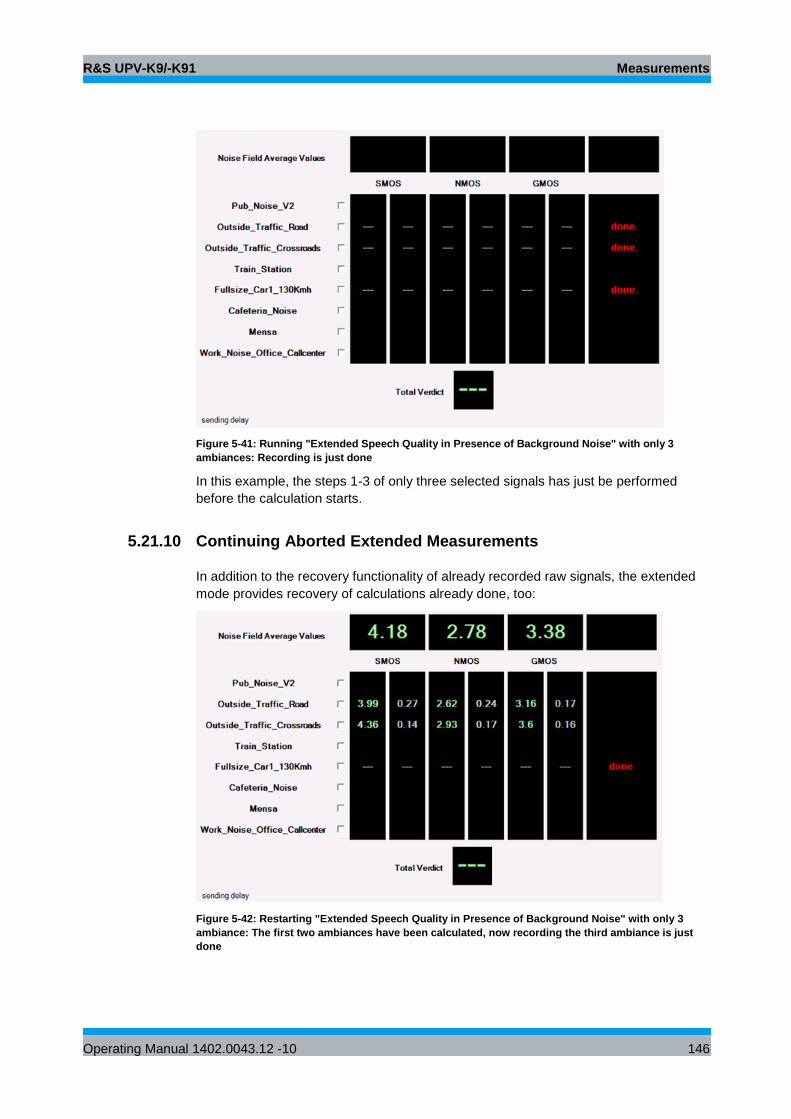
R&S UPV-K9/-K91 Measurements
Operating Manual 1402.0043.12 -10 146
Figure 5-41: Running "Extended Speech Quality in Presence of Background Noise" with only 3
ambiances: Recording is just done
In this example, the steps 1-3 of only three selected signals has just be performed
before the calculation starts.
5.21.10 Continuing Aborted Extended Measurements
In addition to the recovery functionality of already recorded raw signals, the extended
mode provides recovery of calculations already done, too:
Figure 5-42: Restarting "Extended Speech Quality in Presence of Background Noise" with only 3
ambiance: The first two ambiances have been calculated, now recording the third ambiance is just
done
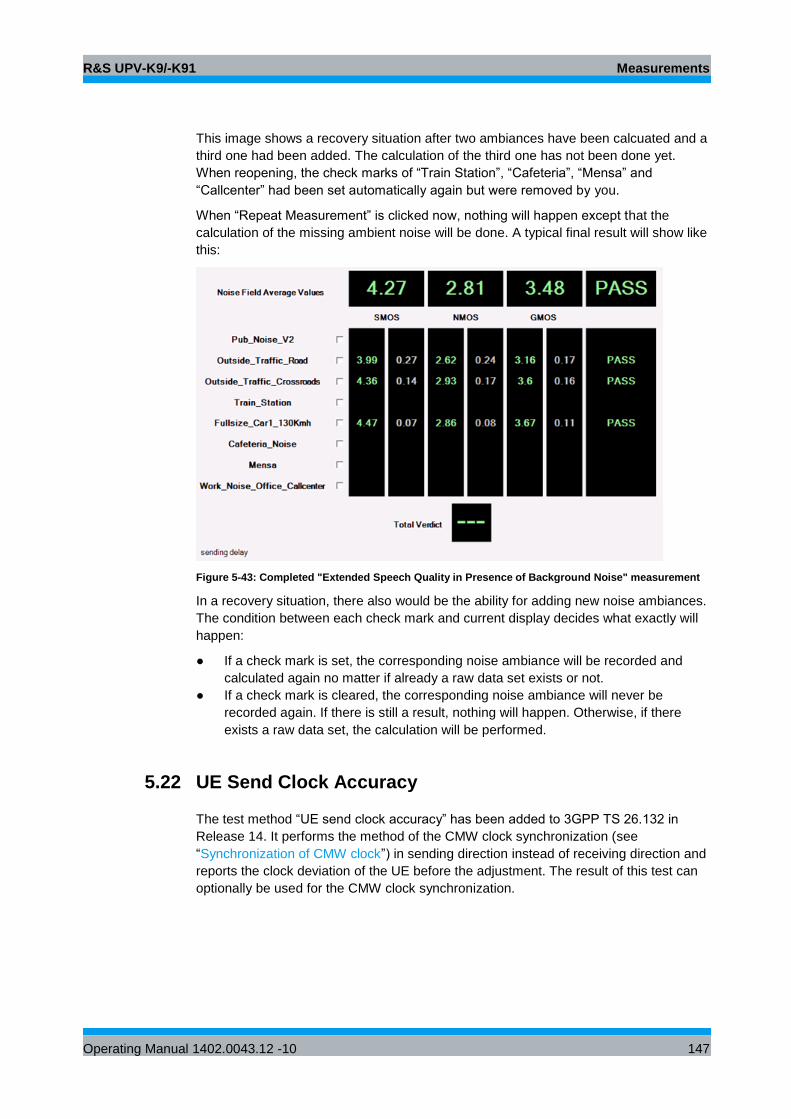
R&S UPV-K9/-K91 Measurements
Operating Manual 1402.0043.12 -10 147
This image shows a recovery situation after two ambiances have been calcuated and a
third one had been added. The calculation of the third one has not been done yet.
When reopening, the check marks of “Train Station”, “Cafeteria”, “Mensa” and
“Callcenter” had been set automatically again but were removed by you.
When “Repeat Measurement” is clicked now, nothing will happen except that the
calculation of the missing ambient noise will be done. A typical final result will show like
this:
Figure 5-43: Completed "Extended Speech Quality in Presence of Background Noise" measurement
In a recovery situation, there also would be the ability for adding new noise ambiances.
The condition between each check mark and current display decides what exactly will
happen:
● If a check mark is set, the corresponding noise ambiance will be recorded and
calculated again no matter if already a raw data set exists or not.
● If a check mark is cleared, the corresponding noise ambiance will never be
recorded again. If there is still a result, nothing will happen. Otherwise, if there
exists a raw data set, the calculation will be performed.
5.22 UE Send Clock Accuracy
The test method “UE send clock accuracy” has been added to 3GPP TS 26.132 in
Release 14. It performs the method of the CMW clock synchronization (see
“Synchronization of CMW clock”) in sending direction instead of receiving direction and
reports the clock deviation of the UE before the adjustment. The result of this test can
optionally be used for the CMW clock synchronization.
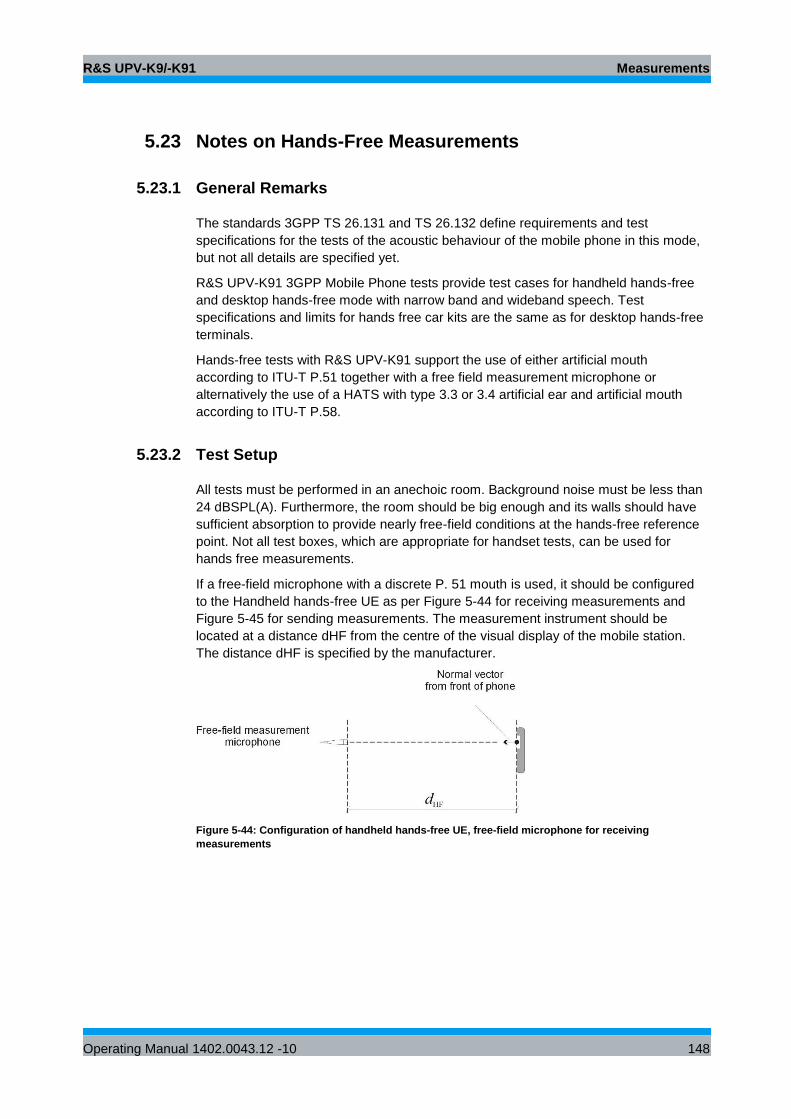
R&S UPV-K9/-K91 Measurements
Operating Manual 1402.0043.12 -10 148
5.23 Notes on Hands-Free Measurements
5.23.1 General Remarks
The standards 3GPP TS 26.131 and TS 26.132 define requirements and test
specifications for the tests of the acoustic behaviour of the mobile phone in this mode,
but not all details are specified yet.
R&S UPV-K91 3GPP Mobile Phone tests provide test cases for handheld hands-free
and desktop hands-free mode with narrow band and wideband speech. Test
specifications and limits for hands free car kits are the same as for desktop hands-free
terminals.
Hands-free tests with R&S UPV-K91 support the use of either artificial mouth
according to ITU-T P.51 together with a free field measurement microphone or
alternatively the use of a HATS with type 3.3 or 3.4 artificial ear and artificial mouth
according to ITU-T P.58.
5.23.2 Test Setup
All tests must be performed in an anechoic room. Background noise must be less than
24 dBSPL(A). Furthermore, the room should be big enough and its walls should have
sufficient absorption to provide nearly free-field conditions at the hands-free reference
point. Not all test boxes, which are appropriate for handset tests, can be used for
hands free measurements.
If a free-field microphone with a discrete P. 51 mouth is used, it should be configured
to the Handheld hands-free UE as per Figure 5-44 for receiving measurements and
Figure 5-45 for sending measurements. The measurement instrument should be
located at a distance dHF from the centre of the visual display of the mobile station.
The distance dHF is specified by the manufacturer.
Figure 5-44: Configuration of handheld hands-free UE, free-field microphone for receiving
measurements
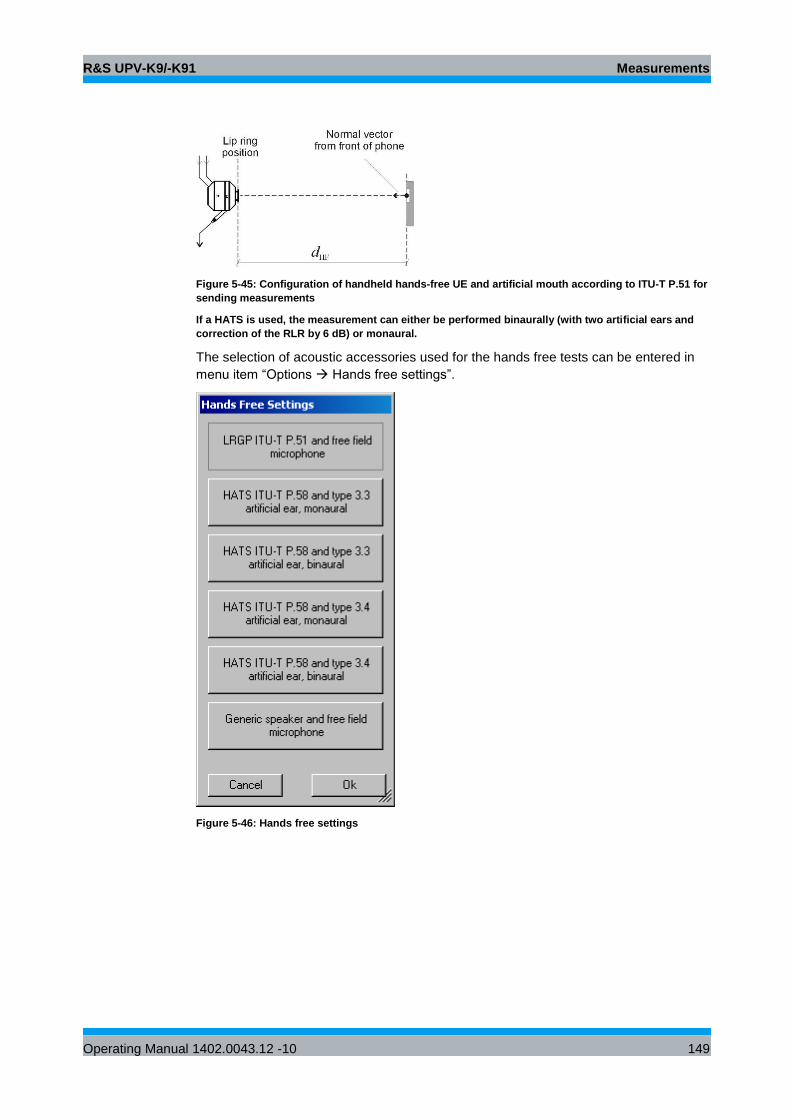
R&S UPV-K9/-K91 Measurements
Operating Manual 1402.0043.12 -10 149
Figure 5-45: Configuration of handheld hands-free UE and artificial mouth according to ITU-T P.51 for
sending measurements
If a HATS is used, the measurement can either be performed binaurally (with two artificial ears and
correction of the RLR by 6 dB) or monaural.
The selection of acoustic accessories used for the hands free tests can be entered in
menu item “Options Hands free settings”.
Figure 5-46: Hands free settings
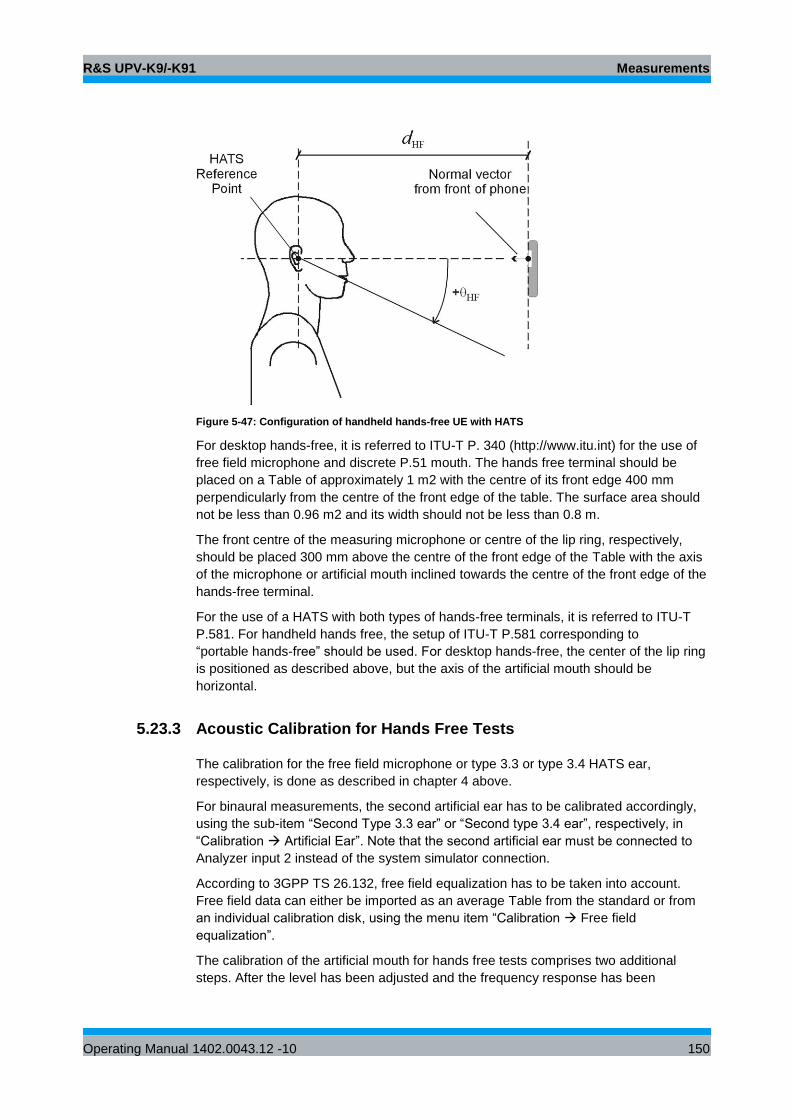
R&S UPV-K9/-K91 Measurements
Operating Manual 1402.0043.12 -10 150
Figure 5-47: Configuration of handheld hands-free UE with HATS
For desktop hands-free, it is referred to ITU-T P. 340 (http://www.itu.int) for the use of
free field microphone and discrete P.51 mouth. The hands free terminal should be
placed on a Table of approximately 1 m2 with the centre of its front edge 400 mm
perpendicularly from the centre of the front edge of the table. The surface area should
not be less than 0.96 m2 and its width should not be less than 0.8 m.
The front centre of the measuring microphone or centre of the lip ring, respectively,
should be placed 300 mm above the centre of the front edge of the Table with the axis
of the microphone or artificial mouth inclined towards the centre of the front edge of the
hands-free terminal.
For the use of a HATS with both types of hands-free terminals, it is referred to ITU-T
P.581. For handheld hands free, the setup of ITU-T P.581 corresponding to
“portable hands-free” should be used. For desktop hands-free, the center of the lip ring
is positioned as described above, but the axis of the artificial mouth should be
horizontal.
5.23.3 Acoustic Calibration for Hands Free Tests
The calibration for the free field microphone or type 3.3 or type 3.4 HATS ear,
respectively, is done as described in chapter 4 above.
For binaural measurements, the second artificial ear has to be calibrated accordingly,
using the sub-item “Second Type 3.3 ear” or “Second type 3.4 ear”, respectively, in
“Calibration Artificial Ear”. Note that the second artificial ear must be connected to
Analyzer input 2 instead of the system simulator connection.
According to 3GPP TS 26.132, free field equalization has to be taken into account.
Free field data can either be imported as an average Table from the standard or from
an individual calibration disk, using the menu item “Calibration Free field
equalization”.
The calibration of the artificial mouth for hands free tests comprises two additional
steps. After the level has been adjusted and the frequency response has been
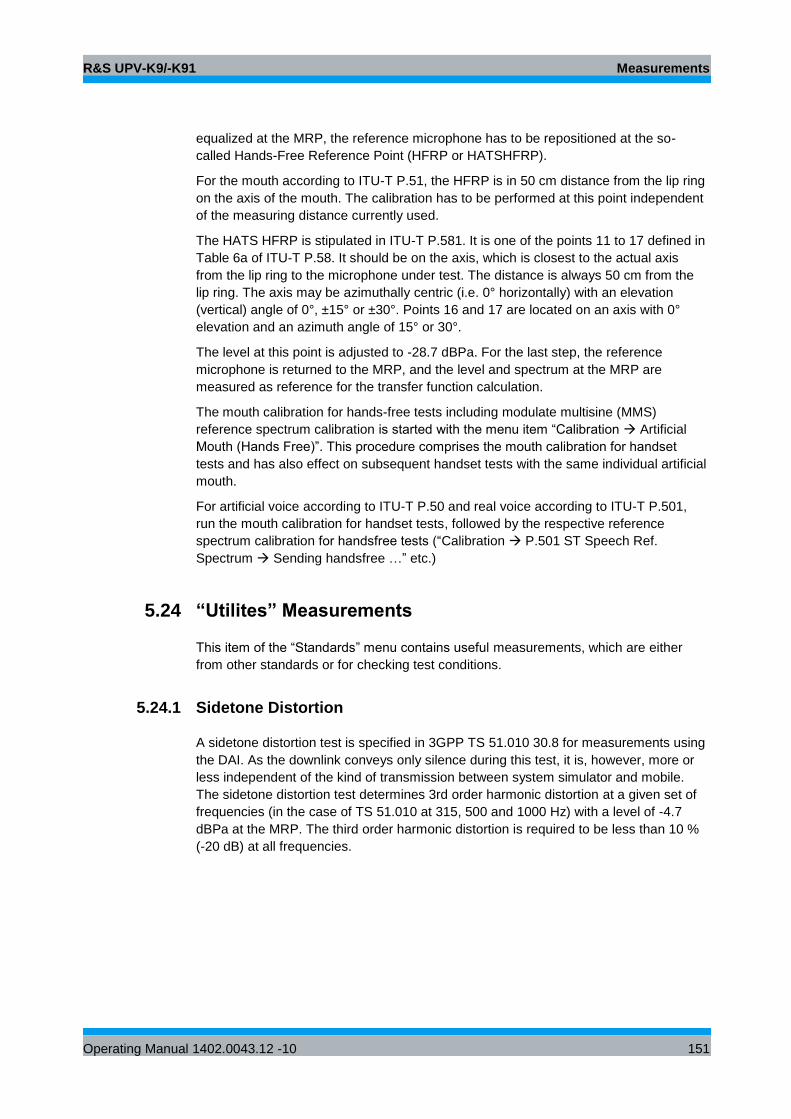
R&S UPV-K9/-K91 Measurements
Operating Manual 1402.0043.12 -10 151
equalized at the MRP, the reference microphone has to be repositioned at the so-
called Hands-Free Reference Point (HFRP or HATSHFRP).
For the mouth according to ITU-T P.51, the HFRP is in 50 cm distance from the lip ring
on the axis of the mouth. The calibration has to be performed at this point independent
of the measuring distance currently used.
The HATS HFRP is stipulated in ITU-T P.581. It is one of the points 11 to 17 defined in
Table 6a of ITU-T P.58. It should be on the axis, which is closest to the actual axis
from the lip ring to the microphone under test. The distance is always 50 cm from the
lip ring. The axis may be azimuthally centric (i.e. 0° horizontally) with an elevation
(vertical) angle of 0°, ±15° or ±30°. Points 16 and 17 are located on an axis with 0°
elevation and an azimuth angle of 15° or 30°.
The level at this point is adjusted to -28.7 dBPa. For the last step, the reference
microphone is returned to the MRP, and the level and spectrum at the MRP are
measured as reference for the transfer function calculation.
The mouth calibration for hands-free tests including modulate multisine (MMS)
reference spectrum calibration is started with the menu item “Calibration Artificial
Mouth (Hands Free)”. This procedure comprises the mouth calibration for handset
tests and has also effect on subsequent handset tests with the same individual artificial
mouth.
For artificial voice according to ITU-T P.50 and real voice according to ITU-T P.501,
run the mouth calibration for handset tests, followed by the respective reference
spectrum calibration for handsfree tests (“Calibration P.501 ST Speech Ref.
Spectrum Sending handsfree …” etc.)
5.24 “Utilites” Measurements
This item of the “Standards” menu contains useful measurements, which are either
from other standards or for checking test conditions.
5.24.1 Sidetone Distortion
A sidetone distortion test is specified in 3GPP TS 51.010 30.8 for measurements using
the DAI. As the downlink conveys only silence during this test, it is, however, more or
less independent of the kind of transmission between system simulator and mobile.
The sidetone distortion test determines 3rd order harmonic distortion at a given set of
frequencies (in the case of TS 51.010 at 315, 500 and 1000 Hz) with a level of -4.7
dBPa at the MRP. The third order harmonic distortion is required to be less than 10 %
(-20 dB) at all frequencies.
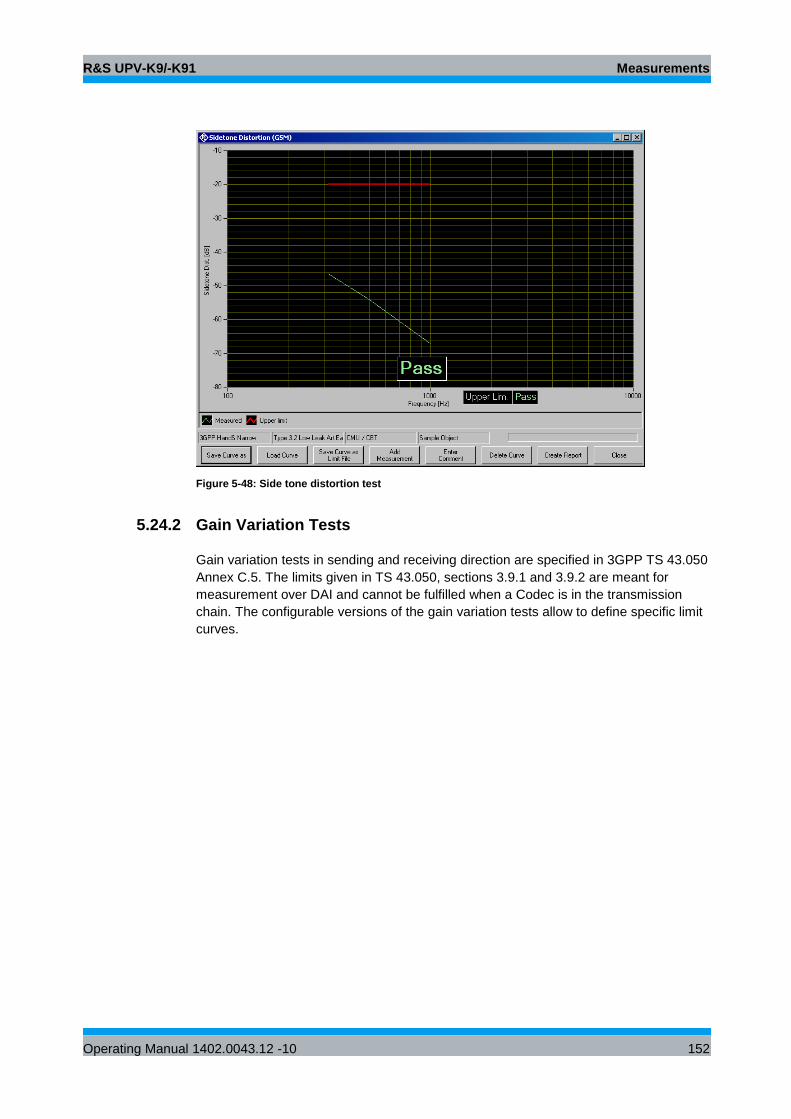
R&S UPV-K9/-K91 Measurements
Operating Manual 1402.0043.12 -10 152
Figure 5-48: Side tone distortion test
5.24.2 Gain Variation Tests
Gain variation tests in sending and receiving direction are specified in 3GPP TS 43.050
Annex C.5. The limits given in TS 43.050, sections 3.9.1 and 3.9.2 are meant for
measurement over DAI and cannot be fulfilled when a Codec is in the transmission
chain. The configurable versions of the gain variation tests allow to define specific limit
curves.
R&S UPV-K9/-K91 Measurements
Operating Manual 1402.0043.12 -10 153
Figure 5-49: Sending gain variation test
5.24.3 Delay Measurements
The tests decribed here are legacy measurement for the R&S CMU200. With R&S
CMW500 please use the standard roundtrip delay measurements which query the
internal processing delay of the system simulator and subtract it from the end-to-end
delay measured by meauns of cross-correlation.
Sending and receiving delay can only be measured end-to-end, i.e. from the acoustic
origin of the artificial mouth to the decoder output of the system simulator or from the
encoder input of the system simulator to the DRP. The measurements offered with
R&S UPV-K91 allow to subtract the estimated delay of the R&S CMU200 from the total
measured value. As the data is interleaved on the air interface, no exact time instance
can be determined when the audio data are transmitted between mobile phone and
system simulator. The values used in the present measurements are estimations with
an uncertainty of about 10 ms. The delay measurement is performed for a given set of
frequencies, and an average is calculated over all frequencies.
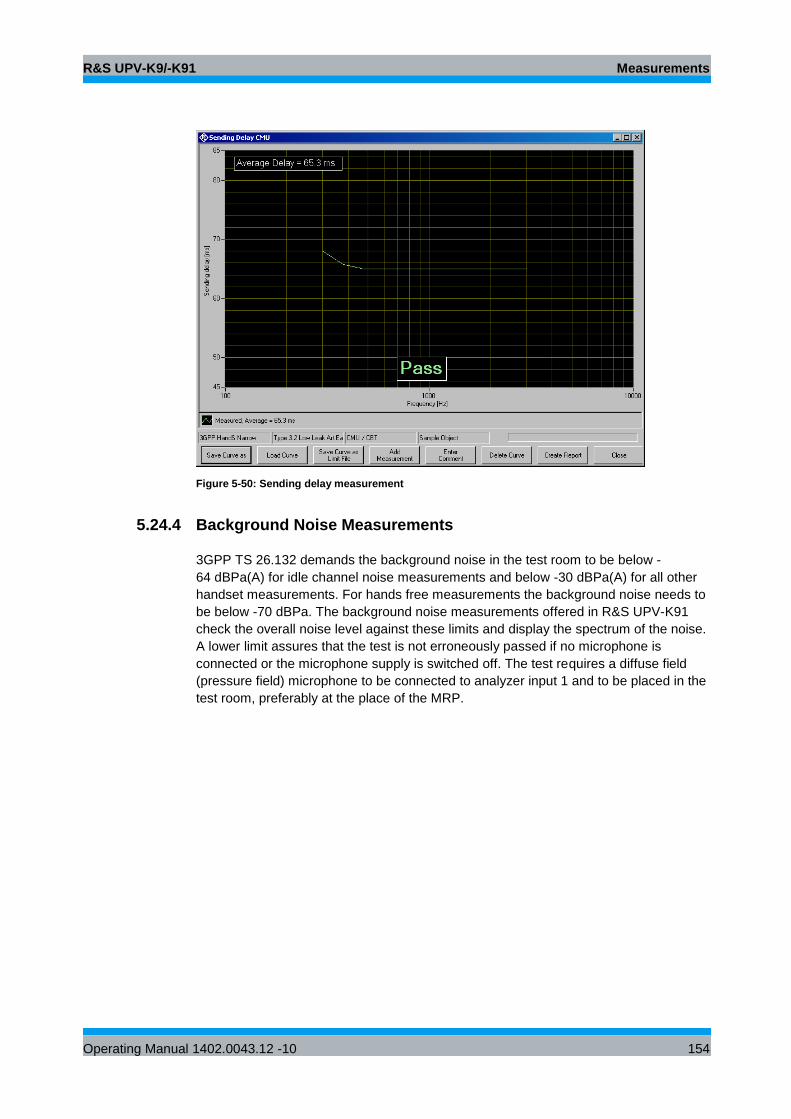
R&S UPV-K9/-K91 Measurements
Operating Manual 1402.0043.12 -10 154
Figure 5-50: Sending delay measurement
5.24.4 Background Noise Measurements
3GPP TS 26.132 demands the background noise in the test room to be below -
64 dBPa(A) for idle channel noise measurements and below -30 dBPa(A) for all other
handset measurements. For hands free measurements the background noise needs to
be below -70 dBPa. The background noise measurements offered in R&S UPV-K91
check the overall noise level against these limits and display the spectrum of the noise.
A lower limit assures that the test is not erroneously passed if no microphone is
connected or the microphone supply is switched off. The test requires a diffuse field
(pressure field) microphone to be connected to analyzer input 1 and to be placed in the
test room, preferably at the place of the MRP.
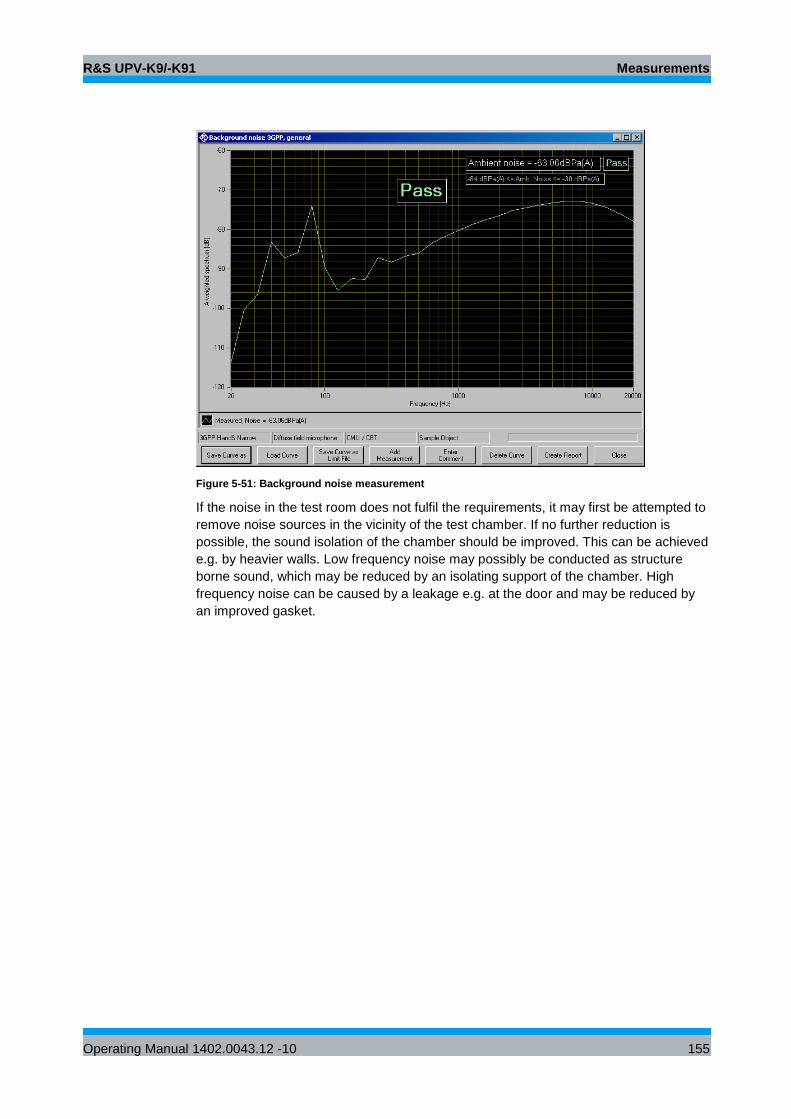
R&S UPV-K9/-K91 Measurements
Operating Manual 1402.0043.12 -10 155
Figure 5-51: Background noise measurement
If the noise in the test room does not fulfil the requirements, it may first be attempted to
remove noise sources in the vicinity of the test chamber. If no further reduction is
possible, the sound isolation of the chamber should be improved. This can be achieved
e.g. by heavier walls. Low frequency noise may possibly be conducted as structure
borne sound, which may be reduced by an isolating support of the chamber. High
frequency noise can be caused by a leakage e.g. at the door and may be reduced by
an improved gasket.
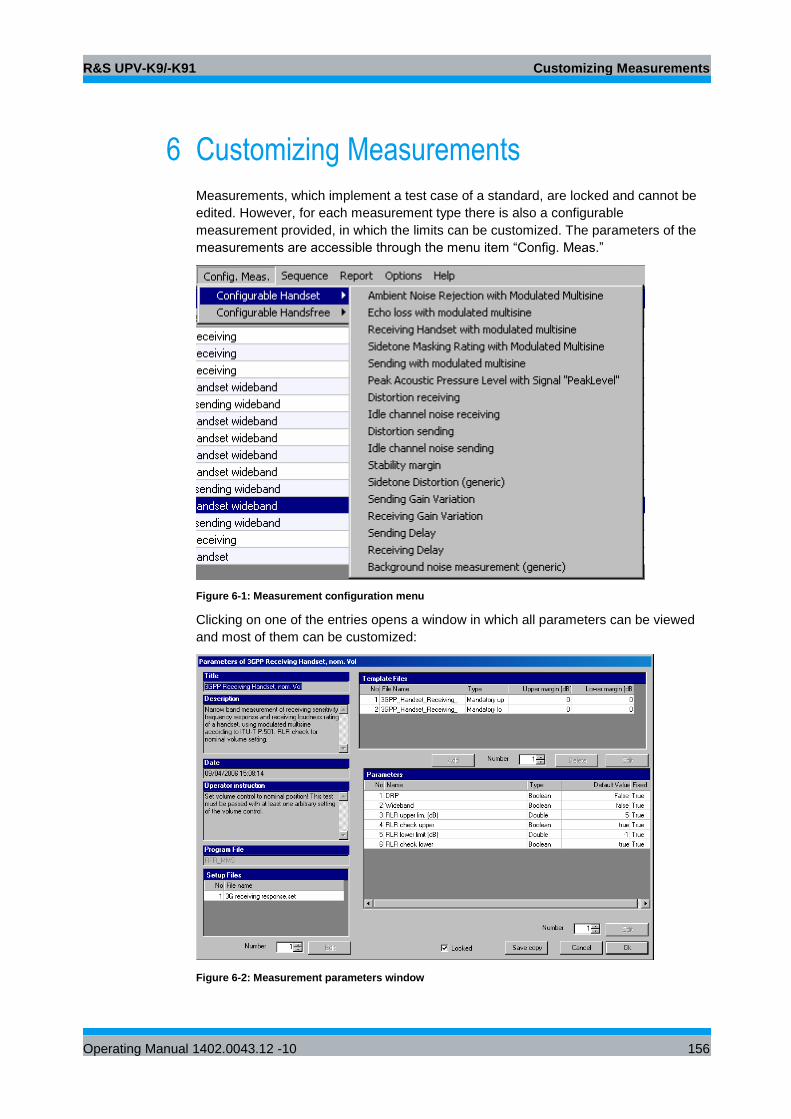
R&S UPV-K9/-K91 Customizing Measurements
Operating Manual 1402.0043.12 -10 156
6 Customizing Measurements
Measurements, which implement a test case of a standard, are locked and cannot be
edited. However, for each measurement type there is also a configurable
measurement provided, in which the limits can be customized. The parameters of the
measurements are accessible through the menu item “Config. Meas.”
Figure 6-1: Measurement configuration menu
Clicking on one of the entries opens a window in which all parameters can be viewed
and most of them can be customized:
Figure 6-2: Measurement parameters window
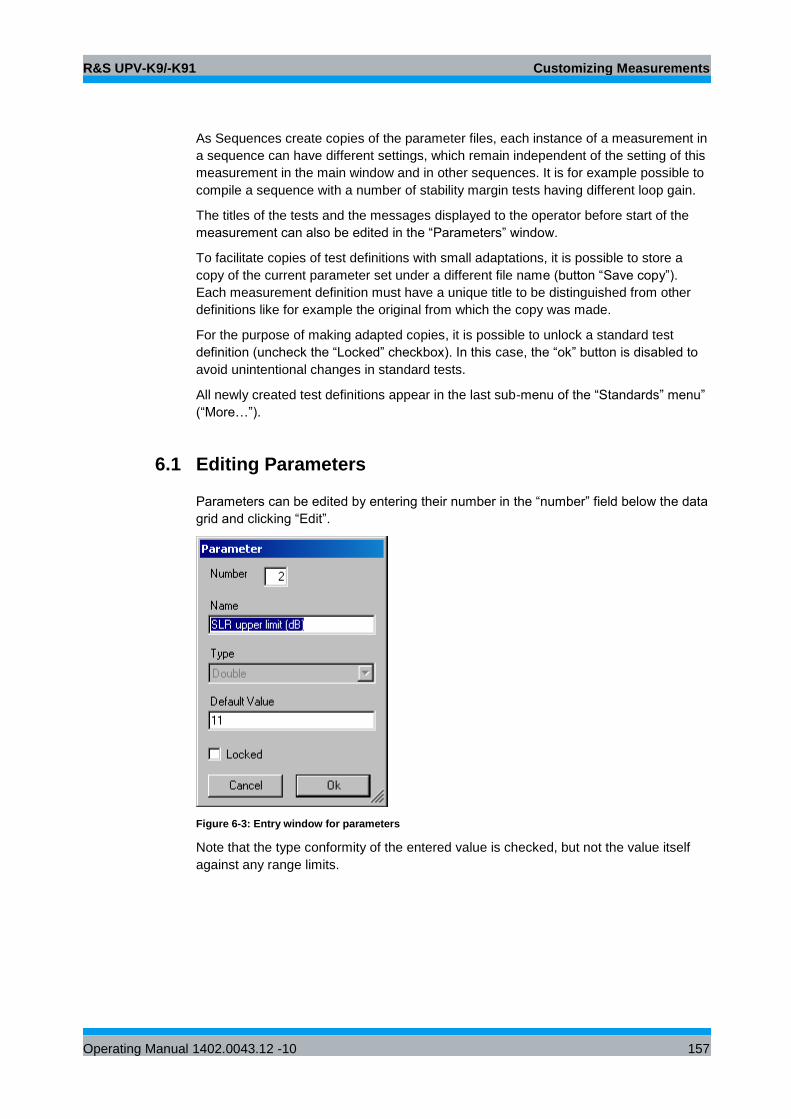
R&S UPV-K9/-K91 Customizing Measurements
Operating Manual 1402.0043.12 -10 157
As Sequences create copies of the parameter files, each instance of a measurement in
a sequence can have different settings, which remain independent of the setting of this
measurement in the main window and in other sequences. It is for example possible to
compile a sequence with a number of stability margin tests having different loop gain.
The titles of the tests and the messages displayed to the operator before start of the
measurement can also be edited in the “Parameters” window.
To facilitate copies of test definitions with small adaptations, it is possible to store a
copy of the current parameter set under a different file name (button “Save copy”).
Each measurement definition must have a unique title to be distinguished from other
definitions like for example the original from which the copy was made.
For the purpose of making adapted copies, it is possible to unlock a standard test
definition (uncheck the “Locked” checkbox). In this case, the “ok” button is disabled to
avoid unintentional changes in standard tests.
All newly created test definitions appear in the last sub-menu of the “Standards” menu”
(“More…”).
6.1 Editing Parameters
Parameters can be edited by entering their number in the “number” field below the data
grid and clicking “Edit”.
Figure 6-3: Entry window for parameters
Note that the type conformity of the entered value is checked, but not the value itself
against any range limits.
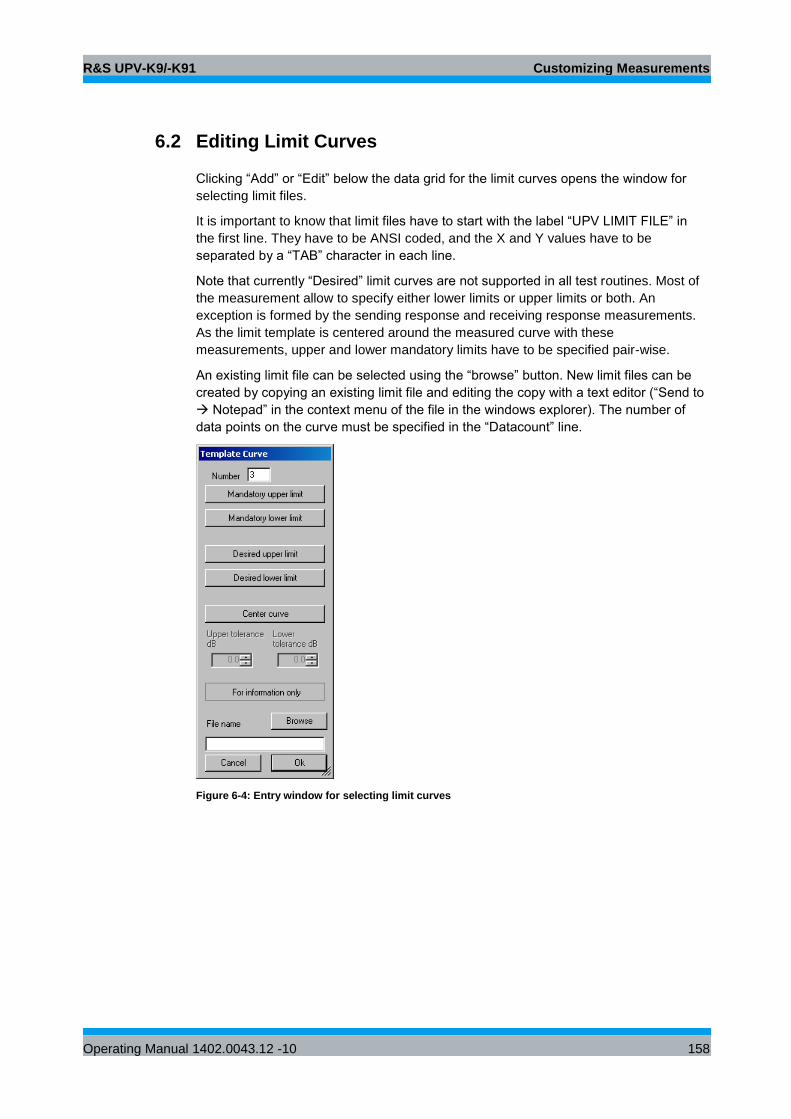
R&S UPV-K9/-K91 Customizing Measurements
Operating Manual 1402.0043.12 -10 158
6.2 Editing Limit Curves
Clicking “Add” or “Edit” below the data grid for the limit curves opens the window for
selecting limit files.
It is important to know that limit files have to start with the label “UPV LIMIT FILE” in
the first line. They have to be ANSI coded, and the X and Y values have to be
separated by a “TAB” character in each line.
Note that currently “Desired” limit curves are not supported in all test routines. Most of
the measurement allow to specify either lower limits or upper limits or both. An
exception is formed by the sending response and receiving response measurements.
As the limit template is centered around the measured curve with these
measurements, upper and lower mandatory limits have to be specified pair-wise.
An existing limit file can be selected using the “browse” button. New limit files can be
created by copying an existing limit file and editing the copy with a text editor (“Send to
Notepad” in the context menu of the file in the windows explorer). The number of
data points on the curve must be specified in the “Datacount” line.
Figure 6-4: Entry window for selecting limit curves
R&S UPV-K9/-K91 Measurements with Electric Connections
Operating Manual 1402.0043.12 -10 159
7 Measurements with Electric Connections
7.1 Introduction
Usually the mobile under test is connected via RF connection to the R&S CMU200 and
via acoustic interfaces (artificial mouth and ear) to the R&S UPV. Therefore, no
intrusion in the mobile device is required.
However, there can be cases during the design process of a mobile phone where the
usual interfaces are not available:
● if a mechanic mockup is to be measured just with the acoustic components but
without the rest of the circuitry
● if a circuit of a mobile phone is to be measured without acoustic components
● if a hands free kit or headset is to be measured without mobile phone
● if the hands free or headset connection of a mobile phone is to be measured
without hands free kit or headset, respectively.
In these cases, either coder and decoder or artificial ear and artificial mouth may be
replaced by direct electrical connections to the R&S UPV. To use electric connections,
select “Electric connection” in the respective item of the “Options” menu.
7.2 Calibration Values for Electric Connections
Electrical connections cannot be calibrated. Instead, a virtual sensitivity has to be
entered for each type of electrical connection under “Calibration Electric
connections …”.
7.2.1 Electric Connection Replacing Artificial Ear
R&S UPV Analyzer input 1 is directly connected to the earpiece amplifier output.
The calibration value for the electric connection replacing the artificial ear can be
entered in two ways:
1. A nominal sensitivity of the receiver (earpiece speaker) for which the circuit is
intended in dB re 1 Pa/V.
2. The voltage at the electric output of the mobile in mV, which is caused by a
full-scale peak value at the speech decoder output.
R&S UPV-K9/-K91 Measurements with Electric Connections
Operating Manual 1402.0043.12 -10 160
7.2.2 Electric Connection Replacing Artificial Mouth
R&S UPV generator output 1 is directly connected to the microphone input of the
mobile phone circuit.
The calibration value for the electric connection replacing the artificial mouth can be
entered in two ways:
1. A nominal sensitivity of the microphone for which the circuit is intended has to
be entered in dB re 1 V/Pa.
2. The voltage to the electric input of the mobile, which causes a full-scale peak
input value at the speech encoder input.
7.2.3 Electric Connection Replacing Encoder
R&S UPV generator output 2 is directly connected to an earpiece or headset speaker
or to the speech input of a hands free kit.
A nominal full-scale output voltage (output voltage corresponding to digital full scale) of
the circuit intended to drive the speaker or car kit has to be entered.
7.2.4 Electric Connection Replacing Decoder
R&S UPV analyzer input 2 is directly connected to a microphone or to the speech
output of a hands free kit.
A nominal full scale input voltage (input voltage corresponding to digital full scale) of
the respective microphone or speech input has to be entered.
7.3 Performing the Measurements
After applying the settings in the “Options” menu and after entering appropriate
calibration values for the electric connections in use, the measurements may be
started as usual.
Some parts of the standard require the use of particular artificial ears for particular
measurements. Therefore, the checkbox “Allow only selected measurements” should
be unchecked in “Options Standard”.
For sending tests, the output voltage range in the R&S UPV is set to a large value in
order to be able to drive the speaker of the artificial mouth. In rare cases, sending
distortion and/or sending noise results may be degraded with electric connections if a
low microphone sensitivity is entered. In this case, please contact R&S support.
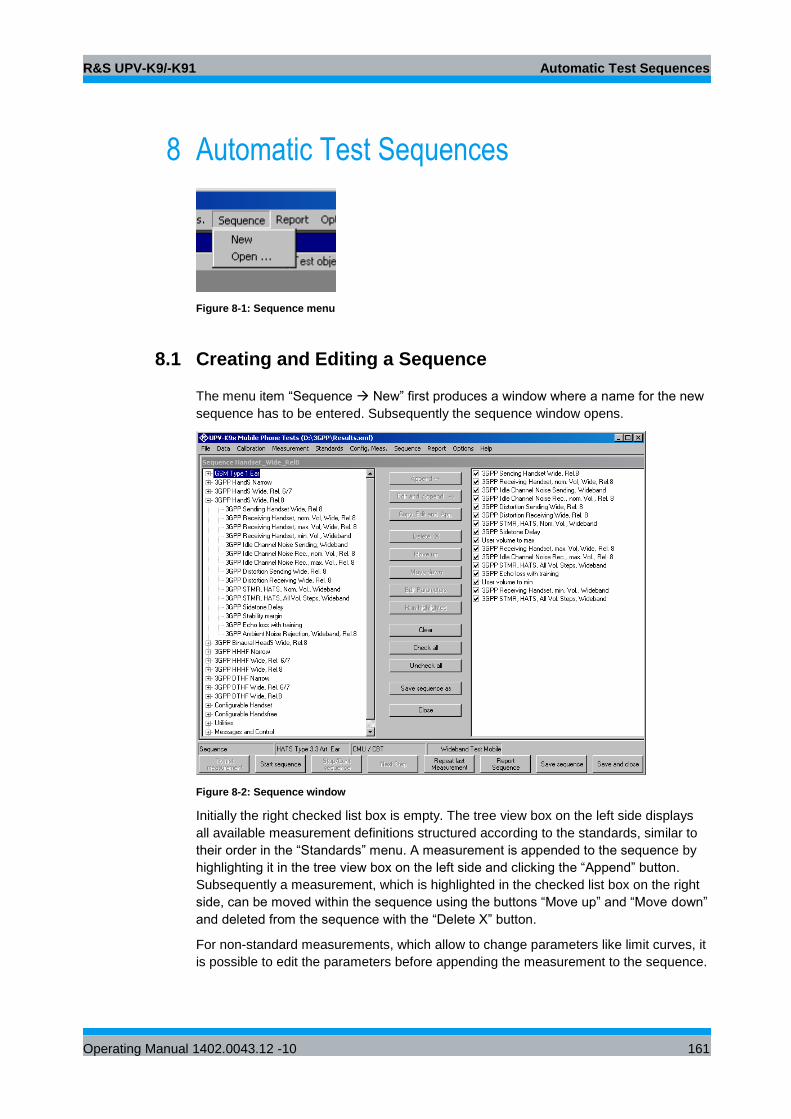
R&S UPV-K9/-K91 Automatic Test Sequences
Operating Manual 1402.0043.12 -10 161
8 Automatic Test Sequences
Figure 8-1: Sequence menu
8.1 Creating and Editing a Sequence
The menu item “Sequence New” first produces a window where a name for the new
sequence has to be entered. Subsequently the sequence window opens.
Figure 8-2: Sequence window
Initially the right checked list box is empty. The tree view box on the left side displays
all available measurement definitions structured according to the standards, similar to
their order in the “Standards” menu. A measurement is appended to the sequence by
highlighting it in the tree view box on the left side and clicking the “Append” button.
Subsequently a measurement, which is highlighted in the checked list box on the right
side, can be moved within the sequence using the buttons “Move up” and “Move down”
and deleted from the sequence with the “Delete X” button.
For non-standard measurements, which allow to change parameters like limit curves, it
is possible to edit the parameters before appending the measurement to the sequence.
R&S UPV-K9/-K91 Automatic Test Sequences
Operating Manual 1402.0043.12 -10 162
This is done by clicking the button “Edit and append”. It is for example possible to
assemble a test sequence, which contains stability margin tests with different loop
gains.
A sequence should be run with option “Show operator instructions” disabled. This
avoids interruption of the execution. If a message to the operator is to be inserted into
the sequence on purpose, e.g. “Set user volume control to maximum!”, the items
provided in the tree view under “Messages and Control” may be used. Such a
message will stop the execution of the sequence until it is closed by acknowledgement
of the operator.
8.2 Remote Control of R&S CMU200 within a Sequence
It is possible to remote control radiocommunication tester R&S CMU200 from the
R&S UPV within an automatic test sequence, for example to wait for a mobile to
register, or for originating a call to the mobile. First the connection interface to the
R&S CMU200 has to be set up using menu item “Options CMU remote control”. To
insert a control instance into a sequence, choose one of the examples offered in
branch “Messages and Control” of the tree view and edit it if necessary. For details on
the remote control of the R&S CMU200, see the respective operation manuals.
Each control instance consists of a block of an arbitrary number of remote commands
followed by a status query. The query command (e.g. “SIGN:STAT?”) and the
response to wait for (e.g. “SYNC” or “CEST”) can be specified as well as a timeout for
the case that the desired response is not received. As the R&S CMU200 is organized
into subsystems for the different mobile phone systems / GSM bands, the subsystem
has to be specified as a parameter. Parameter “Auto” causes the control instance to
use the subsystem set with menu item “Options CMU Subsystem”. Note that for
different GSM bands, the remote commands are usually compatible, but they are not
always compatible between GSM and WCDMA.
In addition, a message to the operator like “Please switch on the mobile!” can be
entered in the “Operator Instruction” field of the parameter window. Parameter 1 allows
you to choose whether the message is shown before or after the block of commands is
sent to the R&S CMU200.
When the R&S CMU200 control instance is executed within a sequence, a window
opens, showing the progress of the control action.
By default, the R&S CMU200 changes its state when switching from local control to
remote control or vice versa. As a consequence, synchronicity / registration or an
established call would be lost during the transition. Therefore the command
“SYSTem:GTRMode:COMPatible OFF” has to be issued before the first real remote
control instance. Insert “CMU run this first!” in your sequence before any other remote
CMU remote control.
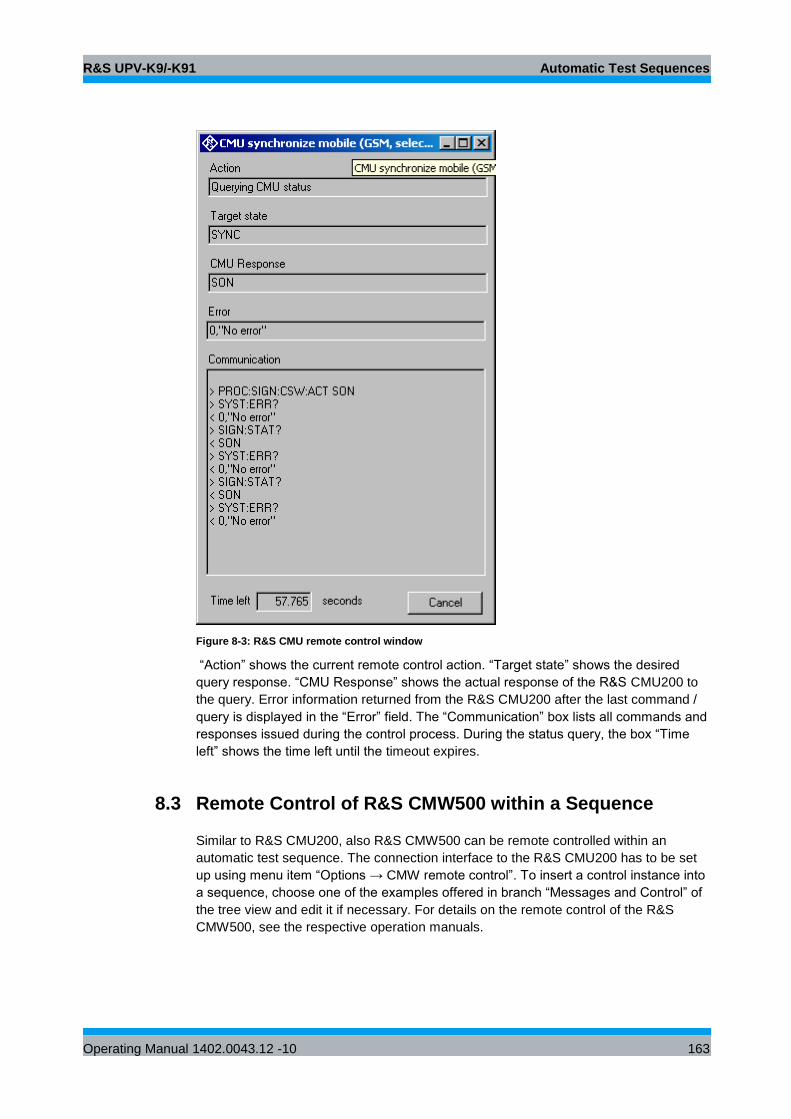
R&S UPV-K9/-K91 Automatic Test Sequences
Operating Manual 1402.0043.12 -10 163
Figure 8-3: R&S CMU remote control window
“Action” shows the current remote control action. “Target state” shows the desired
query response. “CMU Response” shows the actual response of the R&S CMU200 to
the query. Error information returned from the R&S CMU200 after the last command /
query is displayed in the “Error” field. The “Communication” box lists all commands and
responses issued during the control process. During the status query, the box “Time
left” shows the time left until the timeout expires.
8.3 Remote Control of R&S CMW500 within a Sequence
Similar to R&S CMU200, also R&S CMW500 can be remote controlled within an
automatic test sequence. The connection interface to the R&S CMU200 has to be set
up using menu item “Options → CMW remote control”. To insert a control instance into
a sequence, choose one of the examples offered in branch “Messages and Control” of
the tree view and edit it if necessary. For details on the remote control of the R&S
CMW500, see the respective operation manuals.
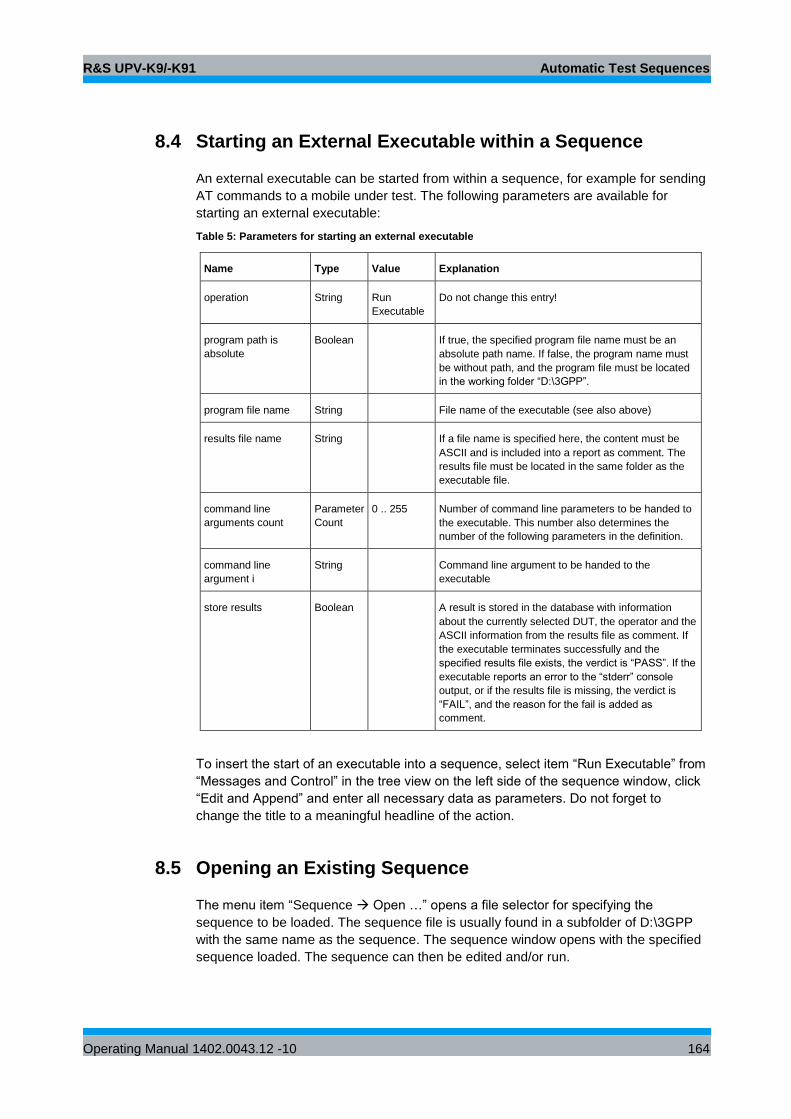
R&S UPV-K9/-K91 Automatic Test Sequences
Operating Manual 1402.0043.12 -10 164
8.4 Starting an External Executable within a Sequence
An external executable can be started from within a sequence, for example for sending
AT commands to a mobile under test. The following parameters are available for
starting an external executable:
Table 5: Parameters for starting an external executable
Name Type Value Explanation
operation String Run
Executable
Do not change this entry!
program path is
absolute
Boolean If true, the specified program file name must be an
absolute path name. If false, the program name must
be without path, and the program file must be located
in the working folder “D:\3GPP”.
program file name String File name of the executable (see also above)
results file name String If a file name is specified here, the content must be
ASCII and is included into a report as comment. The
results file must be located in the same folder as the
executable file.
command line
arguments count
Parameter
Count
0 .. 255 Number of command line parameters to be handed to
the executable. This number also determines the
number of the following parameters in the definition.
command line
argument i
String Command line argument to be handed to the
executable
store results Boolean A result is stored in the database with information
about the currently selected DUT, the operator and the
ASCII information from the results file as comment. If
the executable terminates successfully and the
specified results file exists, the verdict is “PASS”. If the
executable reports an error to the “stderr” console
output, or if the results file is missing, the verdict is
“FAIL”, and the reason for the fail is added as
comment.
To insert the start of an executable into a sequence, select item “Run Executable” from
“Messages and Control” in the tree view on the left side of the sequence window, click
“Edit and Append” and enter all necessary data as parameters. Do not forget to
change the title to a meaningful headline of the action.
8.5 Opening an Existing Sequence
The menu item “Sequence Open …” opens a file selector for specifying the
sequence to be loaded. The sequence file is usually found in a subfolder of D:\3GPP
with the same name as the sequence. The sequence window opens with the specified
sequence loaded. The sequence can then be edited and/or run.
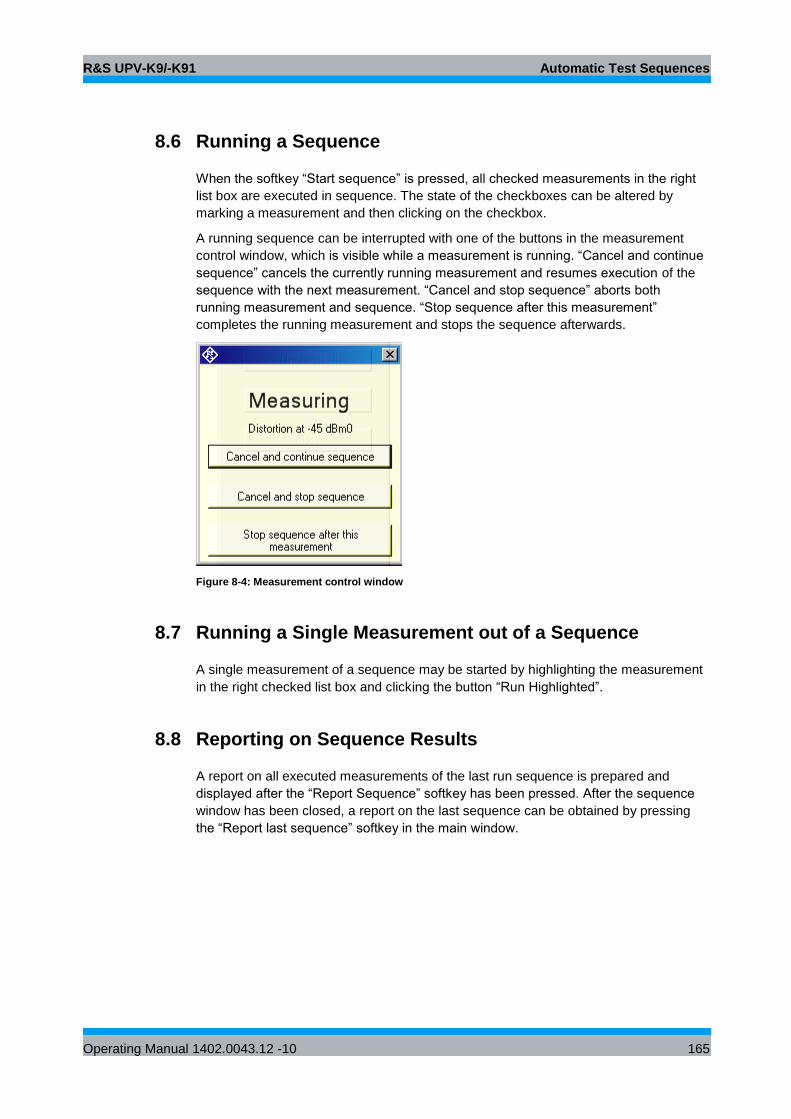
R&S UPV-K9/-K91 Automatic Test Sequences
Operating Manual 1402.0043.12 -10 165
8.6 Running a Sequence
When the softkey “Start sequence” is pressed, all checked measurements in the right
list box are executed in sequence. The state of the checkboxes can be altered by
marking a measurement and then clicking on the checkbox.
A running sequence can be interrupted with one of the buttons in the measurement
control window, which is visible while a measurement is running. “Cancel and continue
sequence” cancels the currently running measurement and resumes execution of the
sequence with the next measurement. “Cancel and stop sequence” aborts both
running measurement and sequence. “Stop sequence after this measurement”
completes the running measurement and stops the sequence afterwards.
Figure 8-4: Measurement control window
8.7 Running a Single Measurement out of a Sequence
A single measurement of a sequence may be started by highlighting the measurement
in the right checked list box and clicking the button “Run Highlighted”.
8.8 Reporting on Sequence Results
A report on all executed measurements of the last run sequence is prepared and
displayed after the “Report Sequence” softkey has been pressed. After the sequence
window has been closed, a report on the last sequence can be obtained by pressing
the “Report last sequence” softkey in the main window.
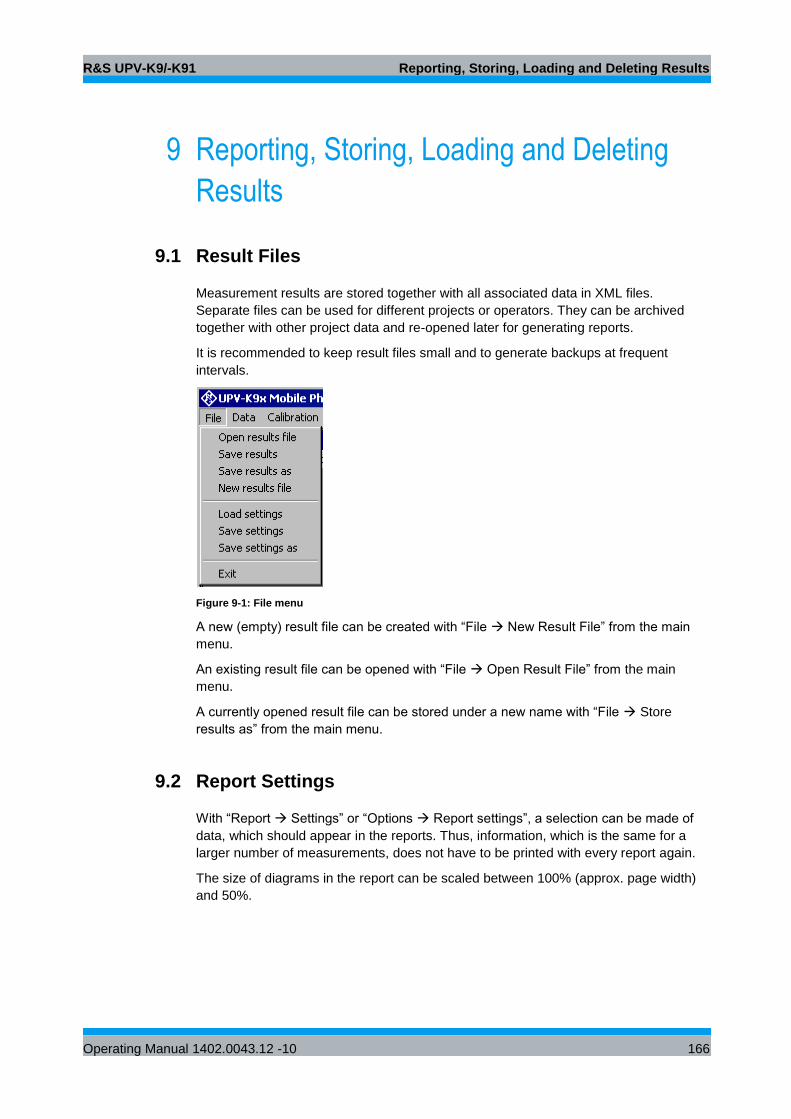
R&S UPV-K9/-K91 Reporting, Storing, Loading and Deleting Results
Operating Manual 1402.0043.12 -10 166
9 Reporting, Storing, Loading and Deleting
Results
9.1 Result Files
Measurement results are stored together with all associated data in XML files.
Separate files can be used for different projects or operators. They can be archived
together with other project data and re-opened later for generating reports.
It is recommended to keep result files small and to generate backups at frequent
intervals.
Figure 9-1: File menu
A new (empty) result file can be created with “File New Result File” from the main
menu.
An existing result file can be opened with “File Open Result File” from the main
menu.
A currently opened result file can be stored under a new name with “File Store
results as” from the main menu.
9.2 Report Settings
With “Report Settings” or “Options Report settings”, a selection can be made of
data, which should appear in the reports. Thus, information, which is the same for a
larger number of measurements, does not have to be printed with every report again.
The size of diagrams in the report can be scaled between 100% (approx. page width)
and 50%.
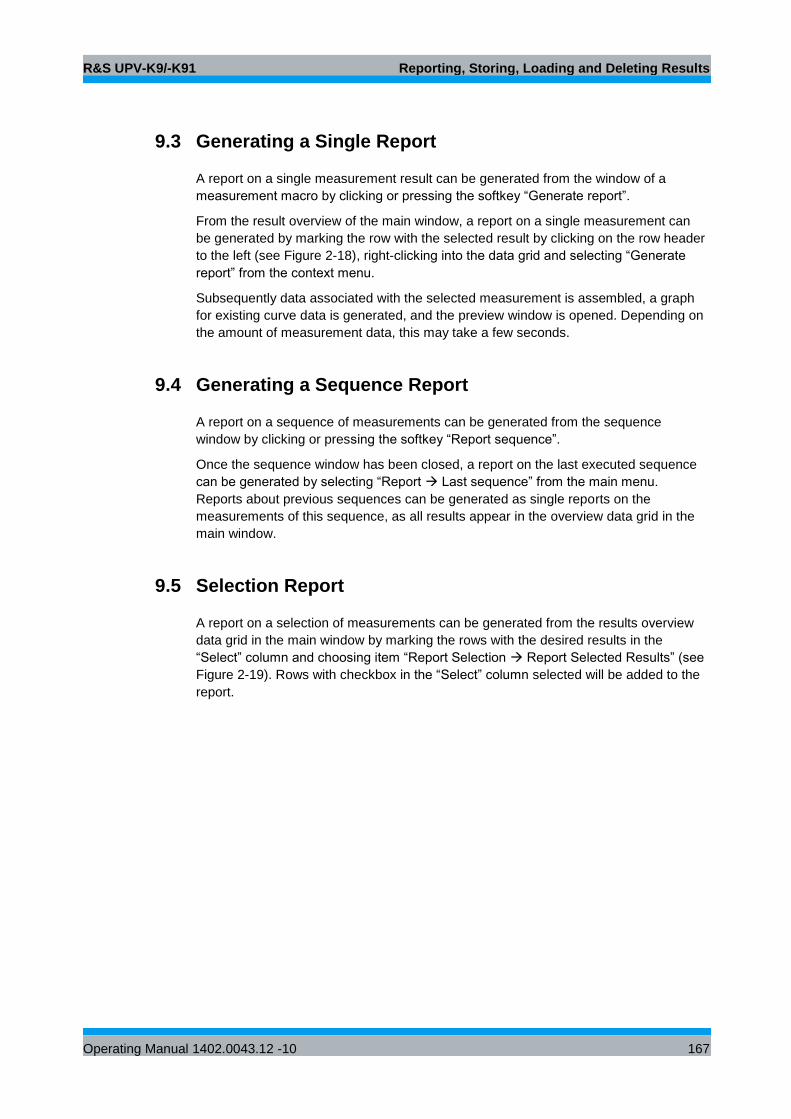
R&S UPV-K9/-K91 Reporting, Storing, Loading and Deleting Results
Operating Manual 1402.0043.12 -10 167
9.3 Generating a Single Report
A report on a single measurement result can be generated from the window of a
measurement macro by clicking or pressing the softkey “Generate report”.
From the result overview of the main window, a report on a single measurement can
be generated by marking the row with the selected result by clicking on the row header
to the left (see Figure 2-18), right-clicking into the data grid and selecting “Generate
report” from the context menu.
Subsequently data associated with the selected measurement is assembled, a graph
for existing curve data is generated, and the preview window is opened. Depending on
the amount of measurement data, this may take a few seconds.
9.4 Generating a Sequence Report
A report on a sequence of measurements can be generated from the sequence
window by clicking or pressing the softkey “Report sequence”.
Once the sequence window has been closed, a report on the last executed sequence
can be generated by selecting “Report Last sequence” from the main menu.
Reports about previous sequences can be generated as single reports on the
measurements of this sequence, as all results appear in the overview data grid in the
main window.
9.5 Selection Report
A report on a selection of measurements can be generated from the results overview
data grid in the main window by marking the rows with the desired results in the
“Select” column and choosing item “Report Selection Report Selected Results” (see
Figure 2-19). Rows with checkbox in the “Select” column selected will be added to the
report.
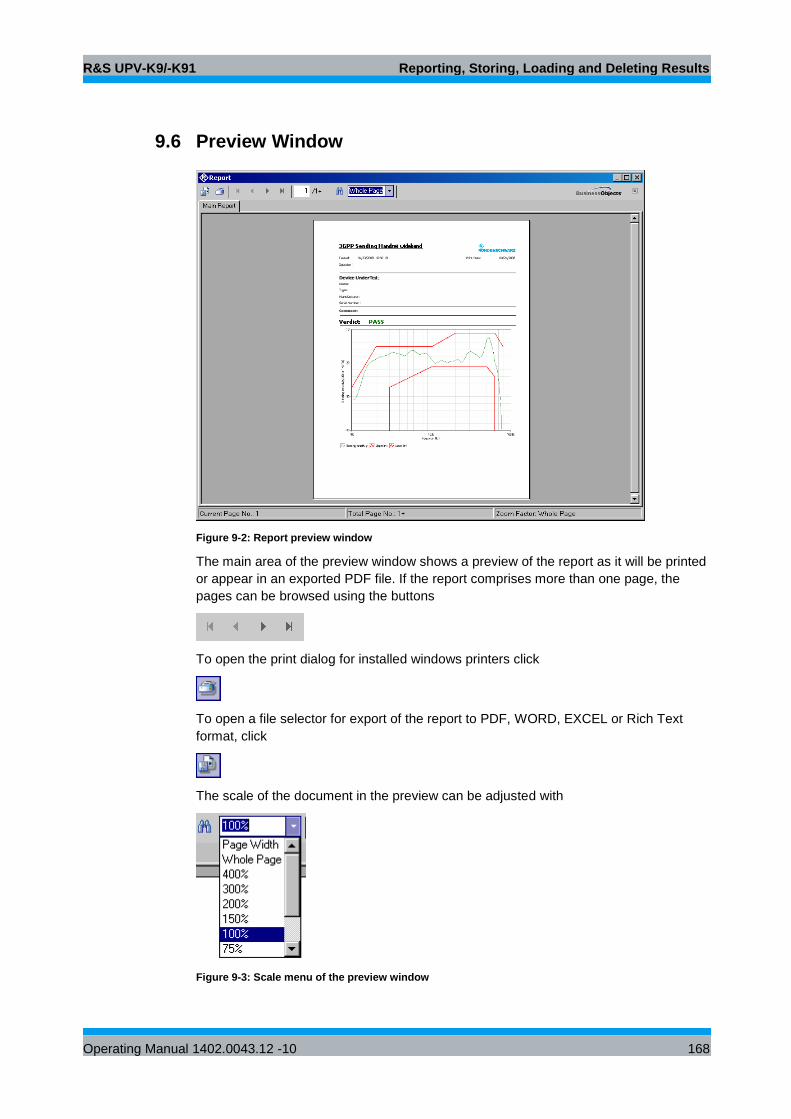
R&S UPV-K9/-K91 Reporting, Storing, Loading and Deleting Results
Operating Manual 1402.0043.12 -10 168
9.6 Preview Window
Figure 9-2: Report preview window
The main area of the preview window shows a preview of the report as it will be printed
or appear in an exported PDF file. If the report comprises more than one page, the
pages can be browsed using the buttons
To open the print dialog for installed windows printers click
To open a file selector for export of the report to PDF, WORD, EXCEL or Rich Text
format, click
The scale of the document in the preview can be adjusted with
Figure 9-3: Scale menu of the preview window
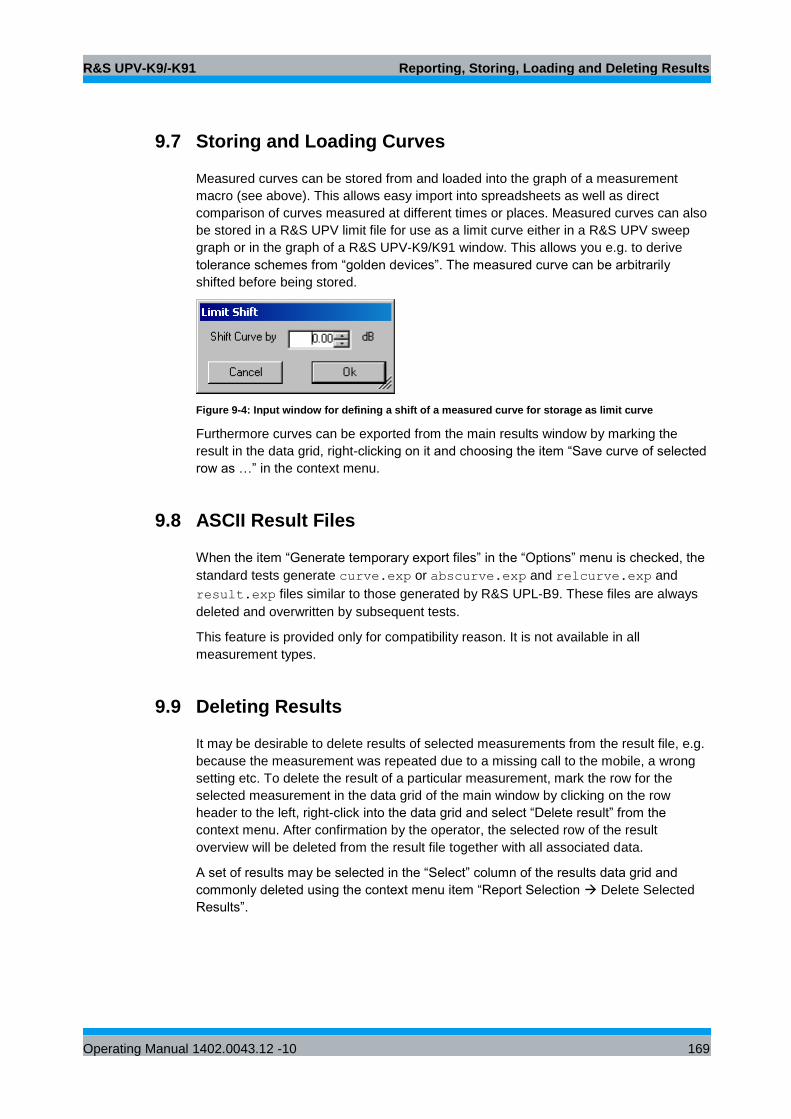
R&S UPV-K9/-K91 Reporting, Storing, Loading and Deleting Results
Operating Manual 1402.0043.12 -10 169
9.7 Storing and Loading Curves
Measured curves can be stored from and loaded into the graph of a measurement
macro (see above). This allows easy import into spreadsheets as well as direct
comparison of curves measured at different times or places. Measured curves can also
be stored in a R&S UPV limit file for use as a limit curve either in a R&S UPV sweep
graph or in the graph of a R&S UPV-K9/K91 window. This allows you e.g. to derive
tolerance schemes from “golden devices”. The measured curve can be arbitrarily
shifted before being stored.
Figure 9-4: Input window for defining a shift of a measured curve for storage as limit curve
Furthermore curves can be exported from the main results window by marking the
result in the data grid, right-clicking on it and choosing the item “Save curve of selected
row as …” in the context menu.
9.8 ASCII Result Files
When the item “Generate temporary export files” in the “Options” menu is checked, the
standard tests generate curve.exp or abscurve.exp and relcurve.exp and
result.exp files similar to those generated by R&S UPL-B9. These files are always
deleted and overwritten by subsequent tests.
This feature is provided only for compatibility reason. It is not available in all
measurement types.
9.9 Deleting Results
It may be desirable to delete results of selected measurements from the result file, e.g.
because the measurement was repeated due to a missing call to the mobile, a wrong
setting etc. To delete the result of a particular measurement, mark the row for the
selected measurement in the data grid of the main window by clicking on the row
header to the left, right-click into the data grid and select “Delete result” from the
context menu. After confirmation by the operator, the selected row of the result
overview will be deleted from the result file together with all associated data.
A set of results may be selected in the “Select” column of the results data grid and
commonly deleted using the context menu item “Report Selection Delete Selected
Results”.
R&S UPV-K9/-K91 Remote Controlled Start of Testcases via GPIB
Operating Manual 1402.0043.12 -10 170
10 Remote Controlled Start of Testcases via
GPIB
10.1 Preparations
● Start the K9x test program on the R&S UPV.
● In the “Options” menu, deactivate item “Show operator instructions” and activate
“Generate temporary export files”.
● If it is desired to download screenshots from the R&S UPV to the host, activate
also “Generate temporary image files” in the Options menu.
● Activate “Enable remote control” in the Options menu
● Do all necessary settings and calibrations as would be done for manual control.
Remote controlled start of test cases via GPIB is not possible if the GPIB is used for
controlling the R&S® CMW or R&S® CMU from this software via GPIB (menu items
“Options CMW remote control” and “Options CMU remote control”).
10.2 Starting a Measurement
A measurement can be started with remote command:
SYST:PROG:EXEC 'C:\ControlK9.exe D:\3GPP\3G_rec_handset_narrow_max.mdf'
wherein ControlK9.exe is the client program controlling the application and
“D:\3GPP\3G_rec_handset_narrow_max.mdf” specifies a file which defines the test to
be executed. A list of files for various tests is given separately in the spreadsheed file
“TestCaseList_23147.xls”. The file name must be separated from the program name
by a space character. Thus it is recognized by the client program as a command line
parameter.
Do not attempt to control the R&S UPV-K9x software locally while a remotely started
test case is running.
10.3 Reading the Results
Result values and curves are available in memory buffers in the R&S UPV firmware
according to the following tables:
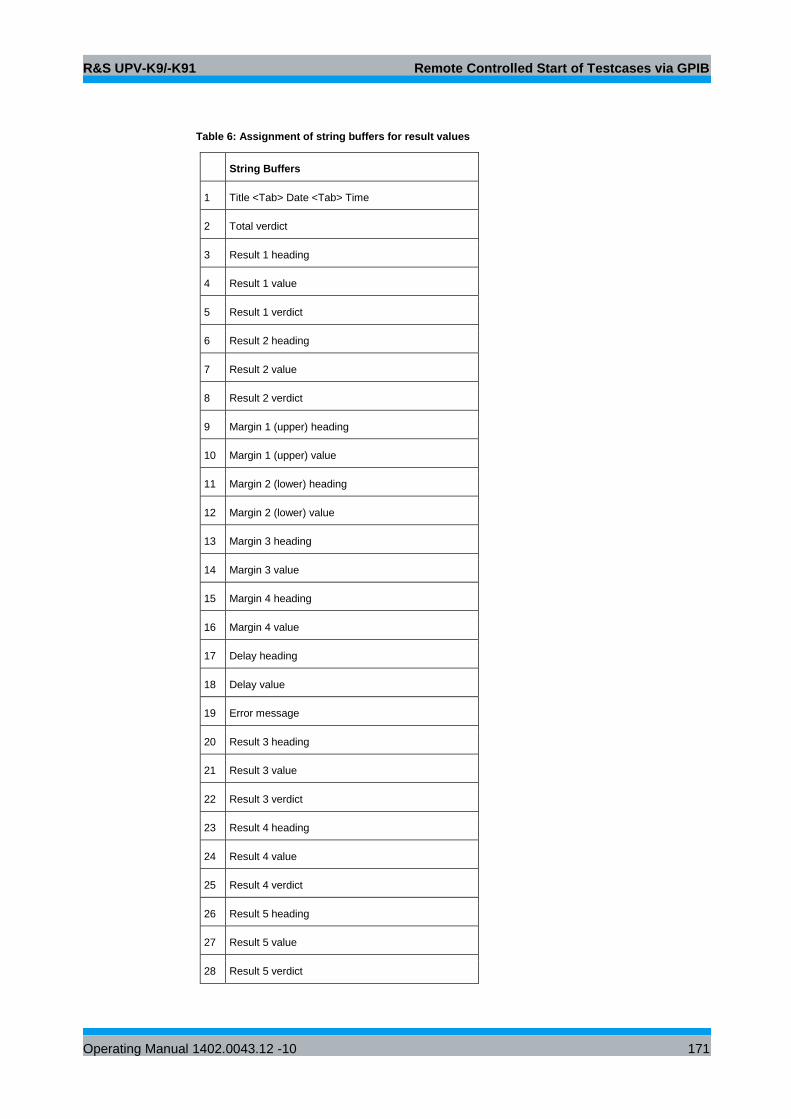
R&S UPV-K9/-K91 Remote Controlled Start of Testcases via GPIB
Operating Manual 1402.0043.12 -10 171
Table 6: Assignment of string buffers for result values
String Buffers
1 Title <Tab> Date <Tab> Time
2 Total verdict
3 Result 1 heading
4 Result 1 value
5 Result 1 verdict
6 Result 2 heading
7 Result 2 value
8 Result 2 verdict
9 Margin 1 (upper) heading
10 Margin 1 (upper) value
11 Margin 2 (lower) heading
12 Margin 2 (lower) value
13 Margin 3 heading
14 Margin 3 value
15 Margin 4 heading
16 Margin 4 value
17 Delay heading
18 Delay value
19 Error message
20 Result 3 heading
21 Result 3 value
22 Result 3 verdict
23 Result 4 heading
24 Result 4 value
25 Result 4 verdict
26 Result 5 heading
27 Result 5 value
28 Result 5 verdict
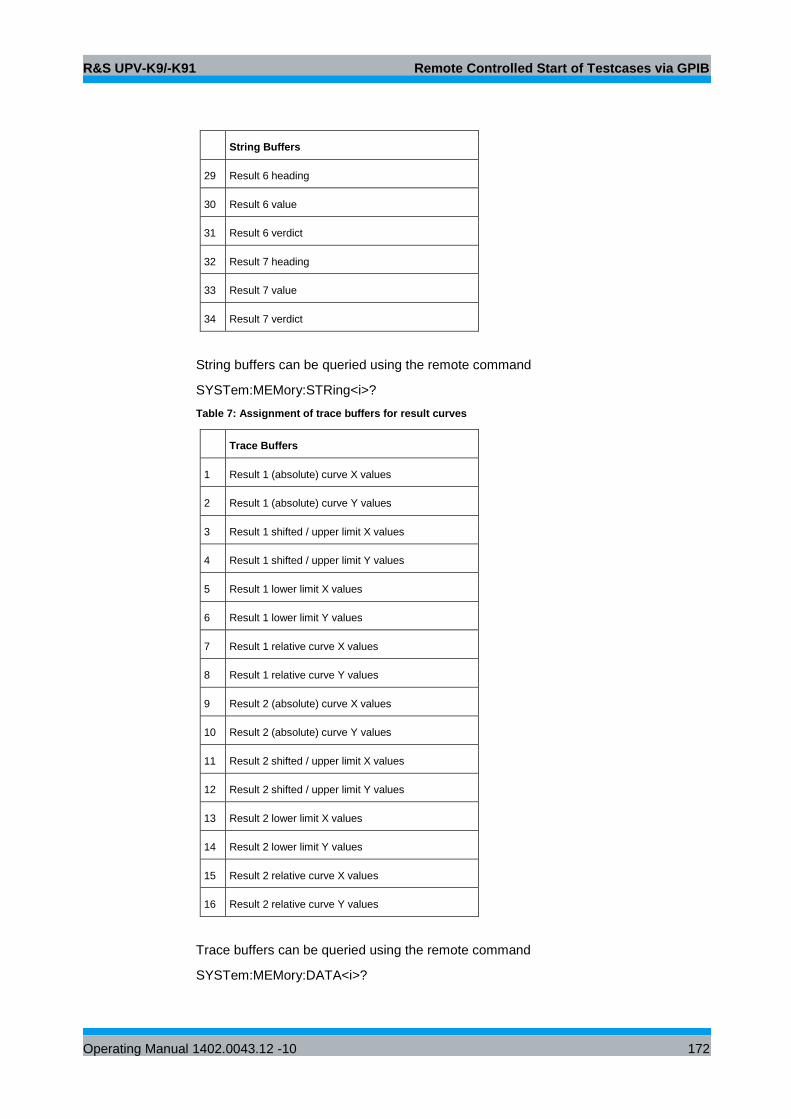
R&S UPV-K9/-K91 Remote Controlled Start of Testcases via GPIB
Operating Manual 1402.0043.12 -10 172
String Buffers
29 Result 6 heading
30 Result 6 value
31 Result 6 verdict
32 Result 7 heading
33 Result 7 value
34 Result 7 verdict
String buffers can be queried using the remote command
SYSTem:MEMory:STRing<i>?
Table 7: Assignment of trace buffers for result curves
Trace Buffers
1 Result 1 (absolute) curve X values
2 Result 1 (absolute) curve Y values
3 Result 1 shifted / upper limit X values
4 Result 1 shifted / upper limit Y values
5 Result 1 lower limit X values
6 Result 1 lower limit Y values
7 Result 1 relative curve X values
8 Result 1 relative curve Y values
9 Result 2 (absolute) curve X values
10 Result 2 (absolute) curve Y values
11 Result 2 shifted / upper limit X values
12 Result 2 shifted / upper limit Y values
13 Result 2 lower limit X values
14 Result 2 lower limit Y values
15 Result 2 relative curve X values
16 Result 2 relative curve Y values
Trace buffers can be queried using the remote command
SYSTem:MEMory:DATA<i>?

R&S UPV-K9/-K91 Remote Controlled Start of Testcases via GPIB
Operating Manual 1402.0043.12 -10 173
Results are also available in files “D:\3GPP\result.exp”, “D:\3GPP\relcurv.exp” and / or
“D:\3GPP\abscurv.exp”, depending on the type of measurement. If “Options
Generate temporary image files” is activated, a screenshot of the last finished test is
available in “D:\3GPP\Image.TIF”. The command for the file transfer is (for the example
of the results file)
MMEM:DATA? 'D:\3GPP\result.exp '
All results are stored in the database. However, it is not possible to change the test
object remotely. The results can be identified later by the test time given in the
result.exp file.
10.4 Determining the Termination of a Measurement
A running test is indicated with bit 14 of the Operation register in the status system set.
It is recommended to configure a service request on the GPIB for a negative transition
of this bit:
STAT:OPER:NTR 16384
STAT:OPER:ENAB 16384
*SRE 128
A service request will be issued as soon as the test has terminated.
To avoid obsolete result files to be downloaded from the R&S UPV, existing result files
can be deleted before the start of the measurement, using the commands:
MMEM:DEL 'D:\3GPP\result.exp'
MMEM:DEL 'D:\3GPP\relcurv.exp'
MMEM:DEL 'D:\3GPP\abscurv.exp'
Note that an attempt to delete a non-existing file will lead to an entry in the error queue.
The error queue can be flushed using the query “SYST:ERR?” until the response is
‘0,”No error”’. Alternatively existing files can be overwritten by uploading empty files
with the same name. Downloaded files can then be checked for their size before they
are processed further, to determine whether they are empty dummy files.
For further details on remote control of the R&S UPV via GPIB and on the remote
commands mentioned above please see the user manual of the R&S UPV.
R&S UPV-K9/-K91 Terminating the Application
Operating Manual 1402.0043.12 -10 174
11 Terminating the Application
The measurement can be terminated from the main window with the “Exit” softkey.
This causes the result file to be written to the hard disk.
Please allow a few seconds for the results file to be written before shutting down
windows.
Do not shut down the instrument before the application program has been closed.
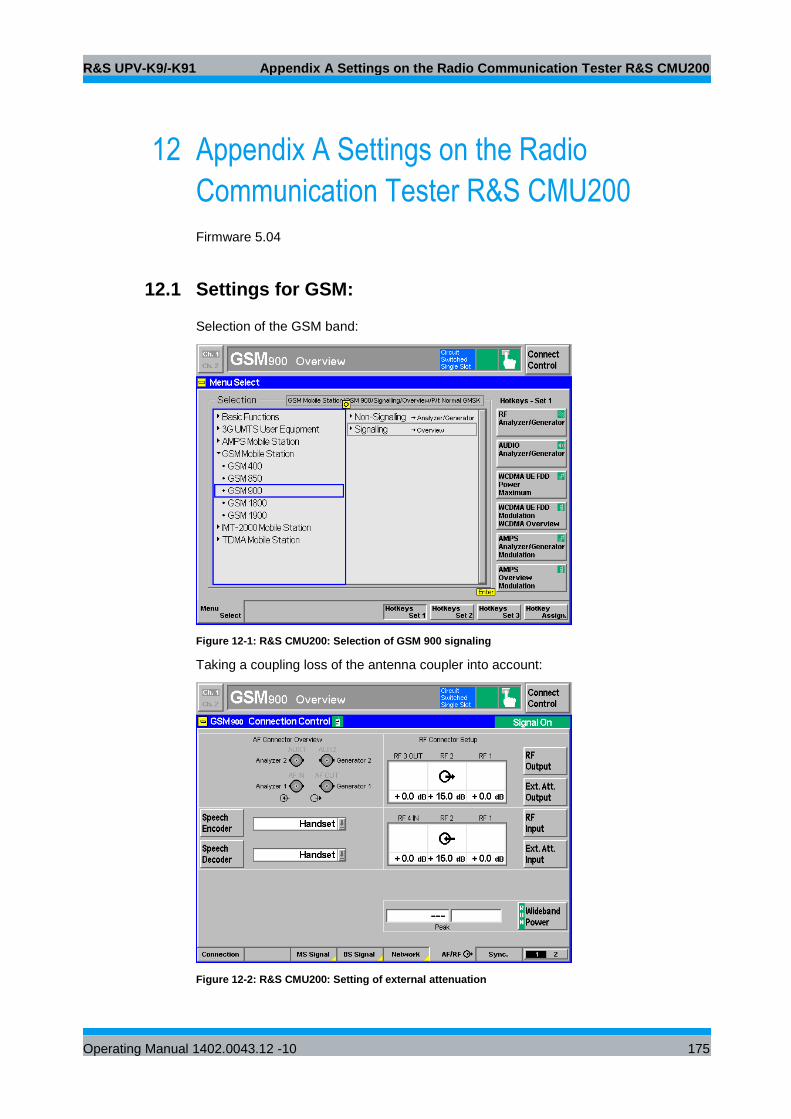
R&S UPV-K9/-K91 Appendix A Settings on the Radio Communication Tester R&S CMU200
Operating Manual 1402.0043.12 -10 175
12 Appendix A Settings on the Radio
Communication Tester R&S CMU200
Firmware 5.04
12.1 Settings for GSM:
Selection of the GSM band:
Figure 12-1: R&S CMU200: Selection of GSM 900 signaling
Taking a coupling loss of the antenna coupler into account:
Figure 12-2: R&S CMU200: Setting of external attenuation
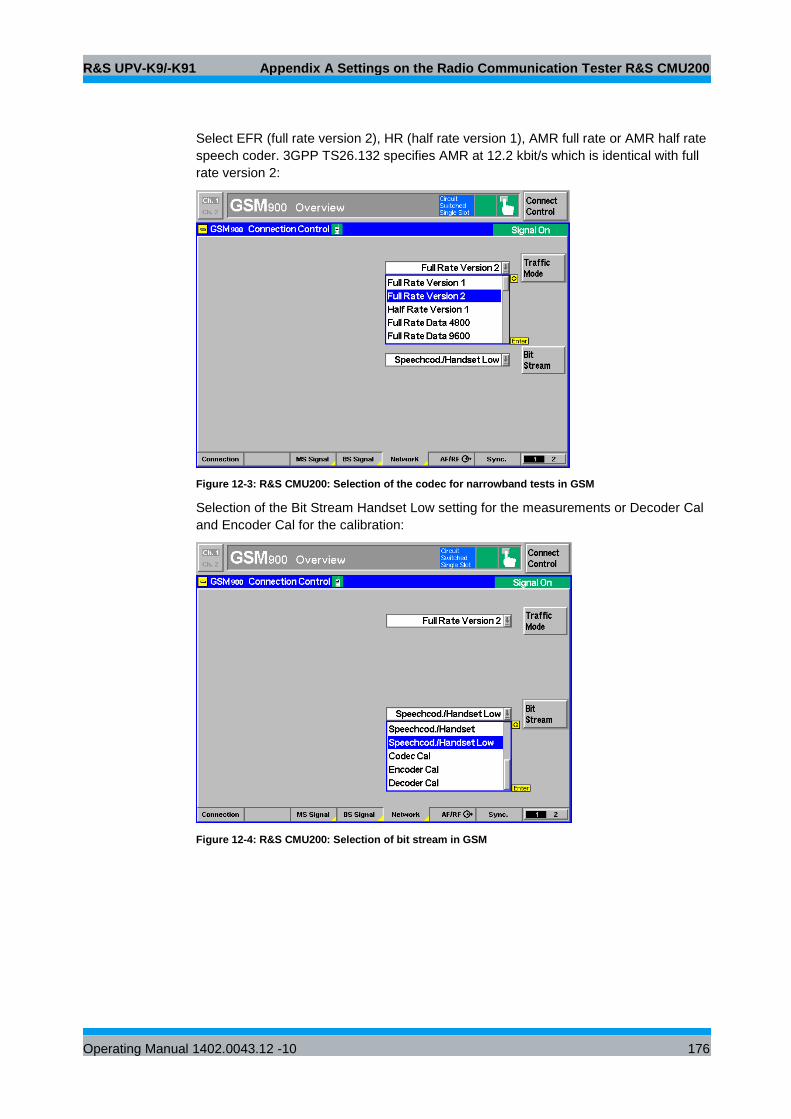
R&S UPV-K9/-K91 Appendix A Settings on the Radio Communication Tester R&S CMU200
Operating Manual 1402.0043.12 -10 176
Select EFR (full rate version 2), HR (half rate version 1), AMR full rate or AMR half rate
speech coder. 3GPP TS26.132 specifies AMR at 12.2 kbit/s which is identical with full
rate version 2:
Figure 12-3: R&S CMU200: Selection of the codec for narrowband tests in GSM
Selection of the Bit Stream Handset Low setting for the measurements or Decoder Cal
and Encoder Cal for the calibration:
Figure 12-4: R&S CMU200: Selection of bit stream in GSM
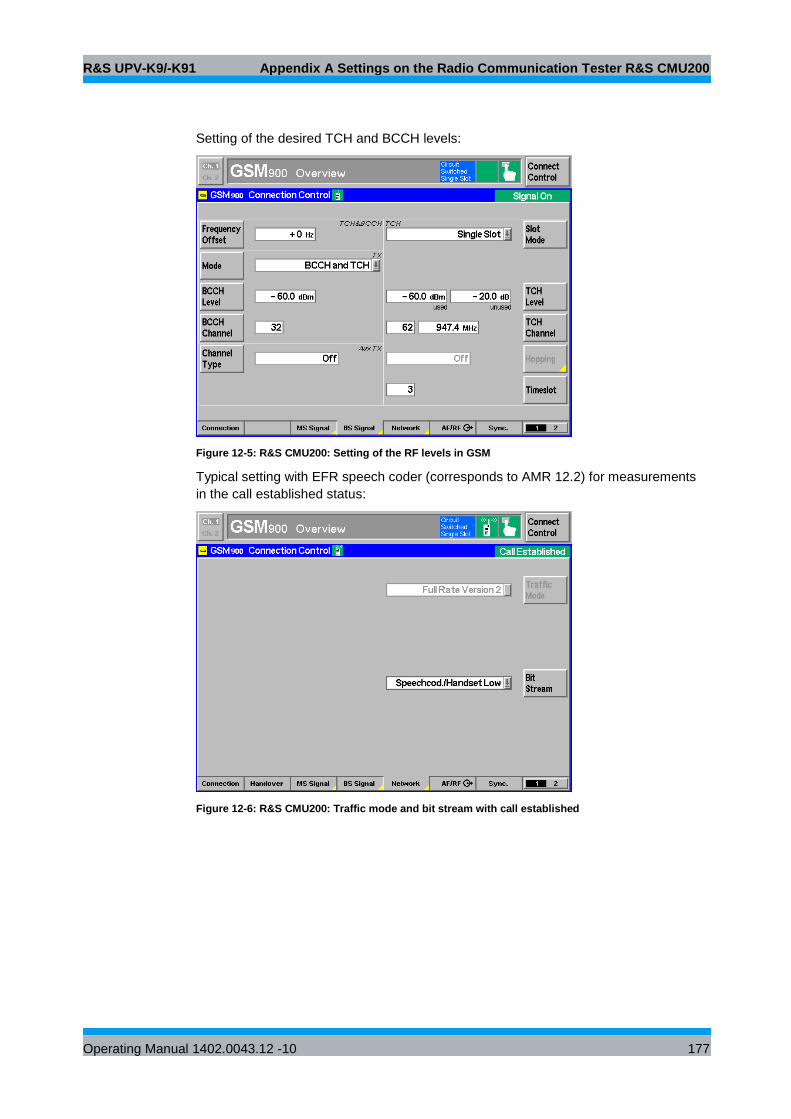
R&S UPV-K9/-K91 Appendix A Settings on the Radio Communication Tester R&S CMU200
Operating Manual 1402.0043.12 -10 177
Setting of the desired TCH and BCCH levels:
Figure 12-5: R&S CMU200: Setting of the RF levels in GSM
Typical setting with EFR speech coder (corresponds to AMR 12.2) for measurements
in the call established status:
Figure 12-6: R&S CMU200: Traffic mode and bit stream with call established
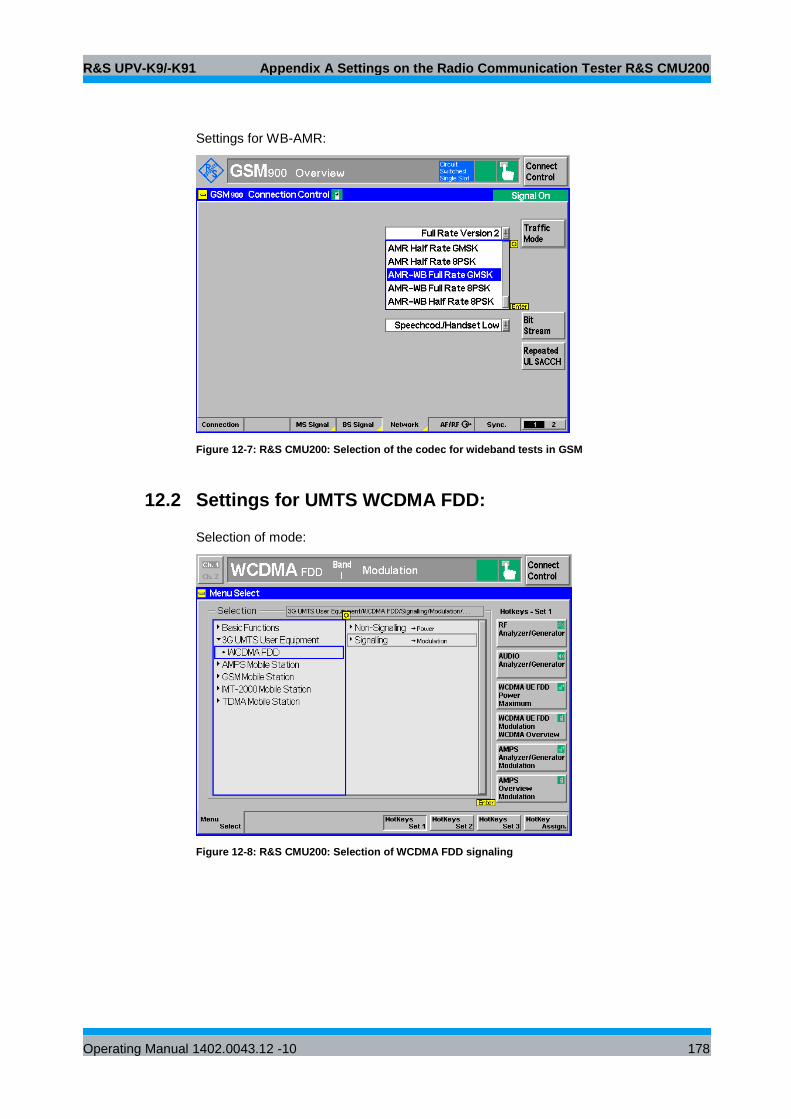
R&S UPV-K9/-K91 Appendix A Settings on the Radio Communication Tester R&S CMU200
Operating Manual 1402.0043.12 -10 178
Settings for WB-AMR:
Figure 12-7: R&S CMU200: Selection of the codec for wideband tests in GSM
12.2 Settings for UMTS WCDMA FDD:
Selection of mode:
Figure 12-8: R&S CMU200: Selection of WCDMA FDD signaling
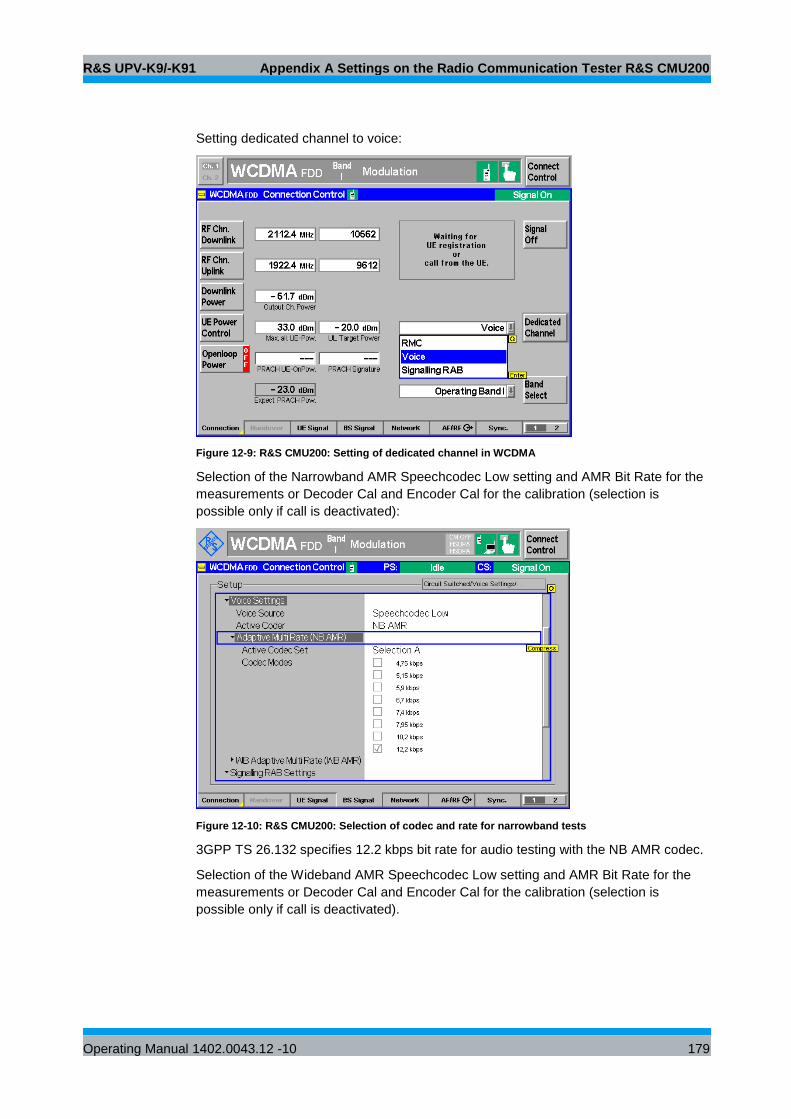
R&S UPV-K9/-K91 Appendix A Settings on the Radio Communication Tester R&S CMU200
Operating Manual 1402.0043.12 -10 179
Setting dedicated channel to voice:
Figure 12-9: R&S CMU200: Setting of dedicated channel in WCDMA
Selection of the Narrowband AMR Speechcodec Low setting and AMR Bit Rate for the
measurements or Decoder Cal and Encoder Cal for the calibration (selection is
possible only if call is deactivated):
Figure 12-10: R&S CMU200: Selection of codec and rate for narrowband tests
3GPP TS 26.132 specifies 12.2 kbps bit rate for audio testing with the NB AMR codec.
Selection of the Wideband AMR Speechcodec Low setting and AMR Bit Rate for the
measurements or Decoder Cal and Encoder Cal for the calibration (selection is
possible only if call is deactivated).
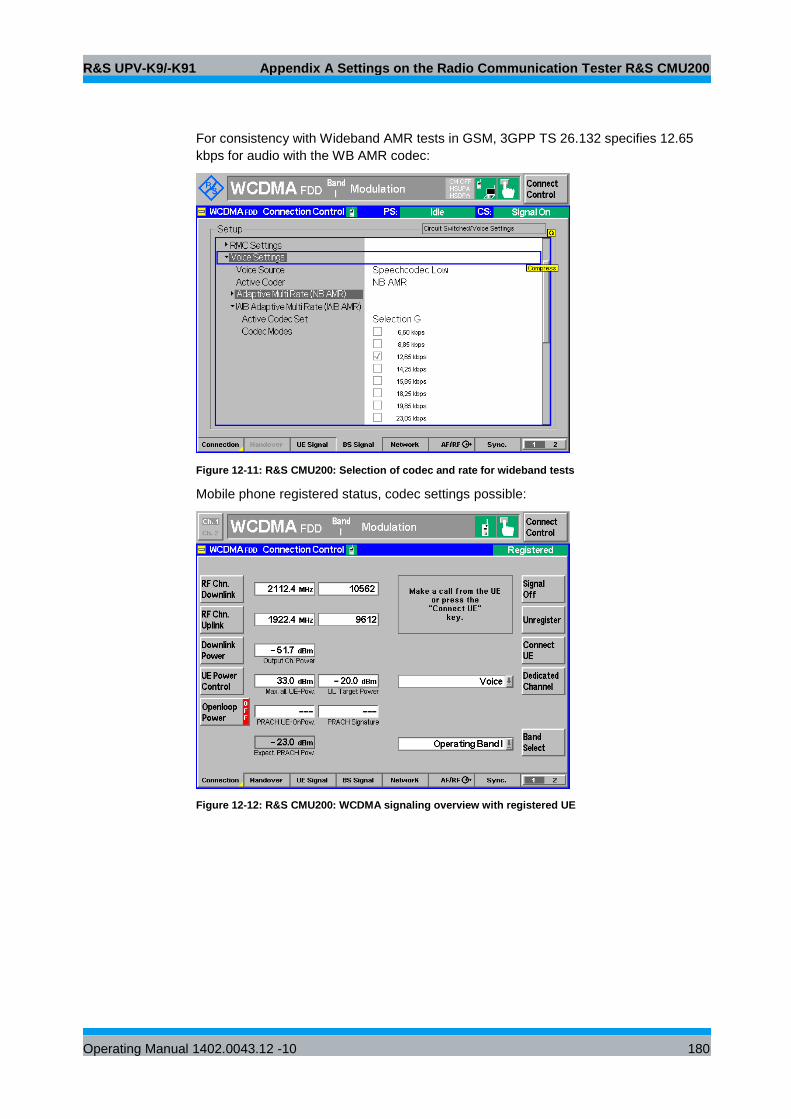
R&S UPV-K9/-K91 Appendix A Settings on the Radio Communication Tester R&S CMU200
Operating Manual 1402.0043.12 -10 180
For consistency with Wideband AMR tests in GSM, 3GPP TS 26.132 specifies 12.65
kbps for audio with the WB AMR codec:
Figure 12-11: R&S CMU200: Selection of codec and rate for wideband tests
Mobile phone registered status, codec settings possible:
Figure 12-12: R&S CMU200: WCDMA signaling overview with registered UE
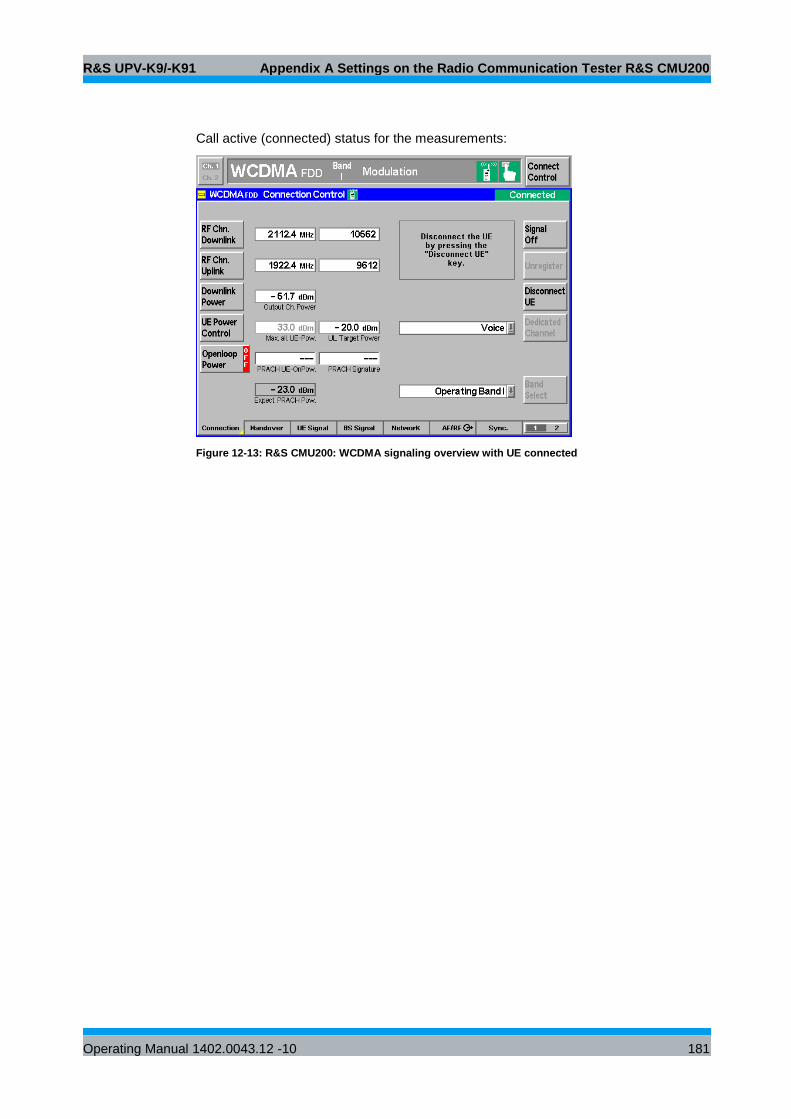
R&S UPV-K9/-K91 Appendix A Settings on the Radio Communication Tester R&S CMU200
Operating Manual 1402.0043.12 -10 181
Call active (connected) status for the measurements:
Figure 12-13: R&S CMU200: WCDMA signaling overview with UE connected
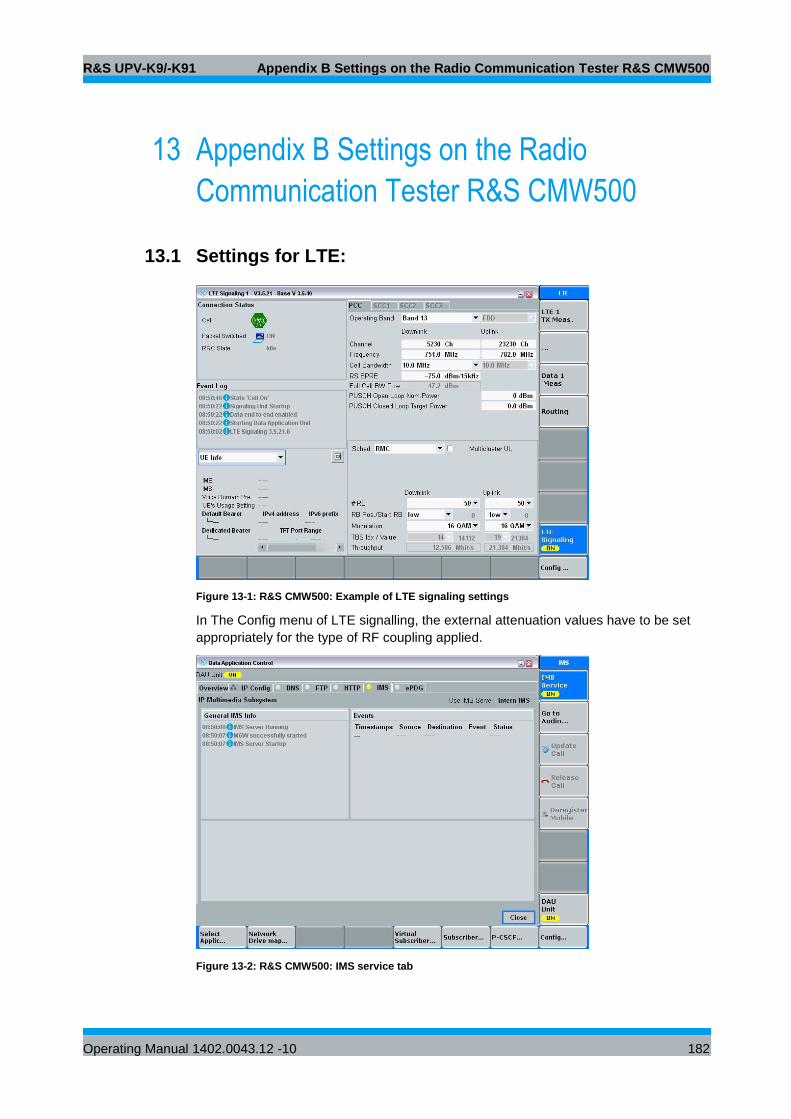
R&S UPV-K9/-K91 Appendix B Settings on the Radio Communication Tester R&S CMW500
Operating Manual 1402.0043.12 -10 182
13 Appendix B Settings on the Radio
Communication Tester R&S CMW500
13.1 Settings for LTE:
Figure 13-1: R&S CMW500: Example of LTE signaling settings
In The Config menu of LTE signalling, the external attenuation values have to be set
appropriately for the type of RF coupling applied.
Figure 13-2: R&S CMW500: IMS service tab
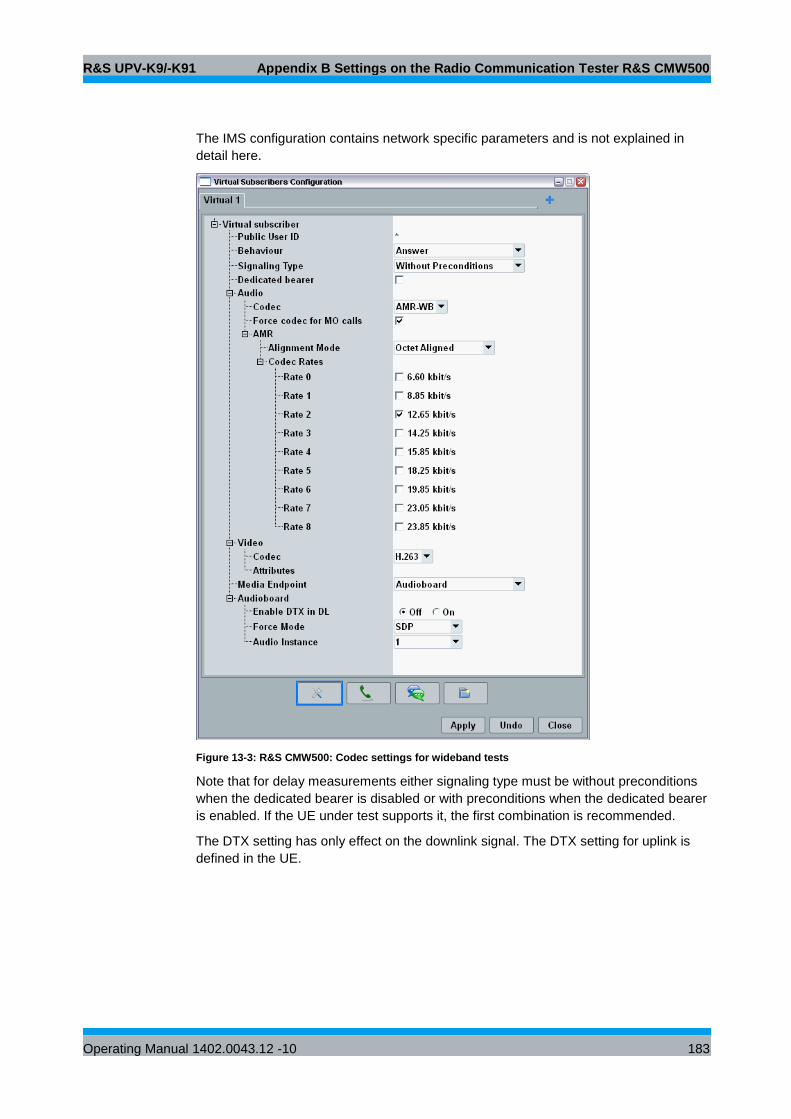
R&S UPV-K9/-K91 Appendix B Settings on the Radio Communication Tester R&S CMW500
Operating Manual 1402.0043.12 -10 183
The IMS configuration contains network specific parameters and is not explained in
detail here.
Figure 13-3: R&S CMW500: Codec settings for wideband tests
Note that for delay measurements either signaling type must be without preconditions
when the dedicated bearer is disabled or with preconditions when the dedicated bearer
is enabled. If the UE under test supports it, the first combination is recommended.
The DTX setting has only effect on the downlink signal. The DTX setting for uplink is
defined in the UE.
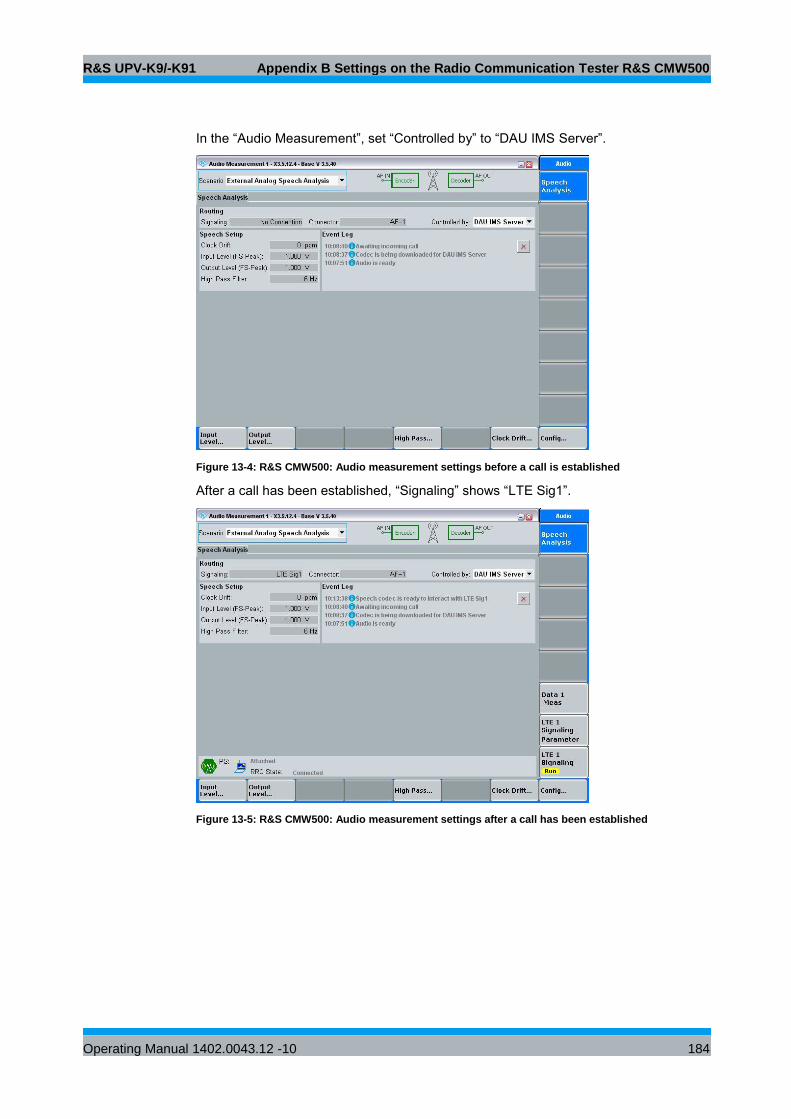
R&S UPV-K9/-K91 Appendix B Settings on the Radio Communication Tester R&S CMW500
Operating Manual 1402.0043.12 -10 184
In the “Audio Measurement”, set “Controlled by” to “DAU IMS Server”.
Figure 13-4: R&S CMW500: Audio measurement settings before a call is established
After a call has been established, “Signaling” shows “LTE Sig1”.
Figure 13-5: R&S CMW500: Audio measurement settings after a call has been established
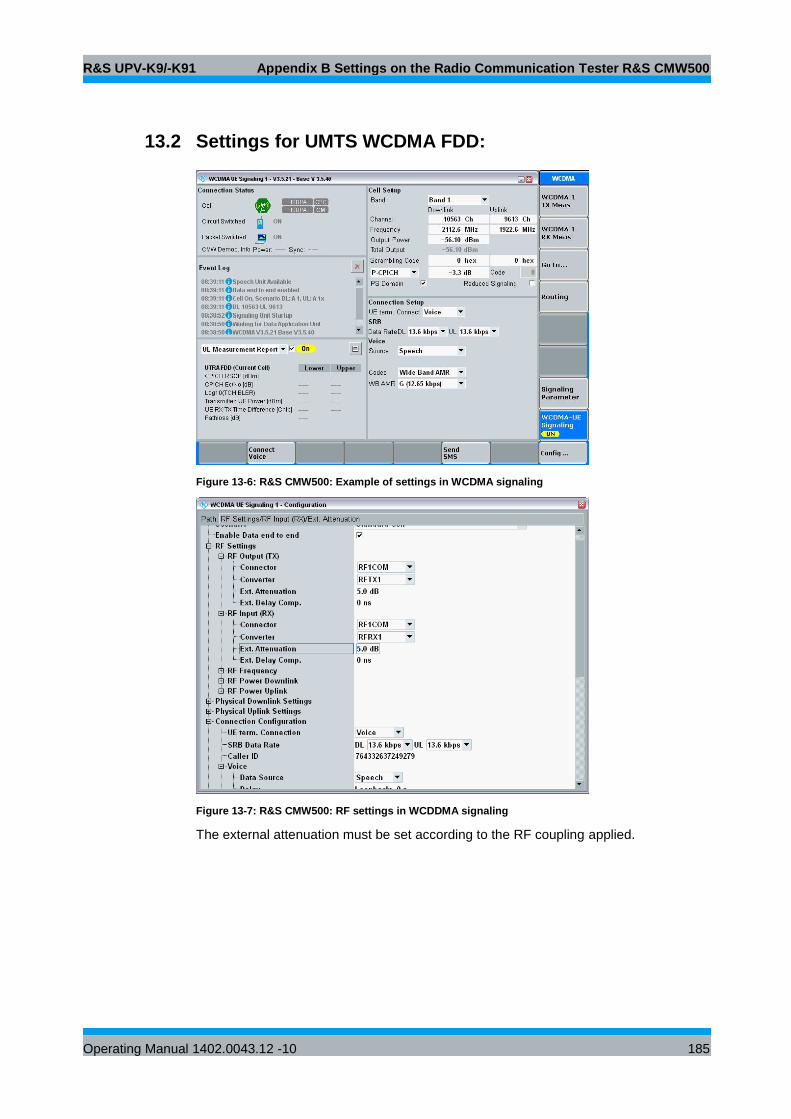
R&S UPV-K9/-K91 Appendix B Settings on the Radio Communication Tester R&S CMW500
Operating Manual 1402.0043.12 -10 185
13.2 Settings for UMTS WCDMA FDD:
Figure 13-6: R&S CMW500: Example of settings in WCDMA signaling
Figure 13-7: R&S CMW500: RF settings in WCDDMA signaling
The external attenuation must be set according to the RF coupling applied.
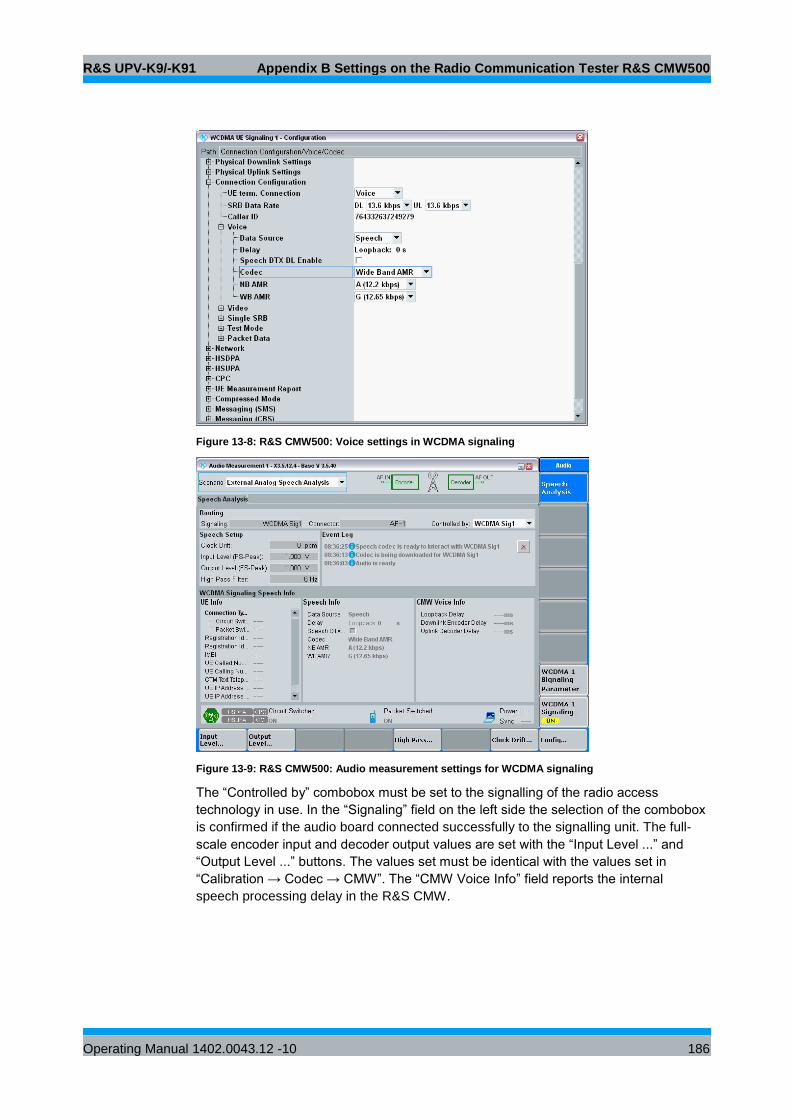
R&S UPV-K9/-K91 Appendix B Settings on the Radio Communication Tester R&S CMW500
Operating Manual 1402.0043.12 -10 186
Figure 13-8: R&S CMW500: Voice settings in WCDMA signaling
Figure 13-9: R&S CMW500: Audio measurement settings for WCDMA signaling
The “Controlled by” combobox must be set to the signalling of the radio access
technology in use. In the “Signaling” field on the left side the selection of the combobox
is confirmed if the audio board connected successfully to the signalling unit. The full-
scale encoder input and decoder output values are set with the “Input Level ...” and
“Output Level ...” buttons. The values set must be identical with the values set in
“Calibration → Codec → CMW”. The “CMW Voice Info” field reports the internal
speech processing delay in the R&S CMW.
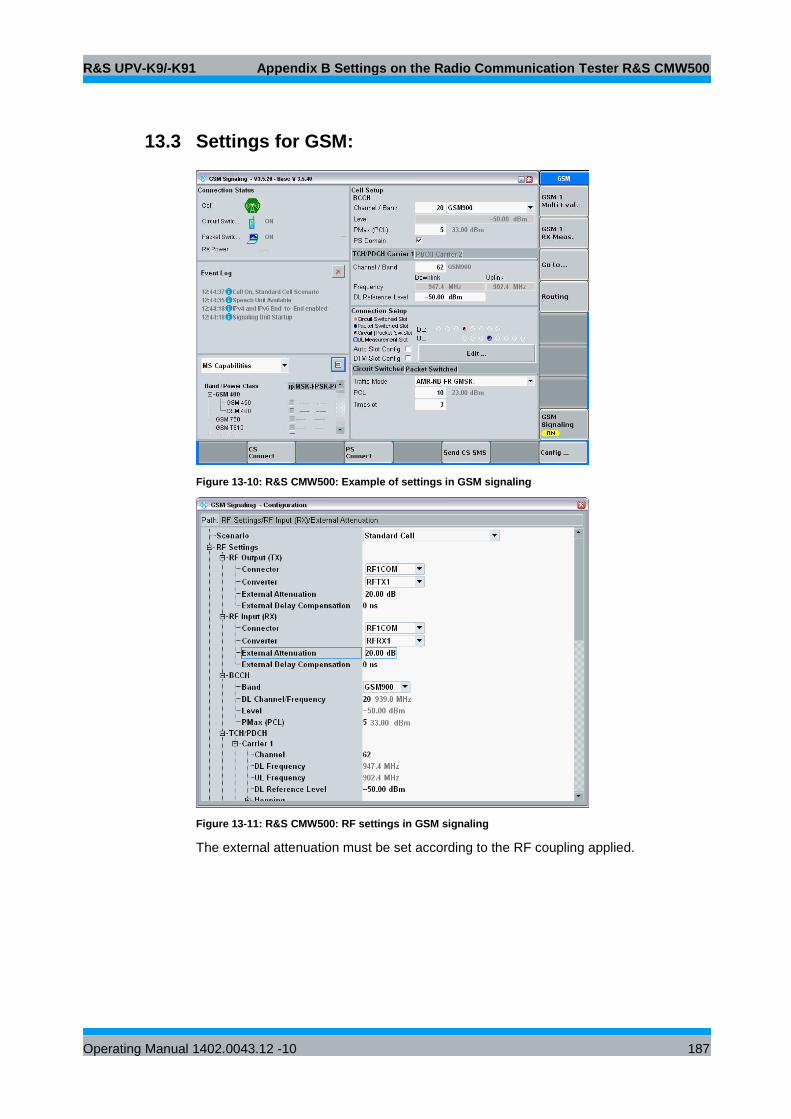
R&S UPV-K9/-K91 Appendix B Settings on the Radio Communication Tester R&S CMW500
Operating Manual 1402.0043.12 -10 187
13.3 Settings for GSM:
Figure 13-10: R&S CMW500: Example of settings in GSM signaling
Figure 13-11: R&S CMW500: RF settings in GSM signaling
The external attenuation must be set according to the RF coupling applied.
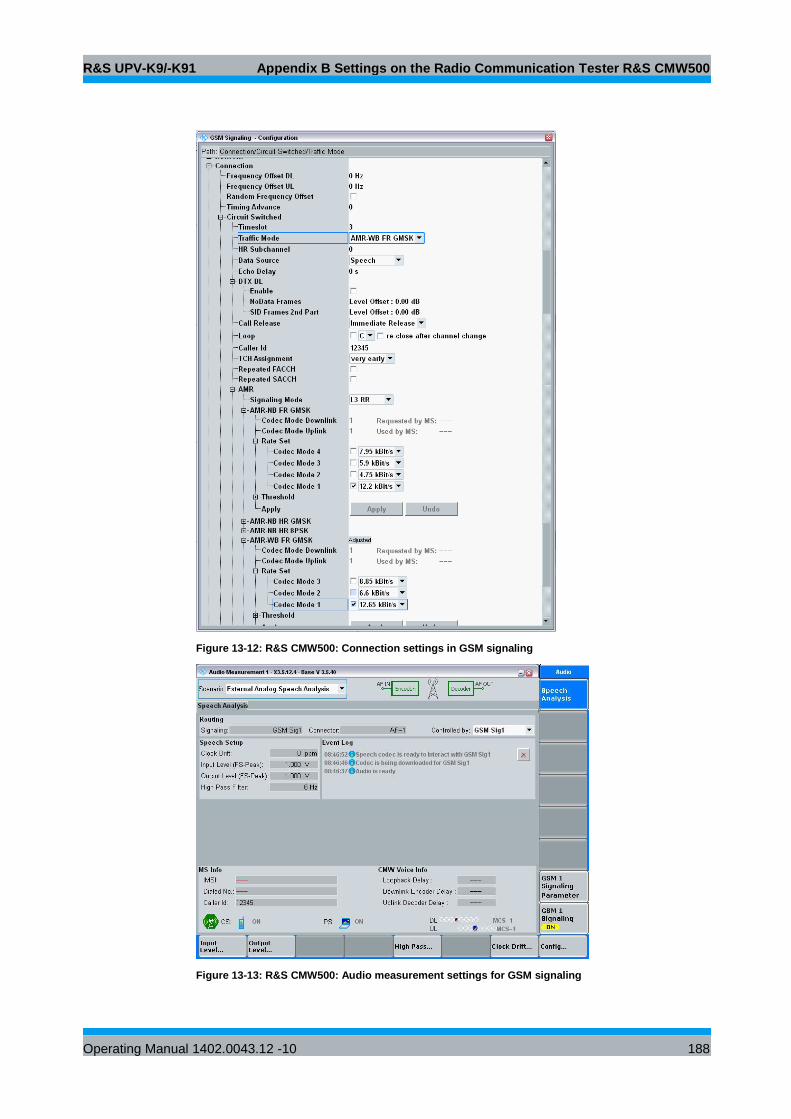
R&S UPV-K9/-K91 Appendix B Settings on the Radio Communication Tester R&S CMW500
Operating Manual 1402.0043.12 -10 188
Figure 13-12: R&S CMW500: Connection settings in GSM signaling
Figure 13-13: R&S CMW500: Audio measurement settings for GSM signaling
R&S UPV-K9/-K91 Appendix C Troubleshooting
Operating Manual 1402.0043.12 -10 189
14 Appendix C Troubleshooting
14.1 Error Message 2908 During Installation
Please contact customer support.
14.2 Damaged Setup File is Reported
If the program is unable to load the latest setup file, it will automatically offer to restore
a backup of the damaged file. Only if there is no backup available, or loading of the
backup fails again, the following procedure can be applied:
Copy Settings.sup from C:\Program Files\Rohde&Schwarz\UPV-K9x Mobile Phone
Tests” to “D:\3GPP”, overwriting the damaged file of the same name. Alternatively,
“D:\3GPP\settings.sup” may just be deleted. Subsequently all settings in the “Options”
menu have to re-done and for all used calibration types calibrated devices have to be
selected again.
14.3 Damaged Results File is Reported
There are backup files available of the file containing the test results, with appendix ~1
and ~2 to the file name of the results file (usually “D:\3GPP\Results.xml”). If the results
file cannot be opened for some reason, the program automatically offers to restore the
latest backup file.
If this does not work, a backup file can be renamed by removing the respective ~1 or
~2 extension, and opened subsequently. It is recommended to store the damaged
results file under a different name.
14.4 A Test is Not Starting Properly
Re-select devices for the calibration types required for the respective test, using menu
item Calibration Select device. If this does not solve the problem, copy all files from
“C:\Program Files\Rohde&Schwarz\UPV-K9x mobile phone tests\3GPP files\Overwrite”
to “D:\3GPP”, overwriting the existing files therein.
14.5 A Calibration Value is Missing or No Device is Selected
for a Required Calibration Type
If re-selecting the calibration device and re-calibrating it does not help, create a new
device with “Calibration New device”. Tick the “Immediately select this device” box
before clicking the “Ok” button and do the calibration for this device. All selected
devices and their calibration values can be checked with “Calibration Show selected
devices”.
R&S UPV-K9/-K91 Appendix C Troubleshooting
Operating Manual 1402.0043.12 -10 190
14.6 The Receiving Noise Test Produces an Overrange Error
Reduce the gain of the conditioning amplifier in the signal path of the artificial ear, re-
calibrate the artificial ear and re-try the test.
14.7 ARL for the Sending Distortion Test Cannot be Adjusted
First, try a sending test to see if the connection to the mobile is existing. If the RLR
value is too high, the sending sensitivity of the mobile under test may be too low to
adjust the ARL. If there is no signal in the sending test (SLR > 60 dB) check the
connection between R&S CMU200 and mobile. If no signal from the artificial mouth is
audible during the sending test, check the signal path between R&S UPV and artificial
mouth. Re-calibrate the artificial mouth.
14.8 A Measurement Using a Custom Limit Curve Produces an
Error
Limit files must start with a line containing “UPV LIMIT FILE”. They must be stored as
ASCII files with ANSI coding. Any other coding will produce an error. X and Y values
must be separated by a TAB character. Using space characters instead of a TAB
character will produce an error.
14.9 Other Problems of Unknown Reason
If the problem cannot be solved with the information given above, the folder “D:\3GPP”
can be renamed or deleted. At the next start of the application, this folder is created
anew with all files in default state. Note that this folder per default contains the test
results which should be copied to another location before deleting the folder.
Store a backup copy of the results file in a different folder before deleting “D:\3GPP”.
Subsequently all settings in the Options menu and all data entries have to be re-done,
all calibrated devices have to be created and calibrated again.

R&S UPV-K9/-K91
Operating Manual 1402.0043.12 -10 191