rainmakers: why bad weather means good...
TRANSCRIPT

Copyright © 2012 by Jooa Julia Lee, Francesca Gino, Bradley R. Staats
Working papers are in draft form. This working paper is distributed for purposes of comment and discussion only. It may not be reproduced without permission of the copyright holder. Copies of working papers are available from the author.
Rainmakers: Why Bad Weather Means Good Productivity Jooa Julia Lee Francesca Gino Bradley R. Staats
Working Paper
13-005 July 19, 2012

Rainmakers: Why Bad Weather Means Good Productivity
Jooa Julia Lee Harvard Kennedy School
Harvard University Cambridge, MA 02138
Tel: 617.495.8831 [email protected]
Francesca Gino
Harvard Business School Harvard University, Baker Library
Boston, MA 02163 Tel: 617.495.0875 Fax: 617.495.4191
Bradley R. Staats University of North Carolina at Chapel Hill
Campus Box 3490, McColl Building Chapel Hill, NC 27599-3490
Tel: 919.962.7343 Fax: 919.962.6949 [email protected]
Acknowledgments We thank Max Bazerman and Karim Kassam for their insightful comments on earlier drafts of this paper. We gratefully acknowledge the support of management at our field site. We greatly appreciate the support and facilities of the Harvard Decision Science Laboratory and the Harvard Business School Computer Laboratory for Experimental Research (CLER). This research was supported by Harvard Business School, the University of North Carolina at Chapel Hill’s Center for International Business Education and Research, and the University Research Council at the University of North Carolina at Chapel Hill. We are grateful to Will Boning, Nicole Ludmir, and Kanyinsola Aibana for their assistance in collecting and scoring the data for Study 2.

Rainmakers: Why Bad Weather Means Good Productivity
- 1 -
Abstract
People believe that weather conditions influence their everyday work life, but to date, little is known
about how weather affects individual productivity. Most people believe that bad weather conditions
reduce productivity. In this research, we predict and find just the opposite. Drawing on cognitive
psychology research, we propose that bad weather increases individual productivity by eliminating
potential cognitive distractions resulting from good weather. When the weather is bad, individuals may
focus more on their work rather than thinking about activities they could engage in outside of work. We
tested our hypotheses using both field and lab data. First, we use field data on employees’ productivity
from a mid-size bank in Japan, which we then match with daily weather data to investigate the effect of
bad weather conditions (in terms of precipitation, visibility, and temperature) on productivity. Second, we
use a laboratory experiment to examine the psychological mechanism explaining the relationship between
bad weather and increased productivity. Our findings support our proposed model and suggest that
worker productivity is higher on bad rather than good weather days. We discuss the implications of our
findings for workers and managers.
Key Words: Weather, Productivity, Opportunity Cost, and Distractions.
1. Introduction
The determinants of work productivity are often understood to be within an organization’s
control. Consequently, organizations employ a variety of strategies to boost worker productivity. These
strategies include workflow designs to avoid system bottlenecks as well as incentives and varying task
assignments to increase workers’ motivation and capitalize on their abilities (e.g., KC and Terwiesch,
2009; Schultz, Schoenherr, and Nembhard, 2010; Staats and Gino, 2012). However, these strategies often
fail to account for powerful exogenous factors, such as weather conditions on a given day, that may
influence worker productivity. Despite the potential significance of weather as an exogenous influence,
studies investigating the role of weather in worker productivity have been scarce.
In this paper, we seek to understand how such an incidental factor could affect worker
productivity. To gain insight into how people intuitively think about this relationship, we asked 198 adults
to predict the impact of weather on individuals’ work productivity.1 Among our respondents, 82.32%
stated that good weather conditions would increase productivity and only 17.68% responded that it would
decrease productivity, z(198)=23.82, p<.001. Also, 82.83% responded that bad weather conditions would
decrease productivity, and only 17.17% reported that it would increase productivity, z(198)= -24.59, 1 We recruited 198 adults (Mage=38, SD=14.19; 42% male) from the Boston/Cambridge area to participate in a two-minute long online survey that was part of a one-hour long series of studies that participants completed for $20.
Rainmakers: Why Bad Weather Means Good Productivity
- 2 -
p<.001. These survey results indicate that people indeed believe that weather will impact their
productivity and that bad weather conditions in particular will be detrimental to productivity.
This conventional wisdom may be based on the view that bad weather induces a negative mood
and therefore yields harmful effects on executive functions (Keller et al. 2005). In contrast to this view,
we propose that bad weather actually increases productivity through an alternative psychological route.
We posit that the positive effects of bad weather on productivity stem in part from the probability that
people may be more cognitively distracted by the outdoor activities available to them on good weather
days. Consequently, workers will be less distracted and more focused on bad weather days, when such
outside options do not exist, and therefore will perform their tasks more effectively. Thus, in this paper
we propose and test a cognitive mechanism rather than an emotional one, namely the distraction created
by thinking about attractive outside options, and suggest it is detrimental to worker productivity.
To investigate our predictions, we used empirical data on worker productivity, measured by
individual performance on data-entry tasks from both the field and the lab. First, we obtained two-and-a-
half years of transaction data from the home loan application processing line at a mid-sized Japanese
bank. The bank’s data allowed us to control for individual and organizational factors that affect worker
productivity and then examine the relationship between weather and worker productivity. Second, we
conducted a randomized experiment in the controlled setting of a laboratory using a similar data-entry
task to identify a mechanism by which weather conditions influence productivity. In both studies, we
operationalized the completion time for individual data-entry tasks as our key dependent variable.
2. Psychological Mechanisms of the “Weather Effect” on Productivity
Researchers have investigated the effect of weather on everyday phenomena, such as stock
market returns (Saunders, 1993; Trombley, 1997; Hirshleifer and Shumway, 2003; Goetzmann and Zhu,
2005), tipping (Rind, 1996; Rind and Strohmetz, 2001), consumer spending (Murray, Di Muro, Finn, and
Leszczyc, 2010), aggression in sports (Larrick et al., 2011), and willingness to help (Cunningham, 1979).
These studies have found that the indicators for good weather are generally associated with positive
outcomes, such as higher stock-market returns, more prosocial behavior, and more spending (consumer
purchasing and tipping). All these studies have focused on contexts outside of traditional work settings,
where the weather directly impacts people’s actions (e.g., high temperatures during a baseball game
increase aggression because they trigger anger; see Larrick et al., 2011).
Very few studies, however, have directly investigated the effect of weather on productivity at
work. One notable exception is research by Cachon, Gallino, and Olivares (2011). Using weekly
production data from automobile plants over a ten-year period, these scholars found that regions that had
more days of severe weather (such as snowstorms) experienced significant aggregate production loss for
factories as compared with regions that have good weather conditions. The researchers suggested that the
Rainmakers: Why Bad Weather Means Good Productivity
- 3 -
loss in factory production was likely due to physical disruptions, such as difficulty getting to work or
delivering supplies, rather than low worker productivity. Thus, the study focused on how weather directly
influenced suppliers’ and workers’ behaviors by creating obstacles in the way they commonly operate. To
date, no studies have examined potential psychological mechanisms through which weather affects
individual worker productivity, which is the focus of our current investigation.
2.1. Effect of Weather on Affect and Cognition
In the field of psychology, weather has been studied primarily in an attempt to understand its
affective consequences, and how affect due to weather then influences individual judgment and behavior.
In particular, past research suggests that several indicators of favorable weather conditions are associated
with positive moods. This work therefore used weather to induce either positive or negative moods (more
sunlight: Cunningham, 1979, Parrott and Sabini, 1990, and Schwarz and Clore, 1983; low humidity:
Sanders and Brizzolara, 1982; high barometric pressure: Goldstein, 1972, Keller et al., 2005; and high
temperature, Cunningham, 1979, Howarth and Hoffman, 1984, and Keller et al., 2005) and then examined
the consequences of weather on people’s attitudes (e.g., their life satisfaction; see Schwarz and Clore,
1983), judgment and behavior (e.g., aggression towards others; see Larrick et al., 2011). In addition,
clinical psychologists have identified the harmful effects of seasonal affective disorder, in which
seasonally recurrent symptoms of sadness and depression occur in winter months when the temperatures
drop and the days grow short (Rosenthal et al., 1984; Kasper et al., 1989).
As suggested by this research, weather conditions can indeed induce positive and negative affect,
and, as a result, have significant effects on individuals’ judgment, behavior, and decision-making.2 These
relationships can be explained using Schwarz and Clore’s (1983; 1988) affect-as-information model,
which proposes that, by providing individuals with information about how they have appraised a
situation, emotions affect their subsequent judgments. For example, someone may feel anxious because of
a negotiation that person has the same day. This person may interpret the anxiety as a sign that too much
uncertainty exists for her to reach a deal with her counterpart. That anxiety, in turn, may lead her to make
concessions quickly and look for ways to exit the negotiation (Brooks and Schweitzer, 2011). Schwarz
and Clore (1983; 1988) argue that positive affect tends to encourage less constrained, less effortful, and
more heuristic information processing and creative problem solving, whereas negative affect tends to
foster more controlled, effortful, vigilant, and systematic information processing.
2 In the last few decades, an increasing number of scholars have examined the effects of affect on individuals’ decisions (e.g. Forgas, 1995; Isen, 1993; Lerner and Keltner, 2000; Lerner and Tiedens, 2006). A large part of this literature has focused on the consequences of experiencing specific emotions (e.g., anger, fear, happiness). In this view, emotions are different from moods or affect, which are more global feelings (i.e., positive or negative) based on valence. In our paper, we refer to affect in general.
Rainmakers: Why Bad Weather Means Good Productivity
- 4 -
To test this model, Forgas, Goldenberg, and Unkelbach (2009) conducted a field study where
shoppers saw 10 unusual objects in the checkout area of a suburban shop, on either a sunny or a rainy day,
and were asked to recall these objects later. The researchers found that negative mood induced by bad
weather improved real-life memory accuracy and higher discrimination ability, as measured by the
number of items recognized and recalled correctly. On the other hand, Keller et al. (2005)’s correlational
and experimental studies suggest that positive moods induced by higher temperature and barometric
pressure led to higher working memory (as measured by higher spans of digits remembered) and more
flexible thinking styles. In addition, they found that the amount of time spent outdoors and the season
moderated the effects of weather on mood and cognition. The effect of good weather on broadened
cognition was more pronounced for those who spent more than 30 minutes outdoors; this pattern was
reversed for those who spent less than 30 minutes outdoors. In addition, higher temperatures predicted
better cognitive abilities in springtime and worsened cognitive abilities in the summer. Taken together,
this research shows how good versus bad weather conditions may have cognitive consequences that
influence how individuals process and interpret information by inducing positive or negative affect.
While the above-referenced studies support the idea of a weather-mood hypothesis, a number of
other papers fail to find an effect, suggesting that factors other than affect may be at work. For example,
Clark and Watson (1988) measured the daily mood of 18 college students over a three-month period
(1,613 observations) in Kyoto, Japan, and did not find significant correlations between self-reported mood
and weather variables. As a follow-up, Watson (2000) collected extensive affect data from 478 students
and weather data in Texas (a total of 20,000 observations); no correlations between affect and weather
variables were found. These results suggest that the relationship between weather and affect may not be
as straightforward as initially conceived. For example, a study by Klimstra et al. (2011) suggests that
there may be individual differences in people’s responses to weather conditions (“weather reactivity”);
specifically, the relationship between weather and affect depends on individuals’ preference for bad
weather days.
These null findings and qualifications to the weather-mood hypothesis open the possibility for an
alternative hypothesis. We propose that a factor that is cognitive rather than affective may come into play
in explaining the role of weather in productivity at work, namely the salience of outside options. We
argue that individuals may be more likely to be cognitively distracted when the weather is good rather
than bad, as they are more likely to think about how they could spend their time outside enjoying the
good weather. In addition, bad weather conditions may have an opposite effect, as people may think less
about what they could be doing outside, thus allowing them to focus better on work-related tasks. Our
proposed model is summarized in Figure 1.

Rainmakers: Why Bad Weather Means Good Productivity
- 5 -
When working on a given task, people generally tend to think, at least somewhat, about personal
priorities unrelated to that task (Giambra, 1995; Killingsworth and Gilbert, 2010). Smallwood and
Schooler (2006) theorized that task-unrelated thoughts are similar to other goal-related processes in that
they can be engaged in without explicit awareness, even though they are not directed toward the given
task. Thus, when the mind wanders, attention shifts away from the given task and may lead to failures in
task performance (Robertson et al., 1997). For instance, Manly, Robertson, Galloway, and Hawkins
(1999) found that absentmindedness predicted errors on an attention task, thus indicating that mind
wandering is associated with a failure in controlled processing. Prior work notes that general cognitive
interference can be costly in terms of worker focus on productivity (for a review, see Jett and George,
2003). Workers who experience cognitive interference are distracted, thus showing an inability to focus
on a task (Fisher, 1998) and a greater likelihood to commit errors while completing the task (Flynn et al.,
1999). For instance, Flynn and her collaborators (1999) studied the relationship between interruptions,
distractions, and the frequency of dispensing errors in filling prescription labels by observing the
pharmacists and technicians at an ambulatory care pharmacy at a hospital. The researchers found that
interruptions and distractions were significantly correlated with errors, 80% of which involved incorrect
labeling of information.
Drawing on these studies on task-unrelated thoughts, we theorize that thoughts related to salient
(and attractive) outdoor activities come into mind more easily on a good weather day than on a bad
weather day. Consistent with our theorizing, Simonsohn (2010) found that cloud cover during the college
visits of prospective students was a significant predictor of whether students enrolled in the visited
school; visitors on a cloudier day were significantly more likely to enroll than were those who visited on a
sunnier day. Cloudy weather reduced the opportunity costs of outdoor activities, such as sports or hiking,
and thus increased the attractiveness of academic activities (see also Simonsohn, 2007).
Research also shows that bad weather conditions may lead people to prefer spending time at work
since attractive outside options are not available to them (e.g., Connolly, 2008; Zivin and Neidell, 2010).
Connolly (2008) found that precipitation increases time spent at work, as leisure is less enjoyable on rainy
days. In related research, Zivin and Neidell (2010) found that, during times of extremely high outdoor
temperatures, workers substituted work for leisure in order to stay in climate-controlled environments.
Thus, people are less likely and less motivated to think about outdoor activities on bad weather days (e.g.,
when it is raining), as these options are not feasible; by contrast, feasible outdoor activities are likely to be
more salient in people’s minds on good weather days.
Thinking about salient and attractive outside options is a form of task-unrelated thinking that
serves as a cognitive distraction. Such distraction shifts workers’ attention away from the task at hand.
Accordingly, we expect that it would be harder to maintain one’s task-related thoughts on a good weather
Rainmakers: Why Bad Weather Means Good Productivity
- 6 -
day than on a bad weather day. As a result, we also predict that workers will make more mistakes on good
weather days, which, in turn, will decrease their overall work productivity. More specifically, we argue
that on a bad weather day, individuals will have a higher ability to focus on the given work task not
because of the negative mood induced by the weather, but because fewer distracting thoughts related to
outdoor activities will be readily available in their minds. Consequently, they will be able to better
concentrate on their tasks and work more productively on bad weather days. In our research, we consider
tasks where productivity requires high levels of attention and focus, which allow workers to complete
their work faster. Thus, we expect fewer cognitive distractions to be associated with lower error rates on a
given task and to lead to higher levels of work productivity. Taken together, these arguments lead to the
following hypotheses:
HYPOTHESIS 1: Bad weather conditions, such as rain or low visibility, will increase
worker productivity.
HYPOTHESIS 2: Bad weather conditions will increase worker productivity by decreasing
the salience of one’s outside options.
HYPOTHESIS 3: The relationship between the salience of one’s outside options and
productivity will be mediated by higher error rates on the task, a direct
consequence of greater cognitive distractions.
2.2. The Present Research
We test our hypotheses in two studies. First, we use field data on employees’ productivity from a
mid-size bank in Japan, which we then match with daily weather data to test Hypothesis 1’s proposed link
between weather conditions and productivity. Second, we use a laboratory experiment to test Hypotheses
2 and 3, namely to examine the psychological mechanism explaining why bad weather might increase
productivity. Because weather conditions cannot be directly manipulated, in Study 2 we vary the salience
of outside options available to study participants in addition to conducting study sessions during bad
weather and good weather days. Using this design, we expect to find an interaction between weather
conditions and exposure to outside options in predicting productivity at work (consistent with our second
hypothesis). Specifically, in good weather conditions, we predict that exposure to outside options will not
affect productivity because the outside options are already salient in the worker’s mind even when they
are not primed. On the other hand, in bad weather conditions, the distracting effect of outside options on
productivity will be more pronounced when outside options are made salient since they are not by default
in the worker’s mind. Thus, we hypothesize that the significant interaction between weather conditions
and exposure to salient outside options will provide evidence for the mechanisms by which bad weather
increases productivity.

Rainmakers: Why Bad Weather Means Good Productivity
- 7 -
Rather than assessing cognitive distractions by using a self-reported measure, we use a behavioral
measure of cognitive distractions: errors people make as they work on a data-entry task. In our field data,
error rates are too low to be examined. Thus, we designed Study 2 so that we could record error rates. We
predict that the effect of task-unrelated thoughts on productivity is explained specifically by the extent to
which workers are prone to making errors (i.e., the extent to which they are cognitively distracted) and
not by directly decreasing their working memory needed to complete the task.
3. Study 1: Field Evidence from a Japanese Bank
3.1. Setting and Data
Study 1 examines the relationship between weather and worker productivity using archival data
from a Japanese bank’s home loan mortgage processing line. Workers at the bank conducted the 17 data
entry tasks required to move from a paper loan application to a loan decision. The tasks included steps
such as entering a customer’s personal data (such as name, address, phone number, etc.), requesting a
credit report, and entering information from a real estate appraisal.3 Individuals worked at a desk with a
computer and two monitors. On one monitor, the work to be completed was displayed (e.g., a scan of the
application form from which data was being entered); on the other monitor, the individual entered the
data into the bank’s information technology system. Workers completed one task at a time (i.e., one of 17
steps for one loan); when a task was completed, the system assigned the worker a new task (typically the
same type of task, unless there was a delay in processing another type of task). The room in which the
work took place had windows through which workers could observe the weather. In addition, workers
could, and often did, leave the building for lunch breaks. Workers were paid a flat-fee for their work;
there was no piece-rate incentive to encourage faster completion of work.
Starting on June 1, 2007, the bank launched the new IT-based, mortgage processing line
described above. Our data includes information on the line from this date until December 30, 2009, a two-
and-a-half year time period. During this time period, the bank processed 56,227 loan applications, which
included 601,788 individual tasks. One hundred and forty workers completed these tasks; however, 29 of
the workers each completed less than 200 transactions. Twenty-four of the workers were either temporary
workers or individuals who left the bank during their initial two-week probationary period. The remaining
five individuals were managers who would sometimes complete transactions. We drop these individuals,
leaving us with 111 workers who completed 598,393 transactions. The bank’s IT system recorded
information on each task that was processed on the line and, as detailed below, we use this information to
construct the variables used in this study.
3 The 17 steps were: Custodian 1 and 2, Document tagging 1 and 2, Application capture 1, 2, 3, and 4, Preliminary information 1 and 2, Credit check 1 and 2, Income tax 1 and 2, Real estate appraisal 1 and 2, and Credit approval.
Rainmakers: Why Bad Weather Means Good Productivity
- 8 -
In addition to the information on worker productivity, we also assembled data on weather
conditions in Tokyo, where the individuals worked. The National Climactic Data Center of the U.S.
Department of Commerce collects meteorological data from stations around the world. Information for a
location, such as Tokyo, is calculated as a daily average and includes summaries for temperature,
precipitation amount, and visibility.
3.1.1. Dependent Variable
Completion Time. We evaluate worker productivity by using the measure of completion time. In
the operations management literature, the length of time it takes to complete a task is a commonly used
metric to assess individual productivity (e.g., Reagans, Argote and Brooks 2005; KC and Terwiesch
2009). To calculate completion time, we take the natural log of the number of minutes a worker spent to
complete the focal task. We use the natural log because, as we detail below, we eventually conduct our
analyses using a log-linear learning curve model.
3.1.2. Independent Variables
We begin our examination of the impact of bad weather on worker productivity by considering
three measures of weather:
Rain. The weather station measures the amount of precipitation each day in inches, down to the
hundredth of an inch.
Temperature. The data reports the average temperature in degrees Fahrenheit for each day of our
data. Given that we expect worse weather to lead to lower productivity, productivity should be higher for
both low temperatures and high temperatures. Therefore, we enter both a linear and quadratic term for
temperature in order to capture this potential non-linearity.
Visibility. Finally, each weather station records the average daily visibility in miles (to the tenth
of a mile).
3.1.3. Control Variables
We control for variables that have been shown to affect worker productivity, as detailed in Table
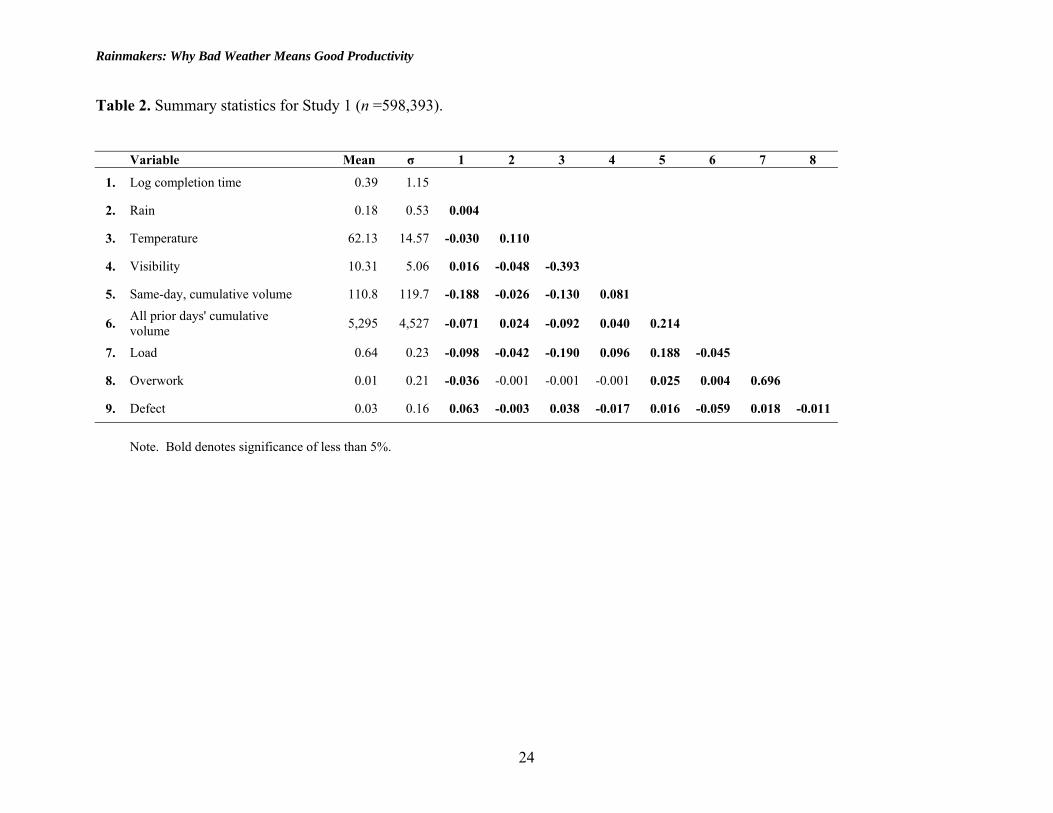
1. We also control for the month in which the work took place to account for seasonal effects. In Table 2,
we provide our summary statistics for all variables.
3.2. Empirical Approach
For our empirical approach, we use a log-linear learning curve model to address the fact that
individuals’ performance improves over time with experience. As noted by prior work (Lapré and
Tsikriktsis 2006), a log-linear model does not suffer from bias if workers have prior experience; by
contrast, a log-log model will have bias concerns. While our data captures the start time for the entire line,
some individual stations came on line before our data began. Using this approach, we conduct our
analyses at the transaction level. Therefore, in our models, we control for the effects of the worker, task,
Rainmakers: Why Bad Weather Means Good Productivity
- 9 -
and operating system, and then examine the effect of weather on worker productivity. Because our data
includes every transaction that each individual executed on the mortgage servicing line over the previous
two-and-a-half years, we require a model that will account for autocorrelation, contemporaneous
correlation, and heteroskedasticity (Beck 2001; Lapré and Tsikriktsis 2006). As recommended by Lapré
and Tsikriktsis (2006), we use Prais-Winsten regression with panel-corrected standard errors adjusted for
heteroskedasticity and panel-wide, first-order autocorrelation.
3.3. Results and Discussion
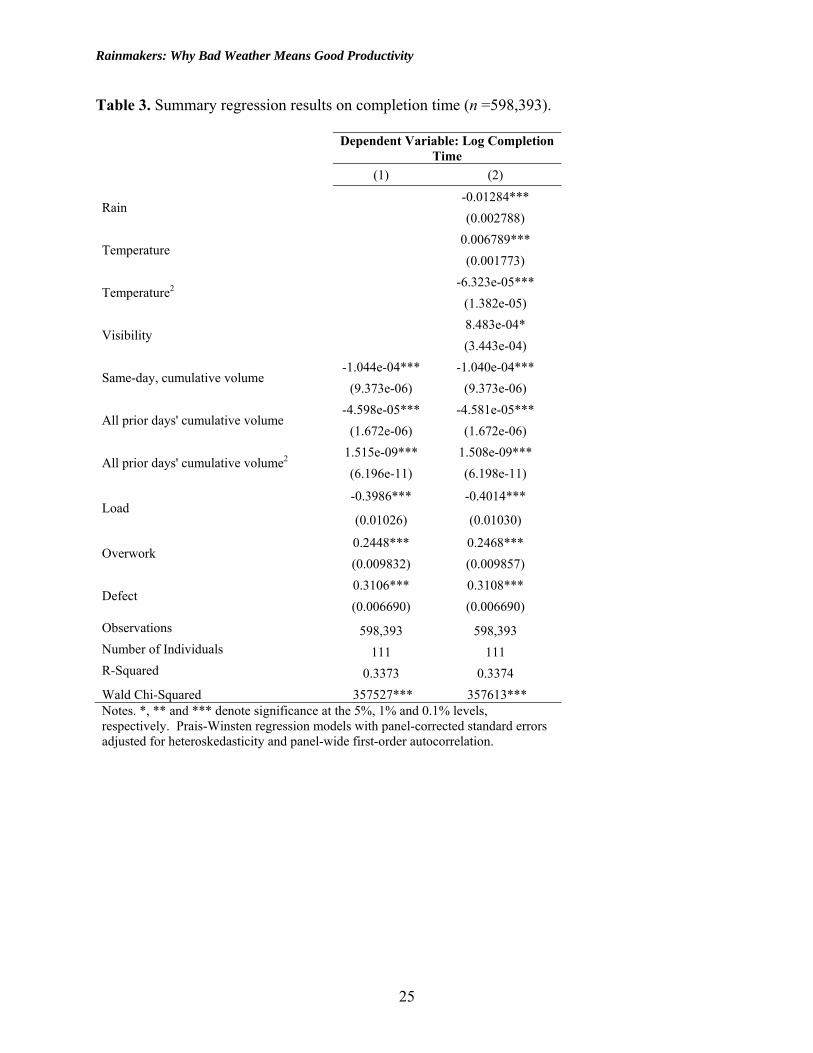
Column 1 in Table 3 shows our model with only the control variables; Column 2 adds our
weather-related variables, in order to test Hypothesis 1. First, examining rain, we find that the coefficient
is negative and significant (coefficient = -0.01284). In terms of the effect size, we find that a one standard
deviation increase in rain is related to a 0.7% decrease in worker completion time. Moving next to
temperature, we see evidence of an inverted U-shaped relationship between temperature and completion
time, which we depict in Figure 2. Worker completion time is fastest at low and high temperatures.
Finally, we examine the relationship between visibility and worker productivity, and find that the
coefficient on visibility is positive and statistically significant (coefficient = 8.483e-04). Interpreting the
coefficient, we find that a one standard deviation increase in visibility is related to a 1.2% increase in
completion time. Thus, on days with greater visibility, workers have slower completion times.
In conclusion, using a within-subject design, Study 1 shows that worse weather is related to better
worker productivity. While Study 1 supports Hypothesis 1 using data from a field setting, it does not
allow us to examine the mechanisms that may drive such behavior and thus test Hypotheses 2 and 3. We
now turn to a laboratory experiment to investigate these hypotheses. In particular, we focus our
investigation on the independent variable of rainy weather.
4. Study 2: Laboratory Data Entry Task
In this experiment, we vary two key characteristics of the experimental setting to understand the
underlying mechanism behind the bad weather-increased productivity relationship that we observed in the
field data. Specifically, we carefully chose the days on which we conducted the sessions of the study to
take advantage of natural variation, and then we experimentally manipulated subjects’ exposure to outside
options. As we argued, the salience of attractive outside options is directly linked to cognitive distractions
(see Figure 1). We chose weather conditions and manipulated exposure to outside options so that we
could test for the mediating role of outside options and cognitive distractions through a moderation
approach. This approach requires manipulating the mediating factor (in our case, outside options) in
addition to the main independent variable (in our case, weather conditions). It is considered a better
approach than measuring the mediating factor through the use of self-reported measures (Rucker,
Preacher, Tormala, and Petty, 2011; Spencer, Zanna, and Fong, 2005).
Rainmakers: Why Bad Weather Means Good Productivity
- 10 -
For our first manipulation, we varied whether the task was undertaken on days with poor weather
(rainy) or good weather (sunny); participants were blind to this assignment. To ensure that our
participants were not biased, our study was advertised as a “Cognition and Decision-Making Study,” and
they were asked to evaluate the weather only at the end of their surveys. For our second manipulation, the
participants either were primed by exposure to a variety of outside options prior to the task or were not
primed by exposure to outside options. We used this second manipulation to vary the level of cognitive
distraction created by thinking about outside activities one may engage in, a manipulation based on prior
research (e.g., Simonsohn, 2010).
All experimental sessions were held in February and March in Cambridge, Massachusetts, during
which time the outdoor temperature averaged 45 degrees Fahrenheit. During the entire experiment, the
lab’s lighting and temperature levels were fixed at the same level.
4.1 Participants and Cognitive Distraction Manipulation
One hundred and thirty-six students (Mage=21.82, SD=3.51; 48.89% male) at Harvard University
and nearby schools were recruited through the study pool at the Harvard Decision Science Laboratory.
Participants signed up online in advance to participate in an hour-long study and paid a $10 participation
fee. They were also told that depending on the completion time of their data entry, they would have the
opportunity to receive an additional $10 bonus (more detail provided below).
Participants on each day were randomly assigned to either be exposed to outside options (36
participants on rainy days, 32 participants on sunny days) or to not be exposed to outside options (33
participants on rainy days, 35 participants on sunny days). Those who were assigned to be exposed to
outside options viewed six photos of outdoor activities taking place in good weather conditions and were
asked to evaluate the attractiveness of each activity (see examples in the Appendix). The activities
depicted were sailing, rowing, dining outdoors, walking in the woods, visiting a park, and playing beach
volleyball. Participants were then asked to pick their favorite depicted activity or the activity in which
they engaged most frequently and to discuss in detail what they would do in the depicted scene as vividly
as possible. Each subject in the control group, on the other hand, was asked to describe his or her typical
daily routine. Next, all participants were asked to complete the data-entry task.
4.2 Data-entry Procedure
The data-entry task involved entering five sets of questionnaire responses written in Italian from
printed copies into a spreadsheet. Since we could not capture the effect of weather on error rates in the
field data (due to the low occurrence of errors), we used an Italian questionnaire to increase the difficulty
of the task for the English speakers, and we recorded error as an additional measure. The participants
were given the following instructions:
Rainmakers: Why Bad Weather Means Good Productivity
- 11 -
“You are about to start the data-entry task. You will be given 5 survey responses from a study
conducted in Italy. If you have entered all five documents (10 pages total), you will receive an
extra $10 at the end of the experiment. Please read the following instructions carefully. If you fail
to follow the instructions, you will not be given the additional $10. If you wish to stop entering
the data, or fail to finish entering the data (by 40 minutes after the start of the experiment), we
will pay $2 per survey entered. You will receive 10 pages of data that include 5 participants'
survey responses. You are asked to enter the responses (not the questions) into the Excel
spreadsheet. Below is an example of the spreadsheet that you will be working from.” (See
Appendix B)
4.3 Measures
After all participants completed their data-entry task, they also performed a memory task and
completed a questionnaire that included state emotions, subjective weather perceptions, and demographic
questions. We included the memory task to assess whether our manipulations also affected individuals’
memory, as well as state emotions to control for potential effects of affect. Lastly, we asked participants
for their subjective weather perceptions to make sure that they accurately perceived rainy days as bad
weather and sunny days as good weather.
Memory Task. Participants were given 30 seconds to look at and try to remember 20 objects;
then they were asked to write down all the items that they could remember.
State Emotions. We first assessed participants’ state emotions using the Self-Assessment
Manikin (SAM; Bradley and Lang, 1994), a non-verbal pictorial assessment technique that measures
valence and arousal (see Figure 3). Participants were asked to pick the manikin that matched their current
feelings most closely (for valence, from 1=“Very unpleasant,” to 9=“Very pleasant”; for arousal, from
1=“No feelings,” to 9=“Very strong feelings”). Secondly, we used the 20-item form of the Positive and
Negative Affect Scale (PANAS; Watson, Clark, and Tellegen, 1988) to measure the level of discrete
emotions beyond valence and arousal measured by SAM. Participants indicated how much they felt each
emotion “right now” using a 7-point scale (from 1=“Clearly does not describe my feelings” to 7=“Clearly
describe my feelings”). We calculated factor scores for each participant for both positive (Cronbach’s α =
.93) and negative affect (Cronbach’s α = .89), and then used them in our analyses.
Subjective Weather Perceptions. We asked participants whether they thought that the weather on
the day of their participation was “good” weather or “bad” weather (1 = good weather, 2 = bad weather).
We used this question as a manipulation check for our weather manipulation.
Productivity. We assessed individual productivity as in Study 1, namely by computing the time
participants spent on the data-entry task. We log-transformed our time data to reduce skewness and then
Rainmakers: Why Bad Weather Means Good Productivity
- 12 -
divided it by the number of words to standardize for differences in participants’ duration per word, as
each survey data that participants entered consisted of a different number of words.
Error Rates. In this study, we also assessed participants’ error rates by computing for each person
the proportion of correct words entered out of the total number of words.
4.4 Predictions
Consistent with Hypothesis 2, we predicted that bad weather (operationalized as rainy weather)
would reduce potential cognitive distractions as compared to good weather, thus making participants
more focused on the tasks at hand and thus less likely to commit errors and more likely to be productive.
As we suggested earlier, we expected weather conditions to be linked to cognitive distractions through
exposure to attractive outside options. Thus, we expected to find a significant interaction between weather
conditions and our outside-options manipulation, and to provide evidence in support of our mediation
hypothesis (i.e., Hypothesis 2) through moderation. We chose this particular method of manipulating the
availability of outside options instead of relying on self-reports, which are less reliable and more likely to
be biased (i.e., asking participants how distracted they felt or how frequently they thought about outside
options). Thus, our moderation design allows a stronger test of our mediation hypothesis.
Further, as suggested by Hypothesis 3, we predicted that participants would make more mistakes
when entering data in the outside-option condition as compared with the control condition and that these
higher error rates would explain why exposure to outside options lowers individual productivity. We use
error rates as a behavioral measure of cognitive distractions so that we do not need to rely on self-reported
measures. Finally, we predicted that the effect of the outside-options manipulation would be specific to
one’s attention; in other words, considering outside options may deplete one’s limited attention but may
not directly affect executive functions, such as memory accuracy. Accordingly, we expected that thinking
about outside options would slow down completion time by making people more prone to mistakes, but
would not impair their cognitive ability to remember what they read as they typed.
4.5 Results and Discussion
We first excluded six participants who failed to follow our instructions, as their completion time
was not recorded correctly. Also, we statistically identified four outliers that were 2.5 standard deviations
above or below the mean data-entry task completion time (Mtime=18.02 minutes, SD=5.9 minutes).
Manipulation Checks. We first tested whether our quasi-experimental manipulation of weather
was effective. Table 4 summarizes, on average, how different sunny days are from rainy days, using the
data provided by the National Climatic Data Center.4 We found that good weather conditions were
positively associated with visibility (r=.748, p<.001), cloud ceiling (r=.865, p<.001), temperature (r=.664,
4 For more information, please visit the National Oceanic and Atmospheric Administration (NOAA) website: http://www7.ncdc.noaa.gov/CDO/dataproduct
Rainmakers: Why Bad Weather Means Good Productivity
- 13 -
p<.001), and pressure (r=.862, p<.001), but negatively correlated with the fraction of sky covered (r=-
.939, p<.001) and precipitation (r=-.802, p<.001). These correlations suggest that the variation of weather
roughly matched the real weather on the day of the sessions, as was the case in the field data. These
weather variables were not significantly correlated with our manipulation of exposure to outside options,
which we randomized.
For a subjective measure of how our participants perceived the weather, at the end of the survey,
we asked them how they felt about the weather. Among 67 participants who participated on a good
weather day, 60 (89.5%) felt that the weather was good, while among 69 participants who participated on
a rainy day, 64 (92.75%) felt that the weather was bad, χ²(1, N=136)=92.29 , p<0.001.
Zero-order Correlational Analysis. Summary statistics provided in Table 5 report the descriptive
statistics as well as zero-order correlations between the key variables used in our analyses. These results
demonstrate that our dependent measure of productivity (a reverse measure of total time taken to enter a
word) was significantly and negatively correlated with exposure to outside options but not correlated with
weather conditions. It should also be noted that weather conditions were not significantly correlated with
any of the executive functions (measured by memory task) and emotion variables, although the directions
were consistent with our predictions.
Effects of Exposure to Outside Options and Weather Conditions. Our second hypothesis
predicted that bad weather conditions increase worker productivity by decreasing thoughts about outside
options, which should reduce cognitive distractions. Given the design we employed in Study 2, this
hypothesis would be supported by a significant interaction between weather conditions and exposure to
outside options in predicting productivity. To test this hypothesis, we conducted a series of regression
analyses (Table 6). As shown in Model 1, exposure to outside options increased the data-entry time
(adjusted for number of words). As predicted, this effect was qualified by a marginally significant
interaction between exposure to outside options and weather conditions (either rainy or sunny). This
interaction effect indicates that the relationship between exposure to outside options and productivity
depends on whether individuals completed the task on a sunny day or a rainy day.
To account for individual differences in productivity, we conducted similar analyses while
controlling for age, sex, income, education, and memory (Model 2). Finally, as a robustness check, we
also controlled for individual differences in state emotions (Model 3). Both the main effect of exposure to
outside options and the interaction term with weather conditions remained statistically significant in these
additional analyses.5 This suggests that even after holding memory and mood constant, the main effect of
exposure to outside options and the interaction effect on productivity stayed robust.
5 Lastly, we have controlled for individual weather items such as visibility, temperature, barometric pressure, etc., and our findings remained robust.
Rainmakers: Why Bad Weather Means Good Productivity
- 14 -
In addition, we examined simple slopes to estimate the conditional effect of exposure to outside
options under different weather conditions while controlling for key demographic variables, memory, and
emotion variables (see Figure 4). During rainy days, exposure to outside options significantly decreased
productivity, β=.004, p=.014. During sunny days, however, exposure to outside options decreased
productivity only at the 10% significance level, β=.001, p=.09. These results are consistent with our
predictions. In fact, during bad weather days, individuals do not have attractive outside options to think
about unless they are primed to do so (as they were in our exposure-to-outside-options condition).
Instead, during good weather days, individuals are likely to be distracted by thoughts of their attractive
outside options. The priming manipulation is less likely to have an effect, as individuals are already
primed to think about their outside options thanks to the good weather.
To summarize, we found that exposure to outside options was harmful for productivity on rainy
days, an effect that seemed to disappear on sunny days. This interaction effect between weather
conditions and exposure to outside options suggests that people can be relatively more productive at work
on rainy days, unless they are distracted by outside options. In fact, supporting our earlier argument, on
sunny days, participants were likely to already be distracted, as outside options were available to them
and probably salient in their minds. Together, these findings provide support for Hypothesis 2; our
moderation models provide evidence that cognitive distractions created by the salience of outside options
may serve as a mechanism through which bad weather conditions increase productivity.
Mediation Analysis: Error Rates as a Mediator6. We next investigated whether being exposed to
outside options acts as a cognitive distraction by increasing participant’s error rates in the data-entry task.
We thus tested Hypothesis 3, which suggests that the relationship between our outside options
manipulation and productivity would be mediated by error rates. Greater error rates, in fact, represent a
direct consequence of greater cognitive distractions.
We conducted a series of regression analyses to test Hypothesis 3. When participants’ error rates
(calculated as the proportion of incorrectly entered words divided by the total number of words) were
entered into the model, exposure to outside options no longer predicted productivity at the 5% significant
level (from β=.0013, p=.08 to β=.0005, n.s.), but error rates did (β=.029, p<.001). Also, being exposed to
outside options increased the error rates significantly (β=.0266, p=.044). The nature and significance of
this mediation did not change when controlling for demographics, memory, weather conditions, and
affect.
A bootstrap analysis showed that the 95% bias-corrected confidence interval for the size of the
indirect effect excluded zero (.0001, .0016), suggesting a significant indirect effect (MacKinnon,
6 Although we reported the mediation analysis with key covariates (demographic variables, memory, and emotions), the same analysis without covariates was also conducted, and it showed the same result.
Rainmakers: Why Bad Weather Means Good Productivity
- 15 -
Fairchild, and Fritz, 2007; Shrout and Bolger, 2002). These results show that the error rates mediated the
relationship between exposure to outside options and productivity.
In addition, we tested whether our mediation model of explaining the relationship between
distraction and productivity was specific to error rates but not applicable to a more general impairment of
cognitive functions, such as memory accuracy. Although workers do need a certain level of memory to
accurately enter the data they just saw on paper, we did not find statistical evidence for memory accuracy
as a mediator. This supports our theorizing that having exposure to outside options, which increases
cognitive distractions, impairs the ability to remain focused but does not impair the actual executive
function – memory – in particular.
Lastly, we also tested a model of moderated mediation (Preacher, Rucker, and Hayes, 2007),
which examined whether the mediation process by error rates remains constant across different weather
conditions. On rainy days, when error rates were entered as a mediator, exposure to outside options no
longer predicted productivity (from β=.0029, p=.02 to β=.0017, n.s.), but error rates did (β=.029, p<.001).
A bootstrap analysis confirmed the 95% bias-corrected confidence interval for the size of the indirect
effect excluded zero (.0001, .0031). This relationship was robust regardless of covariates. However, this
mediated relationship did not hold on sunny days. This indicates that the conditional indirect effect (i.e.,
the mediated effect) of having outside options was stronger on rainy days than on sunny days.
In sum, those who were exposed to outside options exhibited lower productivity, and this
relationship was explained by their higher error rates. This provides evidence that thinking about outside
options is indeed cognitively distracting, to the point that people make more mistakes when entering data,
thus lowering levels of productivity. More interestingly, those who were not distracted on a rainy day
tended to be the most productive, while those who were forced to think about outside options on the same
day were least productive.
5. General Discussion and Conclusion
Our evidence from the field and the lab was consistent with the predictions of our theory. Our
most basic prediction was that, as compared to good weather conditions, bad weather conditions would
make people more productive at work. Study 1 supports this result, showing that an individual is more
likely to be productive on a bad weather day (characterized by more rain, lower visibility, and high and
low temperatures) than on a good weather day. Study 2 extends the findings of Study 1, illustrating that
the relationship between bad weather conditions and greater worker productivity is explained by the fact
that on bad weather days, people are cognitively less distracted because they do not need to spend time
thinking about their outside options (as summarized in our theoretical model, depicted in Figure 1). When
the weather is bad, in fact, such options are not available to them. In addition, in a prediction study
described in the introduction, we found that people predict just the opposite: that good weather is related
Rainmakers: Why Bad Weather Means Good Productivity
- 16 -
to greater individual productivity. Thus, our findings suggest that there exists a significant gap between
people’s general beliefs about the effects of weather on their productivity and the actual effect of weather
on their behavior.
It should be noted that bad weather was associated with higher productivity in Study 1, although
there was no significant main effect of weather on productivity in Study 2. We believe these seemingly
contradictory findings are due to the fact that the average rainfall in Study 2 was not as variable as the
data for precipitation in Study 1. Because the average rainfall during the bad weather days was only about
.02 inches per hour, it is likely that the effect of precipitation in Study 2 may have not been large enough
to meet the significance criteria. In addition, the lack of a main effect may also be due to the nature of the
design we used to test for mediation in Study 2, where we manipulated the saliency of outside options
(our proposed mediator). We predicted a significant interaction effect between weather conditions and the
saliency of outside options, which we indeed found.
Also, in Study 2, neither negative nor positive affect significantly predicted worker productivity.
Although bad weather was associated with negative affect and good weather was associated with positive
affect, these correlations were not statistically significant. This lack of findings does not support the
weather-mood hypothesis suggested by prior research on the link between weather and affect in contexts
outside of work productivity. However, it is not our goal to suggest that the weather-mood hypothesis is
unwarranted or that negative affect plays no role in cognition. We believe these influences may still be in
place, even if to a lesser extent, although they have not been realized in our study, or not as strongly as
previous research believed. It is also worth noting that both of our studies were conducted in a climate-
controlled environment where individuals were asked to complete a series of tasks requiring attention and
focus, such as a workplace (Study 1) and the laboratory (Study 2). This may explain why outside weather
conditions played a lesser role in influencing workers’ affective state but created a more significant
variation in the level of cognitive distraction. While prior research has focused primarily on contexts
where it is reasonable to assume that weather may have a direct impact on people’s behavior (e.g., the
effect of high temperatures on baseball players’ aggression; see Larrick et al., 2011), here we focused on
indoor work contexts. In such contexts, weather may primarily act on people’s cognition rather than on
their affective states, as it influences their level of distraction when they think about attractive outside
options, as we have shown. Future research examining the role of weather across these different contexts
would further our understanding of the relationship between weather, affect, and cognition.
In the current investigation, our main goal was to provide an alternative psychological route of
limited attention through which bad weather conditions influence productivity, even when we hold
affective influences constant. Previous studies suggest that introducing an interrupting task distracts a
worker from the primary task and thus decreases the accuracy of decisions and increases error rates
Rainmakers: Why Bad Weather Means Good Productivity
- 17 -
(Bailey and Konstan, 2006; Speier et al, 1999). In line with previous work, our mediation analysis
demonstrated that people tend to make more errors when they were exposed to a variety of outdoor
activities, thus slowing down their overall data-entry task and damaging their productivity. This supports
our hypothesis that making outside options salient in people’s minds alone could impair their ability to
concentrate.
More importantly, this relationship between cognitive distractions and productivity depended
upon the weather conditions. As we hypothesized, potential outdoor activities are not readily available on
a rainy day, unless people are primed to think about it. This explains why those who were not exposed to
outside options on rainy days were most productive. On the other hand, on sunny days, there is a higher
opportunity cost of sitting in the lab and finishing the tedious data-entry task than there is on rainy days;
thus, the level of productivity did not vary depending on the exposure to outside options. It should be
cautioned that there was more variability in productivity on a rainy day, which may indicate that people
are more easily distracted by cognitive primes on rainy days than on sunny days.
Future studies may explore this possibility that good weather conditions motivate workers to feel
more bored with a repetitive task, which makes it difficult for them to focus. Our data-entry tasks in Study
1 and 2 required workers to pay attention to the given task. Another possibility is that, as Keller et al.
(2005) noted, positive moods induced by good weather conditions may broaden workers’ cognition, thus
increasing the flexibility of their thoughts. Consequently, future research should include different types of
tasks that require not only attention but also creativity. 5.1. Theoretical and Practical Implications
Our findings extend previous research on the influence of weather conditions on individual
productivity. Prior work has focused on the effects of bad weather on behavior through people’s affective
reactions to weather conditions (e.g., Larrick et al., 2011). Our work demonstrates that weather conditions
also influence one’s own cognition and focus. By reducing the potential for cognitive distractions, bad
weather was actually better at sustaining individuals’ attention and focus, and, as a result, increasing their
productivity. Future research should extend our investigation to study both cognitive and affective
consequences of bad versus good weather conditions by employing different performance tasks.
Our findings also deepen understanding of the factors that contribute to worker productivity. We
document the influence of weather conditions, incidental factors that affect individual productivity at
work. Prior work has focused primarily on factors that are directly under one’s control or under the
control of the organization (e.g., Staats and Gino, 2012). Our research suggests that seemingly irrelevant
factors that managers cannot control may have powerful effects on workers’ productivity. This may
translate not only into greater levels of productivity but also greater learning over time. This finding thus
Rainmakers: Why Bad Weather Means Good Productivity
- 18 -
calls for more careful investigation of the factors that may increase task-unrelated thoughts, which may
aversely affect productivity at work.
Despite the widespread belief that bad weather conditions are related to low productivity, we
provide compelling evidence that people are less productive on good weather days because their
attentional resources are more likely to be depleted when they have more choices (i.e. outdoor activities),
and face higher opportunity costs of being indoors. This supports the choice overload hypothesis, or the
theory that having more options may not always yield positive outcomes (see Iyengar and Lepper, 2000;
Schwartz, 2000). Instead, having more choices to consider may be distracting, thereby decreasing one’s
ability to focus and complete tasks.
Lastly, our study has significant managerial implications. Although weather conditions are
exogenous and uncontrollable, organizations could assign more clerical work on rainy days than sunny
days to tap into the effects of bad weather on productivity, assigning work that does not require sustained
attention but does allow for more flexibility in thinking. Because we found that cognitive distractions led
to higher error rates, individuals may wish to avoid working on a task in which errors would be costly
when they have task-unrelated priorities. In addition, organizations may give individualized feedback to
each employee about their own productivity and employ flexible working hours that could maximize
productivity. We also note that if an organization wishes to maintain a constant output of work, then the
weather forecast might be a valuable input to a staffing model. Namely, when weather is expected to be
good (or bad), then the amount of staff allocated could be increased (or decreased). Finally, as Cachon et
al. (2011) note, weather patterns are an important variable for facility location. Our results suggest that,
holding all other factors constant (e.g., the availability of labor), locating services operations, such as the
type we study, in places with worse weather may be preferable. Each of these points is worth further
study.
Rainmakers: Why Bad Weather Means Good Productivity
- 19 -
6. References
Auliciems, A. (1972). Classroom performance as a function of thermal comfort. International Journal of
Biometeorology, 16(3): 233–246.
Bailey, B. and Konstan, J. (2006). On the need for attention-aware systems: Measuring effects of
interruption on task performance, error rate, and affective state. Computers in Human Behavior,
22(4): 685–708.
Beck, N. (2001). Time-series cross-section data: What have we learned in the past few years? Annual
Review of Political Science, 4: 271–293.
Bradley, M. and Lang, P. (1994). Measuring emotion: the self-assessment manikin and the semantic
differential. Journal of behavior therapy and experimental psychiatry, 25(1): 49–59.
Brooks, A.W. and Schweitzer, M.E. (2011). Can Nervous Nelly negotiate? How anxiety causes
negotiators to make low first offers, exit early, and earn less profit. Organizational Behavior
and Human Decision Processes, 115: 43-54.
Cachon, G., Gallino, S., and Olivares, M. (2011). Severe weather and automobile assembly productivity.
Working paper.
Clark, L. and Watson, D. (1988). Mood and the mundane: Relations between daily life events and self-
reported mood. Journal of Personality and Social Psychology, 54(2): 296-308.
Connolly, M. (2008). Here comes the rain again: Weather and the intertemporal substitution of leisure.
Journal of Labor Economics, 26(1): 73-100.
Cunningham, M. (1979). Weather, mood, and helping behavior: Quasi experiments with the sunshine
samaritan. Journal of Personality and Social Psychology, 37(11): 1947.
Fisher, C. D. (1998). Effects of external and internal interruptions on boredom at work: Two studies.
Journal of Organizational Behavior, 19: 503-522.
Flynn, E. A., Barker, K. N., Gibson, J. T., Pearson, R. E., Berger, B. A., and Smith, L. A. (1999). Impact
of interruptions and distractions on dispensing errors in an ambulatory care pharmacy.
American Journal of Health-System Pharmacy, 56: 1319-1325.
Forgas, J. (1995). Mood and judgment: the affect infusion model (aim). Psychological bulletin, 117(1):
39.
Forgas, J., Goldenberg, L., and Unkelbach, C. (2009). Can bad weather improve your memory? an
unobtrusive field study of natural mood effects on real-life memory. Journal of Experimental
Social Psychology, 45(1): 254–257.
Giambra, L. M. (1995). A laboratory method for investigating influences on switching attention to task-
unrelated imagery and thought. Consciousness and Cognition, 4: 1-21.
Rainmakers: Why Bad Weather Means Good Productivity
- 20 -
Goetzmann, W. and Zhu, N. (2005). Rain or shine: where is the weather effect? European Financial
Management, 11(5): 559–578.
Goldstein, K. (1972). Weather, mood, and internal-external control. Perceptual and Motor Skills;
Perceptual and Motor Skills.Hirshleifer, D. and Shumway, T. (2003). Good day sunshine:
Stock returns and the weather. The Journal of Finance, 58(3): 1009–1032.
Howarth, E. and Hoffman, M. (1984). A multidimensional approach to the relationship between mood
and weather. British Journal of Psychology, 75(1): 15–23.
Isen, A. M. (1993). Positive affect and decision making. In M. Lewis and J. Haviland (Eds.), Handbook of
Emotion (p. 261-277). NY: Guilford.
Iyengar, S. and Lepper, M. (2000). When choice is demotivating: Can one desire too much of a good
thing? Journal of personality and social psychology, 79(6): 995.
Jett, Q. and George, J. (2003). Work interrupted: A closer look at the role of interruptions in
organizational life. Academy of Management Review, 28(3): 494–509.
Kasper, S., Wehr, T., Bartko, J., Gaist, P., and Rosenthal, N. (1989). Epidemiological findings of seasonal
changes in mood and behavior: a telephone survey of Montgomery county, Maryland. Archives
of General Psychiatry, 46(9): 823.
KC, D. and Terwiesch, C. (2009). Impact of workload on service time and patient safety: An econometric
analysis of hospital operations. Management Science, 55(9): 1486–1498.
Keller, M., Fredrickson, B., Ybarra, O., Côté, S., Johnson, K., Mikels, J., Conway, A., and Wager, T.
(2005). A warm heart and a clear head the contingent effects of weather on mood and
cognition. Psychological Science, 16(9): 724–731.
Killingsworth, M. A., and Gilbert, D. T. (2010). A wandering mind is an unhappy mind, Science, 330,
932.
Klimstra, T., Frijns, T., Keijsers, L., Denissen, J., Raaijmakers, Q., van Aken, M., Koot, H., van Lier, P.,
and Meeus, W. (2011). Come rain or come shine: Individual differences in how weather affects
mood. Emotion, 11(6): 1495.
Lapré, M. and Tsikriktsis, N. (2006). Organizational learning curves for customer dissatisfaction:
Heterogeneity across airlines. Management Science, 52(3): 352–366.
Larrick, R. P., Timmerman, T. A., Carton, A. M., and Abrevaya, J. (2011). Temper, temperature, and
temptation: Heat-related retaliation in baseball. Psychological Science, 23(6): 1-6.
Lerner, J. and Keltner, D. (2000). Beyond valence: Toward a model of emotion- specific influences on
judgment and choice. Cognition & Emotion, 14(4): 473–493.
Lerner, J. and Tiedens, L. (2006). Portrait of the angry decision maker: How ap- praisal tendencies shape
anger’s influence on cognition. Journal of Behavioral Decision Making, 19(2): 115– 137.

Rainmakers: Why Bad Weather Means Good Productivity
- 21 -
MacKinnon, D., Fairchild, A., and Fritz, M. (2007). Mediation analysis. Annual review of psychology, 58:
593-614.
Manly, T., Robertson, I. H., Galloway, M., and Hawkins, K. (1999). The absent mind: Further
investigations of sustained attention to response. Neuropsychologia, 37: 661-670.
Murray, K., Di Muro, F., Finn, A., and Popkowski Leszczyc, P. (2010). The effect of weather on
consumer spending. Journal of Retailing and Consumer Services, 17(6):512–520.
Parrott, W. and Sabini, J. (1990). Mood and memory under natural conditions: Evidence for mood
incongruent recall. Journal of Personality and Social Psychology, 59(2): 321.
Preacher, K., Rucker, D., and Hayes, A. (2007). Addressing moderated mediation hypotheses: Theory,
methods, and prescriptions. Multivariate Behavioral Research, 42(1): 185–227.
Reagans, R., Argote, L., and Brooks, D. (2005). Individual experience and experience working together:
Predicting learning rates from knowing who knows what and knowing how to work together.
Management Science, 51(6): 869–881.
Rind, B. (1996). Effect of beliefs about weather conditions on tipping. Journal of Applied Social
Psychology, 26(2): 137–147.
Rind, B. and Strohmetz, D. (2001). Effect on restaurant tipping of presenting customers with an
interesting task and of reciprocity. Journal of Applied Social Psychology, 31(7): 1379–1384.
Robertson, I. H., Manly, T., Andrade, J., Baddeley, B. T., and Yiend, J. (1997). Oops: Performance
correlates of everyday attentional failures in traumatic brain injured and normal subjects.
Neuropsychologia, 35: 747-758.
Rosenthal, N., Sack, D., Gillin, J., Lewy, A., Goodwin, F., Davenport, Y., Mueller, P., Newsome, D., and
Wehr, T. (1984). Seasonal affective disorder: a description of the syndrome and preliminary
findings with light therapy. Archives of General Psychiatry, 41(1): 72.
Rucker, D. D., Preacher, K. J., Tormala, Z. L., and Petty, R. E. (2011). Mediation analysis in social
psychology: Current practices and new recommendations. Social and Personality Psychology
Compass, 5/6: 359-371.
Sanders, J.L. and Brizzolara, M.S. (1982). Relationship between Mood and Weather, Journal of General
Psychology, 107(1): 157-158
Saunders, E. (1993). Stock prices and wall street weather. The American Economic Review, 83(5): 1337–
1345.
Schultz, K., Juran, D., Boudreau, J., McClain, J., and Thomas, L. (1998). Modeling and worker
motivation in JIT production systems. Management Science, 44(12): 1595–1607.
Schultz, K., Schoenherr, T., and Nembhard, D. (2010). An example and a proposal concerning the
correlation of worker processing times in parallel tasks. Management Science, 56(1): 176–191.
Rainmakers: Why Bad Weather Means Good Productivity
- 22 -
Schwartz, B. (2000). Self-determination: The tyranny of freedom. American psychologist, 55(1): 79.
Schwarz, N. and Clore, G. (1983). Mood, misattribution, and judgments of well-being: Informative and
directive functions of affective states. Journal of personality and social psychology, 45(3): 513.
Schwarz, N. and Clore, G. (1988). How do I feel about it? The informative function of affective states.
Affect, cognition, and social behavior, 44–62.
Shrout, P. and Bolger, N. (2002). Mediation in experimental and nonexperimental studies: new
procedures and recommendations. Psychological Methods; Psychological Methods, 7(4): 422.
Simonsohn, U. (2007). Clouds make nerds look good: Field evidence of the impact of incidental factors
on decision making. Journal of Behavioral Decision Making, 20(2): 143–152.
Simonsohn, U. (2010). Weather to go to college. The Economic Journal, 120(543): 270–280.
Sinclair, R., Mark, M., and Clore, G. (1994). Mood-related persuasion depends on (mis) attributions.
Social Cognition, 12(4): 309–326.
Smallwood, J., and Schooler, J. W. (2006). The restless mind. Psychological Bulletin, 132:946-958.
Speier, C., Valacich, J., and Vessey, I. (1999). The influence of task interruption on individual decision
making: An information overload perspective. Decision Sciences, 30(2): 337–360.
Spencer, S. J., Zanna, M. P., and Fong, G. T. (2005). Establishing a causal chain: Why experiments are
often more effective than mediational analyses in examining psychological processes. Journal
of Personality and Social Psychology, 89: 845-851.
Staats, B., and Gino, F. (2012). Specialization and variety in repetitive tasks: Evidence from a Japanese
bank. Management Science. Forthcoming.
Staw, B. (1980). The consequences of turnover. Journal of Occupational Behaviour, 1(4): 253–273.
Trombley, M. (1997). Stock prices and wall street weather: Additional evidence. Quarterly Journal of
Business and Economics, 36(3): 11–21.
Watson, D. (2000). Mood and temperament. New York: Guilford Press.
Watson, D., Clark, L., and Tellegen, A. (1988). Development and validation of brief measures of positive
and negative affect: the panas scales. Journal of personality and social psychology, 54(6):
1063-1070.
Zivin, J. G. and Neidell, M. J. (2010). Temperature and the allocation of time: Implications for climate
change. NBER Working Paper Series, No. 15717.

Rainmakers: Why Bad Weather Means Good Productivity
- 23 -
Table 1. Control variables in Study 1.
Name Description
Same-day, cumulative volume
To control for learning effects from prior experience, we control for both daily volume and prior day volume (we note that our results for weather are similar, with just one cumulative volume measure). To calculate daily volume, we zero the measure out at the start of each day and count the cumulative transactions that the worker has executed, prior to the focal task.
All prior days' cumulative volume
Prior-day volume captures the number of tasks an individual has executed on all prior days. Previous research notes that, due to decreases in effort, prior volume may show an inverse-U shaped relationship with productivity (Staw 1980; Staats and Gino 2012). Therefore, we include both a linear and quadratic term for prior volume.
Load
Research finds that workers may increase their service rate in response to an increased load (Schultz et al. 1998; KC and Terwiesch 2009). Therefore, we use the same approach as KC and Terwiesch (2009) by constructing a variable, load, that equals the percentage of individuals completing work during the hour that the focal task occurred.
Overwork
If worker load remains high over time, then performance may degrade (KC and Terwiesch 2009). We control for this by calculating a variable, overwork, for each worker and each
transaction: The subscript i denotes the task and is the count of transaction requests from the K periods prior to the time task i
arrives. is the average of the load for shift s. As in KC and Terwiesch (2009), K equals 4, where K is measured in hours.
Defect
In addition to examining the effect of weather on worker completion time, it is also possible that weather may have an effect on the quality of a worker’s output. However, not only is quality quite high in our sample (the defect rate is <3%), but this rate overstates the defect rate. Namely, at the bank we studied, two workers complete each task, after which their outputs are compared (a process known as double-keying). If the outputs do not match, then the process is repeated (by others) until it eventually does match. Given this approach, when a transaction is marked as a defect, we do not know which of the two workers made the mistake (or if both workers did). While we cannot use the measure as a dependent variable, we do use it as a control by coding the variable one if the transaction was rejected and zero if it was not.
Day-of-week
We control for potential day-of-week effects through the use of indicator variables for each day (with Monday as the omitted category). Workers operate from 9:00am to 6:00pm on Monday through Friday and on Saturday from 9:00am until the work for the day is complete. Daily volumes across the week are 21%, 18%, 20%, 19%, 18%, and 4%.
Month indicators We control for any seasonal effects by creating indicator variables for each month of the year.
Year indicators
We control for additional environmental influences over time by adding indicators for the year the task was executed.
Stage indicators
Given that different stages in the process may require different amounts of time, we include indicators for the 17 stages in the data.
Individual indicators
Finally, we control for time-invariant aspects of the worker, such as a worker’s individual skill, by including an indicator for each worker in the data set. Therefore, all hypotheses are tested “within-individual.”
Rainmakers: Why Bad Weather Means Good Productivity
24
Table 2. Summary statistics for Study 1 (n =598,393).
Variable Mean σ 1 2 3 4 5 6 7 8
1. Log completion time 0.39 1.15
2. Rain 0.18 0.53 0.004
3. Temperature 62.13 14.57 -0.030 0.110
4. Visibility 10.31 5.06 0.016 -0.048 -0.393
5. Same-day, cumulative volume 110.8 119.7 -0.188 -0.026 -0.130 0.081
6. All prior days' cumulative volume
5,295 4,527 -0.071 0.024 -0.092 0.040 0.214
7. Load 0.64 0.23 -0.098 -0.042 -0.190 0.096 0.188 -0.045
8. Overwork 0.01 0.21 -0.036 -0.001 -0.001 -0.001 0.025 0.004 0.696
9. Defect 0.03 0.16 0.063 -0.003 0.038 -0.017 0.016 -0.059 0.018 -0.011
Note. Bold denotes significance of less than 5%.
Rainmakers: Why Bad Weather Means Good Productivity
25
Table 3. Summary regression results on completion time (n =598,393).
Dependent Variable: Log Completion
Time
(1) (2)
Rain -0.01284***
(0.002788)
Temperature 0.006789***
(0.001773)
Temperature2 -6.323e-05***
(1.382e-05)
Visibility 8.483e-04*
(3.443e-04)
Same-day, cumulative volume -1.044e-04*** -1.040e-04***
(9.373e-06) (9.373e-06)
All prior days' cumulative volume -4.598e-05*** -4.581e-05***
(1.672e-06) (1.672e-06)
All prior days' cumulative volume2 1.515e-09*** 1.508e-09***
(6.196e-11) (6.198e-11)
Load -0.3986*** -0.4014***
(0.01026) (0.01030)
Overwork 0.2448*** 0.2468*** (0.009832) (0.009857)
Defect 0.3106*** 0.3108*** (0.006690) (0.006690)
Observations 598,393 598,393 Number of Individuals 111 111 R-Squared 0.3373 0.3374
Wald Chi-Squared 357527*** 357613*** Notes. *, ** and *** denote significance at the 5%, 1% and 0.1% levels, respectively. Prais-Winsten regression models with panel-corrected standard errors adjusted for heteroskedasticity and panel-wide first-order autocorrelation.

Rainmakers: Why Bad Weather Means Good Productivity
26
Table 4. Good vs. bad weather conditions
Precipitation (inches per hour)
Visibility (miles)*
Fraction Sky Covered
Cloud Ceiling (100s of feet)**
Temperature (°F)
Dew Point (°F)
Pressure (millibars)
Wind Speed (MPH)
Bad Weather Average 0.017 3.1 1.0 8 39 36 1002 14.6 Good Weather Average 0.003 10.0 0.6 80 48 24 1019 14.1 Overall Average 0.008 7.7 0.7 56 45 28 1014 14.3
Note. * Max visibility = 10, ** No clouds = 100. Table 5. Zero-order correlations among key variables
Variable Mean σ 1 2 3 4 5 6 7 8 9 10 11
1. Total # of words 210.615 25.397 2. Total # of correct words 190.289 34.056 0.915
3. Completion time (min) 18.017 5.908 0.017 -0.047
4. Ln(Time)/# of words 0.034 0.004 -0.945 -0.905 0.248
5. Error rates 0.102 0.089 -0.487 -0.793 0.160 0.546
6. Good weather indicator 0.493 0.502 -0.004 0.028 -0.059 -0.022 -0.075 7. Outside option indicator 0.500 0.502 -0.189 -0.171 -0.035 0.157 0.077 -0.044
8. Memory accuracy 10.397 2.438 0.054 0.063 -0.114 -0.097 -0.058 0.081 0.036
9. Valence 5.882 1.481 -0.007 -0.037 0.012 0.000 0.059 0.099 -0.080 0.081
10. Arousal 4.272 2.009 0.124 0.078 0.026 -0.104 0.025 0.020 -0.099 -0.021 0.160
11. Positive affect 0.000 1.000 0.034 0.062 -0.073 -0.033 -0.066 0.078 -0.084 0.146 0.404 0.741 12. Negative affect 0.000 1.000 0.027 0.034 -0.039 -0.051 -0.029 -0.024 0.088 0.007 -0.278 -0.261 -0.262
Note. Bold denotes significance of less than 5%.
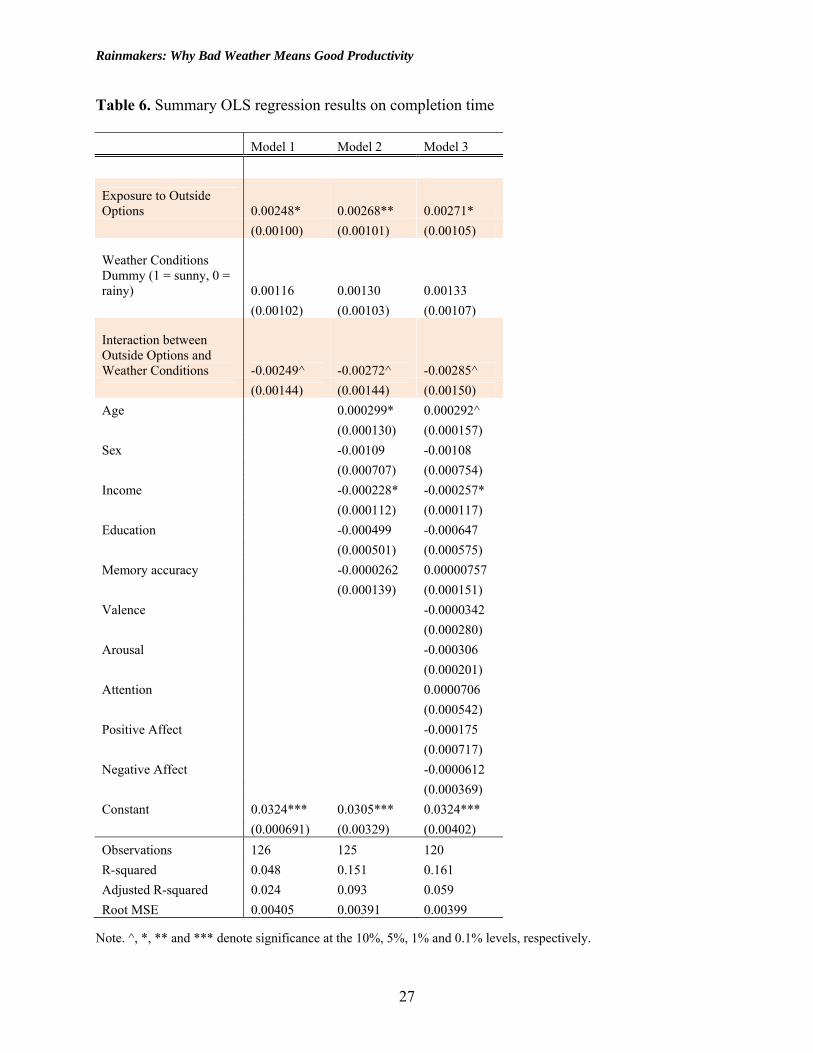
Rainmakers: Why Bad Weather Means Good Productivity
27
Table 6. Summary OLS regression results on completion time
Model 1 Model 2 Model 3
Exposure to Outside Options 0.00248* 0.00268** 0.00271*
(0.00100) (0.00101) (0.00105)
Weather Conditions Dummy (1 = sunny, 0 = rainy) 0.00116 0.00130 0.00133
(0.00102) (0.00103) (0.00107)
Interaction between Outside Options and Weather Conditions -0.00249^ -0.00272^ -0.00285^
(0.00144) (0.00144) (0.00150)
Age 0.000299* 0.000292^
(0.000130) (0.000157)
Sex -0.00109 -0.00108
(0.000707) (0.000754)
Income -0.000228* -0.000257*
(0.000112) (0.000117)
Education -0.000499 -0.000647
(0.000501) (0.000575)
Memory accuracy -0.0000262 0.00000757
(0.000139) (0.000151)
Valence -0.0000342
(0.000280)
Arousal -0.000306
(0.000201)
Attention 0.0000706
(0.000542)
Positive Affect -0.000175
(0.000717)
Negative Affect -0.0000612
(0.000369)
Constant 0.0324*** 0.0305*** 0.0324***
(0.000691) (0.00329) (0.00402)
Observations 126 125 120
R-squared 0.048 0.151 0.161
Adjusted R-squared 0.024 0.093 0.059
Root MSE 0.00405 0.00391 0.00399
Note. ^, *, ** and *** denote significance at the 10%, 5%, 1% and 0.1% levels, respectively.
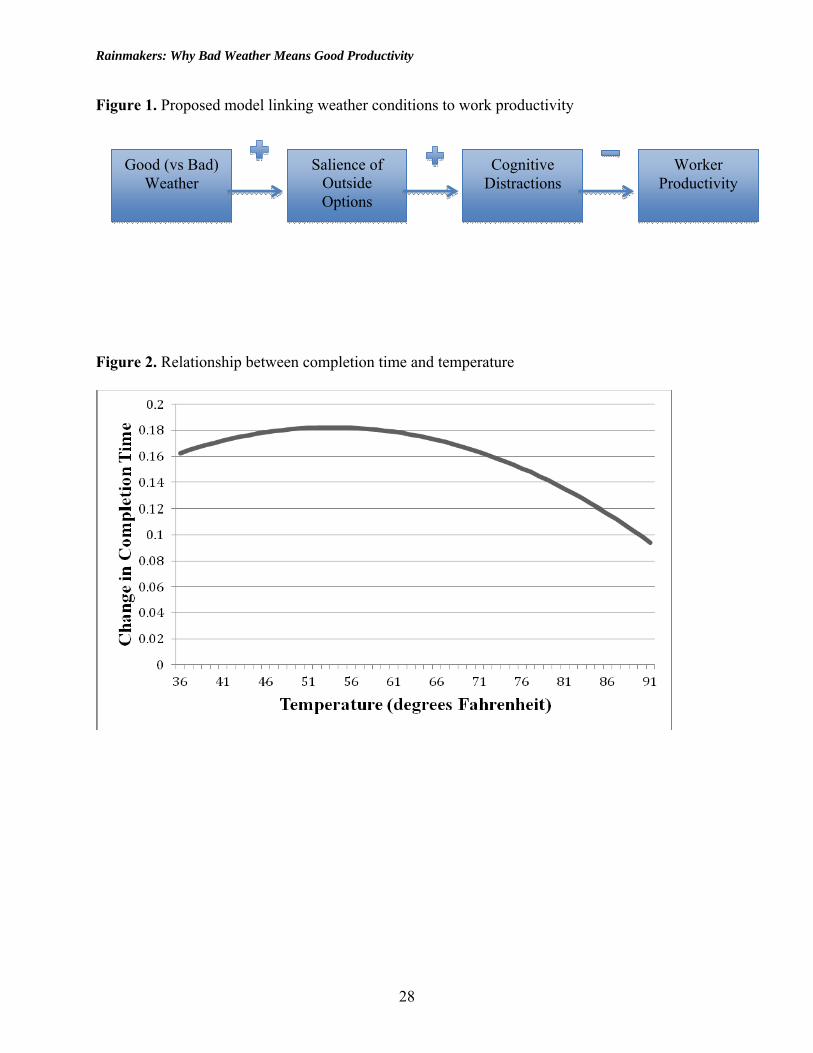
Rainmakers: Why Bad Weather Means Good Productivity
28
Figure 1. Proposed model linking weather conditions to work productivity
Figure 2. Relationship between completion time and temperature
Good (vs Bad) Weather
Salience of Outside Options
Cognitive Distractions
Worker Productivity

Rainmakers: Why Bad Weather Means Good Productivity
29
Figure 3. Self-Assessment Manikin
a. Please look at the manikins below, and indicate the extent to which you feel positive or negative. Enter the number that most closely matches your feelings. (1=Very unpleasant, 9=Very pleasant)
b. Please look at the manikins below, and indicate how strong your feelings are at the moment. Enter the number that most closely matches your feelings. (1=No feelings, 9=Very strong feelings)
Figure 4. Weather conditions moderate the relationship between exposure to outside options and productivity

Rainmakers: Why Bad Weather Means Good Productivity
30
Appendix A. Examples of Outdoor Activities 1. “Sailing on the Boston Harbor”
2. “Rowing on the Charles River”
3. “Walking around the Walden Pond”

Rainmakers: Why Bad Weather Means Good Productivity
31
4. “Patio dining in Boston”
5. “Riding the Swan Boat in Boston Common”
6. “Playing Beach Volleyball”
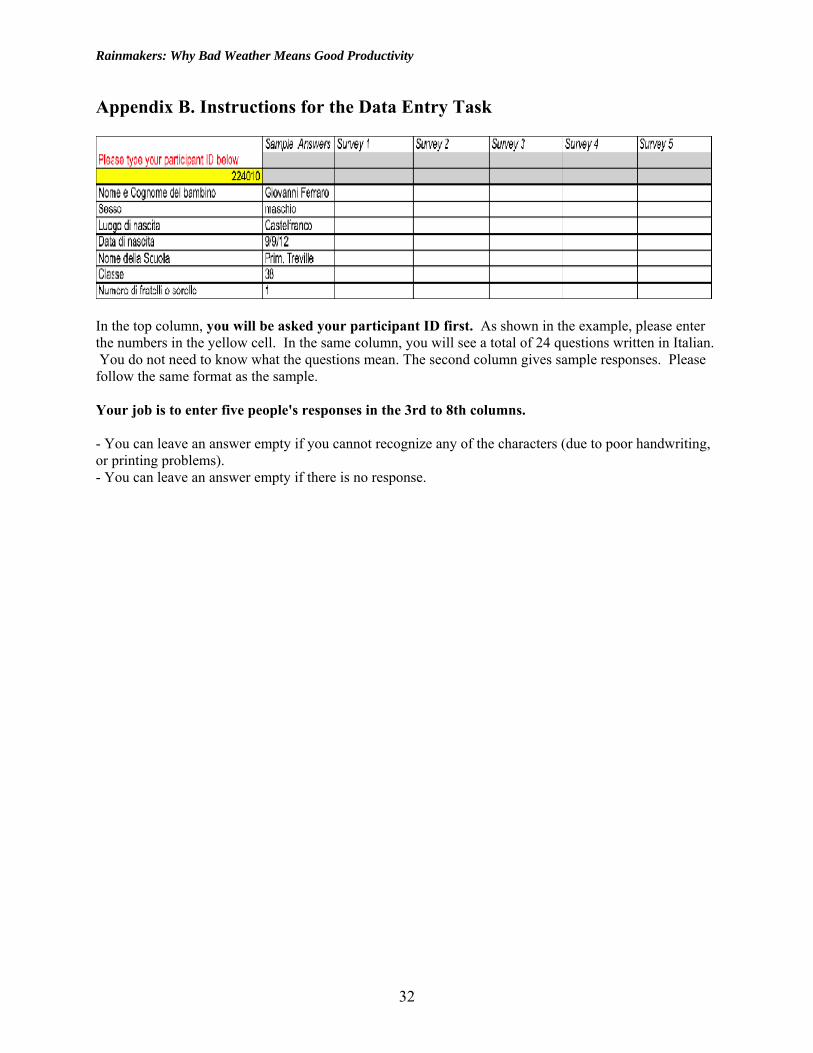
Rainmakers: Why Bad Weather Means Good Productivity
32
Appendix B. Instructions for the Data Entry Task
In the top column, you will be asked your participant ID first. As shown in the example, please enter the numbers in the yellow cell. In the same column, you will see a total of 24 questions written in Italian. You do not need to know what the questions mean. The second column gives sample responses. Please follow the same format as the sample. Your job is to enter five people's responses in the 3rd to 8th columns. - You can leave an answer empty if you cannot recognize any of the characters (due to poor handwriting, or printing problems). - You can leave an answer empty if there is no response.