rainfall measurement and design rainfall · rainfall return periods • probability of rainfall is...
TRANSCRIPT
Rainfall Measurement and Design Rainfall
14th April 2016
Manoranjan Muthusamy (Mano)
Slides: Alma Schellart

Contents of lecture
• Introduction
• Measurement methods
– Point rainfall measurement
– Areal rainfall measurement
• Design rainfall

Why are we interested in measuring rainfall?

• Rainfall is a main input for rainfall runoff and river flow and flooding models
• These models all have different types of requirements of rainfall input data
Berndtsson. R and Niemczynowicz. J/ Journal of Hydrology, 100 (1988) 293-313

• In general, measured in mm (rainfall depth not volume) – why?
• Highly variable
– Spatial scale
– Temporal scale
• Complex to accurately measure

How spatially variable do you think rainfall is?
If 10 mm of rain has been recorded in one day on Sheffield University rain gauge, how much rain would you think there might have been on the same day in
– Crookes?
– Meadowhall?
– Chesterfield?
And what if this 10 mm had been recorded in one hour?
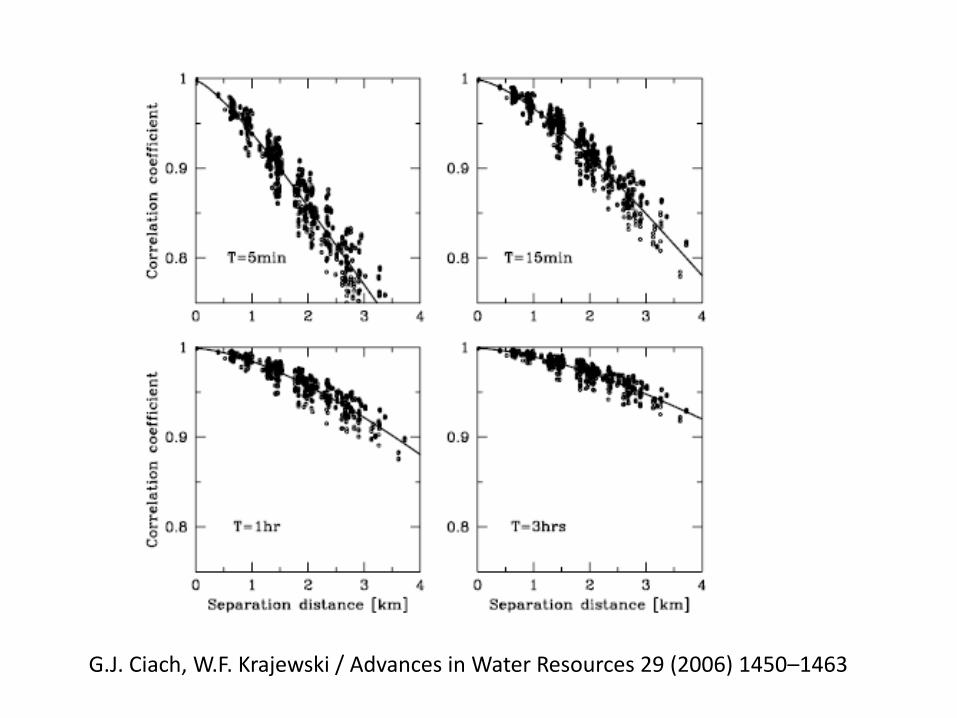
G.J. Ciach, W.F. Krajewski / Advances in Water Resources 29 (2006) 1450–1463

• So, depending on application, we need to make sure we record rainfall at the appropriate spatial, as well as temporal, resolution…

Rainfall measurement methods

Rainfall measurement
• Different rainfall measurement equipment exist, which records either:
– Point rainfall (single rain gauge)
– Spatial rainfall (weather radar or satellite)
• All rainfall measurement methods can have certain errors associated with the measurements

Storage rain gauge
Source: UK Met Office, Factsheet 17. Weather observations over land
5-inch storage rain gauge, cited 30 cm above ground level Widely used in UK Defacto standard for daily rainfall, recorded 0900 UTC
Is this giving you enough information about the rainfall?

Tipping bucket rain gauge
Contains a double-sided ‘bucket’ Every time one side fills completely, bucket tips over and 1 tip is logged From the logged tips, a rainfall amount (mm) or intensity (mm/hr) can be worked out at high frequency (usually every 1, 2, 5 or 15 minutes)

Potential errors tipping bucket rain gauge data
• Blockages (autumn leaves, grass cuttings, dead birds, bird poo, etc)
• Shelter
• Wind
• Very high rain rate
• Vandalism

Radar - RAdio Detection And Ranging
Robert Watson - Watt
Source: UK Met Office, Factsheet 15.
Weather radar
Developed around 1930’s - Took off in 2nd world war, for spotting German aircraft More research in 1950’s UK operational radar network for last 30 years

How does a rainfall radar work?
Source: UK Met Office, Factsheet 15. Weather radar

Source: UK Met Office, Factsheet 15. Weather radar

1 km resolution
5 km resolution 2 km resolution
Source: UK Met Office, Factsheet 15. Weather radar
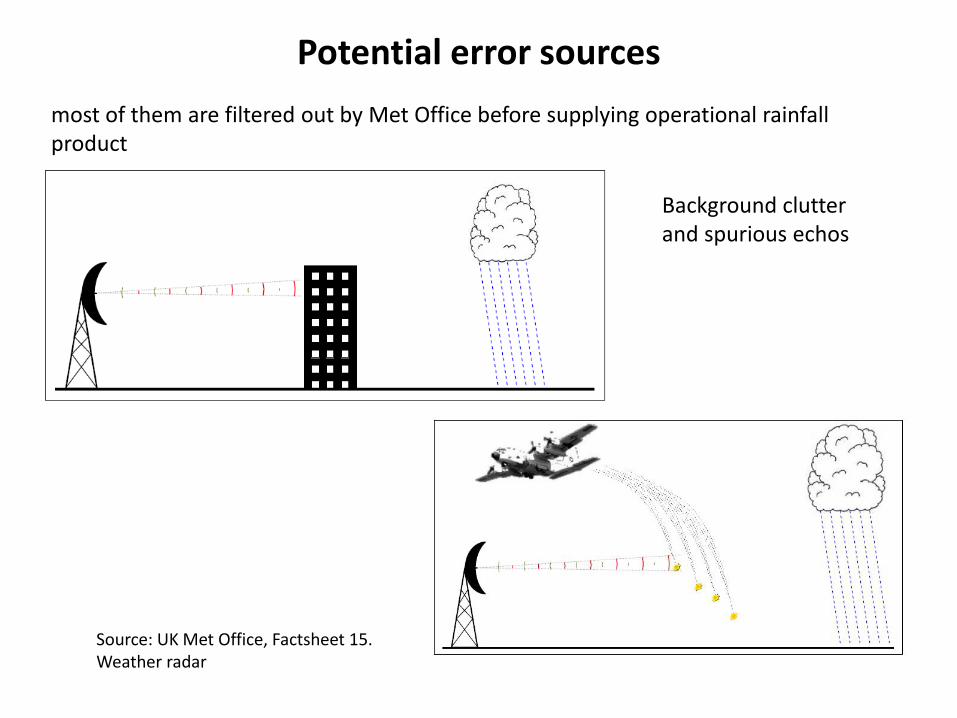
Potential error sources
Source: UK Met Office, Factsheet 15. Weather radar
Background clutter and spurious echos
most of them are filtered out by Met Office before supplying operational rainfall product

Source: Met Office Factsheet 15 ‘Weather Radar’
Radar beam overshooting the rainfall Problem worse further away from radar – due to angle of radar beam and earth curvature
Source: UK Met Office, Factsheet 15. Weather radar
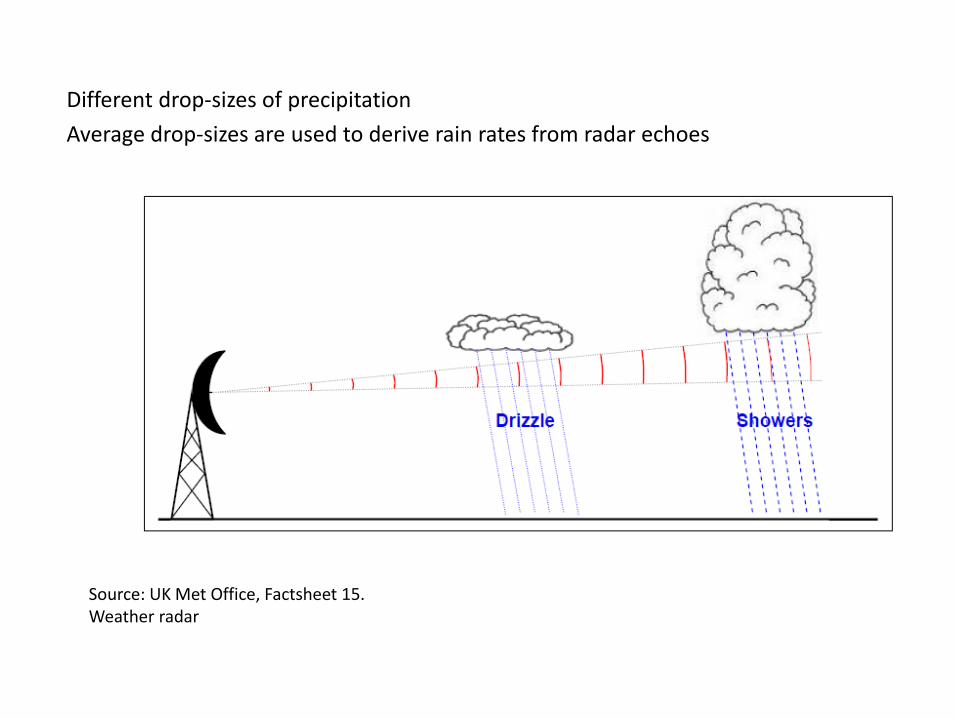
Different drop-sizes of precipitation
Average drop-sizes are used to derive rain rates from radar echoes
Source: UK Met Office, Factsheet 15. Weather radar
Different drop-sizes of precipitation
Average drop-sizes are used to derive rain rates from radar echoes
Can you draw the shape of a raindrop?

Different drop-sizes of precipitation
Average drop-sizes are used to derive rain rates from radar echoes
Can you draw the shape of a raindrop?
http://ga.water.usgs.gov/edu/raindropshape.html
x

Source: Met Office Factsheet 15 ‘Weather Radar’
Anomalous propagation (anaprop) when there is a low level temperature inversion
Source: UK Met Office, Factsheet 15. Weather radar

Source: Met Office Factsheet 15 ‘Weather Radar’
Evaporation of rainfall at lower levels beneath the beam
Source: UK Met Office, Factsheet 15. Weather radar

If radar rainfall is so difficult to derive, then why use it?
– Instantaneous image over large area
– would need large amount of rain gauges to create a similar image

– Actual site data: collected on or near a site using rain gauges, radar etc.
– Rainfall statistics: design storms and long term synthetic rainfall records (derived from historic rainfall data).
– ‘Real time’ data: data collected continuously and made available at/soon after collection
– All collected at different space and time scales!
Remember: there are several ‘Types’ of rainfall data

Design rainfall
Rainfall return periods
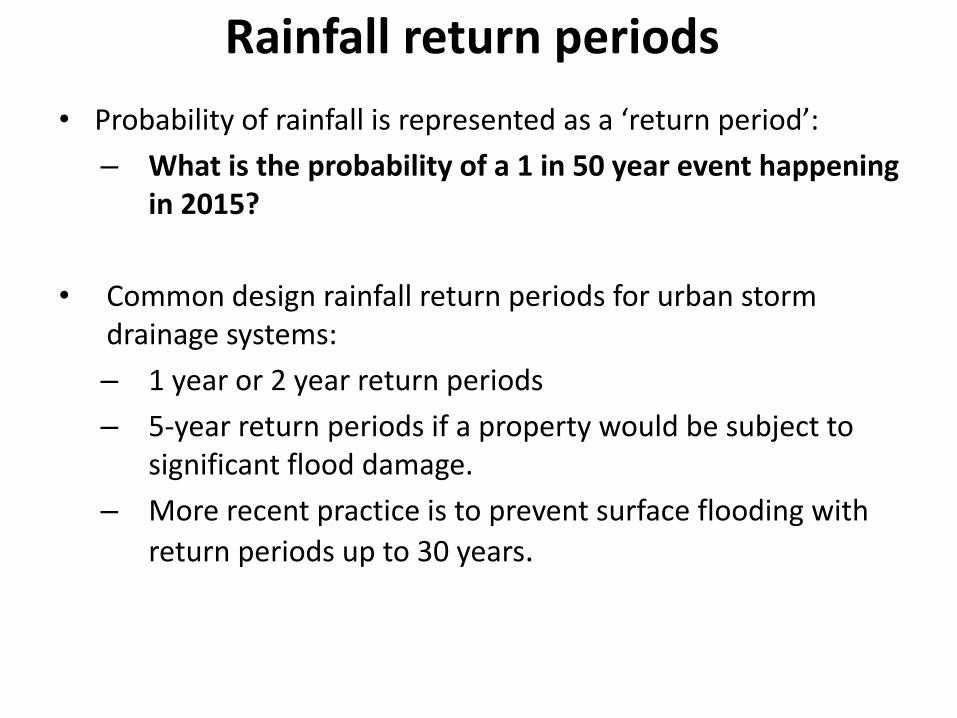
• Probability of rainfall is represented as a ‘return period’:
– What is the probability of a 1 in 50 year event happening in 2015?
• Common design rainfall return periods for urban storm drainage systems:
– 1 year or 2 year return periods
– 5-year return periods if a property would be subject to significant flood damage.
– More recent practice is to prevent surface flooding with
return periods up to 30 years.

Intensity – Duration – Frequency (IDF) curves
A convenient way of expressing rainfall information is the IDF curve:
Butler and Davies, Urban drainage
Each curve represents a different ‘return period’

UK design rainfall return periods
• Following the ‘Wallingford Procedure’ different rainfall duration, depth and return period combinations can be derived for any location
• Do you know how UK design rainfall is expressed?
• Commonly expressed as ‘MT-D’
for example M5-60 is the rainfall depth with return period 5 years and duration 60 minutes

Butler and Davies, Urban drainage
Map of UK M5-60 rainfall depths (in mm) More detailed maps can be found in Wallingford Procedure Different coefficients can be used to work from M5-60 to different durations or different return periods
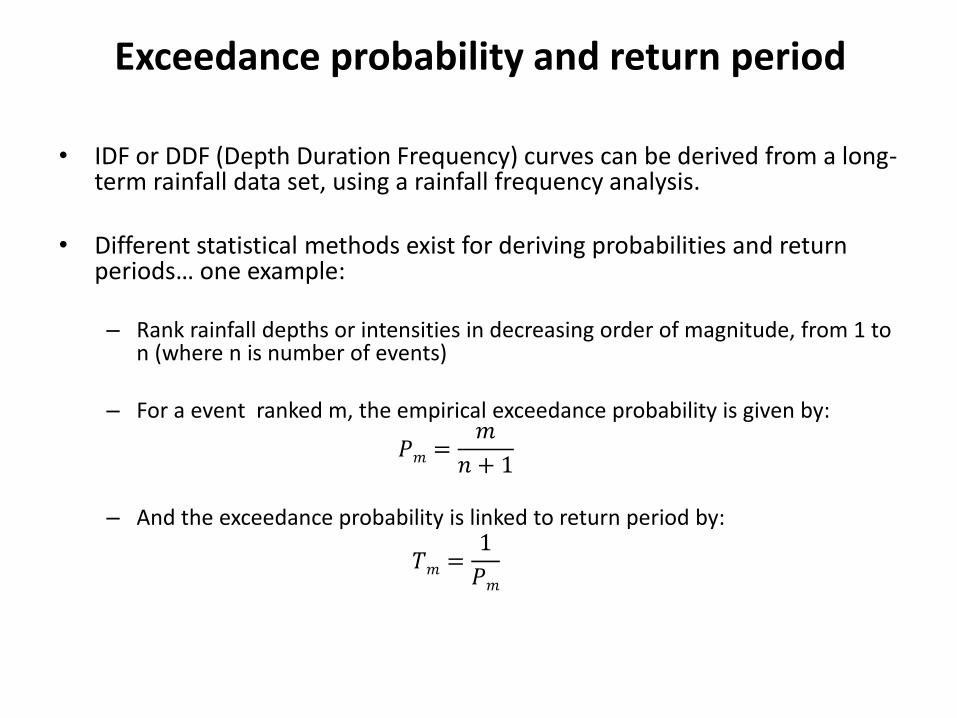
• IDF or DDF (Depth Duration Frequency) curves can be derived from a long-term rainfall data set, using a rainfall frequency analysis.
• Different statistical methods exist for deriving probabilities and return
periods… one example: – Rank rainfall depths or intensities in decreasing order of magnitude, from 1 to
n (where n is number of events)
– For a event ranked m, the empirical exceedance probability is given by:
𝑃𝑚 =𝑚
𝑛 + 1
– And the exceedance probability is linked to return period by:
𝑇𝑚 =1
𝑃𝑚
Exceedance probability and return period
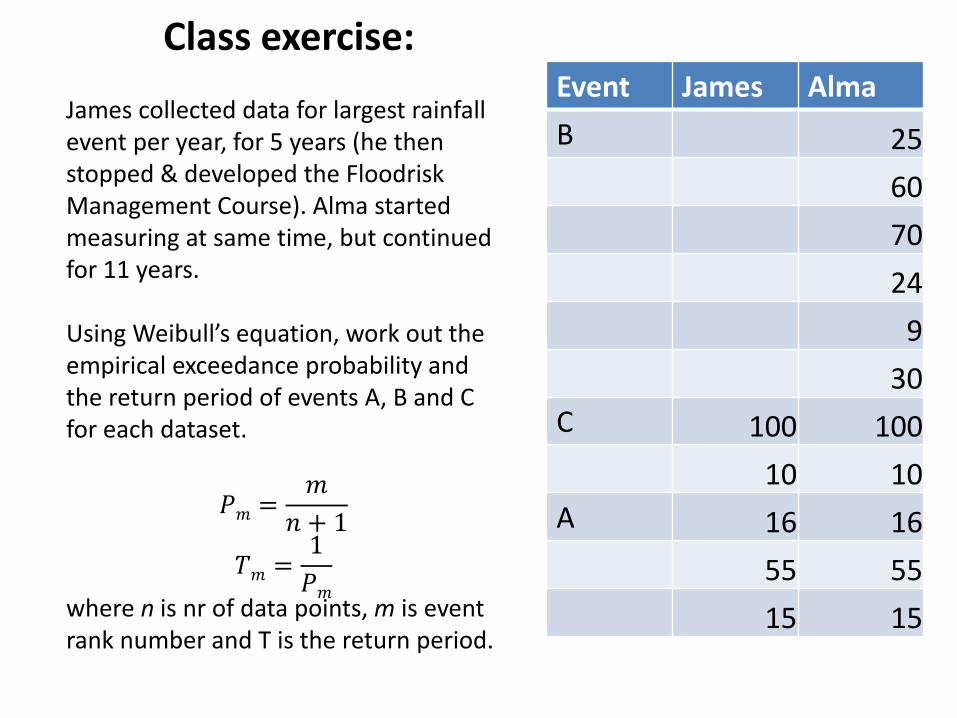
Class exercise: Event James Alma
B 25
60
70
24
9
30
C 100 100
10 10
A 16 16
55 55
15 15
James collected data for largest rainfall event per year, for 5 years (he then stopped & developed the Floodrisk Management Course). Alma started measuring at same time, but continued for 11 years. Using Weibull’s equation, work out the empirical exceedance probability and the return period of events A, B and C for each dataset.
𝑃𝑚 =𝑚
𝑛 + 1
𝑇𝑚 =1
𝑃𝑚
where n is nr of data points, m is event rank number and T is the return period.

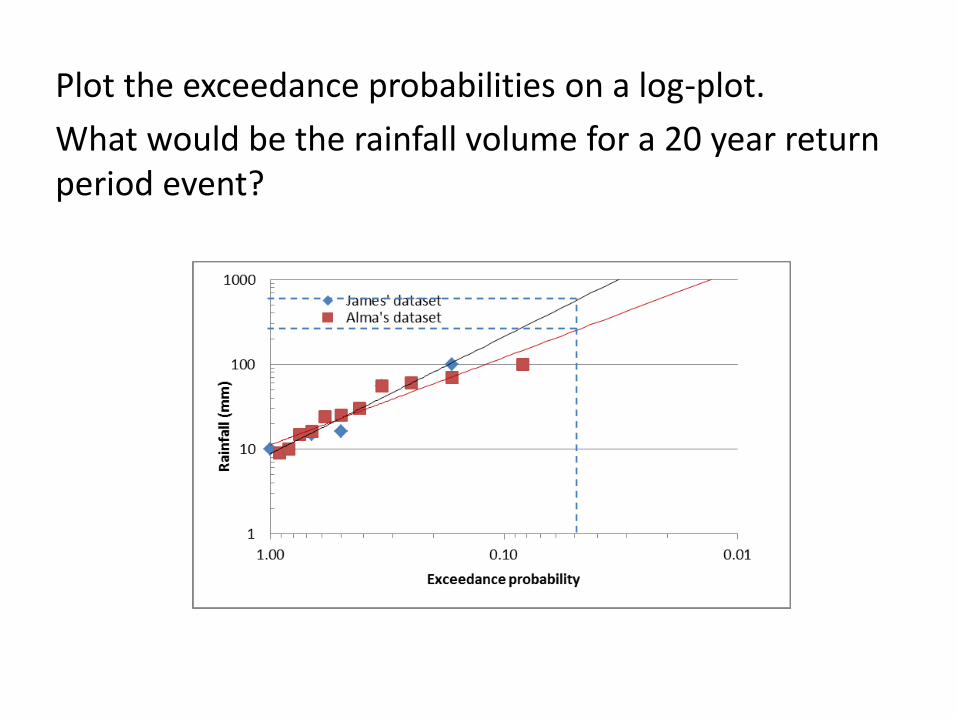
Plot the exceedance probabilities on a log-plot.
What would be the rainfall volume for a 20 year return period event?
Plot the exceedance probabilities on a log-plot.
What would be the rainfall volume for a 20 year return period event?
• What does that tell you of the reliability of return periods derived from short rainfall record?
• What could be an effect of climate change on rainfall return periods, and therefore on flood defence scheme designs?
Our class exercise dataset is too short for return period analysis!
My Research
• Investigating rainfall variability at a sub-kilometre scale
• Experimental rainfall data collection network is being set up – Area : 1200 * 700 m2
– Tipping bucket type rain gauges (0.2 mm)
– 10 stations located on the roofs of selected university buildings
This project has received funding from the European Union’s Seventh Framework Programme for research, technological development and demonstration under grant agreement no 607000.
