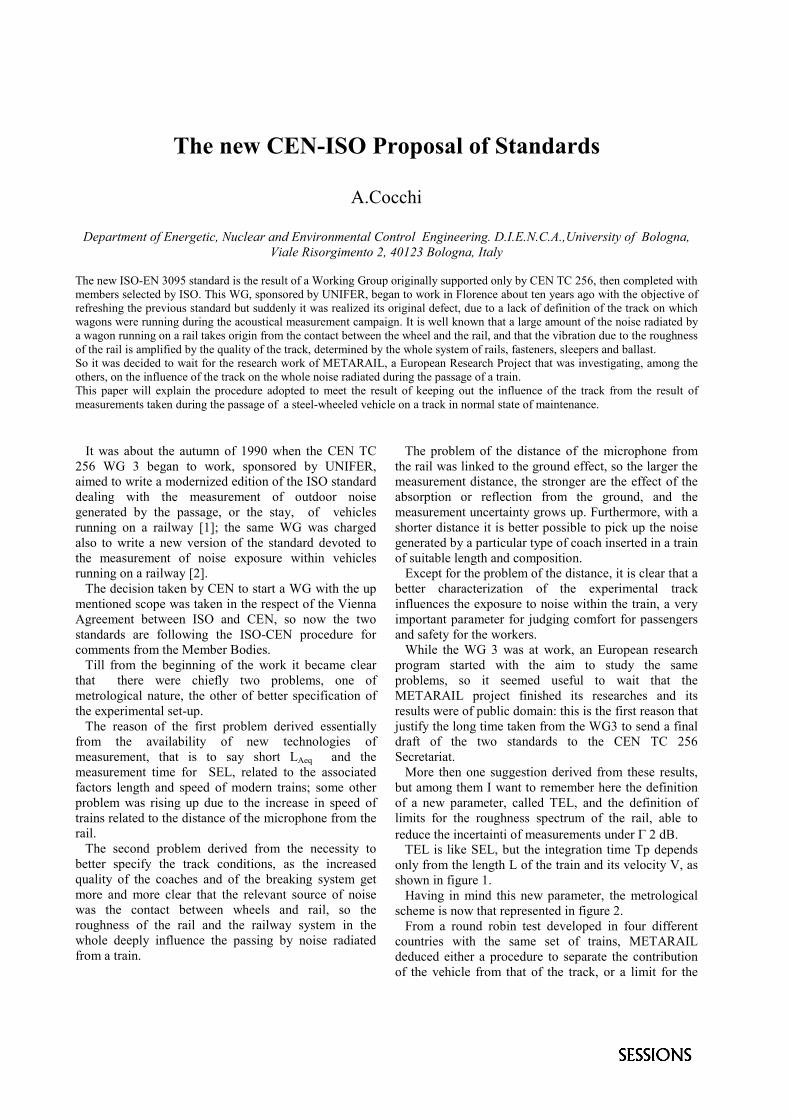
railway noise: measurement techinques and … · a wagon running on a rail takes origin from the...
TRANSCRIPT

The new CEN-ISO Proposal of Standards
A.Cocchi
Department of Energetic, Nuclear and Environmental Control Engineering. D.I.E.N.C.A.,University of Bologna,Viale Risorgimento 2, 40123 Bologna, Italy
The new ISO-EN 3095 standard is the result of a Working Group originally supported only by CEN TC 256, then completed withmembers selected by ISO. This WG, sponsored by UNIFER, began to work in Florence about ten years ago with the objective ofrefreshing the previous standard but suddenly it was realized its original defect, due to a lack of definition of the track on whichwagons were running during the acoustical measurement campaign. It is well known that a large amount of the noise radiated bya wagon running on a rail takes origin from the contact between the wheel and the rail, and that the vibration due to the roughnessof the rail is amplified by the quality of the track, determined by the whole system of rails, fasteners, sleepers and ballast.So it was decided to wait for the research work of METARAIL, a European Research Project that was investigating, among theothers, on the influence of the track on the whole noise radiated during the passage of a train.This paper will explain the procedure adopted to meet the result of keeping out the influence of the track from the result ofmeasurements taken during the passage of a steel-wheeled vehicle on a track in normal state of maintenance.
It was about the autumn of 1990 when the CEN TC256 WG 3 began to work, sponsored by UNIFER,aimed to write a modernized edition of the ISO standarddealing with the measurement of outdoor noisegenerated by the passage, or the stay, of vehiclesrunning on a railway [1]; the same WG was chargedalso to write a new version of the standard devoted tothe measurement of noise exposure within vehiclesrunning on a railway [2]. The decision taken by CEN to start a WG with the upmentioned scope was taken in the respect of the ViennaAgreement between ISO and CEN, so now the twostandards are following the ISO-CEN procedure forcomments from the Member Bodies. Till from the beginning of the work it became clearthat there were chiefly two problems, one ofmetrological nature, the other of better specification ofthe experimental set-up. The reason of the first problem derived essentiallyfrom the availability of new technologies ofmeasurement, that is to say short LAeq and themeasurement time for SEL, related to the associatedfactors length and speed of modern trains; some otherproblem was rising up due to the increase in speed oftrains related to the distance of the microphone from therail. The second problem derived from the necessity tobetter specify the track conditions, as the increasedquality of the coaches and of the breaking system getmore and more clear that the relevant source of noisewas the contact between wheels and rail, so theroughness of the rail and the railway system in thewhole deeply influence the passing by noise radiatedfrom a train.
The problem of the distance of the microphone fromthe rail was linked to the ground effect, so the larger themeasurement distance, the stronger are the effect of theabsorption or reflection from the ground, and themeasurement uncertainty grows up. Furthermore, with ashorter distance it is better possible to pick up the noisegenerated by a particular type of coach inserted in a trainof suitable length and composition. Except for the problem of the distance, it is clear that abetter characterization of the experimental trackinfluences the exposure to noise within the train, a veryimportant parameter for judging comfort for passengersand safety for the workers. While the WG 3 was at work, an European researchprogram started with the aim to study the sameproblems, so it seemed useful to wait that theMETARAIL project finished its researches and itsresults were of public domain: this is the first reason thatjustify the long time taken from the WG3 to send a finaldraft of the two standards to the CEN TC 256Secretariat. More then one suggestion derived from these results,but among them I want to remember here the definitionof a new parameter, called TEL, and the definition oflimits for the roughness spectrum of the rail, able toreduce the incertainti of measurements under � 2 dB. TEL is like SEL, but the integration time Tp dependsonly from the length L of the train and its velocity V, asshown in figure 1. Having in mind this new parameter, the metrologicalscheme is now that represented in figure 2. From a round robin test developed in four differentcountries with the same set of trains, METARAILdeduced either a procedure to separate the contributionof the vehicle from that of the track, or a limit for the
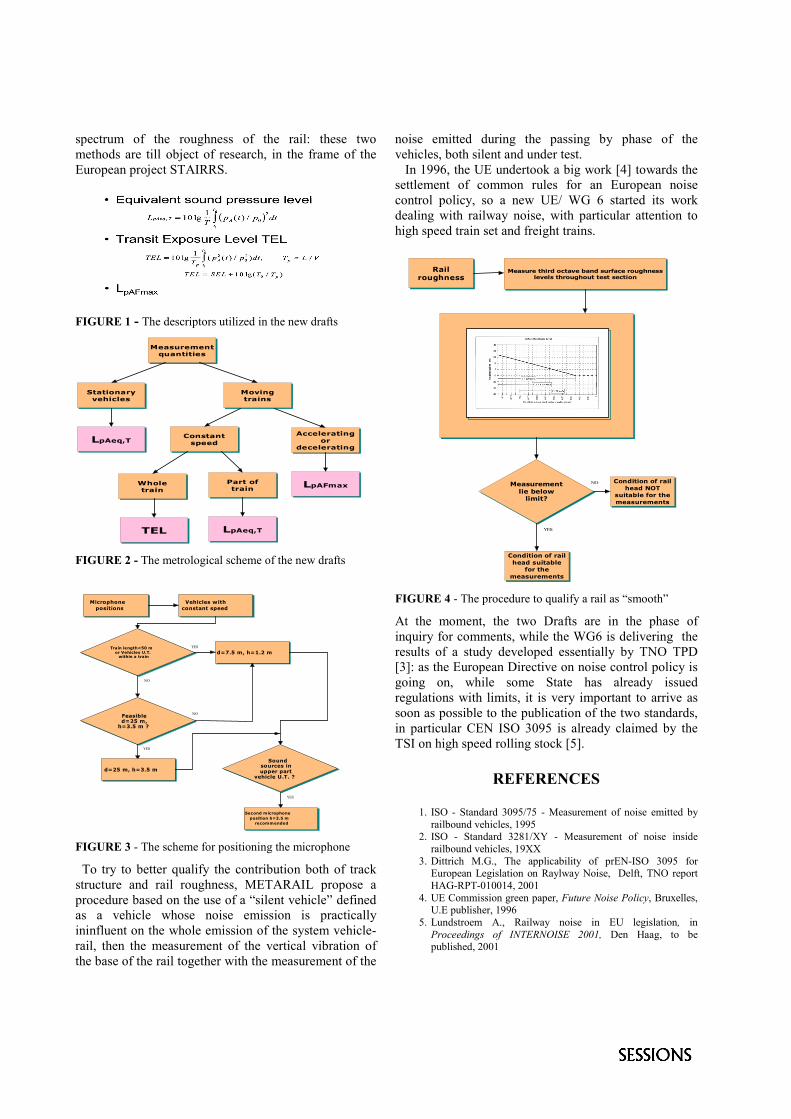
spectrum of the roughness of the rail: these twomethods are till object of research, in the frame of theEuropean project STAIRRS.
FIGURE 1 - The descriptors utilized in the new drafts
Measurementquantities
Stationaryvehicles
LpAeq,T
Movingtrains
Constantspeed
Acceleratingor
decelerating
Wholetrain
Part oftrain
TEL LpAeq,T
LpAFmax
FIGURE 2 - The metrological scheme of the new drafts
Microphone positions Vehicles with
constant speed
Train length<50 m or Vehicles U.T.
within a train NO
YES
Feasible d=25 m,
h=3.5 m ? NO
YES d=25 m, h=3.5 m
d=7.5 m, h=1.2 m
Sound sources in upper part
vehicle U.T. ? YES
Second microphone position h=3.5 m
recommended
FIGURE 3 - The scheme for positioning the microphone
To try to better qualify the contribution both of trackstructure and rail roughness, METARAIL propose aprocedure based on the use of a “silent vehicle” definedas a vehicle whose noise emission is practicallyininfluent on the whole emission of the system vehicle-rail, then the measurement of the vertical vibration ofthe base of the rail together with the measurement of the
noise emitted during the passing by phase of thevehicles, both silent and under test. In 1996, the UE undertook a big work [4] towards thesettlement of common rules for an European noisecontrol policy, so a new UE/ WG 6 started its workdealing with railway noise, with particular attention tohigh speed train set and freight trains.
Railroughness
Measure third octave band surface roughnesslevels throughout test section
Measurementlie below
limit?
NO
YES
Condition of railhead suitable
for themeasurements
Condition of railhead NOT
suitable for themeasurements
FIGURE 4 - The procedure to qualify a rail as “smooth”
At the moment, the two Drafts are in the phase ofinquiry for comments, while the WG6 is delivering theresults of a study developed essentially by TNO TPD[3]: as the European Directive on noise control policy isgoing on, while some State has already issuedregulations with limits, it is very important to arrive assoon as possible to the publication of the two standards,in particular CEN ISO 3095 is already claimed by theTSI on high speed rolling stock [5].
REFERENCES
1. ISO - Standard 3095/75 - Measurement of noise emitted byrailbound vehicles, 1995
2. ISO - Standard 3281/XY - Measurement of noise insiderailbound vehicles, 19XX
3. Dittrich M.G., The applicability of prEN-ISO 3095 forEuropean Legislation on Raylway Noise, Delft, TNO reportHAG-RPT-010014, 2001
4. UE Commission green paper, Future Noise Policy, Bruxelles,U.E publisher, 1996
5. Lundstroem A., Railway noise in EU legislation, inProceedings of INTERNOISE 2001, Den Haag, to bepublished, 2001
Noise Measurement Activity by Italian Railway
P. Scarano
FS S.p.A. - Divisione Infrastruttura - Direzione Tecnica - Istituto SperimentalePiazza Ippolito Nievo 46, 00153 Rome, Italy - [email protected]
Train noise measurement activity carried out by Italian railways is oriented to the following aims: measurements of immissionlevels as a consequence of the present Italian laws relating to acoustic pollution; research about the origin, propagation andreduction of noise. As far as the first item is concerned, the publication last November of the law on noise abatement planninghas completed the Italian legislation on railway noise. Over the next few years a large part of measuring activity will be aimedat the design of noise abatement systems. To this end measurements will be essential for obtaining noise levels before and afterthe construction of barriers and for applying calculation models. Thus it is extremely important to build up a wide and reliabledatabase containing train noise emission values.
RAILWAY NOISE MEASUREMENTMETHODOLOGY
In most environmental noise problems, it is oftennecessary to distinguish the different contributions ofseveral sources. This procedure is important because,in conformity with the current Italian legislation onnoise, every polluting subject must reduce its own partof noise in order to bring the total environmental noisewithin limits of the law. It is well known that railway noise is composed ofgenerally easily identifiable sound events generated bysingle train transits. Thus it is simple to measure thesound energy value (LAE)i or (LAeq)i related to the i-thsingle event. Eq. (1) gives the values of the equivalentsound level LAeq,TR calculated on the two referenceperiods TR: day-time (06-22) and night-time (22-06):
AE i
R
n0.1(L )
Aeq,Ti=1R
1L = 10 log 10T� �� �� �
� dB(A) (1)
where n is the number of transits during the TR period. In case of spurious events, that is to say events thatcould not be clearly associated to a train pass-by, theinspection of their time-history usually makes adecision possible. If there is still a residual doubt or ifsome events show evident anomaly due to, forexample, the overlap with noise generated by othersources, then those events have to be rejected from thecalculation. The rejection procedure could introducesome approximations but these can be minimized. Infact it is possible replace the rejected values with thearithmetic mean value obtained by the (LAE)i valuesdefinitely associated with the train transits. On theother hand, if there are relatively few uncertain or
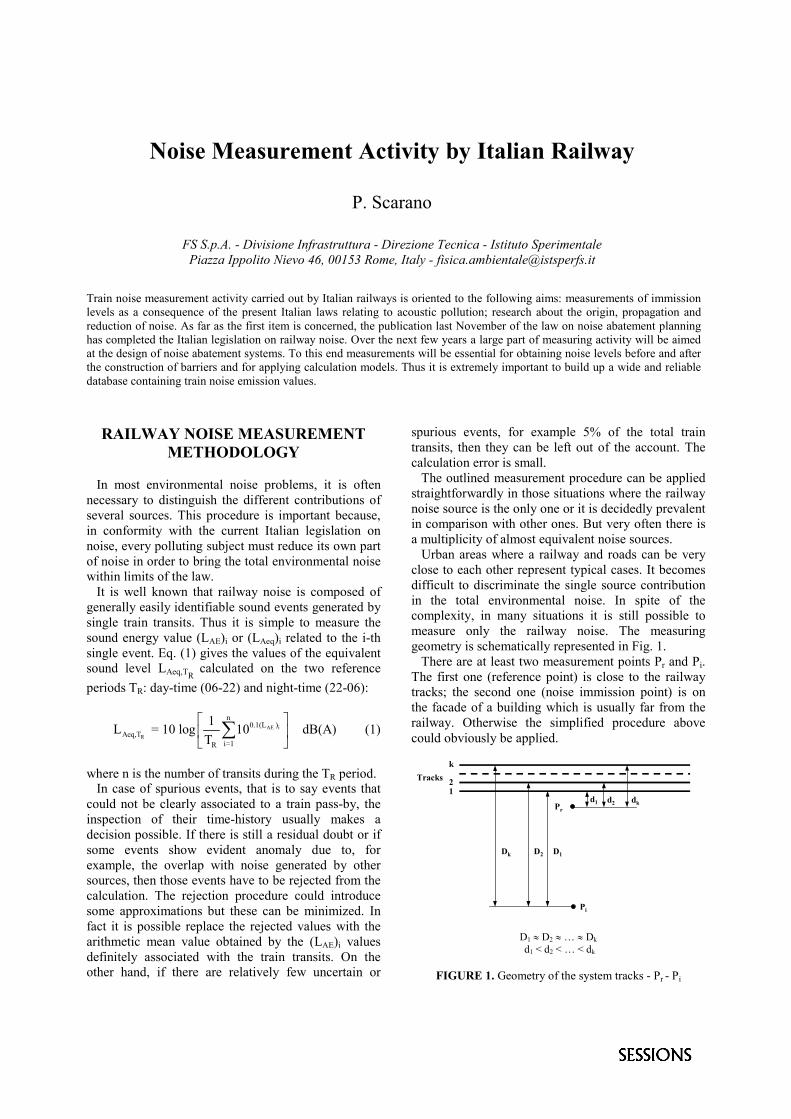
spurious events, for example 5% of the total traintransits, then they can be left out of the account. Thecalculation error is small. The outlined measurement procedure can be appliedstraightforwardly in those situations where the railwaynoise source is the only one or it is decidedly prevalentin comparison with other ones. But very often there isa multiplicity of almost equivalent noise sources. Urban areas where a railway and roads can be veryclose to each other represent typical cases. It becomesdifficult to discriminate the single source contributionin the total environmental noise. In spite of thecomplexity, in many situations it is still possible tomeasure only the railway noise. The measuringgeometry is schematically represented in Fig. 1. There are at least two measurement points Pr and Pi.The first one (reference point) is close to the railwaytracks; the second one (noise immission point) is onthe facade of a building which is usually far from therailway. Otherwise the simplified procedure abovecould obviously be applied.
Tracks12
k
Pr
Pi
d1 d2 dk
D1D2Dk
D1 � D2 � … � Dk
d1 < d2 < … < dk
FIGURE 1. Geometry of the system tracks - Pr - Pi
The calculation of LAeq,TR on the building facade isbased on the following equations:
[(LAeq,TR)j]Pi
= [(LAeq,TR)j]Pr
- �j dB(A) (2)
Aeq,T jR
R
k0.1(L )
Aeq,Tj=1
L = 10 log 10� �� �� �� dB(A) (3)
The term on the left in Eq. (2) is the soundequivalent level at Pi due to trains passing on the j-thtrack. It is given by the value of the same acousticmagnitude measured at Pr, taking into account theattenuation �j due to the noise propagation effectsbetween the two considered points. It can be calculatedas the average of the differences between LAE valuesmeasured at Pi and Pr for a few train transits. Eq. (3)gives the whole sound equivalent level at Pi as a sumof contributions of the k sources (k tracks). Someconditions have to be in place so that the procedurecan give reliable results:- Pr has to be in an acoustic free-field as much as
possible;- simultaneous measurements have to be carried out at
Pr and Pi points for at least a few transits (see below);- the duration of the measurement at Pr must be at least
24 hours;- the transit tracks must be distinguished exactly in
order to proceed to a correct calculation of �j values(see the conditions on the distances below thedrawing of Fig. 1);
- well identified railway noise events have to bemeasured only at the Pi point (at Pr there is noproblem of this kind) for a statistically significativenumber of passenger and freight train transits onevery track (1).
Measuring equipment
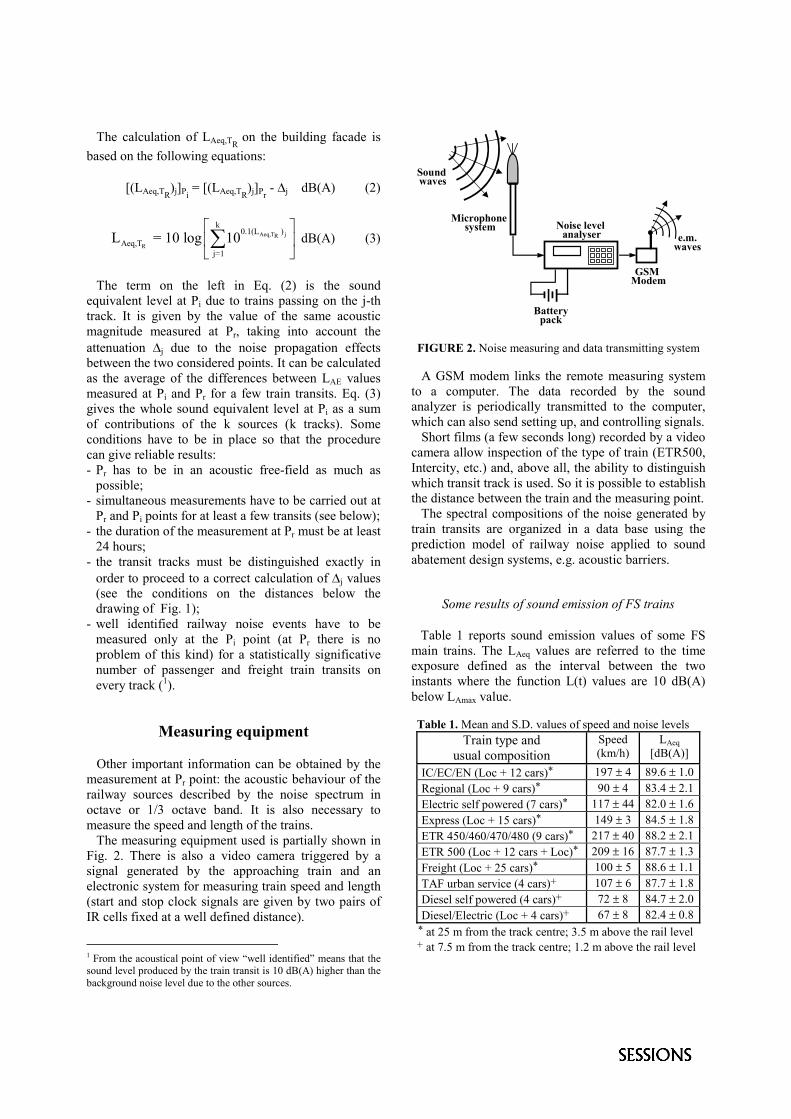
Other important information can be obtained by themeasurement at Pr point: the acoustic behaviour of therailway sources described by the noise spectrum inoctave or 1/3 octave band. It is also necessary tomeasure the speed and length of the trains. The measuring equipment used is partially shown inFig. 2. There is also a video camera triggered by asignal generated by the approaching train and anelectronic system for measuring train speed and length(start and stop clock signals are given by two pairs ofIR cells fixed at a well defined distance).
1 From the acoustical point of view “well identified” means that thesound level produced by the train transit is 10 dB(A) higher than thebackground noise level due to the other sources.
Microphone system
Battery pack
GSM Modem
Noise level analyser
Sound waves
e.m.waves
FIGURE 2. Noise measuring and data transmitting system
A GSM modem links the remote measuring systemto a computer. The data recorded by the soundanalyzer is periodically transmitted to the computer,which can also send setting up, and controlling signals. Short films (a few seconds long) recorded by a videocamera allow inspection of the type of train (ETR500,Intercity, etc.) and, above all, the ability to distinguishwhich transit track is used. So it is possible to establishthe distance between the train and the measuring point. The spectral compositions of the noise generated bytrain transits are organized in a data base using theprediction model of railway noise applied to soundabatement design systems, e.g. acoustic barriers.
Some results of sound emission of FS trains
Table 1 reports sound emission values of some FSmain trains. The LAeq values are referred to the timeexposure defined as the interval between the twoinstants where the function L(t) values are 10 dB(A)below LAmax value.
Table 1. Mean and S.D. values of speed and noise levelsTrain type and
usual compositionSpeed(km/h)
LAeq[dB(A)]
IC/EC/EN (Loc + 12 cars)* 197 � 4 89.6 � 1.0Regional (Loc + 9 cars)* 90 � 4 83.4 � 2.1Electric self powered (7 cars)* 117 � 44 82.0 � 1.6Express (Loc + 15 cars)* 149 � 3 84.5 � 1.8ETR 450/460/470/480 (9 cars)* 217 � 40 88.2 � 2.1ETR 500 (Loc + 12 cars + Loc)* 209 � 16 87.7 � 1.3Freight (Loc + 25 cars)* 100 � 5 88.6 � 1.1TAF urban service (4 cars)+ 107 � 6 87.7 � 1.8Diesel self powered (4 cars)+ 72 � 8 84.7 � 2.0Diesel/Electric (Loc + 4 cars)+ 67 � 8 82.4 � 0.8
* at 25 m from the track centre; 3.5 m above the rail level+ at 7.5 m from the track centre; 1.2 m above the rail level
The STAIRRS Project
M. Masoeroa
aDepartment of Energetics,Politecnico di Torino - Dip. Energetica, 10129 Turin, Italy
The EU funded STAIRRS project includes three Work Packages. WP1 (Railway Noise Strategy Support System) will developcost/benefit software to assess various noise reduction options (optimised wheels, new brake blocks, size/position of barriers) inorder to identify optimal combinations of noise reduction strategies applicable at national or European level. A decision supportsystem for noise policy makers supported by a European rail traffic database, topographical maps and cost data will beproduced. WP2 (Characterisation & Classification Methodologies) will develop methodologies (measurement and calculationtools) for describing different types of railway track and vehicles separately and propose an appropriate classification systemfor trains and track types, aimed at determining the contributions of vehicle and rail to noise emission. Main output of the workwill be a database containing train and track noise data from each participating country with analysis and assessment and aproposed classification system. WP3 (Consensus Building Workshops on Reducing Noise from Trains) will provide therelevant information to build a strategy and reach consensus on the priority action areas for noise source improvements and onthe optimal balance between source noise reduction and noise abatement, discuss the opportunities for the optimisation of rules,legislation and voluntary agreements.
INTRODUCTION
In the last ten years there has been increasing pressurefrom residents, environmental lobbyists and legislatorsto reduce railway noise levels. In Switzerland, Austriaand Italy (amongst other countries), legislation hasbeen introduced that sets tight limits on the amount ofnoise railways are allowed to create (and inherently thetraffic levels they can achieve). A number of WorkingGroups has been established by the EU's EnvironmentCommission to determine the EU's future policy onpotential noise legislation. Unless due consideration ofall the factors (economic, technical, environmental) istaken into account, new legislation could have apotentially serious impact on rail transport and couldparticularly interfere with the environmentallyencouraged growth of traffic from other sectors suchas road and air. The STAIRRS (Strategies and Tools to Assess andImplement noise Reducing measures in RailwaySystems), funded within the 5th Framework Programof the EU for the 2000-2002 triennium, aims atproviding the relevant information needed forinformed discussion and decision making required toensure that a fair but effective solution is reached [1].STAIRRS builds upon the results of previous researchprojects (Silent Freight, Silent Track, EUROSABOT,EUROECRAN, METARAIL) that have done much tofurther understanding of railway noise generationmechanisms, to develop noise prediction and modelingsoftware and to derive low noise components forpotential application.
At the same time that the technical andenvironmental developments are taking place, therailways themselves have been undergoing a radicalchange. Previously single entity railway organisationsare being split to establish separate companies withresponsibilities for service operation and infrastructuremanagement and maintenance. In this newenvironment, and given the legislative liabilityinherent in exceeding any prescribed noise limits, it isnecessary to address the problem of how theresponsibility for noise generation will be apportioned.
WORK PACKAGES
The STAIRRS program comprises of three distinctwork packages, the contents of which is brieflydescribed hereunder.
WP1 - Railway Noise Strategy Support System
The objective of WP 1 is to provide a Europe widesoftware tool to determine the large scaleenvironmental impact of railway noise based on acommon European database incorporating data onEuropean rail traffic and their noise characteristics,topographical maps, and comprehensive cost data forthe different noise mitigation options. The end user ofthe software will be decision makers at European andnational levels as well as members of the consortium. The software tool will provide the basis foraddressing issues such as quantify the reduction ofAnnoyance for different noise policies (benefit),
consider the economic effects of policy options (cost),compare country specific solutions, determine night-time freight capacity, study the consequences of noisemeasures on the viability of rail transport, and assessthe impact of operational measures.
WP2 - Characterisation & ClassificationMethodologies
Currently specified methods for measuring the noisefrom individual trains or vehicles in trains are limitedin their ability to produce repeatable and reproducibledata that can be reliable for the Cost Benefit Analysisof WP1, for legislative guidelines or for checkingcompliance. It is possible that in the future, financialbonus/penalty systems will be introduced for the use ofquiet/noisy rolling stock and track types, and thusvehicle types and track superstructure types will needto be classified. To implement such a system requires areliable method for measuring the noise creation oftrain/track combinations. Investigation of this topic has been carried out inthe METARAIL project [2] which focused onmeasurement methods for the assessment of railwaynoise creation. It was demonstrated that:� It is feasible to improve the repeatability and
particularly the reproducibility of railway pass-bynoise measurements significantly, using basicmethods by control of track roughness, train speedand site conditions concerning sound propagation.
� Methods could be developed and optimisedthrough which it is feasible to separate the trackand vehicle contribution to the overall noise level.However, these methods need furtherdevelopment and validation before they can beapplied and accepted as industrial practice.
Remaining differences between measurementresults of the same vehicle on different sites areestimated to be due to differences in:� site propagation conditions,� track dynamic behaviour,� track roughness. For more repeatable results the values of theseparameters need to be accurately identified so thatsuitable corrections can be applied as necessary. WP2 of the current proposal extends that work andhas the following objectives:� To provide methodologies with several levels of
detail to enable characterisation of railwayvehicles and railway track separately. By thesemeans it will be possible to apportionresponsibilities between infrastructure authoritiesand train operators, relate the effects of noisereduction measures on vehicle or track to differentsituations required for the Cost Benefit Analyses,
enable data to be transferred from one situation toanother, and propose a classification method
� To develop and validate the measurement andassociated calculation tools needed to fulfil themethodologies mentioned above.
� To perform measurements, using the newtechniques in order to demonstrate theclassification methodology and to provide inputsto the railway noise data base developed by WP1.
Achievement of these objectives in the form of reportsand proposals will be the deliverables for this WorkPackage.
WP3 - Consensus Building Workshops
Supporting WP’s 1 and 2, a number of consensusbuilding workshops will be organised to take accountof input from Railway operators, Infrastructuremanagement, capacity regulators, UIC/CER/UIP,legislators from EU, national authorities and localauthorities, industry, UNIFE, consultants anduniversities. The intention of the workshops is for the variousparties to reach agreement on how to balance theenvironmental needs of the Community with theavailable technical solutions and costs forimplementation within a realistic timescale. They willfurther establish a consensus view of the priority areasof source noise improvements.
ACKNOWLEDGMENTS
The Consortium running the STAIRRS project, undercontract n. 1999-RD.10442 with the EC Directorate-General for Transport, includes ERRI (coordinator,NL), PSI-A Consult (A), Université Libre de Bruxelles(B), SBB (CH), ETH Zurich (CH), DB (D), SNCF (F),Politecnico di Torino (I), AEA Technology (NL),TNO (NL) ISVR Southampton (UK).
REFERENCES
1. http://www.erri.nl/projects/stairrs
2. http://www.erri.nl/conferences/__99april.htm.

Acoustic Characterisation of Railway Tunnel PortalsA.C. Bertetti a, M. Masoerob and C. Ognibenec
aStudio Progetto Ambiente s.r.l., Corso Rosselli 44, 10128 Torino, ItalybDipartimento di Energetica Politecnico di Torino, C.so Duca degli Abruzzi 24, 10129 Torino, Italy
c FIATENGINEERING S.p.A., Corso Ferrucci 112, 10128 Torino, Italy
The 78.5 km long, Bologna-Firenze High Speed railway runs in tunnels for 94% of its length. Knowledge on noise emissionfrom railway tunnel portals is limited: thus, an experimental study aimed at verifying if and to which extent tunnel portals are asignificant noise emission source has been necessary. The experimental campaign performed along the Firenze-Roma directline has demonstrated that emissions are negligible when the High Speed or Intercity train runs inside the tunnel, while, duringpass-by outside the tunnel, a reduction of 3 dB(A) Leq compared to fill sections was detected.
INTRODUCTION
The 78.5 km long, Bologna-Firenze High Speed (HS)railway runs in tunnels for 94% of its length. Thestudies on environmental noise impact, and the relatednoise abatement actions, have been aimed at the tractsrunning on fill or cut sections, on viaducts, and attunnel portals. Tunnel portals represent sound emission areas,whose characteristics do not fall into the standardtypes of sources treated by railway noise predictioncodes, and for which the scientific literature [1,2],mainly addressed at road tunnels, proposes contrastingexperimental data. It has therefore been necessary to:a) Define if, and to which extent, the tunnel portal
determines an increase of the sound pressure levelcompared to a fill section or viaduct (Phase 1).
b) Determine the sound power emitted by the tunnelportal (Phase 2a) and the vertical and horizontalradiation diagrams (Phase 2b).
c) Identify the best ways of simulating the source in aray-tracing numerical simulation scheme(RAYNOISE code).The experimental campaigns have been performed
on the Firenze-Roma direct line (Galleria Castiglione,Viadotto Ascione), which is the only existing Italianrailway infrastructure whose characteristics are similarto the future HS lines, and on which HS trains (such asthe ETR 460 and ETR 500), as well as Intercity (IC)trains are presently in service.
EXPERIMENTAL CAMPAIGN
Phase 1 aims at determining the effect on sound leveldue to the presence of the tunnel. Measurements havebeen performed in 3 points at 3.5 m height above thetrack: P1, 25 m from the tunnel entrance, 25 m from
the track axis; P2 and P5, on the axis of the fill andviaduct tracts, 25 m from the track. In this phase,synchronised audio recordings during 36 train pass-byhave been performed. In phase 2a, measurements have been made in thepositions indicated in Figure 1. Points P1�P4 lay onthe semi-arch of radius 8.60 m, centred on thegeometric axis of the tunnel shaft and subdivided intosectors of 16° angular aperture, 3.5 m from the tunnelentrance; points P5 and P6, 25 m from the entrance,3.5 m and 25 m from the track axis, 1.5 m and 3.5 mheight; P7, in the niche about 100 m from the entrance,the microphone flush with the tunnel inside lining, 1.5m high. Synchronised audio recordings during 49 trainpass-by have been performed.
FIGURE 1. Position of the microphones
In phase 2b, measurements have been performed inpoints P8-P16 indicated in Figure 1. P8�P11 aresituated on a horizontal arch obtained by cutting asphere of radius 25 m and centre coinciding with thecentre of the tunnel entrance with a horizontal plane at+3.5 m height; the microphones cover a 71.1° arch;

P12�P16 are situated on a vertical arch obtained bycutting a sphere of radius 25 m and centre coincidingwith the centre of the tunnel entrance, with a verticalplane passing through the point 25 m from the tunnelentrance, at the minimum distance permitted by thetracks and the supply cables.; P7 is in the niche about100 m from the tunnel entrance with the microphoneflush with the tunnel inner lining 1.5 m height;synchronised audio recordings have been performedduring 52 pass-by. The analysis of the experimental results allow toconclude that, during pass-by of HS trains such asETR500 and ETR460, fill section tracts emit on theaverage 2.3 dB(A) more than the tunnel portal, with astandard deviation of 0.86 dB(A). Such trend isconfirmed by data of IC trains: fill section tracts emiton the average 2.5 dB(A) more than the tunnel portal,with a standard deviation of 1.6 dB(A). These average values have been calculated takinginto account recordings of HS and IC pass-by having aspeed differential between the two measurement pointsrespectively less than 5 km/h (HS) and 10 km/h (IC).The variance of the acoustic data associated to suchspeed ranges is of the order of � 0.5 dB(A).
The HS trains are characterised by an averagevalue of pass-by Leq (considering a Lmax – 20dB(A)cutoff level) of 86.6 dB(A) in front of the portal and87.2 dB(A) in front of the fill section.. Spectralanalyses confirm the presence of very low frequencycomponents near the portal, of negligible significancein relation to legislative limits compliance.
The analysis of synchronised multiple spectrafurthermore indicates that the SEL measured with thetrain outside the tunnel practically coincides (withdifferences of 0.2 dB(A) for HS and 0.3-0.4 dB(A) forIC trains) with the pass-by SEL. The fact that theportal is a negligible emission source is confirmed bythe fact that the difference between the SEL valueswhen the train is outside and inside the tunnel is about14 dB(A) for HS and 11-12 dB(A) for IC trains.
NUMERICAL ANALYSIS
In order to extend the field results to the tunnelentrances that are present along the Bologna-Firenzetract, a technique capable of reproducing the measuredsound field has been applied. Such technique is basedon the ISO 9613 standard, i.e. on the concept that theenvironment acts as a transfer function between thesound sources and the microphones used for the fieldmeasurements. The unknown sound power values havebeen determined with a numerical model of the areafacing the tunnel entrance, based on he Raynoise
numerical simulation code, starting from the measuredsound pressure levels. The numerical scheme of the tunnel portal hasbeen determined through trial simulations aimed atidentifying the system of sources that best fits theobjective of reproducing with an adequate degree ofaccuracy the sound field emitted by trains passinginside the tunnel. The acoustic modeling of HS and IC trains that bestfits the experimental data, for trains entering thetunnel, consists of one omnidirectional point sourcesituated at the entrance section, in correspondance ofthe track axis 4 m above the track level, plus onedirectional point source (directivity angle of 30° withrespect to the horizontal and vertical planes) on theaxis of the opposite track, still on the entrance plane at4 m height. Figure 2 shows the simulation of theacoustic field in proximity of the tunnel entranceduring a HS train pass-by.
FIGURE 2. SEL for HS train entering the tunnel
For trains coming out of the tunnel, the emissionsources consist of one omnidirectional point sourcesituated at the entrance section, in correspondence ofthe track axis 4 m above the track level, plus onedirectional point source (directivity angle of 30° withrespect to the horizontal and vertical planes) on theaxis of the opposite track, still on the entrance plane at4 m height.
Comparison between measured and simulated datashow an overestimate of the model of 0.1 – 2 dB(A);only at some points near diffraction edges or remotefrom the entrance plane the differences reach 3 - 4dB(A).
REFERENCES
1. H. Hoehnere, “Sound propagation at tunnel entrance”,Noise Control Engineering Journal, 1992
2. G. Campo, R. Pisani, P. Milone, “La riduzione delrumore da traffico stradale in uscita dalle gallerie:risultati di due progetti realizzati”, Congresso NazionaleA.I.A., 1993
Quasi-noisy Intercity TrainsG. Birlik
Department of Engineering Sciences,Middle East Technical University, 06531 Ankara, Turkey
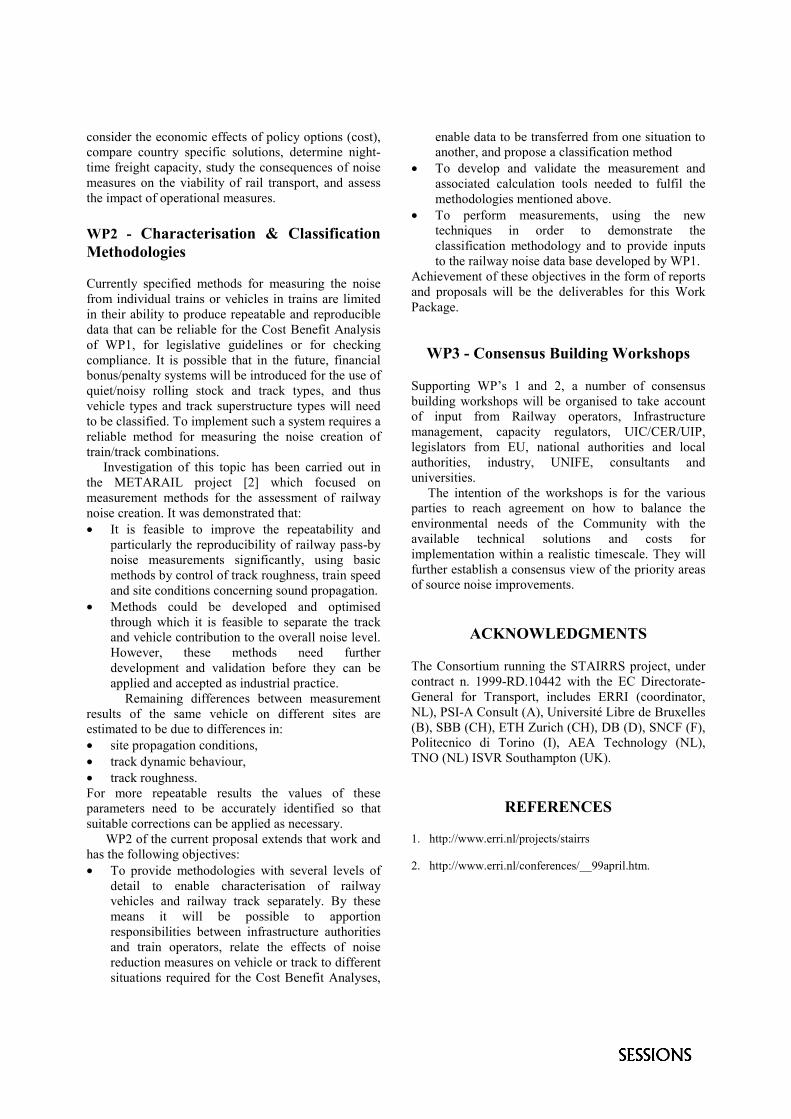
The interior noise level in a rail vehicle affects significantly the comfort of the passengers. Even though high frequencycomponents of the noise are successfully isolated in the coaches, low frequency components are still effective and passangers dohave complaints. In this study (i) questionnaires were designed in order to assess first, the rating of the inside coach noise by thepassengers then, their judgements about the traveller comfort (ii) interior noise level in each coach was measured (iii) salivasamples were taken from nine male volunteers just before and just after the voyage.
ASSESSMENT OF NOISE CLIMATEIN RAILWAY COACHES
A great deal of study has been done on the effect ofnoise caused by rail transportation and criteria foracceptable noise has been established �1�. Much,however, has been left to be done for the noise climateinside the railway coaches. Now, trains are more rapidand coaches are more lighter compared to the past.This gives rise to high levels of low frequency energyand thus a steep slope at low frequencies. Spectra, of acontinuous noise, having a slope of �-5 dB/octave isregarded as satisfactory �2� and articulation index=0.5is assumed to be the threshold of comfort �3�. In this study, the noise environment of the railcoaches is assessed not only by the results ofquestionnaires but also by the measured spectra.
FIGURE 1. Passenger Ratings
FIGUIRE 2. The degree of disturbance of the passenger
Questionnaires
The questionnaires (having 24 questions) aredistributed and collected during a 4.5 hr voyage inan intercity train. 48% (52%) of the passengerswere women (men). They were mostly young (36% at20-29 yrs). 54% of the travellers have assessed the interior noiseas "not high", but 30% were disturbed. The passengers seemed to prefer "Reading" to"Talking with their neighbours". 31% of them weredisturbed, while reading, by the noise level in thecoach.
Measured Spectra
The noise level in the coach was measured at, atleast, 3 points. Seat 1 was � on the bogies and just infront of the door. Whereas seat 34 was � at the middleof the coach. As can be seen the SPL level at f�25 Hzis above the threshold level and the slopes of thespectrum, at 16 Hz � f � 200 Hz, are steep for bothseats. Independent of the seat location the turning, inthis low frequency range, is at 40 Hz. The turning point
54
18
2 1
34
0
10
20
30
40
50
60
Too
Low Lo
w
Not
Hig
h
Hig
h
Very
Hig
h
Unb
eara
ble
Noise Level
% o
f Pas
seng
ers
2
12
8
27
3
18
10
20
0
10
20
30
N.d
istur
.
S.di
stur
.
Dist
ur.
V. D
istur
.
% o
f Pas
seng
ers
WomenMen

FIGURE 3. Distribution of first priority activities
FIGURE 4. Disturrbance of "Reading
in 200 Hz � f� 10000 Hz is location dependent. It is atf=1000 Hz for Seat 1 and f=500 Hz for Seat 34. Thespectrum slope of the seats, however, does not differsignificantly. It is worth noting that, independent of"where they sit", 54% of the passangers have rated thisnoise level (72 dB(A) for Seat 1 and 61.6 dB(A) forSeat 34) as "not high". Even though, passengers are more tolerant to the railnoise compared to the noise at home, they were notwithout stress. The analysis of the saliva of 9 malevolunteers have shown that �K+
�/�Na+� of 4 volunteers
have increased (min:8%, max:85%) at the end of 4.5hrs of voyage. But �K+
�/�Na+� of 4 volunteers have
decreased (min:8%, max:53%). The increase in �Na+�
is more significant compared to �K+�. More volunteers
have to be tested in order to arrive to a specificconclusion.
ACKNOWLEDGEMENTS
This work is dedicated to Ertuğrul Birlik.
(a)
(b)
FIGURE 5. Comparison of seats
REFERENCES
1. Bryan, M.E, J. of Sound and Vibration, 48, 525-535 (1976).
2. Hardy, A.J and Jones, R.R.K, Proc.Instn. Mech. Engrs, 203,79-85 (1989).
3. Bellucci, P., Coppi, M. and Santolani, S., "An acousticalcomfort chart: a simple way of evaluating the speechintelligibility inside urban transport vehicles", Proceedings ofInternoise 96, 1996, pp.2363-2366.
40
50
60
70
80
90
16 40 100
250
630
1600
4000
1000
0
f(Hz)
SPL
(dB
)
Seat 1
Seat 34
5560
6570
75
8085
90
16 25 40 63 100
160
f(Hz)
SPL
(dB
)Seat 1
Seat 34
200
11
111016
42
19
0
10
20
30
40
50
Thinking
Reading
Writ
ing
Working
Sleep
ing
Talking
Listen
ing M.
Activities
% o
f Pas
seng
ers
2430 31
96
0
10
20
30
40
N.d
istur
.
S.D
istur
.
Dist
ur.
H.d
istur
.
C.di
stur
.
Activities
% o
f Pas
seng
ers

Measurements and Analysis of the Noise to whichPassengers are Exposed in Istambul Metro
H. Erol
Istanbul Technical University, Faculty of Mechanical Engineering,Gumussuyu, 80191, Istanbul, Turkey
Recently, noise problems are gaining increasing importance in railway vehicles for passengers. The noise are controlled insiderailway vehicles for one or more of four reasons, comfort, ease of voice communication, freedom from hearing damage risk, andability to hear warning signals that originate outside. The internal noise levels in railway vehicles have been decreased step bystep during recent years due to the fact that stiff requirements on passenger comfort. This paper presents the results ofmeasurements and analysis of the noise to which passengers are exposed in Istanbul metro. These measurements demonstrate therole of wheel and rail maintenance in minimizing noise in the metro.
INTRODUCTION
Disturbance caused by noise is one of the mostimportant environmental health consequences of thetransport vehicles. Over a number of years,investigations in different countries have shown thatnoise affects different activities and causes a poorerlife quality. There is thus a great need to control noisecaused by transport. Investigations of the relationshipbetween exposure to originating from different noisesources in the transport vehicles and effects among theexposed population form an important basis fortechnical measures to limit noise generation and toregulate noise levels. Such investigations have studiedthe extent of annoyance among persons exposed todifferent types and levels environmental noise.
Interior noise is often a problem in the railwaypassenger car during transportation. This noise maydamage hearing if consistently of a high level or animpulsive nature, impair safety by making warningsdifficult to hear, hinder communication betweenpassengers, cause fatigue and loss of concentration andbe annoying. At the same time, acoustic comfort inrailway vehicles for passengers is becoming more andmore important parameter. Engineering criteria forspecifying acceptable noise levels and for rating themin those locations have been developed over the pasthalf century.
Although, railway lines ensure high qualityguidance, the track still has irregularities which causenoise and vibration, such as: defects in truck level,alignment or gauge, welding or rolling defects, railjoints, variable vertical stiffness of the truck (e.g.,bridges), level crossings, acceleration and breaking.
Attaining better acoustic characteristics in futurerailway vehicles requires a better understanding of thesound phenomena taking place in those cars. The majorproblem is to prevent the noise generated by exteriorsources, as the wheel-rail contact and traction system,
from penetrating into the passenger compartments.This study reports interior sound measurements andanalysis performed in operating conditions on theIstanbul Metro car.
MEASUREMENTS AND ANALYSIS INTHE RAILWAY PASSENGER CAR
Different types of measurements and ratings areused in the control and evaluation of noise dependingon purpose. In this study manual measurements ofnoise levels were performed with a sound level meterin the metro car circulating with passengers on its usualroute. One person made A-weighted sound levelmeasurements directly from one station to the nextduring the time between 08:00 and 20:00, for a periodof two hours, using a calibrated microphone on a standat a level of 1.5 m above the ground.
The statistical analysis of the internal noise of therailway passenger car is shown in Figure 1. The resultsfrom the measurements show that, of 1470measurements, the A-weighted noise level isconcentrated around 65 dBA, the level of continuousnoise. Corresponding internal noise levels for therailway passenger car are in the range 65-70 dBA,which represent a good compromise between low noiselevels, good privacy and speech comprehensibility, butthere are tonal and higher frequency components in thenoise spectrum. Furthermore, there are interior noiselevel fluctuations during the transportation that are notdesired.
Table 1 shows the equivalent continuous A-weighted noise levels Leq, measured according to timeintervals in the metro car circulating with passengerson its usual route from one station to the next. Leq is theA-weighted energy mean of the noise level averagedover the measurement period. The continuous steady

noise levels Leq are dissipating between 70.5 dBA and80.7 dBA.
0
5
10
15
20
25
30
35
40
45
55 60 65 70 75 80 85 90 95
Noise Level [dBA]
Prob
abili
ty D
istr
ibut
ion
[%]
FIGURE 1. Statistical analysis of the railway vehicle interiornoise.
Table 2 summarises the maximum A-weightednoise levels LMax, measured according to time intervalsin the metro car circulating with passengers on its usualroute from one station to the next. The maximum A-weighted noise levels LMax are changing between 78.9dBA and 92.1 dBA.
Table 1. Equivalent continuous A-weighted noise levels Leq,measured according to time intervals in the metro carcirculating with passengers on its usual route from onestation to the next.
Stations08 - 10 10 - 12 12 - 14 14 - 16 16 - 18 18 - 20
Ataköy 73,8 72,7 73,5 75,0 73,4 73,1Bahçelievler 72,9 73,0 73,1 75,2 74,6 77,3Bakırköy 71,6 72,4 71,9 72,7 72,7 72,7Zeytinburnu 74,7 73,2 72,3 73,4 72,4 73,9Merter 70,4 71,4 70,8 71,4 70,5 72,5Davutpaşa 71,0 70,7 71,4 72,2 71,6 71,9Terazidere 70,5 71,4 71,1 71,8 70,6 71,1Otogar 72,2 73,6 71,0 72,1 71,7 71,4Kartaltepe 72,4 72,9 71,5 73,5 72,8 73,0Sağmalcılar 73,8 73,3 72,9 73,5 74,9 74,9Bayrampaşa 74,5 75,4 74,3 75,5 76,8 77,6Topkapı 76,6 76,3 75,6 78,1 78,7 79,8Emniyet 78,2 77,0 76,2 77,5 79,0 80,7Aksaray 76,8 76,7 75,0 75,6 77,5 78,6
Time Intervals
CONCLUSIONS
The internal noise levels of railway vehicles havebeen gradually decreased during recent years due totougher requirements on passenger comfort, onexternal noise and an improved infrastructure. Tomodify and improve acoustical conditions in the metrocar, the relationship between sound sources and thecharacteristics of the car must be understand. Thereduction required in the railway passenger cardepends primarily on the function of the inner part of
the vehicle and the existing noise level within it. Theoverriding criteria, which must always be met, is thatrelating to hearing damage. In less noisy circumstancesthe allowable noise level may be defined by therequirements for adequate communication, passengercomfort, or avoidance of complaints from thepassengers at large.
Table 2. Maximum A-weighted noise levels, LMax, measuredaccording to time intervals in the metro car circulating withpassengers on its usual route from one station to the next.
Stations08 - 10 10 - 12 12 - 14 14 - 16 16 - 18 18 - 20
Ataköy 89,7 85,8 82,8 88,3 84,3 81,9Bahçelievler 80,3 81,1 82,2 85,1 82,4 83,7Bakırköy 80,2 80,1 79,6 86,0 81,0 78,9Zeytinburnu 84,3 88,3 83,0 94,3 82,5 82,1Merter 79,1 80,0 79,7 82,7 81,3 79,2Davutpaşa 80,3 78,9 82,1 82,2 80,4 78,7Terazidere 83,8 81,7 85,8 84,5 81,3 82,2Otogar 87,6 85,5 80,3 85,9 92,1 80,1Kartaltepe 81,4 86,5 81,3 88,5 81,1 81,4Sağmalcılar 84,3 82,9 83,0 84,2 90,4 86,0Bayrampaşa 82,3 83,4 85,6 85,4 90,7 87,6Topkapı 82,9 84,1 85,4 87,4 86,4 89,2Emniyet 85,4 86,5 86,5 87,9 86,5 90,8Aksaray 85,8 85,3 88,2 88,4 84,2 85,9
Time Intervals
The most important noise sources in the vehiclesduring operation are the track/wheel/suspension anddrive systems. Significant noise sources in stationaryvehicles are various types of auxiliary systems, butmainly compressors and fans. The noise produced byrailway vehicles is highly dependent on thetrack/wheel/suspension system and these factors shouldbe prime considerations in the selection of the type tobe used in a particular situation. Any noise controlstrategy must take some assumptions regardingrail/wheel maintenance. There can be no doubt that thewillingness to maintain a smooth contact surface is animportant technical factor in reducing noise. Goodmaintenance ensures a noise reduction of at least 3dBA, and potentially 5-10 dBA. This noise controlmeasure will also improve wear and passengercomfort, two factors closely connected to theeconomics of rail traffic.
REFERENCES
1. Beranek, L.L., Istvan L.Ver, Noise and vibration controlengineering: principles and applications, Wiley, NewYork, 1992.

Parametric Sensitivity Analysis ofRailway Noise Impact Assessment Modeling
Y. El Sayegh1and M. El-Fadel2
Department of Civil & Environmental Engineering, American University of BeirutBliss Street, Post Office Box 11-0236, Beirut, Lebanon.
1Research Assistant, [email protected] Professor, [email protected]
This paper presents a parametric sensitivity analysis for the Comprehensive Community Noise Model (CCNM), as applied tosimulate railway noise emissions. Various scenarios are explored including train technology, physical properties and speed, aswell as barrier and receptor locations along the alignment to identify the worst performing parameters associated with the highestnoise exposure levels.
INTRODUCTION
Railway noise constitutes a serious environmentalconcern in areas traversed by transit systems. The levelof exposure to transit noise is a function of traintechnology and length, rail car type, vehicle speed,installed auxiliary equipment, type of track work, aswell as the proximity of the railroad right of way(ROW) to existing buildings, or planned land use [3,4]. This paper aims at defining railway parameters thatare associated with noise exposure through the testingof a newly developed Comprehensive CommunityNoise Model (CCNM), which simulates noise levels atuser specified receivers [2].
METHODOLOGY
A sensitivity analysis to changes in receptor andnoise barrier locations, track length, and traincharacteristics was conducted. In all scenariosreceptors were located midway along the track, atdifferent distances along the track’s perpendicularbisector to obtain a noise profile up to 1,000 ft (305 m)away from the railway running surface. Average A-weighted noise levels were then obtained in terms ofLeq1 and Lmax2 for each receptor point by simulatingtrain passby incidents. Other noise sources, such asmotor vehicles, aircraft, and other point sources, wereassumed to be accounted for in the background levelwhich means that the simulated values abovebackground reflect the contribution of the transitsystem to ambient noise levels.
1 L equivalent describes a receiver's noise level at any moment in
time [1].2 L maximum defines the maximum noise level during a single noise
event[1].
MODEL SIMULATIONSBase Case Results
For the base case with a downtown background noiselevel of 70 dBA, predicted average noise levels rangedfrom about 75 dBA at 20 ft (6 m) away from therailway to 70 dBA at 1,000 ft (305 m), with maximumnoise levels reaching 101.1 dBA close to the track(Figure 1). Average and maximum noise levelsstabilize at 70 dBA and 100 dBA, respectively, atreceptors located further than 500 ft (152 m) awayfrom the track, implying that the noise emitted by atrain passby incident converges to the backgroundnoise level. For background levels less than 70 dBA,there are some differences in simulated noise levels forreceptors close to the track (up to 1.3 dBA at 20 ft (6m)). These differences increase with receptor distancefrom the track, due to the influence of backgroundnoise levels, reaching up to 13.5 dBA at 1,000 ft (305m). This stresses the significant role of the backgroundnoise level, which is a controlling factor of ambientnoise perception.
55
65
75
85
95
105
0 100 200 300 400 500 600
Receiver distance from track (ft)
Noi
se le
vel (
dBA
)
Lmax rural, Leq Quiet residential, LeqNoisy residential, Leq downtown, Leq
FIGURE 1. Base case average noise levels
Sensitivity Analysis Results
Results of the sensitivity simulations to variousparameters in terms of changes in noise levels with

respect to baseline conditions are summarized in Table1. All receivers located at distances larger than 500 ft(152 m) away from the track experience thebackground noise level of 70 dBA.
Table 1. Parametric sensitivity results
∆∆∆∆ dBA from base conditionat receiver locationParameter
20 ft 50 ft 100 ft > 200 ftTrack length (ft)
10,00014,000
+0.9-0.4
+0.10
00
00
Locomotive typeHeavy diesel
GE E– 60CPBritish Rail DieselEuropean ASEA
-0.9-2.4-1.3-2.6
-0.7-1.9-1-2
-0.5-1.2-0.7-1.3
-0.3-0.6-0.4-0.6
Number of engines2 +1.8 +1.1 +1 +0.4
Rail car typeDisk brakes
Intercity Deutsche BahnMkII, British
-1.2-1.2-0.3
-0.4-0.4-0.1
000
000
Number of rail cars4
12-0.7+0.5
-0.2+0.2
00
00
Train speed (mph)30
110+1.2+3
+0.7+1.6
+0.7+1.1
+0.3+0.4
Number of trains per day2692
-21.6
-1.31.2
-0.70.6
-0.30.3
Night trains26
-0.1-0.3
-0.1-0.2
-0.1-0.1
00
Sound barrier location (ft)1050
-4.10
-2.7-2.7
-1.3-1.8
-0.6-1
Receiver locationsalong track
00.05 L
0.325 L
-2.1-0.9+0.2
-1.600
-0.800
000
Simulation results revealed that the largest noiselevel reductions were effected through changes in traintechnology (6.7%), barrier distance from rail ROW(5.5% for barriers at 20 ft), receptor locations along thetrack (2.8%) and number of engines (2.4%). A traintechnology comprising a US diesel locomotive andpassenger coach with cast iron brakes was shown toemit the highest noise level, especially when comparedto the European ASEA RC4 – British Mk II passengercoach combination, whereby noise variations reached 5dBA (6.7%) for receivers at 20 ft from the track.
In general, the sensitivity of a railway systemparameter is largest when initial operating conditionsgenerate low noise levels, such as when the train isshort. Thus a train car added to a long train yields asignificantly less evident increment in the noise levelthan when a shorter train takes up an additional car.
This is illustrated by the increase in noise levels 20 ft(6 m) away from the track brought by the shift from 4– 8 rail cars (0.7 dBA) versus that associated with theshift from 8 – 12 rail cars (0.5 dBA). While the numberof additional cars was the same in both cases, the shiftfrom a shorter train yielded a larger noiseamplification. Furthermore, increasing the number oftrains per day by 30, from 26 – 56, resulted in a 2 dBAincrease in noise levels at 20 ft, whereas an increase of36 trains, from 56 – 92, increased noise levels by only1.6 dBA, implying that the increase in noise levelsbrought by an additional day train is not linear butrather larger for lower numbers of commuting trainsper day. The noise contribution per rail car decreasesfurther with increasing distance from track.
While the variation of other system parameters mayyield relatively insignificant noise reductions,sometimes indiscernible to the human auditory system,appreciable noise reduction may still be achievedthrough their simultaneous application. This however,does not eliminate the need for intervention at thereceiver level, through sound barriers and/orsoundproofing.
LIMITATIONS
The simulation exercise had several limitations, somepertaining directly to the model and others to theassumed parameters. The major drawback however,was the unavailability of transit noise measurements,necessary for model calibration. Furthermore, the pointversus line source approximations of a train remaindebatable. Other limitations to simulating real lifecases include the assumption that all tracks werestraight, the model’s limited range of acceptable tracklengths, which led to the consideration of 20,000 ftlong tracks, and finally, its inability to differentiatebetween day and night trains, which can be attributedto the early development stage of the software.
REFERENCES
1. FRA (Federal Railroad Administration). High SpeedGround Transportation Noise and Vibration ImpactAssessment. U.S. Department of Transportation.Washington, USA, 1998.
2. MacDonald, J.M. A Comprehensive Community NoiseModel. PhD Dissertation, Community Noise Laboratory,University of Central Florida, 2001.
3. Parsons Brinckerhoff (PB). Feasibility and benefit-coststudy of Trans-Hudson, Cross-Westchester and StewartAirport rail links. Metropolitan Transportation Authority,USA, 1994.
4. Netherlands Organization for Applied ScientificResearch (TNO). Methodologies and actions for railnoise and vibration control. A RTD project supported bythe European Commission DGVII, 1997-1999. [online].Available: http://www.tpd.tno.nl/tpd/smartsite582.html,1999.

Monitoring of sound levels of present day trains on theSpanish railway network
A. Gimenez,A. Marin, A. Sanchis,J.Romero,S.Cerdáb andL.Fausa
aEUITT “La SalleBonanova”.UniversitatRamonLlull. SpainbGrupodeAcusticaArquitectonica,Ambientale Industrial. UniversitatPolitécnicadeValencia.Spain
Within the Spanishstatethereno definedmodelsfor the measurementof the soundof railway traffic currently acceptedby thegovernment,for this reasonit is possibleto useany of the widely acceptedinternationalsystemson new lines. In this study theintentionis to find a simplemodelof soundevaluationmadeby trainswhich alreadyuse,or in the foreseeablefuture will usetheSpanishrailway network. Eight differentkindshave beenmonitoredin thestudy. Thesoundlevel of eachtrain hasbeenmeasuredconsideringasparametersspeedand length of the train andsubsequently using the methoddevelopedin Franceandpublishedin“Guidedu Bruit”.
INTRODUCTION
Within the Spanishstatethereno definedmodelsforthemeasurementof thesoundof railwaytraffic currentlyacceptedby thegovernment,for this reasonit is possibletouseany of thewidelyacceptedinternationalsystemsonnew lines. In this studythe intentionis to find a simplemodelof soundevaluationmadeby trainswhich alreadyuse,or in theforeseeablefuturewill usetheSpanishrail-waynetwork.
Our referencepoint wasthe Frenchmodel[1] devel-opedin 1980. This modelusesspeedandlengthto de-scribethe train noiseto determinehow soundlevel de-creaseswith distance.We chosethis modelbecauseit isvery simple. NoisemeasuresweremadeandtheFrenchmodelwasevaluated.
Measures description.
Measureswereregisteredat eight differentpositionsin the first season,andat five differentpositionsin thesecondseason.Sonometersweredistributedaswe couldseein Figure1. We measuredLeq, ν andl for eachtrain.Thetrainsoundwasrecordedandthusfrequency analysiswaspossible.
GUIDE DU BRUIT MODEL
Thismodelwaspublishedin 1980[1]. Althoughit wasmadefrom measuresthattodayarepossiblyobsolete,thismodelis very simpleandthusit will be an appropriatedmodelfor our measures.Accordingto this model,Lmax
is a functionof thekind of train, distanceandspeed.Wecouldmeasureat a distanced0 andspeedν0 thevalueof
FIGURE 1. Distribution of measurementpoints.
Lmax, andthenwe canusetheexpressions
L0� Lmax
�d0 � ν0 � (1)
Lmax� L0 � klog
dd0
�30log
νν0
(2)
where k, consideringno energy absorptionand thenceonly geometricdivergence,controlstheattenuationof thenoisewith the distance.This parameteris a function ofthe kind of train. The modelpropoundsconcretevaluesfor k andL0 for eachkind of trainandspecificsd0 andν0.

Table 1. Model verification
ν(km/h)
l(m) Lmodel
0 Lexp0 kmodel kexp
dB � A� kexp63Hz
Ave 275 200 101 87.9 15 19.7 11.6Euromed 200 200 97 84.7 15 30.7 16.9
Talgo-2000 200 150 97 84.3 15 24.2 14.4Talgo 200 135 97 88.9 15 39.9 17.0Arco 200 125 97 90.0 15 35.8 18.5
Estrella 160 280 94 94.6 12 40.8 15.2Short 160 80 94 82.0 17 38.1 19.4
Goodstrain 100 350 94 85.6 12 32.1 15.2
MODEL EVALUATION
To verify themodelweusedareferencedistanced0 �25 m, and the L0 valuesobtainedfrom the model forthemeanspeedof eachtrain. Thereforethespeedterminequation2, vanishes.Usinga linearregressionmodelwecanobtainthevaluesof k andL0 thatbetteradjustto themeasures.Theseresultsareshowedin Table1.
L0 revised
From Table1 we canconcludethat it is necessaryarevisionof L0 valuesproposedin theFrenchmodel.OnlyEstrellatrain hasa negligible differencewith themodel.In the restof thecasesthe modelproposessoundlevelsthat they arebetween7 and13 dB above the registered.We think thatpossiblereasonsof this fact, arespeedde-pendenceor the improvementsin trainsandrailway net-works. Thencethenecessityof new measuresin Franceto confirmthis fact.
k revised
Concerningtheevaluationof theparameterk thatcon-trols thedistanceattenuation,we shouldconsidertheat-tenuationdueto geometricdivergenceandtheattenuationdueto all the real losses(divergence,absorption...).Tocalculatetheattenuationdueto geometricdivergence,wecanconsiderthevalueobtainedin theadjustmentfor thebandof 63 Hz. In the bandof 63 Hz attenuationduetootheraspectsdifferentto theown attenuationby geomet-ric divergenceshouldbeminimal.
In Table1,wecanseekexpdB A (attenuationdueto all the
real losses),andkexp63Hz (an approximationto divergence
attenuation).TheFrenchmodelusesatheoreticvaluefork, deducedfrom the valuesfor a point source(k � 20)
and a linear source(k � 10). For the resultswe couldconcludethat it is possiblethat themodelwastoo muchsimple.
CONCLUSIONS
The evaluationof the experimentaldatathroughtheFrenchmodeloffersasclearconclusionthatthedatausedin thismodelshouldbeupdatedfor theSpanishcase.
1. Thevaluesproposedto L0 arebetween7 dB and13dB greaterto themeasured.
2. TheFrenchmodelconsiderstheattenuationwith thedistancedue to geometricdivergence. To evaluatethis parameterwe usedtheparameterkexp
63Hz sinceinthebandof 63 Hz thesoundlossesdueto any otherfactorsshouldbe theminimal possible.The valuesproposedby themodelaresomethinginferior to theobtainedfor theparameterkexp
63Hz too.
TheFrenchmodelis verysimpleandeasyof use,but rail-waynetworksandtrainimprovementscouldcausethene-cessityof amorecomplex model.Furthermore,statisticalmodelsalwaysimplies possiblerevisionsbecausepopu-lationchange.
REFERENCES
1. Guide du Bruit.Ministerede l’enviromentet du cadredevie. (1980).
Measurement of the Low-frequency Sound Radiated fromthe Train Using the Microphone Array
K. Kikuchia, K. Manabeb , Y. Tanakaa , and Y. Yoshidaa
aEnvironmental Engineering Division, Railway Technical Research Institute, 2-8-38 Hikari-cho Kokubunji-shiTokyo, 185-8540, Japan
bResearch & Development Promotion Division, Railway Technical Research Institute, 2-8-38 Hikari-choKokubunji-shi Tokyo, 185-8540, Japan
When a train runs in an open section at high speed, various pressure fluctuations are generated. Some researches have beencarried out until now about the pseudo-sound observed when the train nose, tail, and pantograph-shield sections pass. However,researches have not been performed so far about the low-frequency sound continuously radiated from the train. In this research,the low-frequency sound was measured with a microphone array to search the sound source. When the microphone array [1] isapplied to the low-frequency sound, it is required to assume that the incident wave is spherical. When the spherical wave entersthe microphone array, however, its directivity will decrease. Then, a method to improve the directivity is proposed. Basicexperiments were conducted to investigate the directivity of the microphone array and the effectiveness of this correctionmethod. Next, the low-frequency sound radiated from high-speed trains was measured with the microphone array by applyingthe above-mentioned correction method. It has been clarified that the sound sources of the low-frequency sound are in the trainnose section and the pantograph-shield section.
SPHERICAL WAVE CORRECTIONMETHOD
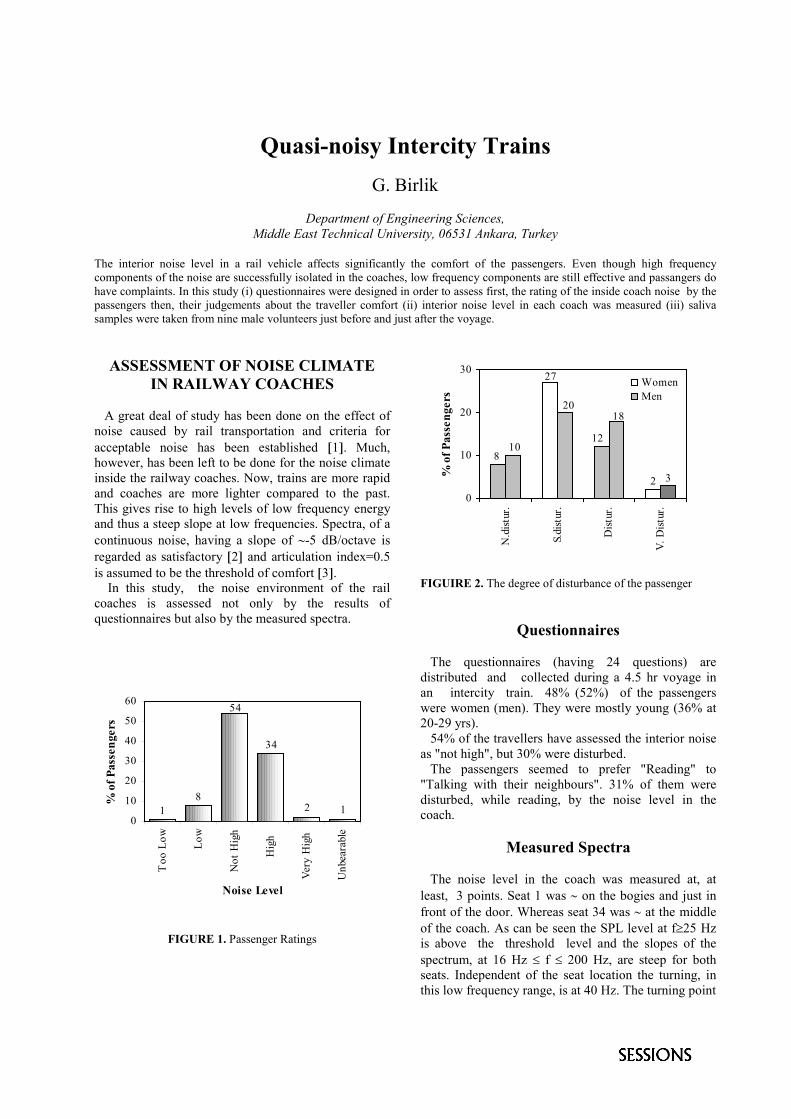
The directivity of a microphone array in case theincident wave is spherical is shown in Figure 1. Theresults of the experiment corresponding to the theoryare also shown in the figure. It follows from the figurethat the directivity decreases as the frequency becomeslower.
FIGURE 1. Directivity of microphone array.
The reason why the directivity decreases when theincident wave is spherical is shown in Figure 2. Thatis, even when the angle of incidence is 0 degrees,different amplitudes and phase angles of the soundpressure are observed by different microphones. Then,if the correction method to make theses differences 0is performed, it will be thought that the directivity isimproved.
FIGURE 2. Relative location of the sound source andmicrophones in case the angle of incidence is 0degrees.
The correction method is as follows. To correct theamplitude, the sound pressure observed with the j-thmicrophone is multiplied by q j . The value of q j isgiven by the following equation,
q j = 1+j c
2s
2
, (1)
where c is the wave length corresponding to thecenter-frequency of octave-band and s is the distancebetween the 0–th microphone and the sound sourcewhen the angle of incidence is 0 degrees. To correct

the phase angle, the observation time of the j-thmicrophone is delayed qj −1( ) /c 0 where c 0 is thespeed of sound.
If the above-mentioned correction is performed, thedirectivity K2 ,( ) is expressed by the followingequation,
K2 ,( )=wj
j ( )cos csq j 1− j ( )( ){ }
j =−n
n
∑
2
+wj
j ( )sin csq j 1 − j ( )( ){ }
j =−n
n
∑
2
, (2)
where 2n +1 is a number of microphones, w j is theweighting factor for each microphone. And j, c ,and are given by the following equations,
j ( ) =1
qj
1+j c
2s− tan
2
, c =2
c
, =c
,
where c is the angular frequency corresponding tothe center-frequency of octave-band, and is anangular frequency in octave-band. The calculation results of equation (2) and itscorresponding experiment results are shown in Figure3. The figure shows that the directivity has beenimproved by the correction.
FIGURE 3. Directivity of microphone array afterspherical wave correction.
MEASUREMENT RESULTS OF FIELDTEST
The microphone array and the correction methodwere applied to the low-frequency sound radiated fromhigh-speed trains. The measured frequencies are 8, 16,and 31.5Hz in octave-band. A schematic measurementdiagram of the field test is shown in Figure 4.
FIGURE 4. Schematic measurement diagram of fieldtest.
The directive waveforms before and after correctionare shown in Figure 5. It has been verified that thesound sources are precisely located by the correctionin the field test results as well. It can also be read inthe figure that sound sources are mainly in the trainnose section and the pantograph-shield section.
FIGURE 5. Directive waveforms before and aftercorrection.
REFERENCES
1. M. Arai and T. Chino., Proceedings of Acoustical Societyof Japan, 1978, pp. 501-502.