raid mechanisum
DESCRIPTION
raid 5TRANSCRIPT
Chapter Objective
After completing this chapter, you will be able to:
Describe what is RAID and the needs it addresses
Describe the concepts upon which RAID is built
Define and compare RAID levels
Recommend the use of the common RAID levels based on performance and
availability considerations
Explain factors impacting disk drive performance
Data Protection: RAID

Data Protection: RAID Why RAID
• Performance limitation of disk drive
• An individual drive has a certain life expectancy
– Measured in MTBF
– Example
• If the MTBF of a drive is 750,000 hours, and there are 1000 drives in
the array, then the MTBF of the array becomes 750,000 /1000, or 750
hours
• RAID was introduced to mitigate this problem
• RAID provides:
– Increase capacity
– Higher availability
– Increased performance

Data Protection: RAID
RAID Array Components
RAID Controller
Hard Disks
Logical Array
Physical Array
RAID Array
Host

Data Protection: RAID RAID Implementations
• Hardware (usually a specialized disk controller card)
– Controls all drives attached to it
– Array(s) appear to host operating system as a regular disk drive
– Provided with administrative software
• Software
– Runs as part of the operating system
– Performance is dependent on CPU workload
– Does not support all RAID levels

Data Protection: RAID
RAID Levels
• 0 Striped array with no fault tolerance
• 1 Disk mirroring
• Nested RAID (i.e., 1 + 0, 0 + 1, etc.)
• 3 Parallel access array with dedicated parity disk
• 4 Striped array with independent disks and a dedicated parity disk
• 5 Striped array with independent disks and distributed parity
• 6 Striped array with independent disks and dual distributed parity

Data Protection: RAID Data Organization: Striping
Stripe 1
Stripe 2
Strips
Strip 1=64KB
Stripe=192KB
Strip
Stripe
Strip 2=64KB Strip 3=64KB

Data Protection: RAID
RAID 0
1
9 5
2
10 6
3
11 7
0
Host
RAID Controller
Data Protection: RAID
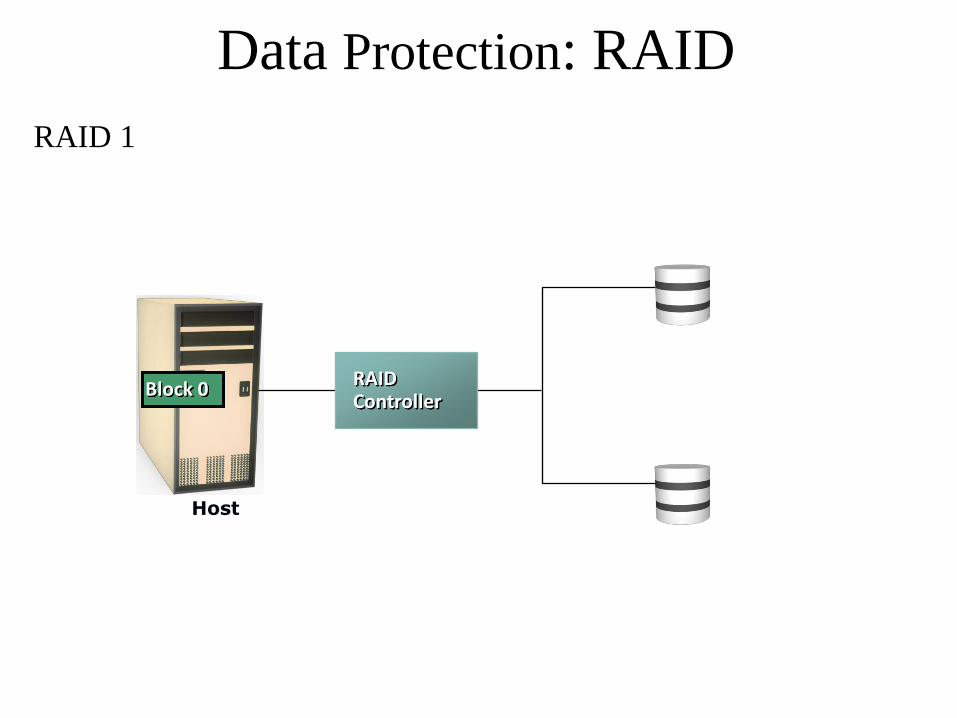
RAID 1
Block 1 Block 1 Block 1 Block 0 Block 0
Host
Block 0 RAID Controller

Data Protection: RAID
Host
Block 5 Block 4 Block 2 Block 1
Nested RAID – 0+1 (Mirrored Stripe)
Block 5
Block 4
Block 2
RAID 0
Block 1
RAID 1
Block 0 Block 3 RAID Controller

Data Protection: RAID Nested RAID – 0+1 (Striping and Mirroring)
RAID Controller
Block 5
Block 4
Block 2
RAID 0
Block 1
RAID 1
Block 5
Block 4
Block 2
Block 1
Block 5
Block 4
Block 2
Block 1
Host

Data Protection: RAID
Host
Nested RAID – 1+0 (Mirroring and Striping)
Block 5
Block 5
Block 2
RAID 1 Block 0 Block 0
Block 2
RAID 0
Block 3 Block 3 RAID Controller
Block 1
Block 1
Block 4
Block 4

Data Protection: RAID
Host
Nested RAID – 1+0 (Mirroring and Striping)
RAID Controller
RAID 1
Block 1
Block 1
RAID 0
Block 4
Block 4 Block 5
Block 5
Block 2
Block 2 Block 1
Block 4

Data Protection: RAID RAID Redundancy: Parity
Parity Disk
1
9 5
3
11 7
0
0 1 2 3 4 5 6 7
4
6
1
7
18
Host
RAID Controller
Parity calculation 4 + 6 + 1 + 7 = 18 The middle drive fails:
4 + 6 + ? + 7 = 18 ? = 18 – 4 – 6 – 7 ? = 1
?

Data Protection: RAID
Host
RAID Controller
Block 1
Block 2
Block 3
P 0 1 2 3
Block 0 Block
Parity Generated
RAID 3

Data Protection: RAID
Host
Block 0
P 0 1 2 3
P 4 5 6 7
RAID Controller
P 0 1 2 3
Block 0 Block 0
Block 1
Block 5
Block 2
Block 6
Block 3
Parity Generated
Block 0
P 0 1 2 3
Block 4
Block 7
RAID 4

Data Protection: RAID
Host
Block 0
P 0 1 2 3
Block 7
RAID Controller
P 0 1 2 3
Block 0 Block 4 Block 0
Block 1
Block 5
Block 2
Block 6
Block 3
Parity Generated
Block 0
P 0 1 2 3
Block 4
P 4 5 6 7 P 4 5 6 7
Block 4
P 4 5 6 7
Block 4 Parity Generated
RAID 5

Data Protection: RAID
RAID 6 – Dual Parity RAID
• Two disk failures in a RAID set leads to data unavailability and data loss in single-parity schemes, such as RAID-3, 4, and 5
• Increasing number of drives in an array and increasing drive capacity leads to a higher probability of two disks failing in a RAID set
• RAID-6 protects against two disk failures by maintaining two parities
– Horizontal parity which is the same as RAID-5 parity
– Diagonal parity is calculated by taking diagonal sets of data blocks from the RAID set members
• Even-Odd, and Reed-Solomon are two commonly used algorithms for calculating parity in RAID-6
Data Protection: RAID
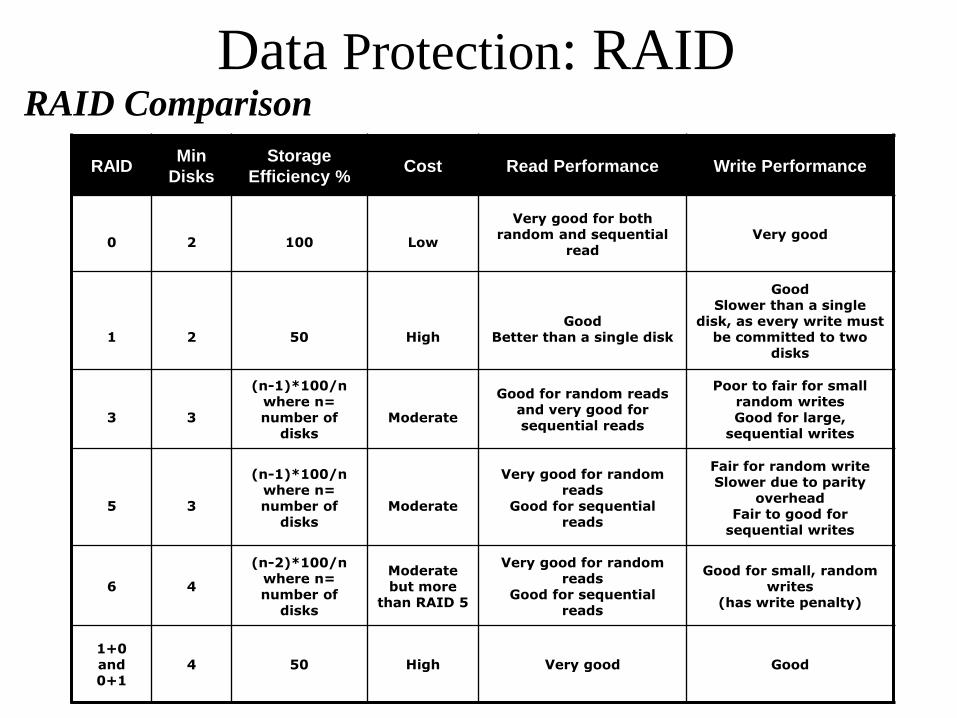
RAID Min
Disks
Storage
Efficiency % Cost Read Performance Write Performance
0
2
100
Low
Very good for both random and sequential
read Very good
1
2
50
High
Good
Better than a single disk
Good Slower than a single
disk, as every write must be committed to two
disks
3
3
(n-1)*100/n where n= number of
disks
Moderate
Good for random reads and very good for sequential reads
Poor to fair for small random writes Good for large,
sequential writes
5
3
(n-1)*100/n where n= number of
disks
Moderate
Very good for random reads
Good for sequential reads
Fair for random write Slower due to parity
overhead Fair to good for
sequential writes
6 4
(n-2)*100/n where n= number of
disks
Moderate but more
than RAID 5
Very good for random reads
Good for sequential reads
Good for small, random writes
(has write penalty)
1+0 and 0+1
4 50 High Very good Good
RAID Comparison

Data Protection: RAID
• Small (less than element size) write on RAID 5 • Ep = E1 + E2 + E3 + E4 (XOR operations)
• If parity is valid, then: Ep new = Ep old – E4 old + E4 new (XOR operations) – 2 disk reads and 2 disk writes
• Parity Vs Mirroring – Reading, calculating and writing parity segment introduces penalty to every write operation
– Parity RAID penalty manifests due to slower cache flushes
– Increased load in writes can cause contention and can cause slower read response times
Ep new
RAID Controller
2 XOR
+ - = E4 old Ep old E4 new
RAID Impacts on Performance
P0 D1 D2 D3 D4

Data Protection: RAID
RAID Penalty Exercise
• Total IOPS at peak workload is 1200
• Read/Write ratio 2:1
• Calculate IOPS requirement at peak activity for
– RAID 1/0
– RAID 5
Data Protection: RAID
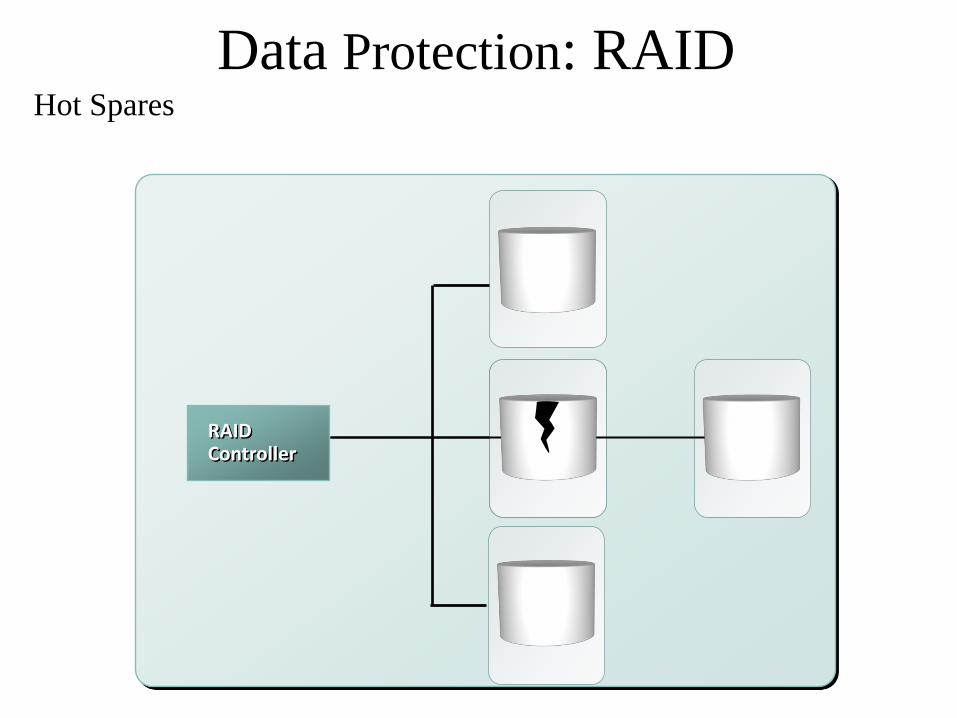
RAID Controller
Hot Spares

Data Protection: RAID Summary
Key points covered in this chapter:
• What RAID is and the needs it addresses
• The concepts upon which RAID is built
• Some commonly implemented RAID levels