rage against the machines - københavns universitet · rage against the machines: labor-saving...
TRANSCRIPT
RAGE AGAINST THE MACHINES:
LABOR-SAVING TECHNOLOGY AND UNREST IN
ENGLAND, 1830-32*
Bruno Caprettini
University of Zurich
Hans-Joachim Voth
University of Zurich and CEPR
First version: December 2016
This version: January 2017
Abstract: Can the adoption of labor-saving technology lead to social instability and
unrest? We examine a canonical historical case, the so-called ‘Captain Swing’ riots in
1830s Britain. Variously attributed to the adverse consequences of weather shocks,
the shortcomings of the Poor Law, or the after-effects of enclosure, we emphasize the
importance of a new technology – the threshing machine. Invented in the 1780s, it
spread during and after the Napoleonic Wars. Using farm advertisements from
newspapers published in 66 English and Welsh towns, we compile a new measure of
the technology’s diffusion. Parishes with ads for threshing machines had much higher
riot probabilities in 1830 – and the relationship was even stronger for machine-
breaking attacks. Threshing machines were mainly useful in wheat-growing areas. To
establish a causal role for labor-saving technology, we instrument technology
adoption with the FAO measure of soil suitability for wheat, and show that this in turn
predicts unrest.
Keywords: Labor-saving technology; social instability; riots; welfare support;
agricultural technology; factor prices and technological change.
JEL Classification: P16, J21, J43, N33
* We thank Philipp Ager, Leo Bursztyn, Ernesto Dal Bó, Lorenzo Casaburi, Barry Eichengreen, Fred
Finan, Julian Langer, Martha Olney, Morten Olsen, Daniela Scur, and Christy Romer for helpful
discussions. Seminar audiences at UC Berkeley and at the University of Southern Denmark provided
valuable feedback.
1
1 Introduction
Machines increasingly do the work of humans. In the 18th and early 19th century,
spinners and weavers lost their jobs to the Spinning Jenny and the Arkwright frame;
more recently, phone operators, clerks, and bookkeepers have been replaced by
computers (Autor, Levy, and Murnane, 2003). David Ricardo, writing in 1821, argued
that “the substitution of machinery for human labor, is often very injurious to the
interests of the class of laborers.”1 The concern that technological mass
unemployment may lead to unrest and political instability has an equally long lineage.
Marx famously prophesized that the adoption of new technologies, spread by
capitalism, would so immiserize the working class that workers would rise up in
revolt.2
While the possibility of technology-induced unemployment was on the minds of
classical political economists,3 it was increasingly called into question towards the
end of the 19th century, and is routinely dismissed in modern textbooks (Summers
2013). However, a growing literature in labor-economics has demonstrated that the IT
revolution has disadvantaged less educated workers (Acemoglu, 1998; Autor, Katz
and Krueger, 1998), and replaced workers performing tasks that are easy to codify
(Autor, Levy and Murnane, 2003).4 There is also good evidence that new agricultural
technologies can drive workers out of agriculture (Bustos, Caprettini and Ponticelli,
2016). What is unclear is whether such labor-saving technological change can create
political instability and social unrest. Even canonical examples of technology-induced
unrest, such as the famous Luddite revolt and the Captain Swing riots in
industrializing England, have been called into question: in the “…Luddite (1811–16)
and Captain Swing (1830–32) riots, the role actually played by the concerns of
laborers about being replaced by machinery has been greatly exaggerated.” (Mokyr,
Vickers and Ziebarth, 2015).5
1 In writing this passage, Ricardo had famously changed his mind, inserting the section in question only
in the third (1821) edition. In earlier editions, he had unambiguously argued that technological change
benefitted all. 2 Keynes (1931) in his ‘Economic Possibilities for our Grandchildren’ argued that labor-replacing
technological change was a key contributor to unemployment during the Great Depression and
predicted the arrival of the 15-hour week. 3 Mokyr, Vickers and Ziebarth (2015).
4 During the Industrial Revolution, new technologies may have been more skill-replacing than skill-
biased (James and Skinner, 1985; Mokyr, 1992). The direction of technical change itself may be
endogenous to factor prices (Acemoglu, 2002 and 2007). This would be in line with the early adoption
of coal engines England (Allen, 2009) and the introduction of new machines for treating non-U.S.
cotton during the U.S. Civil War (Hanlon, 2015). 5 See also Stevenson (2013).

2
In this paper, we examine the social and political consequences of technological
change, looking at a famous case – the ‘Captain Swing’ riots in England, 1830-32.
They constitute the largest case of labor unrest in English history, with more than
2,000 riots affecting a total of 21 counties. Farm houses were torched and machines
destroyed in large number. Overseers of the poor were attacked and driven out of the
parish; employers agreed to wage hikes under the threat of violence. All over the
country, troops had to be deployed to quell the chaos. Many causes have been cited
for the outbreak of the ‘Captain Swing’ riots (Hobsbawn and Rudé, 2014; Griffin,
2012). Most prominently among them are the Poor Laws (an early form of welfare
payments), failed harvests, and the release of a large number of soldiers and mariners
from military service after the end of the Napoleonic Wars. While all of these may
have contributed to the outbreak of unrest, we demonstrate that – contrary to recent
revisionist scholarship – the spread of labor-saving technology in the form of
threshing machines was a key factor responsible for the riots.
We proceed in two steps: First, we hand-collect new data on the spread of
threshing machines, exploiting information from 66 local newspapers containing
advertisements on farms for sale.6 This allows us to gauge the quantitative
contribution of technology adoption to unrest. Figure 1 shows our main result. We
compare parishes with and without advertisements for threshing equipment in the pre-
1830 period. Where the new technology was adopted, the probability of riots was
approximately 50% higher, with the share of parishes affected rising from 0.13 to 0.2.
The relative upward shift is even greater when we focus on agricultural riots only,
defined as cases of unrest where farm equipment was targeted and destroyed. Here,
the relative frequency was more than twice as high in areas with threshing machines
as in those without them.
Second, we combine our diffusion data with FAO data on soil suitability. Where
English and Welsh soil was particularly suited to wheat – the principal crop for which
threshing machines were used – adoption rates for threshing machines were markedly
higher. Moreover, the component of threshing machine adoption driven by soil
suitability predicts unrest in 1830-32 to a large extent. This in turn suggests that the
effects of labor-saving technology on unrest are causal.
In addition to the literature on the effects of technological change on labor
markets, our results relate to two other areas of research – the economic determinants
of political instability and unrest, and the historiography of ‘Captain Swing’. Most of
6 Of these, 37 contained at least one advertisement.
3
the theoretical contributions on the determinants of political instability and social
unrest moves from the observation that low-income countries are more prone to civil
conflict than richer countries (Fearon and Laitin, 2003; Collier and Hoeffler, 2004).
While it is tempting to explain this correlation with the argument that people living in
low-income countries face a lower opportunity cost of organizing a rebellion, Fearon
(2007) notes that the effect of income on unrest is ambiguous, because in low-income
countries also the loot for which the rebels fight is small; this should also reduce the
incentives to rebel. Chassang and Padró i Miquel (2009) qualify this conclusion, and
show that temporary negative income shocks can increase the chances of revolt, while
permanent income shocks have always an ambiguous effect.
The empirical literature on social unrest has sought to identify the causal effect
of income shocks on revolt by looking for exogenous shocks to income. Miguel
Satyanath and Sergenti (2004) find that adverse weather shocks significantly predict
civil conflict in Africa, while Brückner and Ciccone (2010) show that downturns in
international prices of the main commodity exported by Sub-Saharan countries lead to
higher chances of civil war. Ponticelli and Voth (2011), looking at cross-country
evidence for period 1919 to 2008 argue that episodes of fiscal consolidation lead to
social turmoil. These results support the predictions of the model of Chassang and
Padró i Miquel (2009) about the effects of temporary income shocks. Relatedly, Autor
et al. (2016) show that adverse trade shocks have led to more political polarization in
U.S. constituencies.
We also contribute to the historiography of the ‘Captain Swing’ riots.
Systematic analysis about the riots’ causes began soon after the riots ended. The
Parliamentary Inquiry (Checkland, 1974) blamed the riots on the failings of the Poor
Law. The Hammonds (1987) famously attributed the riots to growing immiserization
of laborers in the countryside. Hobsbawn and Rudé compiled the first systematic
database on the riots, and argued that they were largely driven by the adverse effects
of technological change. Stevenson (2013) emphasized that the riots were often aimed
at Irish migrant workers, and not technology (see also Mokyr, Vickers and Ziebarth,
2015). Hobsbawn and Rudé’s database was extended by Holland (2005), and their
analysis updated by Griffin (2012). Aidt and Franck (2015) have recently shown how
the riots contributed to the 1832 Reform Act. Finally, Aidt, Leon and Satchell (2016)
have looked at how riots spread across England over the two years of unrest: by
exploiting the communication network of the time, they are able to show that
“contagion” played a significant role in the diffusion of the riots.
4
Relative to these papers, we make the following contributions. First, we focus
on short-term dislocations in the labor market driven by technological change. This is
in contrast to much of the literature on skill-biased technological change, which takes
a long-term perspective. In contrast, we look at the effect of a new technology on the
labor market in the short term, when displaced workers find it harder to adjust to
change. Second, we provide evidence for an additional channel leading to conflict –
the distributional effect of the new technology. The literature on income shocks and
conflict typically assumes that shocks have to be negative (either temporarily or
permanently) to lead to confrontation. New technologies represent a positive shock
but create distributional effects that may adversely affect some groups. Threshing
machines were labor-saving and reduced the share of output going to labor; this
lowered rural workers’ opportunity cost of revolt. The asymmetric effect of an income
shock that alters the relative price of factors is reminiscent of the model in Dal Bó and
Dal Bó (2011), who show that in a two sectors economy a shock to the capital-
intensive sector increases the likelihood of civil conflict.7 The paper most similar in
spirit to ours is Manacorda and Tesei (2016), who examine the role of communication
technology in facilitating protests in Africa.
We proceed as follows. Section 2 summarizes the historical background.
Section 3 presents our data, and section 4, our main empirical results. Section 5
examines the robustness of our findings, and Section 6 concludes.
2 Historical Background
Threshing was a key part of the agricultural production process since the invention of
sedentary agriculture. Before grain can be processed or stored, the corn has to be
loosened from the husks (threshing), and then the straw and husks have to be
separated from the corn (winnowing). Performed by hand, threshing is a laborious
process. Typically, flails – two sticks connected by a short chain – were used in hand-
threshing. The larger stick was swung overhead, into a pile of grain. Threshing
provided employment during the winter months when other forms of work were in
short supply. The Scottish engineer Andrew Meikle invented the first threshing
machine in 1786 (Macdonald, 1975). Initially driven by hand, horses or water-power,
threshing machines were soon paired with steam engines.
7 Dube and Vargas (2013) show evidence consistent with this theory.
5
2.1 Agriculture in early 1800 England
In contrast to most European countries, English agriculture by 1800 was highly
efficient and almost completely commercialized. The largest landowners, often
members of the nobility or the landed gentry, rarely took any active role in the
operation of estates (Hobsbawm and Rudé, 2014, p.23-24). Below the landowners was
a larger class of farmer-tenants: they rented the land from the nobility and landed
gentry and ran the farms for a profit. These farmers often used advanced techniques
for their time: they regularly rotated crops, allowing either one year of fallow every
three, or planting turnip and clover after two consecutive years of cereal cultivation
(Rahm, 1844; pp. 195-197 and pp. 433-441). They also fertilized abundantly their
fields and sold most of their output on the market. Large estates often employed
agricultural servants year-round (as did some of the tenant farmers). Agricultural
servants typically began work in their teens, and were required to stay celibate
(Voigtländer and Voth, 2013). Once married, they had to move out of the household
of their employer.
Agricultural laborers were at the bottom of the social pyramid. They were often
illiterate and owned few assets. During the early modern period, they had
progressively lost access to common lands – first via the “yeoman’s enclosure” (Allen
1992), then through the wave of parliamentary enclosures during the 18th century
(Neeson, 2008; Mingay, 2014). Also, population growth made their employment less
certain (Hobsbawn and Rudé, 2014, p. 42). By the beginning of the nineteenth
century, most agricultural laborers worked mainly as hired hands: in the spring, they
prepared the fields, and in the summer they harvested them, usually under piece-work
contracts that were signed by the day, by the week or at most by the season
(Thompson, 2013, p. 235, and Hobsbawn and Rudé, 2014, pp. 39-40). During the
winter, when agricultural work was scarce, many of these laborers found employment
as “threshers”. Until 1800 almost every farmer in England hired workers to thresh the
grains manually, or outsourced the process to local barns.8
Another aspect that contributed to the hardship of rural laborers was low labor
mobility. This was the result of a system of social insurance known as the “Poor
Laws” which granted income support to the “impotent poors” during periods of
8 The Hammonds cite a landowner from Canterbury as saying that in his parish, “…where no machines
had been introduced, there were twenty-three barns… in these barns fifteen men at least would find
employment threshing corn up till May.” (Hammond and Hammond 1987, p. 221).
6
distress.9 Under the rules that were in place in the first decades of 1800, the poor
could only apply for support in their parish of residence (Marshall, 1968; Boyer
1990). This discouraged migration even over short distances. Limited labor mobility
in turn exacerbated the condition of the laboring poor in the countryside because it
reduced out-migration (Redford, 1964).10 The system also created peculiar
externalities, with farmers sometimes hiring laborers who were maintained by the
neighboring parish (Hammond and Hammond 1987).
Against this background, farmers adopted threshing machines at an accelerating
rate from the turn of the century onwards. The new machines could thresh an entire
harvest in few weeks, reducing costs by up to one-third compared to manual threshing
(Hobsbawm and Rudé, 2014, p. 362). Machine-threshed grain also yielded about 10%
more corn (Hammond and Hammond 1987). Immediately after its invention,
threshing machines spread relatively slowly as the machines were too expensive
relative to manual labor (Hobsbawm and Rudé, 2014: p. 361; Macdonald, 1975, p.74),
but this changed with the Napoleonic Wars. As Great Britain and France went to war,
the British army expanded to 250’000 men, and the navy to 140’000 (Colley, 2009; p.
293). Because rural laborers made up a significant share of the British armed forces,
labor suddenly became scarce in the countryside (Hobsbawm and Rudé, 2014; p. 359
who quote Stevenson, 1815; p. 144). Farmers responded by adopting a number of
labor-saving technologies, including threshing machines.
After Napoleon’s defeat at Waterloo in 1815, Britain discharged most of its
soldiers and labor in the countryside became relatively abundant again. Nonetheless,
once adopted and suitably refined through long years of use, threshing machines
continued to spread.11 In addition to the low cost, the machine’s speed created a vital
advantage because the price of wheat typically dropped quickly after the harvest.
Farmers who had threshed grain to sell immediately could obtain higher prices, and
they also saved the cost of storage. Both large and small producers kept using the new
machines even after the most acute labor shortages had ended.
9 The Old Poor Law went back to 1601, when the “Acte for the Reliefe of the Poore” or “Act of
Elisabeth” was introduced (Marshall, 1968: p. 10). The basic framework remained in place until the
1834 reform (Marshall, 1968; Boyer, 1990).
10 Boyer (1990) contends that the Poor Law did not slow down rural-urban migration at the aggregate
level. His conclusion does not exclude the possibility that the Poor Laws prevented rural-rural
migration, and Landau (1995) present evidence that the “Laws of Settlement” were used in the 18th
century to systematically limit migration across parishes.
11 The following theory was proposed by Hobsbawn and Rudé (2014; Appendix IV).
7
2.2 Captain Swing riots
The ‘Swing’ riots broke out in the last days of August 1830, in East Kent.12 They
spread first in the South-East of England, and then across the whole island. By the
winter of 1832, more than 2,000 riots had broken out in 21 different counties. Almost
all of these episodes took place in rural areas; rioters were mostly rural workers,
sometimes led by craftsmen and artisans (Hobsbawn and Rudé, 2014: p.207;
Stevenson, 2013: p. 266). The first protests saw rioters breaking agricultural machines
(most of the time the hated threshing machines): between September and the end of
November 1830 Holland (2005) lists 492 machines broken, of which 452 were
threshing machines.
Unrest took several forms. Arson attacks were common (Tilly, 1995: p. 218). In
many parishes, the overseers of the poor were forced out by rioters, with many
transported in carts previously used by the overseers themselves. Similarly, wage
negotiations occurred in many places, with the farmers often agreeing to increases
with the proviso that tithes and rents would be commensurately reduced (Griffin
2012; Hammond and Hammond 1987). Threatening letters – signed by the mythical
‘Captain Swing’ – were sent to farmers. These letter captured the public imagination,
and by October 1830, The Times of London adopted the name of ‘Swing’ to refer to
the whole wave of riots (Griffin, 2012: p.3). Unrest simmered for more than two
years, until the winter of 1832, when Holland (2005) records the last episodes (two
fires set in Nottingham and Norfolk and one riot that broke out in Surrey).
After an initially timid response, the central government adopted a harsh line. It
ordered the army and local militias – typically composed of local yeomen – to attack
rioters. The British government also set up a special commission to deal with the
unrest (Hobsbawn and Rudé, 2014: p. 253-263). It passed 252 death sentences, but
commuted many to transportation to Australia or New Zealand (Hobsbawn and Rudé,
2014: pp. 265-279).
2.3 Causes of unrest
Several factors contributed to the wave of riots in 1830-32. Hobsbawn and Rudé
emphasize how the already difficult situation of rural workers was made unsustainable
12 Until recently, most historians followed Hobsbawn and Rudé (2014) who placed the start of the riots
on the 28th of August 1830, when a gang of people smashed a threshing machine in the parish of Lower
Hardres, in Kent (Hobsbawn and Rudé, 2014: p. 97; Stevenson, 2013: p. 264). In his 2012 study of the
riots, Griffin argued that riots began on the 24th of August 1830, when in the Kentish parish of Elham
some 20 men destroyed another threshing machine (Griffin, 2012: p.87).
8
by bad weather, a poor harvest and the prospect of a harsh winter (Hobsbawn and
Rudé, 2014: p. 91). Once the revolt had started, riots spread to the rest of the country,
often as a result of bands of workers travelling from parish to parish to exact justice
on the landlords (Tilly, 1995: p. 319) or following the accounts of incidents in nearby
parishes reported by “linkmen” travelling along the major roads (Archer, 2000: p. 20).
The year 1830 also saw an increase in political agitation as well as discussions of
electoral reform. Against the background of the July revolution in France, agitators
like William Cobbett toured the countryside, arguing for the need for change, a living
wage, and a rebalancing of power (Wells 1997; Dyck, 2005). News of the French (and
Belgian) revolutions may have provided the spark that ignited the revolt in the South
East of England (Archer, 2000: p. 20; Charlesworth, 1979: p. 37-9). In addition,
discussions of electoral reform had come to naught under the Duke of Wellington’s
Tory government. They would eventually lead to the Great Reform Act of 1832 under
his liberal successor – but only after Wellington’s government fell during the worst
period of the riots (Aidt and Franck 2015).
Whatever the immediate motives of the riots, historians agree that the
underlying cause of unrest was a progressive deterioration of the economic and social
situation of rural workers. Three factors contributed to the decline. First, since the end
of 1600 the enclosure movement had progressively deprived rural workers of the
access to common lands, effectively transforming them into a “landless proletarian,
relying almost exclusively on wage-labor” (Hobsbawn and Rudé, 2014: p. 35, see also
Hammond and Hammond, 1987). Second, bringing in the harvest in areas with arable
farming required a large workforce – but employment opportunities were scarce
during the rest of the year. The Poor Laws, a system of income support funded and
administered at the parish level, in general maintained a sufficient number of
agricultural laborers (Boyer, 1990). Since the beginning of the 1800s, the system had
come under considerable strain because of population pressure and the decline of
cottage industry (Stevenson, 2013: p. 262). It also – perversely – encouraged bastardy,
and penalized savings amongst the poor (Hammond and Hammond 1987). As an
increasing number of people received income support, allowances were generally
reduced, the conditions for receiving them were tightened, and workers became
increasingly dissatisfied with the system (Thompson, 2013: p. 244-245). Third, the
progressive mechanization of agriculture made redundant much of the agricultural
labor force and undermined its standard of living. The adoption of threshing machines
was especially harmful for rural workers because it deprived them of the major source
of income during the winter season.
9
While these three factors appear in almost any account of the Swing riots,
historian disagree on their relative importance. On the one end of the spectrum we
find Thompson and Royle, who place great emphasis on the role of enclosures and on
the loss to the access to land (Thompson, 2013; Royle, 2000). The Parliamentary
enquiry, set up after the 1830-32 riots, largely laid the blame at the feet of the “Old
Poor Law” – soon to be reformed thoroughly. Finally, Hobsbawn and Rudé (2014)
emphasize the importance of new machines.
3 Data
We use three main sources: data on riots, the FAO land suitability data, and
advertisements from nineteenth century British newspapers. We complement this
information with data about the number of days in which grass can grow as well as
the information from the British historical Censuses. In this section we describe each
of these sources; details about individual variables can be found in appendix A.
Data on Swing riots comes from a database compiled by the Family and
Community Historical Research Society (Holland 2005).13 It contains a
comprehensive list of Captain Swing incidents between January 1830 and December
1832. The information comes from official records and historical newspapers and
contains the date, the parish, and the type of crime perpetrated by rioters. The
database builds on Hobsbawm and Rudé (2014), adding a further 785 riots to their
original list of 1475 incidents.
Some of the riots during the years 1830-32 are particularly relevant for our
paper – what we call “agricultural riots”. These are the protests targeting agricultural
machines, especially threshing machines, and other types of farm equipment. Figure 2
reports the total number of Swing riots over time, broken down by “agricultural riots”
and other events. Figure 3 shows the geographical distribution of these incidents.
To track the spread of threshing machines over time, we use information from
66 regional newspapers (63 from England and 3 from Wales), of which 37 had at least
one advertisement. We examine the universe of 118758 newspaper issues published
between January 1800 and July 1830, searching for advertisements containing the
exact string “threshing machine”. These would typically relate to the sale or lease of a
farm. Figure 4 and Figure 5 show two typical advertisements contained in our
database. Figure 6 reports the number of advertisements of threshing machines that
13 Aidt and Franck (2015) recently used these data in their study of the political consequences of the
Swing riots.
10
appeared during the thirty years leading up to the Swing riots. In order to assign these
articles to different areas of Britain, we manually code the exact parish where a farmer
was selling his threshing machine. We have a total of 409 advertisements in 363
parishes. Figure 7 shows the geographical distribution of the advertisements we
collected along with the cities where our newspapers were printed.
Data on suitability of different parishes of England and Wales to the cultivation
of cereals comes from the Global Agro-Ecological Zones database (FAO-GAEZ).
These data report the potential output that can be harvested in a given area by
cultivating wheat. FAO researchers compute this potential output by using soil
characteristics, historical weather records and an agronomic model that assumes the
use of a specific level of inputs.14 These measures are available for grid cells of about
9.25 × 9.25 kilometers. We construct a measure of potential output at the parish level
by superimposing a map with the boundaries of historical British parishes on the grid
of soil suitability, and then computing the average yield attainable in every parish.
Figure 8 shows the potential output for wheat in Britain.
Finally, we complement these data with two additional sources. The first one is
the number of days in which grass can grow across British counties. Down et al.
(1981) computed this measure. The second source are the records from the British
Population Censuses for the year 1821 prepared by Southall et al. (2004).
Table 1 reports summary statistics for our variables, and Appendix A describes
every variable used in the analysis and explains how we match data from different
sources.
4 Empirical analysis
4.1 Threshing machines and riots
We start by documenting the correlation between the adoption of threshing machines
in the first three decades of the 1800s and the riots of 1830-32. The aim of this section
is to establish that places where threshing machines spread faster, as measured by the
number of threshing machines on sale in the years 1800-1830, were also more likely
to stage a protest in 1830-32.
14 FAO-GAEZ calculates potential output under three different assumption of input use: “low”,
“intermediate” and “high”. We use the measure of potential output calculated with “intermediate input”
because it is likely to represent well the technologies available to 1800s British farmers. See Bustos,
Caprettini and Ponticelli (2016) for a discussion about the different technological levels used in FAO-
GAEZ measures. See section 5.1 for a more complete discussion of this assumption.
11
Figure 1 illustrates our main finding, by dividing English parishes into two
groups according to whether we observe at least one threshing machine
advertisement. We first look at all cases of unrest during the Swing riots. Parishes
with at least one advertisement for a threshing machine pre-1830 had a 7.6 percentage
point higher likelihood of having a Swing riot compared to parishes with no ads, an
increase of almost 60 percent. When we focus on agricultural unrest alone – attacks
on farms, destruction of the harvest or fences, or the breaking of farm equipment
including threshing machines – the overall level of unrest is lower. The increase in the
probability of unrest in parishes with threshing machines however is greater, more
than doubling from 3.6 to 7.4%. Overall, both graphs show a strong unconditional
association between the diffusion of new technology and the 1830-32 riots.
Next, we show that this basic relationship holds in a setting with a richer set of
controls. We estimate variations of following regression:
Riotp= β0 + β1 Adsp+ βpop Pop1821p + βX Xp + ep (1)
Where Riotp is the number of riots in parish p during 1830-32, Adsp is the number of
advertisements for threshing machines, Pop1821 is the total population living in the
parish in 1821,15 and Xp is the vector of additional parish-level characteristics. These
include: the (logarithm of) the area of the parish; the share of families that are chiefly
employed in agriculture in 1821; the (logarithm of) the number of days in which grass
can grow in the parish; the (logarithm of) the male-female ratio in 1821; and the
(logarithm of) the distance to the closest city that prints one newspaper. The area of
the parish allows us to control for another dimension of size apart from the
population. The share of agricultural families proxies for the degree of agricultural
specialization in the parish, while the number of days in which grass can grow
controls for the profitability of pasture. Both of these variables have the potential to
affect riots, because Swing was almost exclusively a rural phenomenon. The relative
presence of men over women could also affect the emergence of riots, which in most
cases were a men’s affair (Stevenson, 2013: p. 268).16 Controlling for distance to the
closest city that printed a newspaper is important because the collection of data on
15 Both riots and number of advertisement are positively and significantly correlated with population.
Riots were more likely to happen in more populated areas (=0.18, significant at <0.1 percent). Adverts
for threshing machines were more common in parishes with large populations (=0.1, also significant
at <0.1 percent). Accordingly we control for the (logarithm) of the total population living in the parish
9 years before the start of the riots, in 1821.
16 In the data collected by Holland (2005), out of the 1566 Swing offenders who were processed and
whose first name reveals clearly the gender, only 21 were women (1.34 percent).
12
threshing machines and riots relies on information reported in newspapers. Thus,
parishes that are closer to the place of publication of a newspaper may have better
news coverage of farm advertisements, and they may end up having more riots
recorded in our database (which also relies on newspaper reports).
Finally, in the most demanding specification we include fixed effects for the 41
counties in England and Wales. Regressions with county fixed effects identify the
relationship between threshing machines and riots within relatively small
geographical units. With county fixed effects our regression becomes:
Riotp = β0 + β1 Adsp+ βpop Pop1821p + βX Xp + θc+ ep (2)
Here and in the following we will look at agricultural riots and Swing riots separately.
We first show that that the frequency of all riots and the presence of threshing
machines are positively correlated. Next, we focus on a more narrowly defined
dependent variable in the form of agricultural riots.
Table 2 presents our results. In all cases we report beta coefficients, to ease the
interpretation of results and the comparison of coefficients across tables. The first
three columns show regressions when the dependent variable is number of Swing
riots. Column 1 reports the estimates of equation (1) when we control only for the
1821 population in the parish: here the coefficient on Adspc is positive and significant
(p = 0.002). Adding other parish-level controls in column 2 does not affect neither the
point estimates nor significance (p = 0.001). Column 3 adds county fixed effects. Here
the point estimate drops by 39 percent in magnitude but remains significant at the 5
percent level (p = 0.044). This last result underscores that the correlation between
machine adoption and agricultural riots is strong even within narrowly defined
geographical units.
On columns 4 through 6 of Table 2 we turn to agricultural riots. The results for
these episodes are consistent with those for the full population of Swing riots: on
column 4 we estimate equation (1) controlling only for population, and we find a
coefficient on Adspc that is positive and significant (p = 0.005). Controlling for other
parish characteristics on column 5 does not affect estimates and improves significance
(p = 0.004). Adding county fixed effect reduces the point estimate by 22 percent but
preserves significance at the 5 percent.
To sum up, the results presented in this section point to a strong and positive
correlation between riots and adoption of the new machines. The strength of these
results is noteworthy because our variable capturing technology adoption must be
noisy. It is highly likely that we mis-classify numerous parishes where threshing
13
machines were in operation but that did not appear in any newspaper advertisement.
This will bias our estimates downwards (Deaton, 2000: p.99). We therefore think of
the coefficients in Table 2 as lower bounds of the true effect.
4.2 Identification
The correlations shown in the previous section show a close association between the
adoption of threshing machines and the incidence of Swing riots – especially those of
directed against farm equipment. There are three reasons why we should be cautious
before interpreting this relationship as causal.
First, a regression of the number of riots on the diffusion of threshing machines
may yield biased estimates if the general inclination of the rural population to riot
affected the decisions of landlords and tenants to adopt new, labor saving
technologies. If the presence of unruly rural workers made farmers more likely to try
production technologies that required less labor, then the estimates will be upward
biased. If the opposite was true however, the OLS estimates will be biased downward
instead. Accounts from the period do not suggest that landlords adopted the new
technology in response to higher risk of unrest and, if anything, it is possible that they
delayed adoption where labor was abundant, wages low, and the risk of protest higher.
If this is true, then estimates in Table 2 will be biased downward.
Second, unobserved characteristics of British agriculture may affect both the
willingness of farmers to adopt the new technologies and the inclination of rural
workers to revolt. In Table 2 the point estimates are not affected much by the
inclusion of parish-level characteristics, suggesting that the correlation between
machines and riots is not the product of spurious correlation between these two
variables and the controls in the vector Xp that appears in regression (1). Although this
vector contains several important characteristics that may be correlated with the riots,
it is possible that other omitted variables are biasing our estimates.
Third, it is possible that parishes with advertisements for threshing machines are
also over-represented in the Swing riot data of Holland (2005) – as the latter is also
partly based on newspaper accounts. This could cause positive correlation in the error
with which dependent and independent variables are measured, introducing upward
bias in the OLS estimates.
We address these problems by using an instrument for the adoption of labor-
saving technologies. Threshing machines were almost exclusively used for the
14
processing of a single crop: wheat.17 As a result, rural workers were more likely to see
machines substitute one of their tasks in areas that were more suited to the cultivation
of wheat. We measure soil suitability for wheat with FAO’s potential yield data for
this crop.
Soil suitability for wheat is a valid instrument for the adoption of the new
threshing machine if it predicts their adoption and at the same time does not influence
the probability of unrest via any other channel. Wheat suitability is likely to be a
significant predictor of the adoption because, by affecting how much wheat can be
produced, it changes the profitability of using the new machines. This assumption can
be tested formally, and in the next section we show soil suitability to wheat
production strongly predicts the number of threshing machines found in 1800 British
newspapers. The exclusion restriction is also likely to hold. Wheat-growing areas
were not necessarily better or worse off than others. Suitability for wheat cultivation
per se is unlikely to affect the likelihood of rural workers to riot, except through its
effect on the adoption of the new labor-saving technologies. This should be true
especially once we control for all the parish-level characteristics included in the
vector Xp.
Using soil suitability should alleviate concerns that the correlation between riots
and machines is driven by the two variables being constructed from overlapping data
sources. This is because the potential yield of wheat is defined for the whole territory
of England and Wales, and it is measured with the same level of accuracy regardless
of the distance to the closest city that publishes a newspaper. For this reason, the
measurement error of the potential yield is unlikely to be correlated with the
measurement error of the dependent variable and create the same problem that arises
with the threshing machine measure.
4.3 First Stage: Threshing Machines and Potential Yield of Wheat
We start by documenting the relationship between suitability for wheat – our proxy
for the profitability of using threshing machines – and our measure of technology
adoption. In Figure 9, we plot the unconditional relationship between the potential
yield of wheat in tons per hectare (on the x-axis of the upper panel) and the share of
parishes for which we observe at least one threshing machine advertisement between
1800 and 1830 (on the y-axis of the upper panel). The figure shows the local
17 Hobsbawm and Rudé argue that “oats and barley were definitely cheaper to thresh by hand”
(Hobsbawm and Rudé, 2014, p. 361).
15
polynomial and the a 95 percent confidence interval.18 Parishes more suitable to wheat
cultivation were systematically more likely to have a threshing machine on sale
advertised in British newspapers. The line has a clear positive slope, and it becomes
more tightly estimated above 3.5 tonnes per hectare of potential yield, where we
observe a greater number of parishes (see the frequency distribution in the bottom
panel).
In the first 3 columns of panel (A) of Table 3 we confirm that the relationship
between soil suitability and threshing machine adoption is strong. We fit to the data
the following model:
Adsp = α0 + α1 Yieldwheat p + αpop Pop1821p + αX Xp + ψ c + u p (3)
In the simplest specification we are going to regress the total number of
threshing machines advertisement we observe in parish p in county c (Adsp), on the
potential yield of wheat (Yieldwheat p) while controlling for the total number of people
recorded in parish p in the 1821 Census (Pop1821p). Next, we add the same vector of
parish level controls included in regression (1): Xp. In the most demanding
specification we add 41 county fixed effects (ψc), effectively estimating the impact of
soil suitability on the adoption of threshing machines within small geographical units.
Because counties are relatively homogeneous in terms of soil suitability, this is a very
demanding specification.
The first column in panel (A) of Table 3 reports the estimates of equation (3)
when we only control for the 1821 population. The beta coefficient is positive and
highly significant, with an F-stat of 41.8. In the second column, we add the other
parish-level controls: in this regression the point estimate becomes larger and
statistical significance improves (F = 62.3), suggesting that these controls capture
variation in the dependent variable that was biasing downward the estimates in the
first column. In the third column, we add the fixed effects for the 41 counties in which
our parishes are located. In this regression the coefficient of Yieldwheatpc becomes
smaller but remains significant at the 5 percent level (p = 0.021). Since threshing
machines could process grains cultivated in different parishes, it is not surprising that
the point estimate becomes smaller once we control for fixed effects of relatively
small geographical units. On the contrary, it is interesting that a substantial share of
the correlation between wheat suitability and the adoption of threshing machines in
18 To produce this figure, we use the Epanechnikov kernel function and a bandwidth of 0.198 (a value
calculated with the “rule of the thumb” formula).
16
the first 30 years of 1800 comes from within relatively small geographical units.
However, because in this last regression the F-test becomes smaller than 10 (F = 5.1),
we will report the results of the Rubin-Anderson test whenever we present our
instrumental variable estimates.
4.4 Reduced Form: Riots and Potential Yield of Wheat
We now move to the study of the determinants of riots. We start by discussing the
results of our reduced form: the relationship between land suitability to wheat
cultivation and the outbreak of Swing riots. These results are important for two
reasons. First, since FAO measures yield potential with greater precision than 1800s
advertisements capture threshing machine adoption, even in the absence of other
sources of bias the point estimates are likely to be more precisely estimated in the
reduced form regressions than in the OLS regressions. Second, because FAO
calculates potential yields using inputs that are beyond the control of 1800s farmers
(soil and weather characteristics), the results of our reduced form regressions identify
the causal effect that being located in an area suitable for wheat cultivation had on the
spread of the Swing riots.
Before presenting our econometric results, we start with a visual illustration of
our findings. Figure 10 reproduces our measure of wheat suitability shown in Figure
8, and adds the location of all the Swing riots episodes: the centroid of each parish in
which at least one Swing riot happened is flagged with a black dot, and we draw
larger dots in parishes where more episodes are recorded. The map reveal that across
England and Wales, riots concentrated disproportionally in the South and South-East:
in the area where the county of Wiltshire, Berkshire and Hampshire meet, in the
South-Eastern counties of Kent and Sussex, and in the Eastern county of Norfolk.
These regions are also the ones that are more suitable to wheat cultivation, according
to the FAO-GAEZ data.
The two graphs in Figure 11 complement the visual illustration of the map on
Figure 10, by displaying the unconditional relationship between riots and potential
yield for wheat. To produce these graphs, we split all English and Welsh parishes into
two equal-sized groups according to whether they have potential yield for wheat
above or below the potential yield of the median parish.19 In the top panel of Figure
11, we show the share of parishes in the two groups that experienced at least one
episode associated to the Swing riots. The graph shows that parishes above the
19 The median parish is the parish of Dymock in the North of Glouchestershire, whose land can produce
3.98 tonnes of wheat per hectare, on average.
17
median potential yield were 1.7 times more likely to experience at least one episode of
Swing riots than parishes below the median (p < 0.001). In the bottom panel of Figure
11 we reproduce the share of parishes in these two groups in which at least one
agricultural riot took place, along with the standard errors of our estimates. Overall,
parishes above the median potential yield for wheat were 2.6 times more likely to
experience at least one agricultural riot than parishes below the median (p < 0.001).
Next, we proceed to present our results in a regression framework. We fit the
following model to the data:
Riotp = γ0 + γ 1 Yieldwheat p + γ pop Pop1821p + γ X Xp + η c + v p (4)
where Yieldwheat pc is our measure of profitability of wheat cultivation: the potential
yield of this crop in tonnes per acre.
As we did in section 4.1, we study the effect of soil suitability to wheat
cultivation separately for all the episodes associated to the Swing riots and for riots
that targeted specifically machines and other farm capital (our variable agricultural
riots). Columns 4 through 6 of panel (A) of Table 3 show our results when the
dependent variable is number of Swing riots. When we only include the 1821 parish
population in column 4 the beta coefficient on potential yield is positive and highly
significant (p < 0.001). The beta coefficient remains stable and significant at less than
0.1% level when we add other parish-level controls on column 5. Finally, on column 6
we add a full set of 41 county fixed effects: relative to the estimates on column 5 the
beta coefficient of this regression drops by three-fourths but remains significant at 0.1
percent level. This result suggests that a great part of the correlation between riots and
wheat suitability is generated by differences across counties. However, the result on
column 6 also indicates that even within narrow geographical units, variation in the
profitability of the new technology led to significant differences in the number of
agricultural riots.
We now turn to the analysis of agricultural riots. In column 4 of panel (B) of
Table 3 we report our beta coefficient when we only include 1821 population. The
effect of potential yield of wheat is positive and highly significant (p < 0.001). In
column 5 we add the other parish-level controls. The beta coefficient of our
explanatory variable remains positive and significant, and the point estimate is
unaffected. In column 6 we also add county fixed effects. The beta coefficient stays
positive and significant at the 5 percent level (p = 0.049), but the point estimates
drops by four-fifths. The comparison between the beta coefficients on columns 5 and
6 confirms that also for the agricultural riots a great part of the correlation with wheat
18
suitability is generated by differences across counties. However the correlation
remains positive and highly significant even within counties.
4.5 Two-Stages Least Squares
We now turn to the two-stages least squares estimates. The noise in our measure of
threshing machine adoption is likely to bias the estimates presented in section 4.1
downward. At the same time, correlated errors in the measurement of riots and
machinery diffusion could bias our coefficient upwards. Given the amount of noise
that we suspect is present in our main explanatory variable, it is reasonable to expect
that, on net, the two-stages least squares estimates to be significantly larger than the
coefficients discussed in section 4.1.
Columns 7 through 9 of Table 3 confirm that this is the case. The table reports
regressions with total number of Swing riots as dependent variable on panel (A) and
with number of agricultural riots in panel (B). For both outcomes, the estimates are
positive and significant at the 1 percent level or less when all parish-level controls are
included. When we look at variation within counties, estimates drop but remain
significant at the 5.1 percent level (in the case of total number of Swing riots) and at
the 12.5 percent level (in the case of agricultural riots).
As we expected, point estimates are also significantly larger than point
estimates reported on Table 2. If we assume that the entire difference between OLS
and two-stages least squares comes from the noise in our explanatory variable, the
number of advertisements of threshing machine, we must conclude that the noise-to-
signal ratio in our OLS regressions is between 9 and 5.20 Given the nature of the data
20 We calculate the noise-to-signal ratio as follows. First, we assume that the two-stages least squares
estimate of the effect of machines on riots in the specification with riots fixed effects is a consistent
estimate of the true underlying parameter that links the new technology to protest. Next, we use the
formula for the bias of the OLS estimator in the presence of measurement error for the explanatory
variable (Deaton, 2000: p. 99). The formula states that in a regression of y on x and z, where x is an
explanatory variable measured with error, and z is a vector of other explanatory variable precisely
estimated, the probability limit of the estimated coefficient of x is:
plim xx
ˆ
where βx is the true underlying parameter, x̂ is the OLS estimate and the bias λ is equal to: {[σ2x / (σ2
x +
σ2e)] – R2
xz} / (1 – R2xz). The bias of βx depends thus on the variance of the correctly measured variable
x (σ2x), the variance of the measurement error (σ2
e) and on the R2 of a regression of x on the vector of
correctly measured variables z (R2xz). From here, simple manipulation yields the formula for the noise-
to-signal ratio, defined as σ2e \ σ2
x.
19
collected for the adoption of threshing machines, we think that such level of
measurement is not unreasonable.
5 Robustness
5.1 Definition of suitability to wheat production
So far, we used as an exogenous instrument for threshing machines adoption the
potential yield for wheat. FAO researchers compute this measure using soil and
weather characteristics, along with specific assumptions about the source of irrigation,
input use and farm management (Fischer et al. 2011). In all our regressions we have
used the potential yield attainable by rain-fed agriculture with “intermediate-level
inputs” and “improved management”. Under these assumptions, agricultural
production is partly market oriented, in the sense that “commercial sale is a
management objective”. Farmers practice “adequate fallow” and rely on “manual
labor with hand tools and/or animal traction and some mechanization” (Fisher et al.,
2011, p. 56). In addition, farmers plant the “improved varieties” of seeds that were in
use before the Green Revolution of the 1940s (see also Gollin et al., 2016), and apply
“some fertilizer” as well as “pest, disease and weed control.” We believe that most of
these assumptions describe well English agriculture at the beginning of 1800,
especially the kind of farms that would consider the adoption of the new threshing
machines.21 Nevertheless, the assumption of fertilizers may be problematic, because it
is possible that some of the factors considered by FAO researchers for their
“intermediate input” measure were in fact not available to English farmers of the
nineteenth century.22
It could be argued that early 19th century conditions in England are more
accurately described as lying between the FAO’s “low” and “intermediate” levels of
inputs. The one advantage of the potential yield calculated under the assumption of
low inputs is that it is calculated assuming “no use of chemicals for pest and disease
control”: this was obviously a technology available to English farmers in 1800.
However, farm management, crop rotation and labor-capital mix are best represented
by the assumptions embedded in the intermediate inputs measure rather than the low
21 See also the discussion in section 2.1.
22 While English farmers would routinely use several types of manure such as chalk, marl, clay and
excrements to fertilize their fields (Rahm, 1844: pp. 314-324), they were less likely to have access to
chemical products that FAO researchers may consider in their definition of “intermediate inputs”.
20
inputs one. In sum, the ideal measure should be closer to the potential yield computed
under “intermediate level” of inputs, but arguably somewhat below that.
To alleviate the concerns that the overestimation of our measure of potential
yield is driving our results, we show how our estimates change when we use the
potential yield of wheat calculated under the assumption of low input use and
traditional management. We show our results on Table 4. The first three columns of
panel (A) of this table show the first stage when the potential yield is calculated
assuming low inputs. The first two columns report estimates of equations (3) with
only 1821 population and with all parish-level controls respectively. In these
regressions the potential yield is a strong predictor of threshing machine adoption
even with the low input assumption. Moreover, the beta coefficients are slightly larger
than in the regressions in which potential yield was calculated assuming an
intermediate level of inputs. In column 3 we add the 41 county fixed effects. In these
regressions the low inputs instrument has a smaller beta coefficient and a lower
significance than in our baseline regressions. This suggests that the potential yield
attainable with low level of inputs can capture broad differences in soil and weather
potential across different regions of England and Wales, but does not reflect
adequately finer variations that may have driven differential adoption within small
British counties.
On columns 4 through 6 we report estimates of the reduced form equation (4):
we report estimates with the number of Swing riots as dependent variable in panel (A)
and with the number of agricultural riots in panel (B). Beta coefficients of our
instrument estimated without county fixed effects are reported in columns 4 and 5 are
indistinguishable from the same coefficients estimated with our preferred measure of
potential yield in Table 3. When we add county fixed effects on column 6 we find a
smaller beta coefficient and reduced significance when the potential yield is computed
under the low input assumption. When the dependent variable is total number of
Swing riots the significance remains below 0.05, but grows relative to our baseline
results (p = 0.023 with low inputs against p = 0.001 with intermediate inputs). In the
case of the regression of agricultural riots the p value exceeds 0.10.
The results with two-stages least squares in columns 7 through 9 of Table 4 tell
a similar story. Point estimates are always smaller when we estimate them with the
low inputs measure of potential yield. Significance is always less than 0.1 percent
when no county fixed effects are included. The results in this section confirm that our
baseline results are not driven by the particular assumptions about the input use
embedded in the FAO-GAEZ measure of potential yield.
21
5.2 Spatial autocorrelation
Results in section 4 are based on conventional robust standard errors that do not
account for the spatial correlation of both the dependent and explanatory variables.
Visual inspection of maps in Figure 3, Figure 7 and Figure 8 suggest that all our
variables of interest display significant spatial correlation. This is hardly surprising, as
riots may have spread more easily along regional social networks, local manufacturers
of threshing machines may have promoted their diffusion in specific areas, and the
potential yield measures are calculated with soil and weather characteristics, which in
turn vary smoothly over space. While this spatial correlation does not invalidate our
strategy, it does imply that our standard errors may be downward biased. In this
section we show that accounting for spatial correlation has no effect on our main
results.
We control for spatial correlation in two ways. First, we compute standard
errors with the formula proposed by Conley (1999). In his model, Conley assumes
that spatial correlation across location decays with distance until a given cutoff
beyond which spatial correlation is assumed to be 0. Because the cutoff underlying
the true data generating process is unknown and because its choice is somewhat
arbitrary, we experiment with three different cutoffs. In particular, we present
standard errors obtained when spatial correlation is assumed to disappear beyond 20,
50 and 100 km.23 Second, we estimate standard errors in a non-parametric way, and
allow any correlation in the error terms of parishes that are served by the same
newspaper. We do so by identifying for each parish the closest city that publishes a
newspaper, and then by clustering standard errors at the level of these cities. This
procedure should produce standard errors that are consistent even if both riots and
threshing machines adoption were correlated across parishes that read news reported
by the same journals.
Table 5 reports the results of this robustness check. On the first two rows of
both panel (A) and panel (B), we reproduce our baseline estimates for the first stage,
the OLS and the reduced form regressions. On the first row we report the point
estimate and on the second row the Huber-Eicker-White robust standard errors. Below
these estimates we then report standard errors calculated with the Conley (1999)
formula and those clustered at the level of the closest city with a newspaper. Panel (A)
23 For reference, the post office operated on a network of “post towns” which were located between 20
and 24 Km apart. Such network allowed couriers to stop and change their horses regularly (Heblich and
Trew, 2016). In practice, any of the laborers who took part in the riots would very rarely have access to
a horse, and would move mostly on foot, covering not more than 30 Km per day.
22
of the table reports the OLS estimates of equations (1)-(2). In all specifications spatial
correlation affects only slightly the estimated standard errors and in all regressions the
coefficients on the number of threshing machine advertised remain significant at the
10 percent level or less.
In columns 1 through 3 of panel (B) we show the first stage regressions.
Results remain strong even when standard errors account for spatial correlation. In the
regression with all controls and without county fixed effects significance remains
below 1 percent. When we add county fixed effects instead, the standard errors grow a
factor of 1.1 at most, and the potential yield remains significant at the 3 percent level
even when we allow spatial correlation to operate at distances up to 100 km. Columns
4 through 9 report our estimates of the reduced form (4). Here, the coefficient of
potential yield of wheat remains significant at 1 percent in the regressions of both
total number of Swing riots and agricultural riots when we do not include county
fixed effects. With county fixed effects, potential yield remains significant at the 2
percent level or less when the dependent variable is the total number of Swing riots
and loses significance slightly when spatial correlation decays slowly when the
dependent variable is agricultural riots. All in all, the results shown in this section
suggest that the presence of spatial correlation is not biasing significantly our standard
errors.
5.3 Sample restriction: parishes within 40 km from a newspaper
Both the riot episodes and our measure of threshing machine adoption are constructed
using information extracted from contemporary newspapers.24 These newspapers were
published in 66 individual towns and cities, and they would have been more likely to
report facts and advertise farm sales when these events took place relatively close to
the place of publication. The average number of Swing riots within 40 km from one of
these 70 locations is 0.06 higher than in parishes farther away (p = 0.012). In contrast,
the difference in the number of advertisements between the parishes around these
cities and those beyond the 40 kilometers limit is not significant. However, it may still
be the case that threshing machines are over-represented in parishes that are closer to
places that print one of these newspapers (for instance if the true number of threshing
machines is higher farther away from the cities).
24 The geography of Swing riots is reconstructed with official probate records analyzed by Hobsbawn
and Rudé (2014) and it has been integrated and extended by the research group coordinated by Holland
(2005) using the same probate records along with news reported in local newspapers.
23
The uneven coverage offered by contemporary news implies that part of the
correlation between our variables may be the result of the fact that parishes closer to
newspaper cities were more likely to appear in our database, rather that the
consequence of protest against new machines. Moreover, although in principle the
uneven coverage should not matter for our instrument, in practice parishes around
cities tend to be more fertile (potential yield within 40 kilometers from one of these
cities is 0.21 tons per hectare higher than beyond this limit, and the difference is
significant at the 0.1 percent level). Thus, also the fact that larger cities (or at least
cities that print newspapers) tend to develop on more fertile ground may also bias our
instrumental estimates.
In order to control for this possible confounding mechanism, we show that all
our results are strengthened when we restrict our sample to those parishes that lie
within 40 kilometers from the closest city. Restricting the sample in this fashion also
alleviates a different concern: namely, that our results may be driven by the contrast
between English parishes and Welsh parishes. English parishes specialized in cereal
production and bore the brunt of the Swing riot. In contrast, Welsh parishes typically
lie further west. There, pastoral agriculture was more common, and Wales remained
almost untouched by the riots. While newspaper cities are fairly widespread across
England, we only have data from two Welsh newspapers (the “Monmouthshire
Merlin” of Newport in the South and the “North Wales Chronicle” of Bangor in the
North). Thus, restricting the sample to only those parishes within 40 km from a
newspaper city effectively leaves out most of the Welsh parishes in our sample.25
On columns 1 and 2 of Table 6 we report beta coefficients of our OLS estimates
after restricting ourselves to parishes within 40km of a newspaper town. Despite
dropping one-fourth of our observations, significance improves and point estimates
grow. When the dependent variable is the total number of Swing riots in panel (A),
coefficient grows between 29 percent (without county fixed effects) and 58 percent
(with fixed effects). Estimates also become more stable across specifications,
suggesting that variation within counties is stronger where our variables are likely to
be measured more precisely. When the dependent variable is agricultural riots in panel
(B), the coefficient on number of threshing machines advertisements grows between
30 percent (without county fixed effects) and 45 percent (with county fixed effects).
25 Removing also the parishes around Newport and Bangor produces results that are virtually identical
to those shown here. These are available upon request.
24
Columns 3 and 4 of panel (A) of Table 6 report the first stage and columns 5
and 6 of both panels the reduced form of the restricted sample. The estimates are very
similar to our baseline in section 4. In the first stage, point estimates never vary by
more than 10 percent relative to the baseline and if anything they are more stable
across specifications. Despite the smaller sample, significance is always preserved. In
the reduced form, the point estimates differ from the baseline by 7 percent or less. The
one exception is in the regression of agricultural riots when we add county fixed
effects: in this case the beta coefficient of potential yield grows from 0.016 to 0.025,
improving significance and getting closer to the coefficient of the specification
without county fixed effects.
The last two columns of Table 6 show the two-stages least squares estimates on
the restricted sample. The pattern is similar to that of the other regressions: in the
specification with agricultural riots as dependent variable, the coefficient of number
of threshing machine advertisements tend to be larger in the restricted sample,
especially in the specification with county fixed effects, where the effect also becomes
significant at the 10 percent level. In the regressions on the total number of riots,
estimates remain very close to our baseline and always preserve significance. Overall,
these results confirm that the uneven coverage of English parishes offered by 1800
newspapers is unlikely to be driving our results.
5.4 Other types of protest: arson and threatening letters
So far, we have focused on two main outcomes – the total number of Swing riots and
agricultural riots (i.e. the subset of riots that targeted farm equipment). But what about
other types of riots? The most common form of protest during the years 1830-32 was
not the breaking of agricultural machines, but rather acts of arson in which rioters set
haystacks or entire farms on fire (Holland, 2005, records 764 of these episodes,
affecting 10 percent of the parishes). Another popular form of protest was the mailing
of anonymous letters to landlords, farmers and overseers, threatening attacks if the
recipient did not satisfy the demands of laborers (Holland lists 147 such episodes,
across 2 percent of the parishes). The mythical character invoked by most letter
writers – Captain Swing – in the end lent his name to the entire historical episode.
In this section, we study how the adoption of new machines affected other
types of protest. In columns 1 through 3 of Table 7 we show the results of estimating
equations (1) and (2) using as dependent variable either the total number of acts of
arson or the total number of threatening letters. In panel (A) the dependent variable is
the total number of fires. In the first column the coefficient on the number of
25
threshing machines advertisements is positive and almost significant at the 10 percent
level (p = 0.102). Adding more controls in column 2 does not affect the point
estimate, but it allows for sharper estimation of the coefficient (p = 0.087). Finally,
when we add county fixed effects, the coefficient drops by one-third and ceases to be
significant at standard levels. Correlation is weaker when the dependent variable is the
number of threatening letters. Here the point estimate is quite small and never
statistically different from 0.
In columns 4-6 of Table 7 we report the estimates of the reduced form and in
columns 7-9 the two-stages least squares estimated on these two outcomes. These
tables tell a consistent story: the total number of acts of arson is strongly correlated
with potential yield of wheat in all specifications of the reduced form. Moreover, the
coefficient on the number of threshing machines is positive and significant at the 1
percent level in the two-stages least squares specification without county fixed effects,
and at the 10.3 percent level once we add county fixed effects. Also, the number of
threatening letters is strongly correlated with our instrument, as shown in columns 4
and 5 of panel (B). However this variation comes entirely across counties: when we
add county fixed effects in column 6 of panel (B) the coefficient on potential yield
becomes small and indistinguishable from 0. These results are confirmed in the last
three columns of panel (B), which report the two-stages least squares estimates. Here
too, our instrumented measure of machine adoption is positively and significantly
correlated with the threatening letters when we do not control for county fixed effects,
and it becomes insignificant with county fixed effects.
Overall, these results point to a relationship between new machines and these
two types of riots that is positive but not as strong as the one between the new
machines and agricultural riots. This is especially true when we look at the use of
threatening letters across English counties. However, the relationship is weaker within
counties, especially when we look at the diffusion of Swing letters. One possible
interpretation is that the general intensity of these protests across counties can be
explained by the adoption of the new technology. However, within each of the 41
English counties, other sources of discontent may have been a more powerful driver
of the diffusion of fires and threatening letters.
6 Conclusions
A large literature has analyzed the labor market effect of technological change.
Following Autor’s pioneering work (Autor, Levy, and Murnane 2003), there is now
good evidence that routine jobs are increasingly being replaced by computers
26
(Acemoglu and Autor 2011). Recent trends in the labor market therefore echo those of
the First Industrial Revolution, when labor was substituted by machines.
In this paper, we examine the extent to which labor-saving technical change can
lead to social instability and political unrest. We look at one famous historical episode
– the “Captain Swing” riots of 1830-32, which ushered in a period of important
political and institutional reform (Aidt and Franck 2015). The importance of
technological change in driving the riots has been seriously called into question
(Mokyr, Vickers and Ziebarth, 2015). Using newly-compiled data on the diffusion of
threshing machines, we first show that labor-saving technology was a key determinant
of the probability of unrest. Based on data about soil suitability, we also show that the
link was causal, with areas exhibiting greater suitability of wheat cultivation showing
both greater adoption of threshing machines and markedly higher incidence of riots.
While many factors probably contributed to the outbreak of unrest in England and
Wales in 1830-32, this is one of the very first cases for which a causal contribution of
technological change can be demonstrated.
27
References
Acemoglu, Daron. 1998. “Why Do New Technologies Complement Skills? Directed
Technical Change and Wage Inequality.” The Quarterly Journal of Economics
113 (4): 1055–89.
———. 2002. “Directed Technical Change.” Review of Economic Studies 69 (4):
781–809.
———. 2007. “Equilibrium Bias of Technology.” Econometrica 75 (5): 1371–1409.
Acemoglu, Daron, and David Autor. 2011. “Skills, Tasks and Technologies:
Implications for Employment and Earnings.” In Handbook of Labor
Economics, 4:1043–1171. Elsevier.
Aidt, Toke S., and Raphaël Franck. 2015. “Democratization Under the Threat of
Revolution: Evidence From the Great Reform Act of 1832.” Econometrica 83
(2): 505–47.
Aidt, Toke S., Gabriel Leon, and Max Satchell. 2016. The Social Dynamics of Riots:
Evidence from the Captain Swing Riots 1830-1831. Working Paper.
Allen, Robert C. 1992. Enclosure and the Yeoman. Oxford University Press.
———. 2009. The British Industrial Revolution in Global Perspective. New
Approaches to Economic and Social History. Cambridge ; New York:
Cambridge University Press.
Archer, John E. 2000. Social Unrest and Popular Protest in England, 1780-1840.
New Studies in Economic and Social History. Cambridge, UK ; New York:
Cambridge University Press.
Autor, David H. 2015. “Why Are There Still So Many Jobs? The History and Future
of Workplace Automation.” Journal of Economic Perspectives 29 (3): 3–30.
Autor, David H., David Dorn, Gordon Hanson, and Kaveh Majlesi. 2016. “Importing
Political Polarization? The Electoral Consequences of Rising Trade
Exposure.” w22637. Cambridge, MA: National Bureau of Economic
Research.
Autor, David H., Lawrence F. Katz, and Alan B. Krueger. 1998. “Computing
Inequality: Have Computers Changed the Labor Market?” The Quarterly
Journal of Economics 113 (4): 1169–1213.
Autor, David H., Frank Levy, and Richard J. Murnane. 2003. “The Skill Content of
Recent Technological Change: An Empirical Exploration.” The Quarterly
Journal of Economics 118 (4): 1279–1333.
Boyer, George R. 1990. An Economic History of the English Poor Law 1750–1850.
Cambridge: Cambridge University Press.
British Library, and Findmypast. 2016. “The British Newspaper Archive.”
http://www.britishnewspaperarchive.co.uk/.
Brückner, Markus, and Antonio Ciccone. 2010. “International Commodity Prices,
Growth and the Outbreak of Civil War in Sub-Saharan Africa.” The Economic
Journal 120 (544): 519–34.
Bustos, Paula, Bruno Caprettini, and Jacopo Ponticelli. 2016. “Agricultural
Productivity and Structural Transformation: Evidence from Brazil.” American
Economic Review 106 (6): 1320–65.
Charlesworth, Andrew. 1979. Social Protest in a Rural Society: The Spatial Diffusion
of the Captain Swing Disturbances of 1830-1831. Historical Geography
Research Series, no. 1. Norwich: Geo Abstracts [for] the Historical Geography
Research Group.
28
Chassang, Sylvain, and Gerard Padró i Miquel. 2009. “Economic Shocks and Civil
War.” Quarterly Journal of Political Science 4 (3): 211–28.
Checkland, Sydney G. 1974. The Poor Law Report of 1834. Pelican Classics,
Harmondsworth.
Colley, Linda. 2009. Britons: Forging the Nation, 1707-1837. Rev. ed., With new
introductory essay. New Haven: Yale University Press.
Collier, Paul, and Anke Hoeffler. 2004. “Greed and Grievance in Civil War.” Oxford
Economic Papers 56 (4): 563–95.
Conley, T.G. 1999. “GMM Estimation with Cross Sectional Dependence.” Journal of
Econometrics 92 (1): 1–45.
Dal Bó, Ernesto, and Pedro Dal Bó. 2011. “Workers, Warriors, and Criminals: Social
Conflict in General Equilibrium.” Journal of the European Economic
Association 9 (4): 646–77.
Deaton, Angus. 2000. The Analysis of Household Surveys: A Microeconometric
Approach to Development Policy. The World Bank.
Down, K., J. Jollans, A. Lazenby, and R. Wilikins. n.d. “The Distribution of
Grassland and Grassland Usage in the UK.” In Grassland in the British
Economy: Proceedings of a Symposium Held at the University of Reading,
September 1980, 580–83. Reading, United Kingdom: University of Reading
Centre for Agricultural Study.
Dube, Oendrilla, and Juan F. Vargas. 2013. “Commodity Price Shocks and Civil
Conflict: Evidence from Colombia.” The Review of Economic Studies 80 (4):
1384–1421.
Dyck, Ian. 2005. William Cobbett and Rural Popular Culture. Cambridge: Cambridge
University Press.
Fearon, James D. 2008. “Economic Development, Insurgency, and Civil War.” In
Institutions and Economic Performance, 1st ed., 292–328. Cambridge, Mass:
Harvard University Press.
Fearon, James D., and David D. Laitin. 2003. “Ethnicity, Insurgency, and Civil War.”
American Political Science Review 97 (1): 75–90.
Fischer, Günther, Freddy O. Nachtergaele, Sylvia Prieler, Edmar Teixeira, Géza Tóth,
Harrij van Velthuizen, Luc Verelst, and David Wiberg. 2011. “Global Agro-
Ecological Zones (GAEZ v3.0). Model Documentation.” International
Institute for Applied Systems Analysis (IIASA) and Food and Agriculture
Organization (FAO).
“Global Agro-Ecological Zones.” 2015. Raster. Global Agro-Ecological Zones.
Rome, Italy: Food and Agriculture Organization (FAO).
http://www.fao.org/nr/gaez/en/.
Gollin, Douglas, Casper Worm Hansen, and Asger Moll Wingender. 2016. “Two
Blades of Grass: The Impact of the Green Revolution.”
https://editorialexpress.com/cgi-
bin/conference/download.cgi?db_name=EEAESEM2016&paper_id=1882.
Griffin, Carl J. 2012. The Rural War: Captain Swing and the Politics of Protest.
Manchester : New York, NY : distributed in the U.S. by Palgrave Macmillan:
Manchester University Press.
Habakkuk, H. J. 1962. American and British Technology in the Nineteenth Century:
The Search for Labour-Saving Inventions. Cambridge: C.U.P.
Hammond, John L., and Barbara Hammond. 1987. [1920] The Village Labourer,
1760 - 1832: A Study in the Government of England before the Reform Bill.
[Repr. d. Ausg.] Hemel Hempsted, 1913. Gloucester: Sutton.
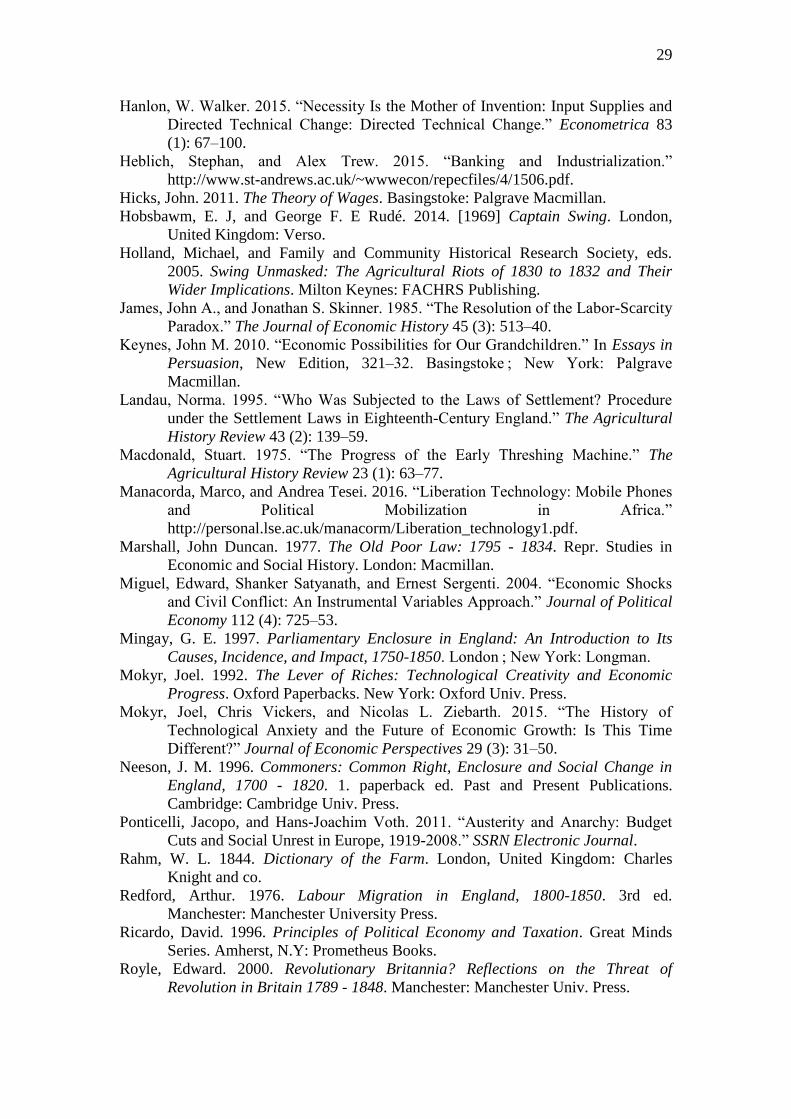
29
Hanlon, W. Walker. 2015. “Necessity Is the Mother of Invention: Input Supplies and
Directed Technical Change: Directed Technical Change.” Econometrica 83
(1): 67–100.
Heblich, Stephan, and Alex Trew. 2015. “Banking and Industrialization.”
http://www.st-andrews.ac.uk/~wwwecon/repecfiles/4/1506.pdf.
Hicks, John. 2011. The Theory of Wages. Basingstoke: Palgrave Macmillan.
Hobsbawm, E. J, and George F. E Rudé. 2014. [1969] Captain Swing. London,
United Kingdom: Verso.
Holland, Michael, and Family and Community Historical Research Society, eds.
2005. Swing Unmasked: The Agricultural Riots of 1830 to 1832 and Their
Wider Implications. Milton Keynes: FACHRS Publishing.
James, John A., and Jonathan S. Skinner. 1985. “The Resolution of the Labor-Scarcity
Paradox.” The Journal of Economic History 45 (3): 513–40.
Keynes, John M. 2010. “Economic Possibilities for Our Grandchildren.” In Essays in
Persuasion, New Edition, 321–32. Basingstoke ; New York: Palgrave
Macmillan.
Landau, Norma. 1995. “Who Was Subjected to the Laws of Settlement? Procedure
under the Settlement Laws in Eighteenth-Century England.” The Agricultural
History Review 43 (2): 139–59.
Macdonald, Stuart. 1975. “The Progress of the Early Threshing Machine.” The
Agricultural History Review 23 (1): 63–77.
Manacorda, Marco, and Andrea Tesei. 2016. “Liberation Technology: Mobile Phones
and Political Mobilization in Africa.”
http://personal.lse.ac.uk/manacorm/Liberation_technology1.pdf.
Marshall, John Duncan. 1977. The Old Poor Law: 1795 - 1834. Repr. Studies in
Economic and Social History. London: Macmillan.
Miguel, Edward, Shanker Satyanath, and Ernest Sergenti. 2004. “Economic Shocks
and Civil Conflict: An Instrumental Variables Approach.” Journal of Political
Economy 112 (4): 725–53.
Mingay, G. E. 1997. Parliamentary Enclosure in England: An Introduction to Its
Causes, Incidence, and Impact, 1750-1850. London ; New York: Longman.
Mokyr, Joel. 1992. The Lever of Riches: Technological Creativity and Economic
Progress. Oxford Paperbacks. New York: Oxford Univ. Press.
Mokyr, Joel, Chris Vickers, and Nicolas L. Ziebarth. 2015. “The History of
Technological Anxiety and the Future of Economic Growth: Is This Time
Different?” Journal of Economic Perspectives 29 (3): 31–50.
Neeson, J. M. 1996. Commoners: Common Right, Enclosure and Social Change in
England, 1700 - 1820. 1. paperback ed. Past and Present Publications.
Cambridge: Cambridge Univ. Press.
Ponticelli, Jacopo, and Hans-Joachim Voth. 2011. “Austerity and Anarchy: Budget
Cuts and Social Unrest in Europe, 1919-2008.” SSRN Electronic Journal.
Rahm, W. L. 1844. Dictionary of the Farm. London, United Kingdom: Charles
Knight and co.
Redford, Arthur. 1976. Labour Migration in England, 1800-1850. 3rd ed.
Manchester: Manchester University Press.
Ricardo, David. 1996. Principles of Political Economy and Taxation. Great Minds
Series. Amherst, N.Y: Prometheus Books.
Royle, Edward. 2000. Revolutionary Britannia? Reflections on the Threat of
Revolution in Britain 1789 - 1848. Manchester: Manchester Univ. Press.
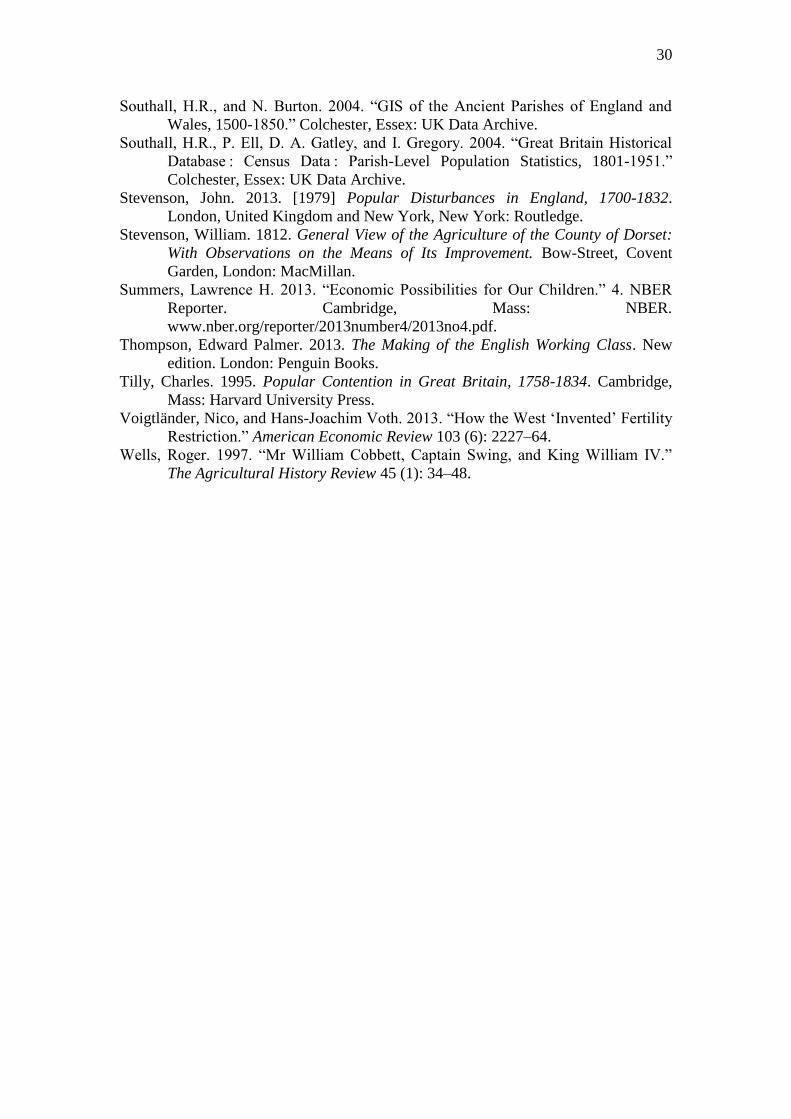
30
Southall, H.R., and N. Burton. 2004. “GIS of the Ancient Parishes of England and
Wales, 1500-1850.” Colchester, Essex: UK Data Archive.
Southall, H.R., P. Ell, D. A. Gatley, and I. Gregory. 2004. “Great Britain Historical
Database : Census Data : Parish-Level Population Statistics, 1801-1951.”
Colchester, Essex: UK Data Archive.
Stevenson, John. 2013. [1979] Popular Disturbances in England, 1700-1832.
London, United Kingdom and New York, New York: Routledge.
Stevenson, William. 1812. General View of the Agriculture of the County of Dorset:
With Observations on the Means of Its Improvement. Bow-Street, Covent
Garden, London: MacMillan.
Summers, Lawrence H. 2013. “Economic Possibilities for Our Children.” 4. NBER
Reporter. Cambridge, Mass: NBER.
www.nber.org/reporter/2013number4/2013no4.pdf.
Thompson, Edward Palmer. 2013. The Making of the English Working Class. New
edition. London: Penguin Books.
Tilly, Charles. 1995. Popular Contention in Great Britain, 1758-1834. Cambridge,
Mass: Harvard University Press.
Voigtländer, Nico, and Hans-Joachim Voth. 2013. “How the West ‘Invented’ Fertility
Restriction.” American Economic Review 103 (6): 2227–64.
Wells, Roger. 1997. “Mr William Cobbett, Captain Swing, and King William IV.”
The Agricultural History Review 45 (1): 34–48.
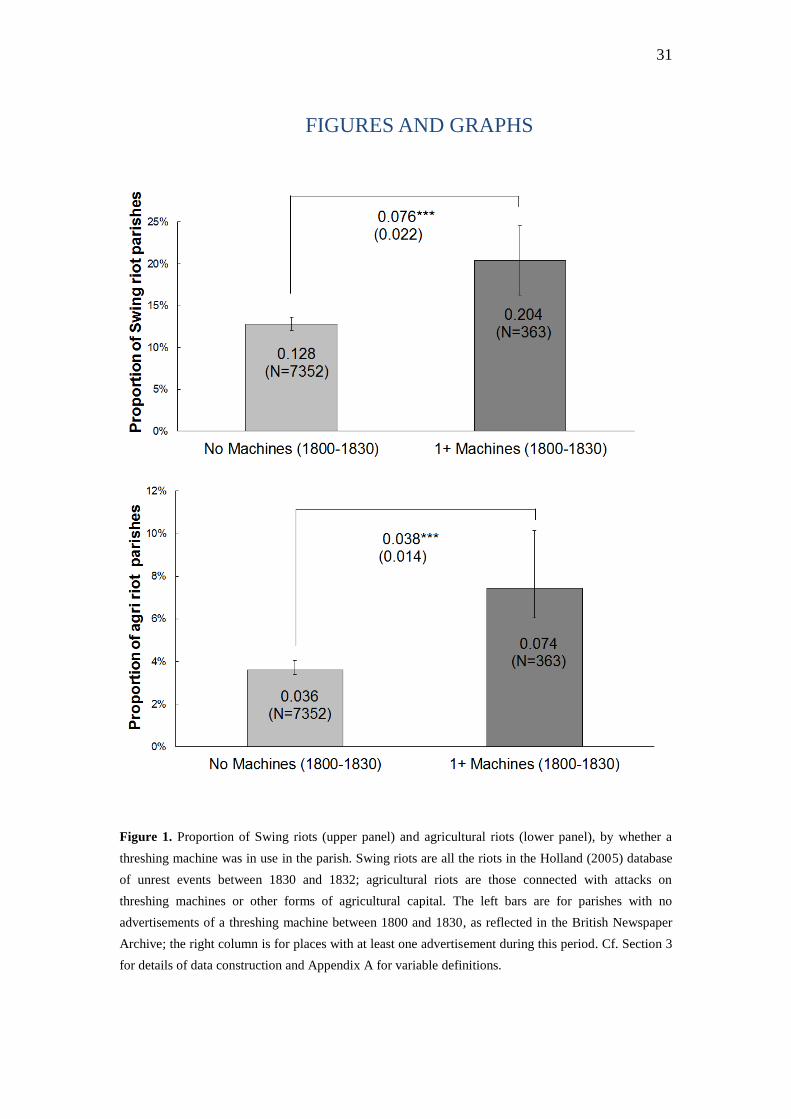
31
FIGURES AND GRAPHS
Figure 1. Proportion of Swing riots (upper panel) and agricultural riots (lower panel), by whether a
threshing machine was in use in the parish. Swing riots are all the riots in the Holland (2005) database
of unrest events between 1830 and 1832; agricultural riots are those connected with attacks on
threshing machines or other forms of agricultural capital. The left bars are for parishes with no
advertisements of a threshing machine between 1800 and 1830, as reflected in the British Newspaper
Archive; the right column is for places with at least one advertisement during this period. Cf. Section 3
for details of data construction and Appendix A for variable definitions.
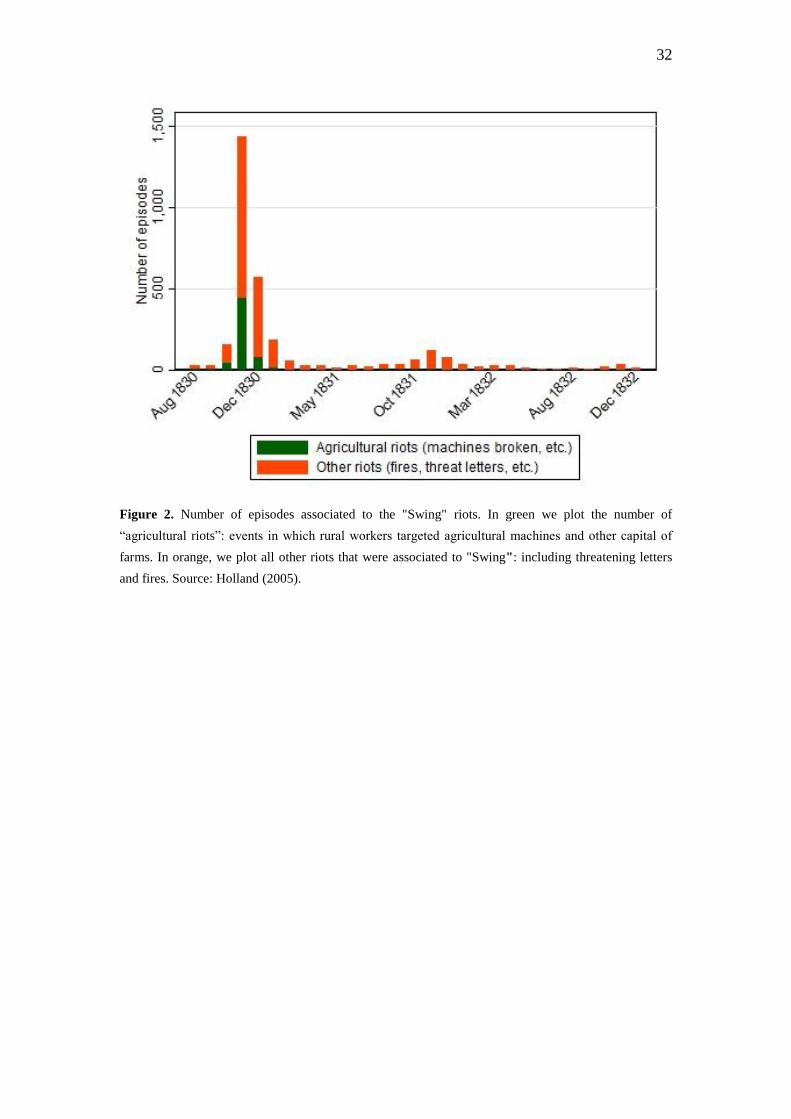
32
Figure 2. Number of episodes associated to the "Swing" riots. In green we plot the number of
“agricultural riots”: events in which rural workers targeted agricultural machines and other capital of
farms. In orange, we plot all other riots that were associated to "Swing": including threatening letters
and fires. Source: Holland (2005).
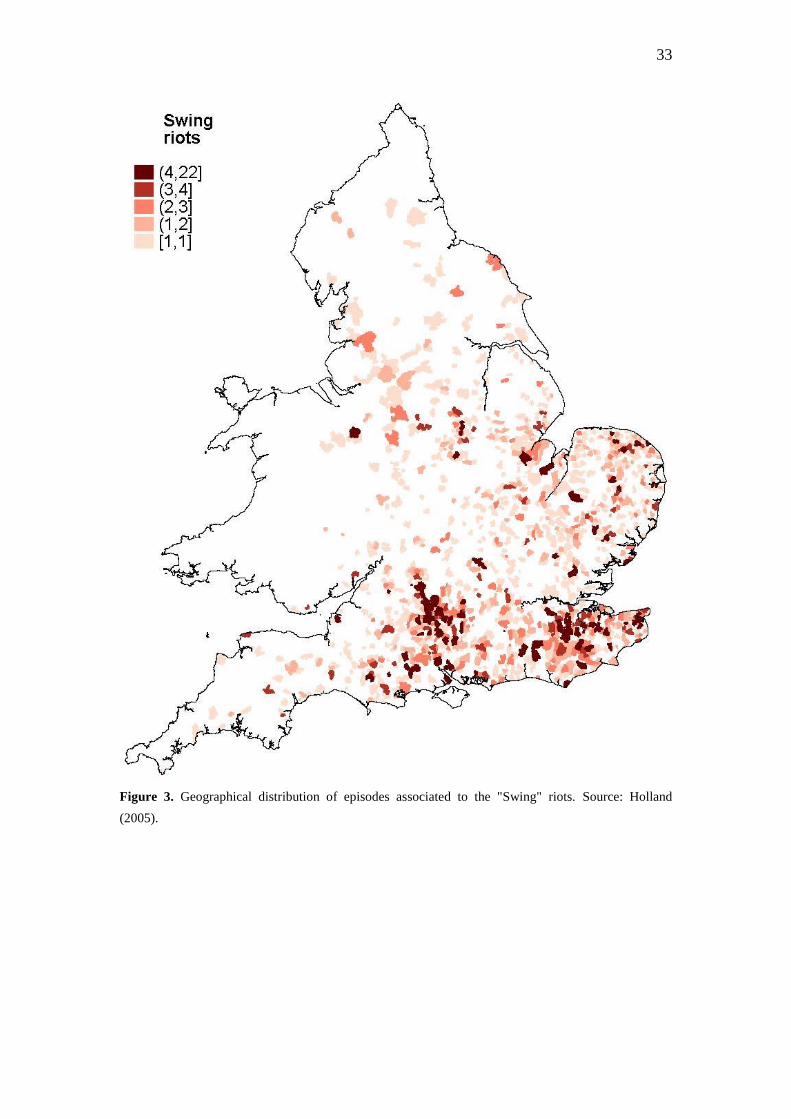
33
Figure 3. Geographical distribution of episodes associated to the "Swing" riots. Source: Holland
(2005).
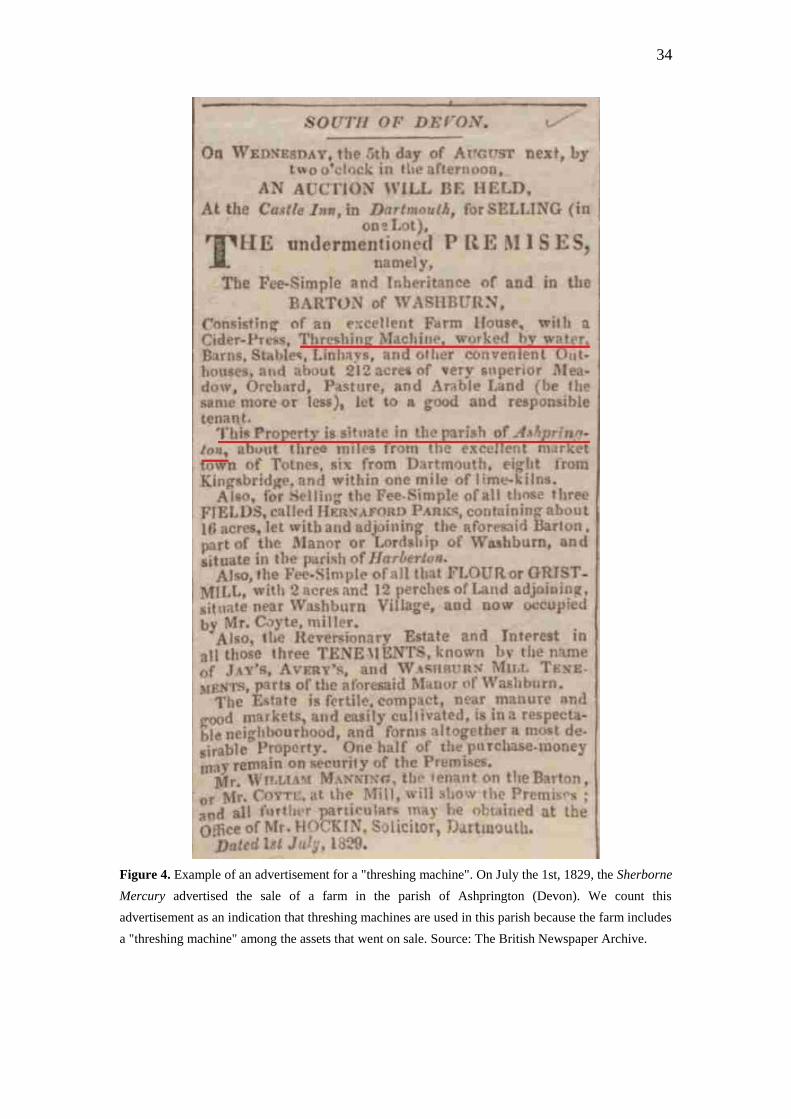
34
Figure 4. Example of an advertisement for a "threshing machine". On July the 1st, 1829, the Sherborne
Mercury advertised the sale of a farm in the parish of Ashprington (Devon). We count this
advertisement as an indication that threshing machines are used in this parish because the farm includes
a "threshing machine" among the assets that went on sale. Source: The British Newspaper Archive.
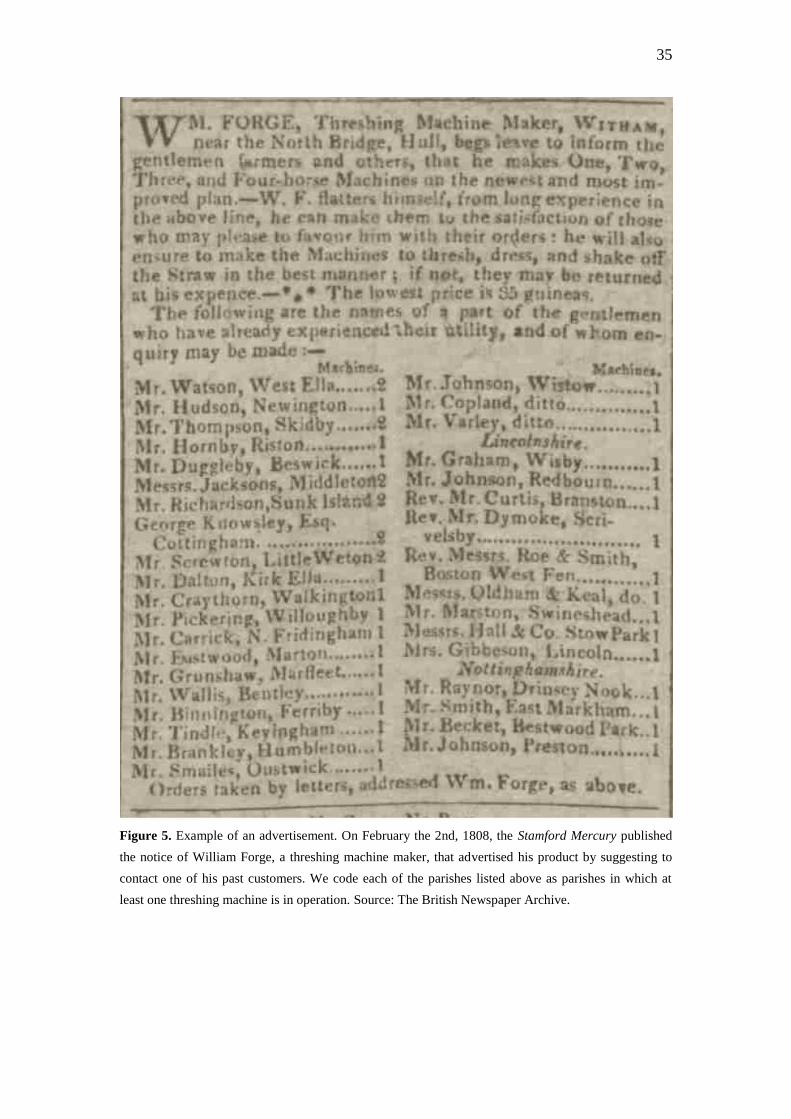
35
Figure 5. Example of an advertisement. On February the 2nd, 1808, the Stamford Mercury published
the notice of William Forge, a threshing machine maker, that advertised his product by suggesting to
contact one of his past customers. We code each of the parishes listed above as parishes in which at
least one threshing machine is in operation. Source: The British Newspaper Archive.
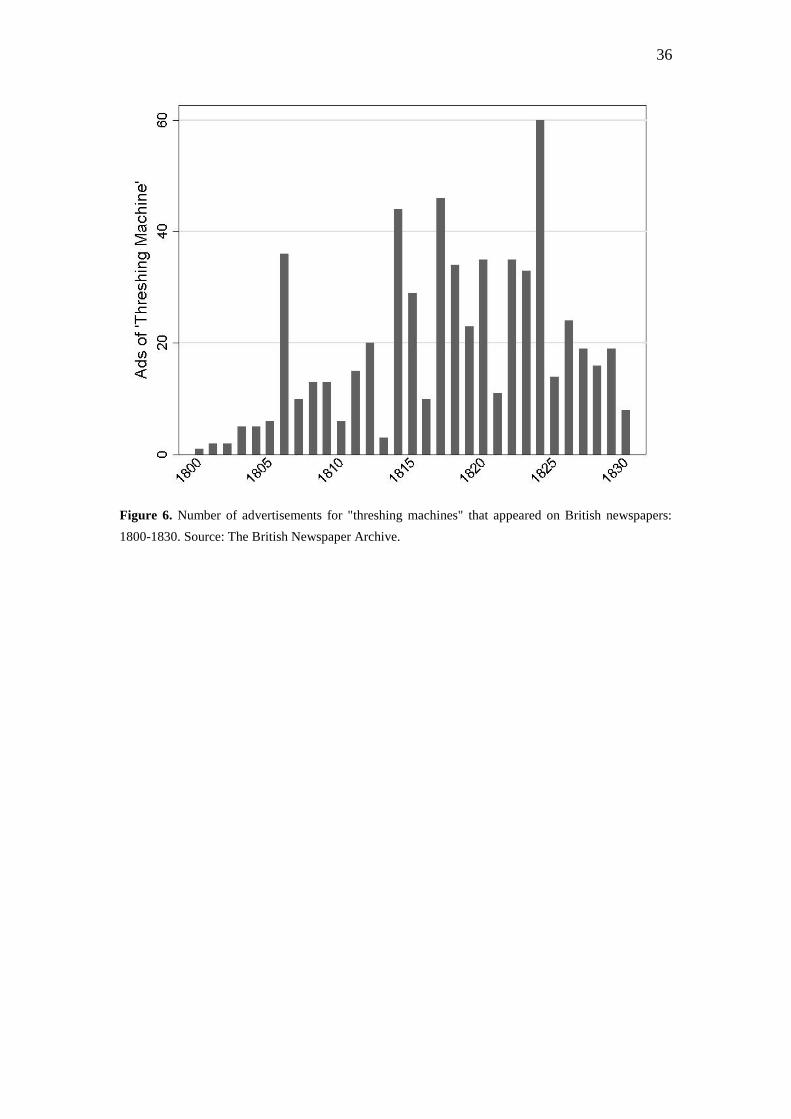
36
Figure 6. Number of advertisements for "threshing machines" that appeared on British newspapers:
1800-1830. Source: The British Newspaper Archive.
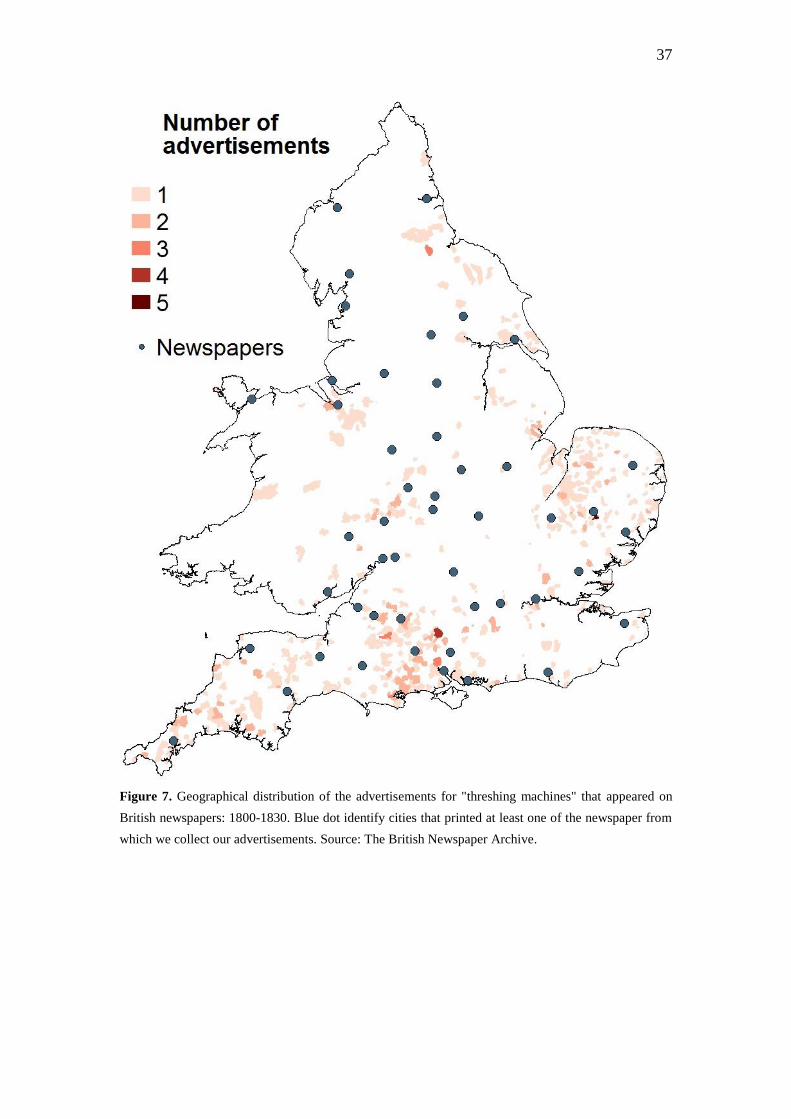
37
Figure 7. Geographical distribution of the advertisements for "threshing machines" that appeared on
British newspapers: 1800-1830. Blue dot identify cities that printed at least one of the newspaper from
which we collect our advertisements. Source: The British Newspaper Archive.
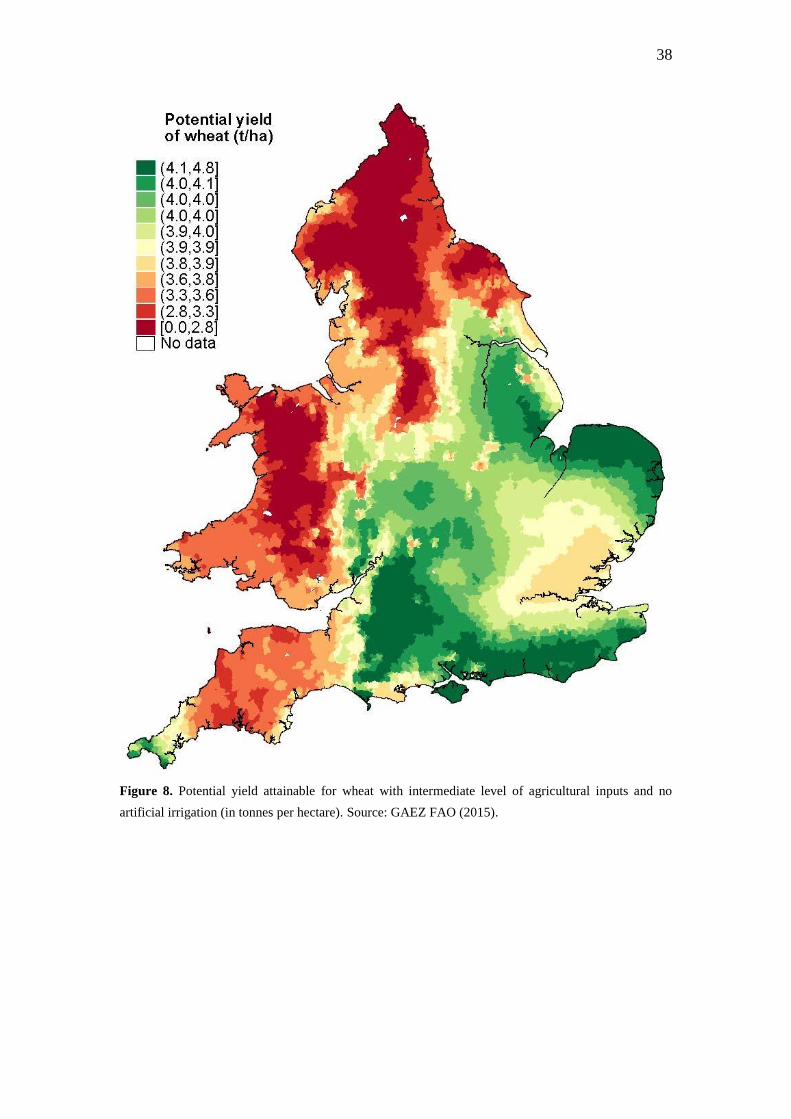
38
Figure 8. Potential yield attainable for wheat with intermediate level of agricultural inputs and no
artificial irrigation (in tonnes per hectare). Source: GAEZ FAO (2015).
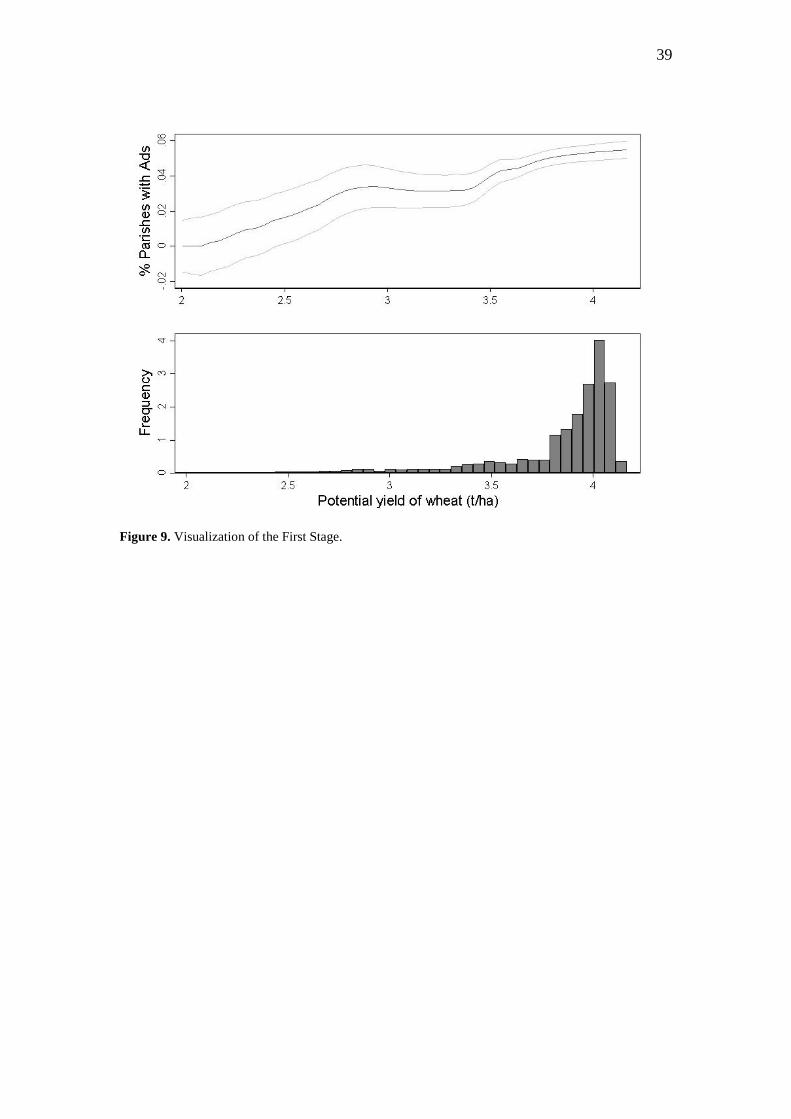
39
Figure 9. Visualization of the First Stage.
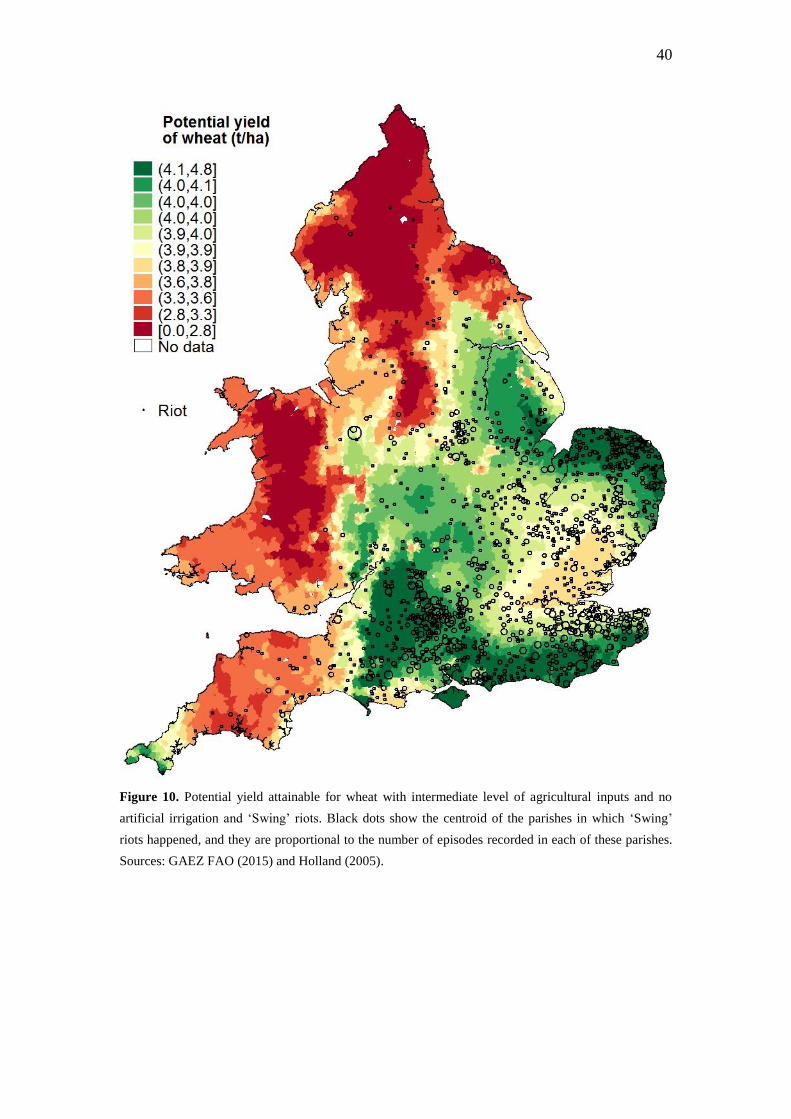
40
Figure 10. Potential yield attainable for wheat with intermediate level of agricultural inputs and no
artificial irrigation and ‘Swing’ riots. Black dots show the centroid of the parishes in which ‘Swing’
riots happened, and they are proportional to the number of episodes recorded in each of these parishes.
Sources: GAEZ FAO (2015) and Holland (2005).
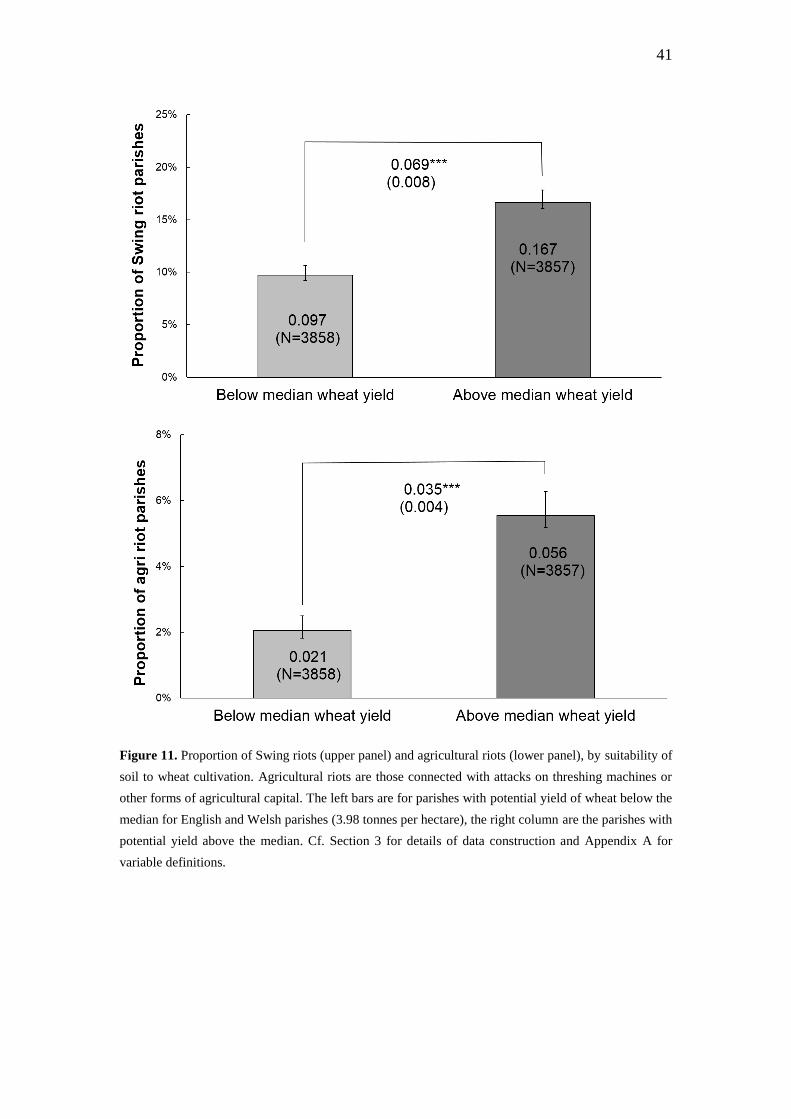
41
Figure 11. Proportion of Swing riots (upper panel) and agricultural riots (lower panel), by suitability of
soil to wheat cultivation. Agricultural riots are those connected with attacks on threshing machines or
other forms of agricultural capital. The left bars are for parishes with potential yield of wheat below the
median for English and Welsh parishes (3.98 tonnes per hectare), the right column are the parishes with
potential yield above the median. Cf. Section 3 for details of data construction and Appendix A for
variable definitions.
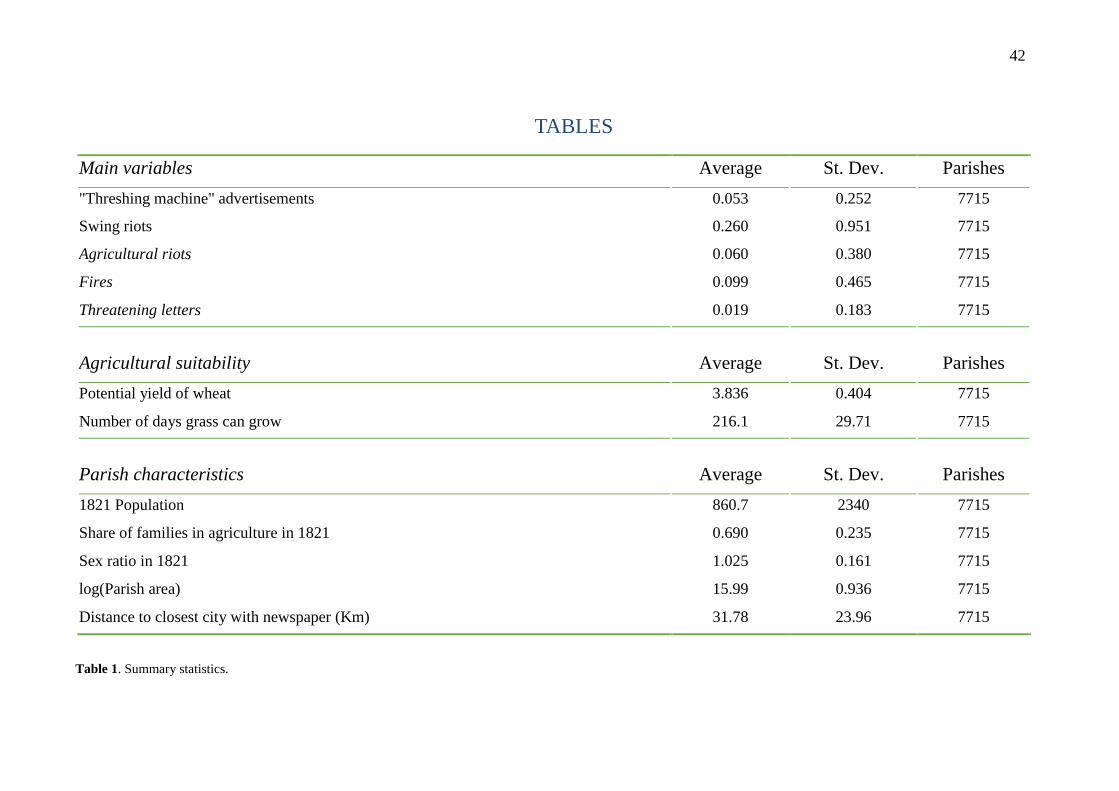
42
TABLES
Main variables Average St. Dev. Parishes
"Threshing machine" advertisements 0.053 0.252 7715
Swing riots 0.260 0.951 7715
Agricultural riots 0.060 0.380 7715
Fires 0.099 0.465 7715
Threatening letters 0.019 0.183 7715
Agricultural suitability Average St. Dev. Parishes
Potential yield of wheat 3.836 0.404 7715
Number of days grass can grow 216.1 29.71 7715
Parish characteristics Average St. Dev. Parishes
1821 Population 860.7 2340 7715
Share of families in agriculture in 1821 0.690 0.235 7715
Sex ratio in 1821 1.025 0.161 7715
log(Parish area) 15.99 0.936 7715
Distance to closest city with newspaper (Km) 31.78 23.96 7715
Table 1. Summary statistics.
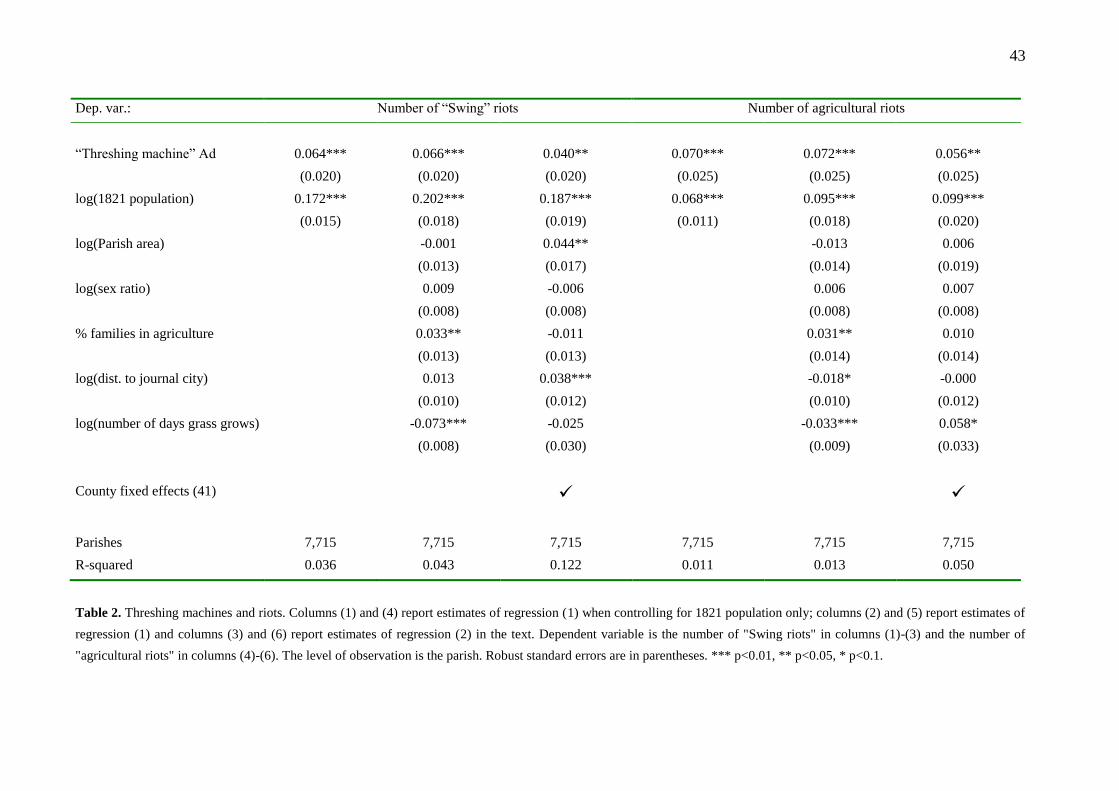
43
Dep. var.: Number of “Swing” riots Number of agricultural riots
“Threshing machine” Ad 0.064*** 0.066*** 0.040** 0.070*** 0.072*** 0.056**
(0.020) (0.020) (0.020) (0.025) (0.025) (0.025)
log(1821 population) 0.172*** 0.202*** 0.187*** 0.068*** 0.095*** 0.099***
(0.015) (0.018) (0.019) (0.011) (0.018) (0.020)
log(Parish area) -0.001 0.044** -0.013 0.006
(0.013) (0.017) (0.014) (0.019)
log(sex ratio) 0.009 -0.006 0.006 0.007
(0.008) (0.008) (0.008) (0.008)
% families in agriculture 0.033** -0.011 0.031** 0.010
(0.013) (0.013) (0.014) (0.014)
log(dist. to journal city) 0.013 0.038*** -0.018* -0.000
(0.010) (0.012) (0.010) (0.012)
log(number of days grass grows) -0.073*** -0.025 -0.033*** 0.058*
(0.008) (0.030) (0.009) (0.033)
County fixed effects (41)
Parishes 7,715 7,715 7,715 7,715 7,715 7,715
R-squared 0.036 0.043 0.122 0.011 0.013 0.050
Table 2. Threshing machines and riots. Columns (1) and (4) report estimates of regression (1) when controlling for 1821 population only; columns (2) and (5) report estimates of
regression (1) and columns (3) and (6) report estimates of regression (2) in the text. Dependent variable is the number of "Swing riots" in columns (1)-(3) and the number of
"agricultural riots" in columns (4)-(6). The level of observation is the parish. Robust standard errors are in parentheses. *** p<0.01, ** p<0.05, * p<0.1.
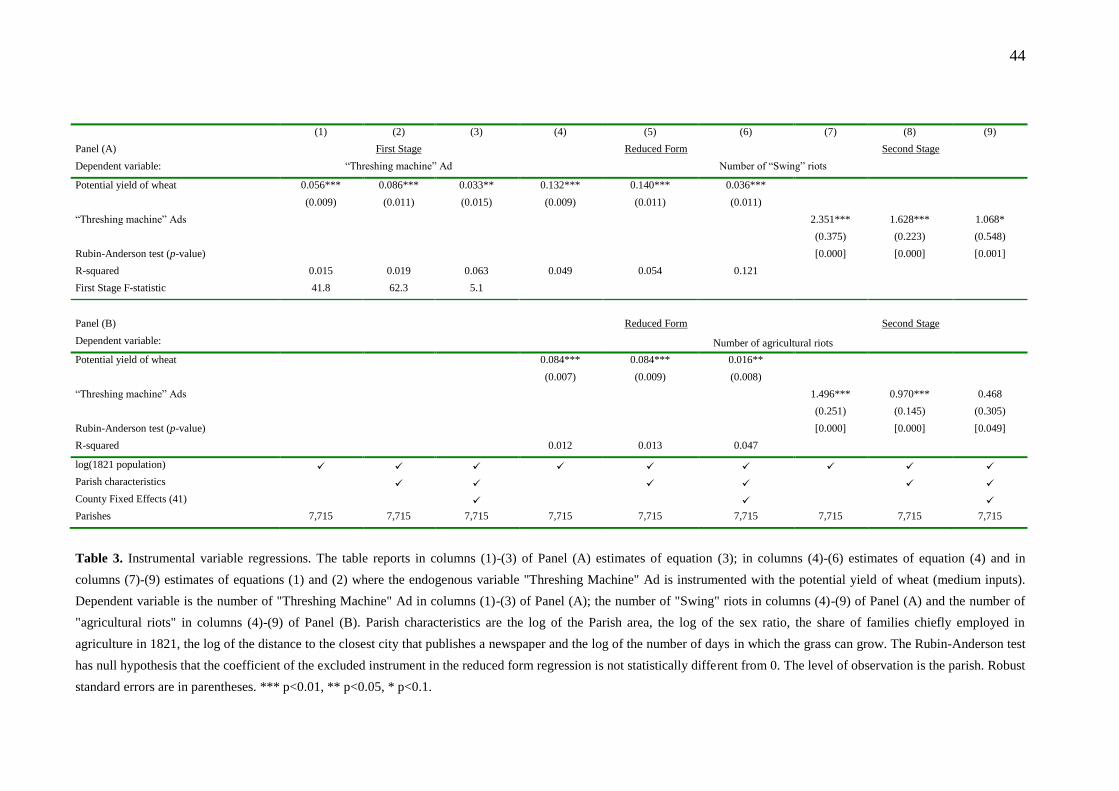
44
(1) (2) (3) (4) (5) (6) (7) (8) (9)
Panel (A) First Stage Reduced Form Second Stage
Dependent variable: “Threshing machine” Ad Number of “Swing” riots
Potential yield of wheat 0.056*** 0.086*** 0.033** 0.132*** 0.140*** 0.036***
(0.009) (0.011) (0.015) (0.009) (0.011) (0.011)
“Threshing machine” Ads 2.351*** 1.628*** 1.068*
(0.375) (0.223) (0.548)
Rubin-Anderson test (p-value) [0.000] [0.000] [0.001]
R-squared 0.015 0.019 0.063 0.049 0.054 0.121
First Stage F-statistic 41.8 62.3 5.1
Panel (B) Reduced Form Second Stage
Dependent variable: Number of agricultural riots
Potential yield of wheat 0.084*** 0.084*** 0.016**
(0.007) (0.009) (0.008)
“Threshing machine” Ads 1.496*** 0.970*** 0.468
(0.251) (0.145) (0.305)
Rubin-Anderson test (p-value) [0.000] [0.000] [0.049]
R-squared 0.012 0.013 0.047
log(1821 population)
Parish characteristics
County Fixed Effects (41)
Parishes 7,715 7,715 7,715 7,715 7,715 7,715 7,715 7,715 7,715
Table 3. Instrumental variable regressions. The table reports in columns (1)-(3) of Panel (A) estimates of equation (3); in columns (4)-(6) estimates of equation (4) and in
columns (7)-(9) estimates of equations (1) and (2) where the endogenous variable "Threshing Machine" Ad is instrumented with the potential yield of wheat (medium inputs).
Dependent variable is the number of "Threshing Machine" Ad in columns (1)-(3) of Panel (A); the number of "Swing" riots in columns (4)-(9) of Panel (A) and the number of
"agricultural riots" in columns (4)-(9) of Panel (B). Parish characteristics are the log of the Parish area, the log of the sex ratio, the share of families chiefly employed in
agriculture in 1821, the log of the distance to the closest city that publishes a newspaper and the log of the number of days in which the grass can grow. The Rubin-Anderson test
has null hypothesis that the coefficient of the excluded instrument in the reduced form regression is not statistically different from 0. The level of observation is the parish. Robust
standard errors are in parentheses. *** p<0.01, ** p<0.05, * p<0.1.
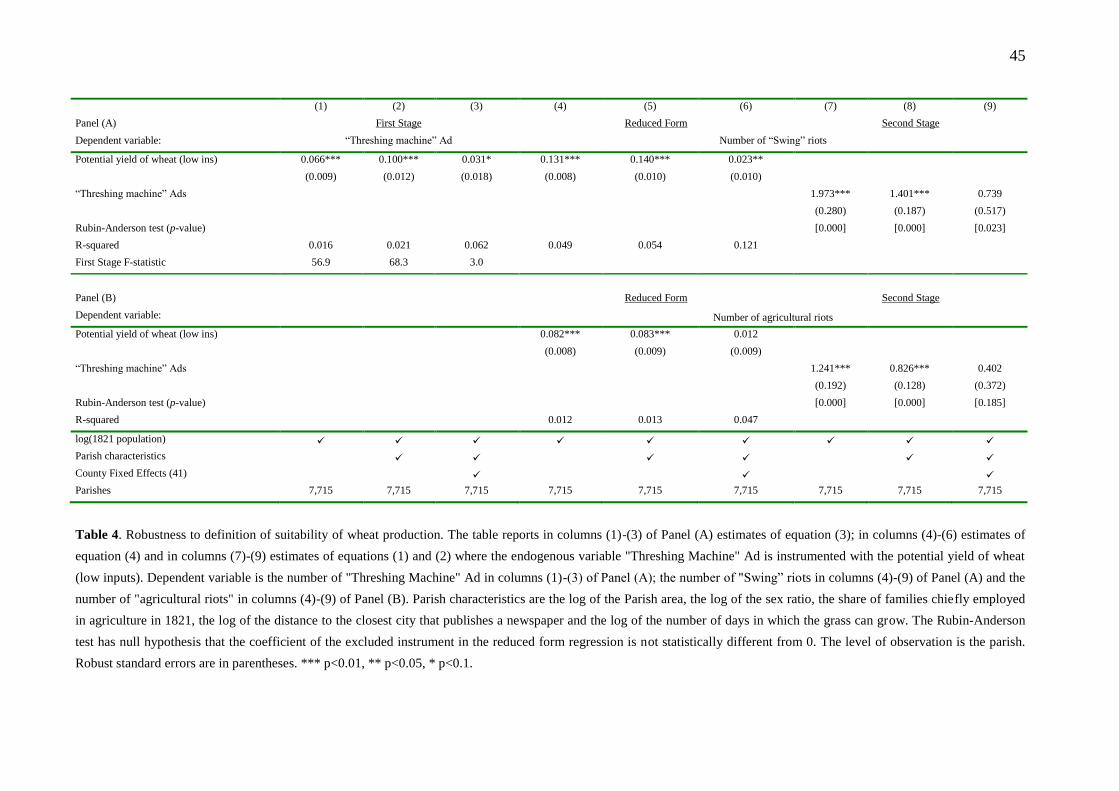
45
(1) (2) (3) (4) (5) (6) (7) (8) (9)
Panel (A) First Stage Reduced Form Second Stage
Dependent variable: “Threshing machine” Ad Number of “Swing” riots
Potential yield of wheat (low ins) 0.066*** 0.100*** 0.031* 0.131*** 0.140*** 0.023**
(0.009) (0.012) (0.018) (0.008) (0.010) (0.010)
“Threshing machine” Ads 1.973*** 1.401*** 0.739
(0.280) (0.187) (0.517)
Rubin-Anderson test (p-value) [0.000] [0.000] [0.023]
R-squared 0.016 0.021 0.062 0.049 0.054 0.121
First Stage F-statistic 56.9 68.3 3.0
Panel (B) Reduced Form Second Stage
Dependent variable: Number of agricultural riots
Potential yield of wheat (low ins) 0.082*** 0.083*** 0.012
(0.008) (0.009) (0.009)
“Threshing machine” Ads 1.241*** 0.826*** 0.402
(0.192) (0.128) (0.372)
Rubin-Anderson test (p-value) [0.000] [0.000] [0.185]
R-squared 0.012 0.013 0.047
log(1821 population)
Parish characteristics
County Fixed Effects (41)
Parishes 7,715 7,715 7,715 7,715 7,715 7,715 7,715 7,715 7,715
Table 4. Robustness to definition of suitability of wheat production. The table reports in columns (1)-(3) of Panel (A) estimates of equation (3); in columns (4)-(6) estimates of
equation (4) and in columns (7)-(9) estimates of equations (1) and (2) where the endogenous variable "Threshing Machine" Ad is instrumented with the potential yield of wheat
(low inputs). Dependent variable is the number of "Threshing Machine" Ad in columns (1)-(3) of Panel (A); the number of "Swing” riots in columns (4)-(9) of Panel (A) and the
number of "agricultural riots" in columns (4)-(9) of Panel (B). Parish characteristics are the log of the Parish area, the log of the sex ratio, the share of families chiefly employed
in agriculture in 1821, the log of the distance to the closest city that publishes a newspaper and the log of the number of days in which the grass can grow. The Rubin-Anderson
test has null hypothesis that the coefficient of the excluded instrument in the reduced form regression is not statistically different from 0. The level of observation is the parish.
Robust standard errors are in parentheses. *** p<0.01, ** p<0.05, * p<0.1.
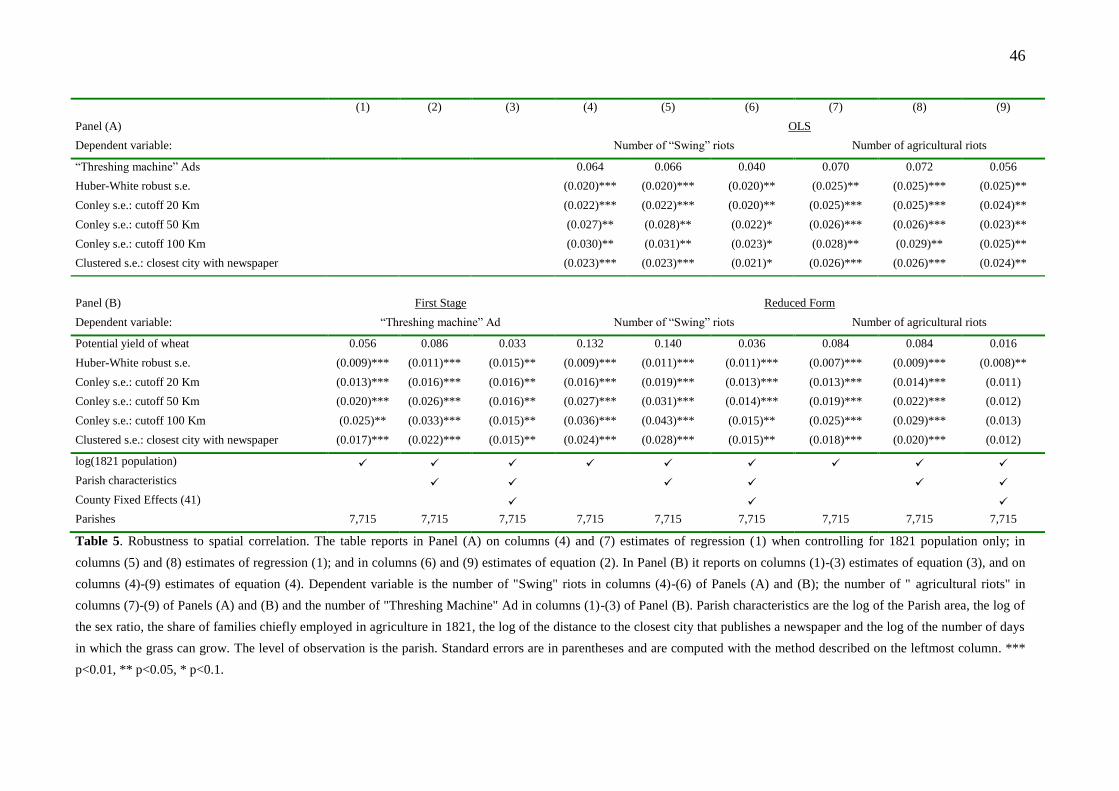
46
(1) (2) (3) (4) (5) (6) (7) (8) (9)
Panel (A) OLS
Dependent variable: Number of “Swing” riots Number of agricultural riots
“Threshing machine” Ads 0.064 0.066 0.040 0.070 0.072 0.056
Huber-White robust s.e. (0.020)*** (0.020)*** (0.020)** (0.025)** (0.025)*** (0.025)**
Conley s.e.: cutoff 20 Km (0.022)*** (0.022)*** (0.020)** (0.025)*** (0.025)*** (0.024)**
Conley s.e.: cutoff 50 Km (0.027)** (0.028)** (0.022)* (0.026)*** (0.026)*** (0.023)**
Conley s.e.: cutoff 100 Km (0.030)** (0.031)** (0.023)* (0.028)** (0.029)** (0.025)**
Clustered s.e.: closest city with newspaper (0.023)*** (0.023)*** (0.021)* (0.026)*** (0.026)*** (0.024)**
Panel (B) First Stage Reduced Form
Dependent variable: “Threshing machine” Ad Number of “Swing” riots Number of agricultural riots
Potential yield of wheat 0.056 0.086 0.033 0.132 0.140 0.036 0.084 0.084 0.016
Huber-White robust s.e. (0.009)*** (0.011)*** (0.015)** (0.009)*** (0.011)*** (0.011)*** (0.007)*** (0.009)*** (0.008)**
Conley s.e.: cutoff 20 Km (0.013)*** (0.016)*** (0.016)** (0.016)*** (0.019)*** (0.013)*** (0.013)*** (0.014)*** (0.011)
Conley s.e.: cutoff 50 Km (0.020)*** (0.026)*** (0.016)** (0.027)*** (0.031)*** (0.014)*** (0.019)*** (0.022)*** (0.012)
Conley s.e.: cutoff 100 Km (0.025)** (0.033)*** (0.015)** (0.036)*** (0.043)*** (0.015)** (0.025)*** (0.029)*** (0.013)
Clustered s.e.: closest city with newspaper (0.017)*** (0.022)*** (0.015)** (0.024)*** (0.028)*** (0.015)** (0.018)*** (0.020)*** (0.012)
log(1821 population)
Parish characteristics
County Fixed Effects (41)
Parishes 7,715 7,715 7,715 7,715 7,715 7,715 7,715 7,715 7,715
Table 5. Robustness to spatial correlation. The table reports in Panel (A) on columns (4) and (7) estimates of regression (1) when controlling for 1821 population only; in
columns (5) and (8) estimates of regression (1); and in columns (6) and (9) estimates of equation (2). In Panel (B) it reports on columns (1)-(3) estimates of equation (3), and on
columns (4)-(9) estimates of equation (4). Dependent variable is the number of "Swing" riots in columns (4)-(6) of Panels (A) and (B); the number of " agricultural riots" in
columns (7)-(9) of Panels (A) and (B) and the number of "Threshing Machine" Ad in columns (1)-(3) of Panel (B). Parish characteristics are the log of the Parish area, the log of
the sex ratio, the share of families chiefly employed in agriculture in 1821, the log of the distance to the closest city that publishes a newspaper and the log of the number of days
in which the grass can grow. The level of observation is the parish. Standard errors are in parentheses and are computed with the method described on the leftmost column. ***
p<0.01, ** p<0.05, * p<0.1.
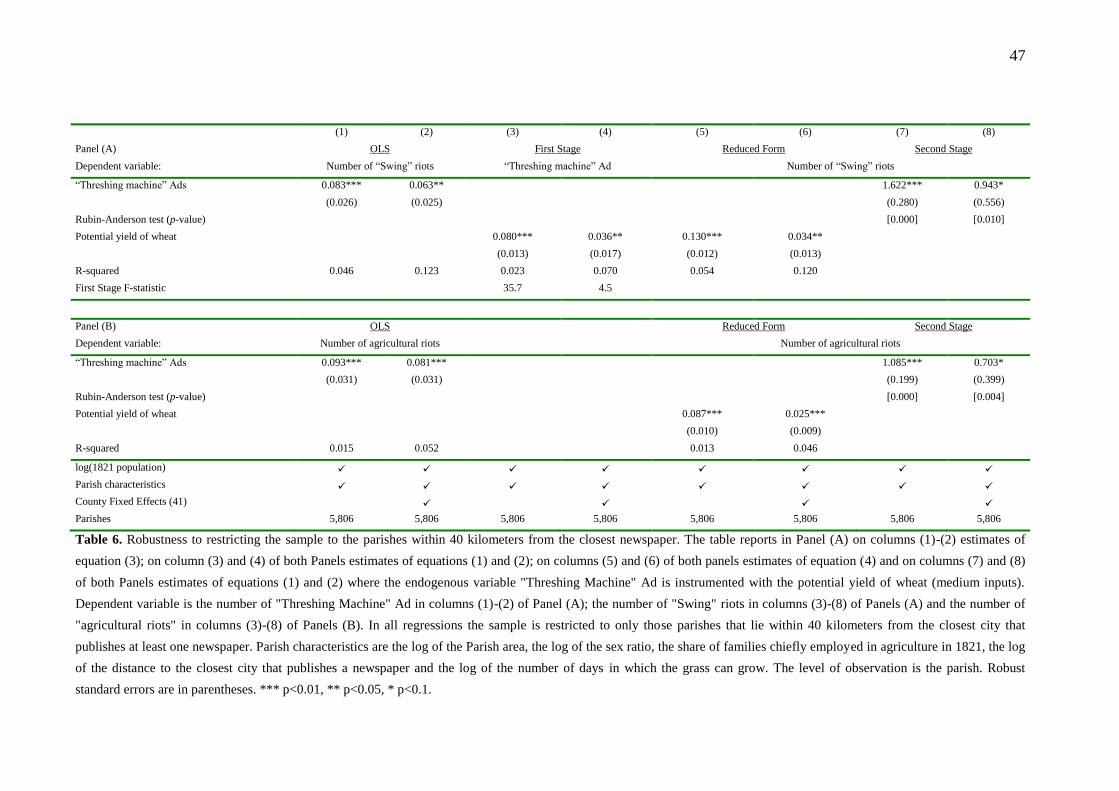
47
(1) (2) (3) (4) (5) (6) (7) (8)
Panel (A) OLS First Stage Reduced Form Second Stage
Dependent variable: Number of “Swing” riots “Threshing machine” Ad Number of “Swing” riots
“Threshing machine” Ads 0.083*** 0.063** 1.622*** 0.943*
(0.026) (0.025) (0.280) (0.556)
Rubin-Anderson test (p-value) [0.000] [0.010]
Potential yield of wheat 0.080*** 0.036** 0.130*** 0.034**
(0.013) (0.017) (0.012) (0.013)
R-squared 0.046 0.123 0.023 0.070 0.054 0.120
First Stage F-statistic 35.7 4.5
Panel (B) OLS Reduced Form Second Stage
Dependent variable: Number of agricultural riots Number of agricultural riots
“Threshing machine” Ads 0.093*** 0.081*** 1.085*** 0.703*
(0.031) (0.031) (0.199) (0.399)
Rubin-Anderson test (p-value) [0.000] [0.004]
Potential yield of wheat 0.087*** 0.025***
(0.010) (0.009)
R-squared 0.015 0.052 0.013 0.046
log(1821 population)
Parish characteristics
County Fixed Effects (41)
Parishes 5,806 5,806 5,806 5,806 5,806 5,806 5,806 5,806
Table 6. Robustness to restricting the sample to the parishes within 40 kilometers from the closest newspaper. The table reports in Panel (A) on columns (1)-(2) estimates of
equation (3); on column (3) and (4) of both Panels estimates of equations (1) and (2); on columns (5) and (6) of both panels estimates of equation (4) and on columns (7) and (8)
of both Panels estimates of equations (1) and (2) where the endogenous variable "Threshing Machine" Ad is instrumented with the potential yield of wheat (medium inputs).
Dependent variable is the number of "Threshing Machine" Ad in columns (1)-(2) of Panel (A); the number of "Swing" riots in columns (3)-(8) of Panels (A) and the number of
"agricultural riots" in columns (3)-(8) of Panels (B). In all regressions the sample is restricted to only those parishes that lie within 40 kilometers from the closest city that
publishes at least one newspaper. Parish characteristics are the log of the Parish area, the log of the sex ratio, the share of families chiefly employed in agriculture in 1821, the log
of the distance to the closest city that publishes a newspaper and the log of the number of days in which the grass can grow. The level of observation is the parish. Robust
standard errors are in parentheses. *** p<0.01, ** p<0.05, * p<0.1.
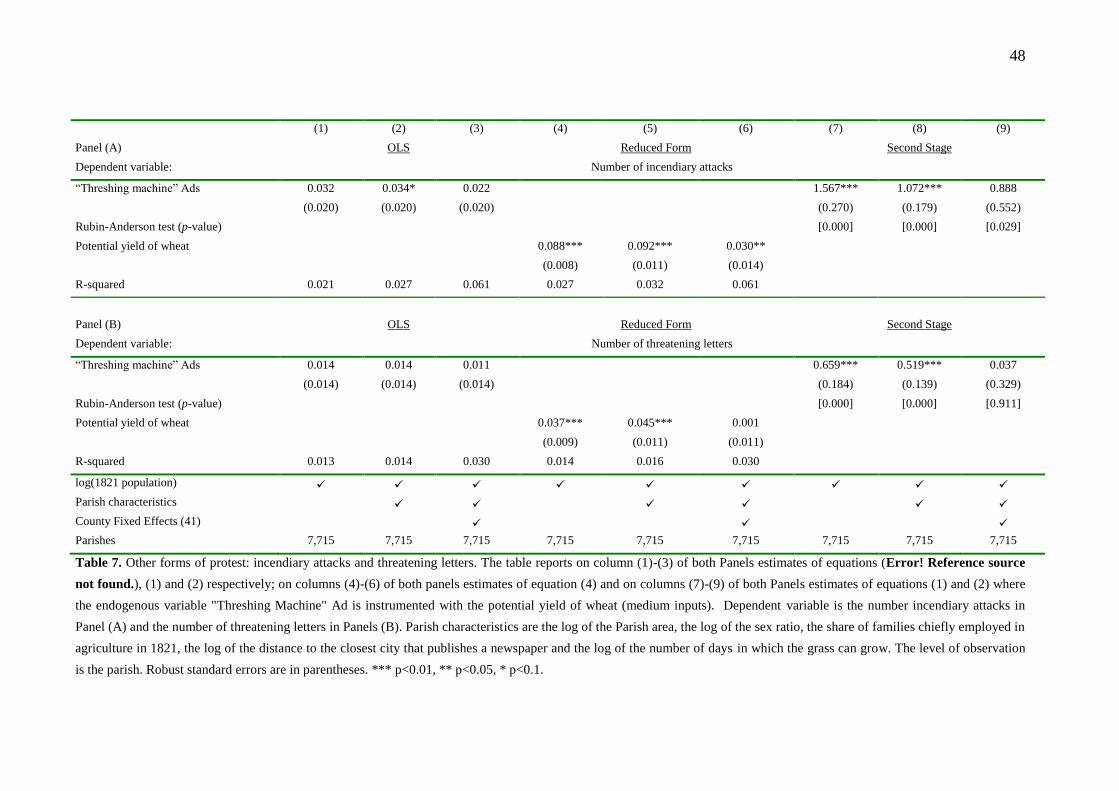
48
(1) (2) (3) (4) (5) (6) (7) (8) (9)
Panel (A) OLS Reduced Form Second Stage
Dependent variable: Number of incendiary attacks
“Threshing machine” Ads 0.032 0.034* 0.022 1.567*** 1.072*** 0.888
(0.020) (0.020) (0.020) (0.270) (0.179) (0.552)
Rubin-Anderson test (p-value) [0.000] [0.000] [0.029]
Potential yield of wheat 0.088*** 0.092*** 0.030**
(0.008) (0.011) (0.014)
R-squared 0.021 0.027 0.061 0.027 0.032 0.061
Panel (B) OLS Reduced Form Second Stage
Dependent variable: Number of threatening letters
“Threshing machine” Ads 0.014 0.014 0.011 0.659*** 0.519*** 0.037
(0.014) (0.014) (0.014) (0.184) (0.139) (0.329)
Rubin-Anderson test (p-value) [0.000] [0.000] [0.911]
Potential yield of wheat 0.037*** 0.045*** 0.001
(0.009) (0.011) (0.011)
R-squared 0.013 0.014 0.030 0.014 0.016 0.030
log(1821 population)
Parish characteristics
County Fixed Effects (41)
Parishes 7,715 7,715 7,715 7,715 7,715 7,715 7,715 7,715 7,715
Table 7. Other forms of protest: incendiary attacks and threatening letters. The table reports on column (1)-(3) of both Panels estimates of equations (Error! Reference source
not found.), (1) and (2) respectively; on columns (4)-(6) of both panels estimates of equation (4) and on columns (7)-(9) of both Panels estimates of equations (1) and (2) where
the endogenous variable "Threshing Machine" Ad is instrumented with the potential yield of wheat (medium inputs). Dependent variable is the number incendiary attacks in
Panel (A) and the number of threatening letters in Panels (B). Parish characteristics are the log of the Parish area, the log of the sex ratio, the share of families chiefly employed in
agriculture in 1821, the log of the distance to the closest city that publishes a newspaper and the log of the number of days in which the grass can grow. The level of observation
is the parish. Robust standard errors are in parentheses. *** p<0.01, ** p<0.05, * p<0.1.
49
A Data Appendix
In this appendix we describe data sources and variable construction.
"Threshing machine" ads. We collect data on the number of threshing machines advertised
in English and Welsh newspapers from the website “British Newspaper Archive.”26 Within
the universe of the 66 regional newspaper published between 1800 and 1830, we search for
the exact string “threshing machine”. We restrict our search to those articles that are classified
as either "advertisement" or "classifieds". Next, we read in full each article retrieved, and
determine whether it is relevant for our research. We consider relevant information any article
that advertises the sale or the lease of a threshing machine or of a farm that lists a threshing
machine among its assets. We also consider the information provided by some threshing
machine manufacturers who list name and location of their clients: these clients are farmers
located in parishes all over the country (see Figure 5 for an example). We drop all
advertisements of threshing machines producers that only provide information about the
location of the factory, usually an industrial town. In the last step, we manually geo-locate
each advertisement, and find the parish in which the threshing machine or the farm is located.
Our geographical reference is a map of historical parishes in England and Wales prepared by
Southall and Burton (2004). Whenever we link a parish to one of our advertisements, we add
1 to the number of threshing machines we find in that parish. However, we only consider a
single threshing machine whenever we find the same advertisement printed more than once.
Swing riots. Data on Swing riots comes from a database compiled by the Family and
Community Historical Research Society (Holland 2005). It contains a comprehensive list of
Captain Swing incidents between January 1830 and December 1832. The information comes
from official records and historical newspapers and contains the exact date, the parish, and the
type of crime perpetrated by rioters. We manually match the parish of each episode to the
historical map of English and Welsh parishes (Southall and Burton, 2004). On this map, we
identify the location of these riots with the county (variable COUNTY) and either the name of
the parish (variable PAR) or the name of the place (variable PLA). For the variable Swing riot
we consider every episode listed in the database.
Agricultural riots. These riots are a subset of the Swing riots: they consist of every episode
recorded as "machine breaking" (either threshing machines or other agricultural machines),
"damage of crop, fences etc. ," "gleaning riot," or "malicious killing of livestock". Breaking of
threshing machines represent the overwhelming majority of agricultural riots: 77 percent of
these episodes are classified as "Machine breaking (threshing machines)". Destruction of
26 Accessible at: http://www.britishnewspaperarchive.co.uk/.
50
other agricultural machines such as winnowing machines represent another 7 percent of these
episodes.
Incendiary attacks. These events are a subset of the Swing riot variable: they consist of
every episode recorded as "incendiarism," "attempted incendiarism," or "incitement to commit
incendiarism".
Threatening letters. These events are a subset of the Swing riot variable: they consist of
every episode recorded as "sending anonymous threatening letters," "seditious notice," or
"demanding with menaces."
Potential yield of wheat (intermediate and low inputs). We construct potential yield of
wheat for each parish by combining data from the Food and Agriculture Organization Global
Agro-Ecological Zones database (FAO-GAEZ) and the map of English and Welsh parishes.
We use the potential yield for summer wheat computed under the assumption of intermediate
(low) inputs and rain-fed irrigation. The original data is a raster that covers the entire land
mass of the Earth on a grid of about 9.25 × 9.25 kilometers. We first resample the raster on a
finer grid of 0.0185 × 0.0185 kilometers with the "nearest" method. Next, we superimpose the
raster to the historical map of English and Welsh parishes prepared by Southall and Burton
(2004), and for every cell of the raster we take its centroid and assign it to the parish where
this centroid falls. Finally, for every parish we take the average potential yield of all the cells
that fall in the parish.
Number of days grass can grow. This variable is computed by Down et al. (1981), and
represent the total number of days in which grass can grow during a calendar year. The
original data appears as an image on the book of Down et al. (1981): we geo-reference and
digitize the map from the book. Next, we convert the map to a raster and superimpose it to the
map of historical parishes of England and Wales. Finally, we resample and assign each cell of
the raster to the parish where this cell falls, as we did for the potential yield of wheat. In the
regressions we use the natural logarithm of this variable.
1821 Population. Total number of people in a parish comes from the 1821 Census of England
(Southall et al. 2004). The original variable in the database is TOT_POP: "Total number of
inhabitants" in 1821. Data come at the parish level: we merge it to the historical map of
English and Welsh parishes using the county (variable ANC_CNTY) and parish (variable
ANC_PAR) reported in the Census. In the regressions we use the natural logarithm of this
variable.
Share of families in agriculture in 1821. This variable is constructed with data from the
1821 Census of England (Southall et al. 2004) as the number of families chiefly employed in
agriculture (variable FAMAGRI) divided by the total number of families in the parish. The
total number of families is the sum of three variables: FAMAGRI, FAMTRADE (families
chiefly employed in trade) and FAMOTHER (families chiefly employed in other activities).
51
Census data come at the parish level and we merge it to the historical map of English and
Welsh parishes as we did with the 1821 population.
Sex ratio in 1821. The sex ratio is calculated with data from the 1821 Census as the total
number of men (variable TOT_MALE) divided by the total number of women (variable
TOT_FEM). Census data come at the parish level and we merge it to the historical map of
English and Welsh parishes as we did with the 1821 population. In the regressions we use the
natural logarithm of this variable.
Parish area. The total area of the parish (in square kilometers) is calculated with ArcGIS
based on the map of historical parishes of England and Wales prepared by Southall and
Burton (2004). In the regressions we use the natural logarithm of this variable.
Distance to closest city with a newspaper. To construct this variable, we first determine
which of the newspapers stored on the “British Newspaper Archive” was in print between
1800 and 1830. Next, we manually geo-code the city in which these newspapers were printed.
We then calculate the distance of the centroid of every parish in our map to each of the cities
that print at least one newspaper. Finally, we keep only the distance to the closest city. In the
regressions we use the natural logarithm of this variable.