radon and radon progeny measurements
TRANSCRIPT
trends in analytical chemistry, vol. 10, no. 8,199l
dimensions and time (position, speed, acceleration), and a priori knowledge. The appearance of highly parallel and neuronal computers’ with efficient specialised algorithms may create a new impulse for video image analysis.
References R. Beagle and T. Jackson, Neural Computing - An in- troduction, Adam Hilger, Bristol, 1990. J.J. Toumazet, Traitement de l’lmage sur Micro-ordinateur, Sybex, Paris, 1986. C.E. Hooper and R.E. Ansorge, Trends Anal. Chem., 8 (1990) 269. L. Munck, C. Feil, G. Gibons, Cereals for Food and Bever- age, Academic Press, London, 1980, p. 27. S.K. Taylor and W.F. McClure, in M. Iwamoto and S. Kawano (Editors), Proc. 2nd Int. Near Infrared Spec. Conf, Tsukuba, Japan, May 29-June 2, 1989. Korin Publishing, Tokyo, 1990, p. 393. R.C. Gonzalez and P. Wintz, Digital Image Processing, Addison-Wesley, Reading, MA, 1987. J. Serra (Editor) Image Analysis and Mathematical Morphol-
8
9
243
ogy, Academic Press, London, 1982. R.C. Gonzalez and P. Wintz, Digital Image Processing, Addison-Wesley, Reading, MA, 1987, p. 337. R.C. Gonzalez and P. Wintz, Digital Image Processing, Addison-Wesley, Reading, MA, 1987, p. 421.
10 E.H. Hall, Computer Image Processing and Recognition, Academic Press, London, 1979, p. 452.
11 D.H. Ballard and C.M. Brown, Computer Vision, Prentice- Hall, Englewoods Cliffs, NJ, 1982, p. 116.
12 E. Oran Brigham, The Fast Fourier Transform, Prentice- Hall, Englewoods Cliffs, NJ, 1974.
13 M.A. Sharaf, D.L. Illman, B.R. Kowalski, Chemometrics, Wiley-Interscience, New York, 1986.
14 J.M. Romeder, Methodes et Programme d’Analyse Dis- criminante, Dunod, Paris, 1973.
15 M.A. Sharaf, D.L. Illman and B.R. Kowalski, Chemomet- rics, Wiley-Interscience, New York, 1986, p. 234.
D. Bertrand, M.F. Devaux and P. Robert are researchers work- ing at the Food Center of ZNRA (National Institute of Agricul- tural Research), Rue de la Geraudiere, F44026 Nantes Cedex, France. Their main research is concerned with infrared spec- troscopy and image analysis applied to quality control of food.
trends
Radon and radon progeny measurements
Philip K. Hopke and Piotr Wasiolek Potsdam, NY, USA
Radon and its decay products are considered a potentially hazardous component of indoor air and thus the measure- ment of these airborne radionuclides is important in ac- curately assessing the threat that they might pose. There are a variety of methods available for the measurement of both radon gas and its decay products. In the case of the decay products, both the amount and aerodynamic be- havior of the radioactivity are important and need to be measured. These measurement methods are reviewed and the various options for each type of species are presented.
Introduction Radon is a naturally occurring, gaseous radioac-
tive element that is ubiquitous throughout the en- vironment and is found in higher concentrations in indoor atmospheres than in outdoor air. It decays to a series of 4 short-lived decay products that can be deposited in the human respiratory tract either directly or after attaching to preexisting ambient par-
0165-9936/91/$03.00,
titles. The decay of these radioactive progeny can in- duce lung cancers and may be responsible for be- tween 5 000 and 20 000 lung cancer deaths per year in the USA’. It is, therefore, important to be able to determine the concentrations of these radioactive species. Measurements can be made of both radon and/or decay products and methods for each of these measurements will be presented.
Radioactive properties of radon and its decay products
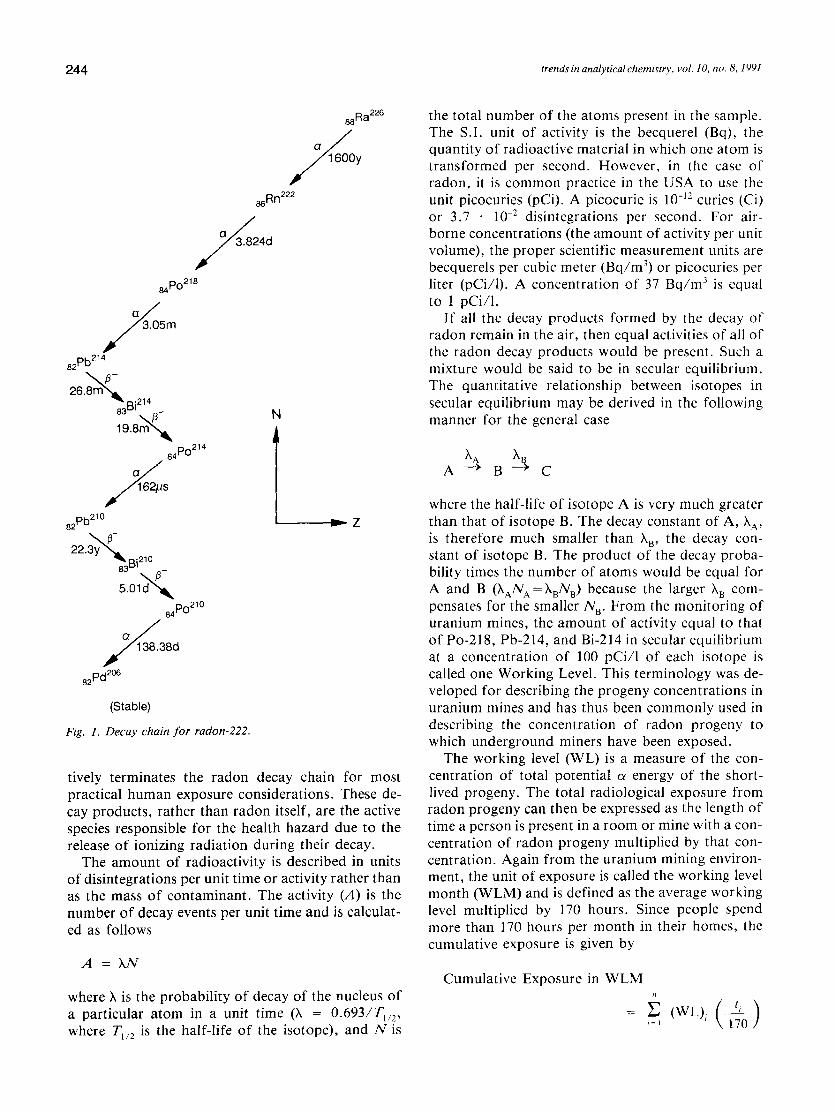
Radon-222, an inert gas, belongs to the uranium- 238 series of naturally occurring radionuclides that decay to stable lead-206 through 8 ar-ray and 6 P-ray transitions. The decay chain is from 226Ra to 206Pb (Fig. 1). The first four radon decay products, polonium-218 (RaA), lead-214 (RaB), bismuth-214 (RaC), and polonium-214 (RaC’), are referred to as the short-lived decay products of radon because each has a half-life of less than 30 minutes. Lead-210 is the effective end decay product of the radon series. With a half-life of 22.3 years, its low specific activity effec-
0 Elsevier Science Publishers B .V.
244
88Ra226
&n222
/ a 3.824d
J &$Po2’8
a
/
3.05m
82Pb2’4
s2Pd206
(Stable)
Fig. I. Decay chain for radon -222.
N
!. Z
tively terminates the radon decay chain for most practical human exposure considerations. These de- cay products, rather than radon itself, are the active species responsible for the health hazard due to the release of ionizing radiation during their decay.
The amount of radioactivity is described in units of disintegrations per unit time or activity rather than as the mass of contaminant. The activity (A) is the number of decay events per unit time and is calculat- ed as follows
A=W
where X is the probability of decay of the nucleus of a particular atom in a unit time (X = 0.693/T,,,, where T,i2 is the half-life of the isotope), and N is
trends in analyticalchemistry. vol. 10, no. 8, 1Wl
the total number of the atoms present in the sample. The S.I. unit of activity is the becquerel (Bq), the quantity of radioactive material in which one atom is transformed per second. However, in the case of radon, it is common practice in the USA to use the unit picocuries (pCi). A picocurie is IO-” curies (Ci) or 3.7 + 10-l disintegrations per second. For air- borne concentrations (the amount of activity per unit volume), the proper scientific measurement units are becquerels per cubic meter (Bq/m3) or picocuries per liter (pCi/l). A concentration of 37 Bq/m3 is equal to 1 pCi/l.
If all the decay products formed by the decay of radon remain in the air, then equal activities of all of the radon decay products would be present. Such a mixture would be said to be in secular equilibrium. The quantitative relationship between isotopes in secular equilibrium may be derived in the following manner for the general case
where the half-life of isotope A is very much greater than that of isotope B. The decay constant of A, X,, is therefore much smaller than X,, the decay con- stant of isotope B. The product of the decay proba- bility times the number of atoms would be equal for A and B (XAN,\=&,NtJ because the larger X, com- pensates for the smaller NB. From the monitoring of uranium mines, the amount of activity equal to that of PO-21 8, Pb-214, and Bi-214 in secular equilibrium at a concentration of 100 pCi/l of each isotope is called one Working Level. This terminology was de- veloped for describing the progeny concentrations in uranium mines and has thus been commonly used in describing the concentration of radon progeny to which underground miners have been exposed.
The working level (WL) is a measure of the con- centration of total potential cy energy of the short- lived progeny. The total radiological exposure from radon progeny can then be expressed as the length of time a person is present in a room or mine with a con- centration of radon progeny multiplied by that con- centration. Again from the uranium mining environ- ment, the unit of exposure is called the working level month (WLM) and is defined as the average working level multiplied by 170 hours. Since people spend more than 170 hours per month in their homes, the cumulative exposure is given by
Cumulative Exposure in WLM
= 6 (WL), &)
trends in analytical chembtry, vol. IO, no. 8, 1991 245
where (WL), is the average concentration of the radon progeny during the exposure interval i ex- pressed in WL and tj is the number of hours of ex- posure at the ith concentration. The cumulative ex- posure at a given decay product level could thus be more than 4 times that for an occupational exposure (8766 total hours in a year compared to 2000 working hours in a year).
Current scientific practice expresses the total ac- tivity of all of radon decay products as the Potential Alpha Energy Concentration (PAEC) in the air and is expressed als MeV/m3 or WL. A working level of 100 pCi/l in equilibrium deposits 1.3 . lo5 MeV/l.
PAEC (MeV/m3) = 3.69. 103A, +4.01* 104A, + 5.82 . 104A3
PAEC (WL) = 0.001031, + 0.005071, + 0.003731,
where A,, A, and A, in Bq/m3 and Ir, I2 and 1, in pCi/l are the activity concentrations of PO-218, Pb- 214, and Bi-214, respectively.
Because of the losses of decay products from the air by deposition on surfaces such as walls, ceilings, and furniture, the decay product activity is less than the radon activity. The term characterizing the air- borne concentration of potential CY energy concentra- tion as a fraction of the radon activity is the equilibri- um factor, F and is defined as the ratio of decay products to radon by
F = (lOO)WL/A, = O.l03a, + 0.507a, + 0.373a3
where a,, a2, and a3 are the relative activities of the three radon progeny relative to radon, A,, (i.e., a, = A&4,).
Traditionally, a distinction is made in the state of the airborne progeny based on their apparent attach- ment to aerosol particles. The “unattached” fraction (ultrafine mode, 0.5-5 nm) refers to those progeny existing as ions, molecules, or small clusters. The “attached” fraction (accumulation mode, 0.1-0.4 pm) is regarded as those radionuclides attached to ambient particles. The “unattached” fraction fp of the total potential cx energy of the radon progeny mixture is described as
fp = gGL eq
where Ceq = O.l03C, + 0.507C, + 0.373C3, Cj with j = 1, 2, 3 being the activity concentration of radon progeny. The superscript u stands for “unattached” fraction. Typically, most of the “unattached” activi- ty is PO-218. Measurements of the “unattached”
fraction in the domestic environment2s3 showed that fp is between 0.05 and 0.15 without any aerosol sources in the room (cigarette smoke, cooking, stove heating) and can decrease below 0.05 in the presence of aerosol sources.
Another phenomenon that affects the radon progeny is recoil. When the *18Po decays, it emits a 6.0 MeV CY particle. Because of conservation of ener- gy, the resulting *14Pb nucleus then recoils with over 100 keV of kinetic energy and may be lost from the surface on which it had been collected. The 2’4Pb may be lost from an airborne particle and become “unattached”4. In terms of measurements, because of the relative small range of the nucleus in air, it is not thought there will be much recoil loss of *14Pb during sampling. However, there could be significant loss during the spectrometric measurement of radon decay products in a vacuum5’6.
Short-term radon measurements
Scintillation cells Radon can be measured directly at environmental
levels by using the ability of the emitted Q particle to excite a ZnS (Ag) scintillator to produce measurable emitted light. Both hemispherical’ and simple right circular cylindrical8 detector cells with optically clear, flat windows, and interior walls coated with ZnS (Ag) have been used. For simple grab measure- ments, the cell is evacuated. A valve into the chamber is opened and the chamber is filled with ambient air. The cell is then placed on a photomultiplier tube and the count rate of light pulses is measured. With proper calibration, this count rate can be related to the ambient radon concentration. However, the con- centration of radon in a building is highly variable. Thus, single grab samples of radon rarely reflect the long-term average indoor concentration. Also, in most cases, the concentration of radon is low so that a long counting interval may be needed to obtain sufficient statistical precision in the total a count.
An alternative approach is an active system to pull air through the scintillation chamber using inlet and outlet connectors. The counts in a given time period (e.g,, 15 minutes) can then be converted to an ap- proximate radon concentration. Because of the ac- cumulation of decay products in the scintillation chamber, the actual radon concentration is related to the number of (Y particles counted through complex calculational methods. As in all active systems, pump failure is possible and there is a need for careful flow control. There are also problems in counting statis- tics at low radon concentrations so that relatively large scintillation chambers are needed for accurate ambient measurements. Scintillation counting is,
246 trends in analytical chemistry, vol. 10, no. &I991
therefore, not convenient for very long term monitoring.
Electrostatic collection of 218Po+ An alternative method for semi-continuous mea-
surements of radon is to collect the charged decay product, “‘PO+, on a scintillation or a solid-state CY detector and relate the number of decays of 218Po to the concentration of 222Rn in the air. It has been found that in almost 90% of the decays of 222Rn to 218Po the PO molecule is a singly charged, positive ion ai the end of the recoil path9-12. This high per- centage of charged PO molecules has led a number of investigations using the collection of the PO in an electrostatic field as a measure of the Rn content of the air13-24. In many of these reports, the effects of water vapor on the performance of the system have been noted16 where the amount of collected activity decreased with increasing relative humidity.
It has been proposed that water vapor causes neu- tralization of the polonium ion2’. The mechanism of this neutralization is via the formation of hydroxyl radicals (OH) by the radiolysis of water vapor2’j. The hydroxyl radical with an electron affinity of 1.83 eV captures free electrons, thus raising the local con- centration of small negative ions in the vicinity of the PO ion. The small ion recombination rate then rises substantially above that due to the background con- centration of small negative ions. Chu and Hopke2’ have recently measured the rate for this neutraliza- tion process, providing a quantitative relationship between the water vapor concentration and the aver- age lifetime of the PO ion.
There is another process that can also lead to ion neutralization: the transfer of an electron from a lower ionization molecule to the polonium oxide spe- cies formed by the reaction of the polonium ion with atmospheric oxygen28. The ionization potential (IP) for the polonium oxide species has been found to be 10.44 + 0.05 eV2’. Thus, a variety of common at- mospheric species including NO, NO,, NH, and many organic compounds will have an ionization potential low enough to serve as electron donors. The rate for this neutralization process has also been measured2’. For NO, (IP = 9.79 eV), approximately 90% of the collisions with a polonium oxide ion are able to effect a single electron transfer. Thus, other trace gases in the atmosphere in addition to water vapor will affect the lifetime of the polonium ion. Thus, in order to properly use electrostatic collection of polonium ions for quantitative Rn detection, care- ful precautions in terms of air purification or high enough collection fields are required. Hopke29 pro- vides quantitative guidance for the design of such systems.
Longer-term radon measurements
Activated carbon There are two methods available for obtaining an
integrated measure of the radon concentration. For short intervals (2 to 7 days), canisters containing acti- vated carbon can be set out in a room3’. The radon is adsorbed on the carbon and thus accumulates over time. After the sampling period is over, the canister is sealed and the decay products build up in the con- tainer. Since equal activities of the shorter lived de- cay products will develop after about 4 hours, a measurement of the emitted y radiations from the progeny can be used to determine the radon concen- trations. However, the carbon canisters are only use- ful for a limited period and water vapor adsorption can reduce the amount of adsorbed radon. Standard methods have been defined for the use of activated carbon canisters31 and these procedures have been adopted by the U.S. Environmental Protection Agency for use in general home monitoring32.
In order to reduce the effects of water vapor and to damp the effects of the variations in radon con- centrations on the observed activity, the open area of activated carbon can be covered with a semi- permeable membrane 33. Cohen and Nason34 deve- loped a diffusion barrier canister with an integration time constant of 84 hours and uses a 1 week (7 day) exposure. George and Weber3’ have extended the in- tegration time constant to 9-l 1 days using a sintered metal filter covering the sampling port in the lid of the charcoal canister. It appears that with proper care, charcoal canisters can provide adequate preci- sion, integrated measurements of radon concentra- tions for periods between 2 and 10 days. However, due to the seasonal variability of the indoor radon levels, these short-term measurements may not pro- vide an adequate estimate of the annual average ex- posure to 222Rn which people encounter in indoor air.
Solid-state nuclear track detectors A better long term, integrated measurement can be
made using a track etch detector. This type of meas- urement is generally considered to be the best esti- mate of the annual average exposure of individuals to radon. Etched track detectors are commonly used in national surveys to relate geology to potential radon exposure and epidemiological studies of radon and lung cancer in the general population. This type of measurements is also considered to be the most reliable way to verify the performance of any mitiga- tion measures applied in houses with elevated radon levels.
To perform such measurements two kinds of sim-
trends in analytical chemistry, vol. 10, no. 8,199l
ple passive radon monitors were developed: “bare” or “open” type and “closed” type. The “open” type monitor measures the total airborne CY activity by ex- posure of a bare piece of detecting material to the in- vestigated atmosphere. The “closed” type monitor is typically a small diffusion chamber with detecting material inside. Radon diffuses into the chamber through a filter which stops dust and airborne radon decay products. The signal is therefore directly proportional to the radon gas concentration.
As a detecting material, solid-state nuclear track detectors (SSNTD) have been used. There are basi- cally two kinds of materials sensitive to CY radiation: cellulose nitrate (CN)36 and diethylene glycol bis(ally1 carbonate) (PADC)37. Red dyed CN films, known as LR-115, are produced by Kodak-Path6 in France. The PADC plastic, known as CR-39, is made from a liquid monomer (ally1 diglycol carbonate) and produced by several companies, e.g., American Acrylics, Inc. USA and Pershore Mouldings Ltd., U.K. The track production mechanism in the SSNTD is based on the formation of narrow (3-10 nm) trails of damage by heavily ionizing particles (e.g., ct parti- cles). The damage in polymers consists of modifica- tion of the polymeric chain lengths and possible production of free radicals. Certain chemical rea- gents (“etchants”) dissolve or degrade these damaged regions at a much higher rate than the undamaged material. The etching process enlarges the track, un- til it is visible under an optical microscope, allowing detailed analysis of single tracks for determining the nature of incident particles or simply counting num- bers of tracks for dosimetric purposes.
The etching of most of the plastics is performed in an aqueous solution of NaOH or KOH (1-12 M) and at a temperature in the range 40-70°C. To produce larger tracks (for example, visible under a microfiche reader) electrochemical etching (ECE) is used. ECE consists of two steps: track formation by chemical etching and electrical breakdown at the track tip, caused by an electric field applied across the plastic during etching. As a result, tree-shaped damage at the track site is formed. The CY track counting tech- niques vary from very simple manual counting with a microfiche reader or optical microscope, to very sophisticated microscope-video camera-computer, fully automatic units. Estimated track density is proportional to the radon gas concentration.
Of the two CY sensitive SSNTDs, CR-39 is the one mostly used for radon measurements. The practically unlimited sensitivity for detection of Q! particles, linearity and the resistivity to environmental condi- tions favors CR-39 over LR-115 for most field studies. The most common configuration of the radon monitor is a small plastic cup with one or more
247
pieces of CR-39 inside. For such monitors, 3-month exposure in average radon concentration is con- sidered to be sufficient for measurements with an ac- curacy up to + 15%.
Electrets A recent development is the use of an electret for
passive radon measurements3*. The concept is simi- lar to the track-etch detector in that the detector is placed in a cup so that the radon can enter it. However, the measure of radon exposure is the decrease in surface electric charge on an electret made of Teflon FEP. Such a system has a much sim- pler readout device that only has to measure the residual surface charge on the electret, and may pro- vide a useful alternative measurement method for periods of several weeks to many months depending on the radon concentration. Their initial perfor- mance in intercomparison tests has been very en- couraging. However, there has not yet been extensive experience in the use of these detectors in large scale monitoring efforts and such experience will be need- ed before the full potential and/or problems with these units will be determined.
Radon decay products The measurement of the radon decay products is
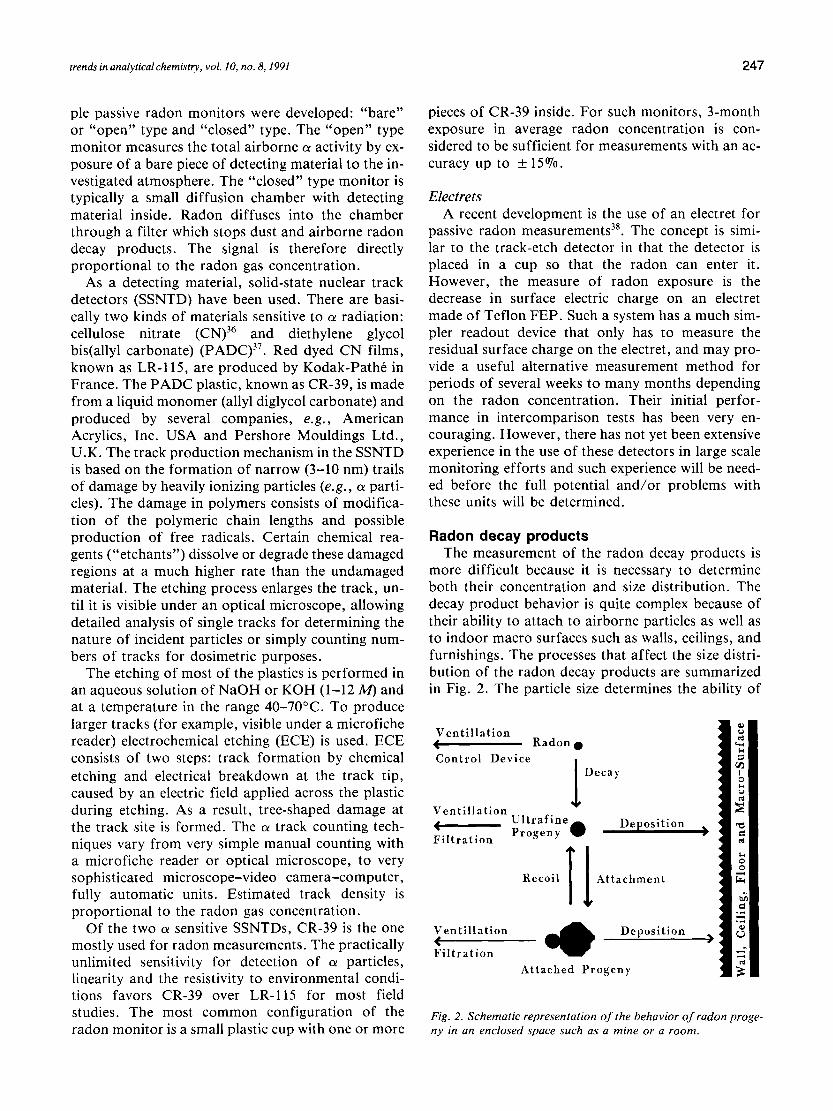
more difficult because it is necessary to determine both their concentration and size distribution. The decay product behavior is quite complex because of their ability to attach to airborne particles as well as to indoor macro surfaces such as walls, ceilings, and furnishings. The processes that affect the size distri- bution of the radon decay products are summarized in Fig. 2. The particle size determines the ability of
Ventillation +- Radon l
Control Device ,
1 Decay
Ventillation
- ;;;g;;e@ Deposition
Filtration
Recoil TI Attachment
Ventillation <
Deposition
Filtration
Attached Progeny
Fig. 2. Schematic representation of the behavior of radon proge- ny in an enclosed space such as a mine or a room.
248 trends in analytical chemistry, vol. 10, no. 8, I991
the radioactivity to be deposited both in the room and in the respiratory system. It is the respiratory deposition that provides the dose to the critical tis- sues. The sizes of most concern are those less than 10 nm. These highly diffusive particles can more easily deposit in the body whereas only about 20% of the particles with diameters around 100 nm are retained in the respiratory tract3’.
Conclusions
Potential (Y energy concentration (PAEC) Measurement of the total concentration of CY emit-
ting particulate matter is relatively easily determined. Air is drawn through a membrane filter and the col- lected CY activity can be measured using either a ZnS(AG) scintillator for total (Y counting or a solid- state detector that provides a-spectroscopic determi- nation of the specific decay products. From multiple sequential counts and the known decay kinetics of the radon progeny, the concentrations of each of the decay products (21*Po, 214Pb, 214Bi) can be calculat- ed. The proper choice of filter can provide both quantitative collection of activity and an adequate radioactive source for accurate measurement of the collected activity.
Radon concentrations are determined as a measure of exposure rather than decay product concentra- tions because integrated radon measurements are relatively simple, inexpensive, and accurate and dosi- metric models suggest that radon is a reasonable sur- rogate for the decay products. However, the availa- bility of methods to measure both decay product size and concentrations would permit direct long term measurement of the species that are the proximate cause of the health effects. The development of such methods should be encouraged.
References BEIR IV, Health Risks of Radon and Other Internally Deposited Alpha-Emitters, National Academy Press, Washington, DC, 1987, p. 602. A. Reineking and J. Porstenddrfer, Health Phys., 58 (1990) 715-727. H. Vanmarcke, A. Janssens, F. Raes, A. Poffijn, P. Berk- vens and R. Van Dingenen, in P.K. Hopke (Editor), Radon and its Decay Products, Occurrence, Properties and Health Effects (ACS Symposium Series, Vol. 331) ACS, Washington DC, 1987, p. 400. T. Mercer, Health Phys., 31 (1976) 173-175. N. Jonassen and J.P. McLauglin, J. Aerosol Sci., 7 (1976) 141-149.
Activity-weighted size distributions N. Jonassen and J.P. McLauglin, Health Phys., 30 (1976) 234-238.
Size measurement of the decay products is a more difficult problem. George4’ proposed a method for measuring the “unattached” fraction in which air is drawn through a filter that is covered with a 60-mesh screen. The highly diffusive activity attaches to the screen. The activity counted on the screen is the “un- attached” activity and that which passes through the screen to the filter is the “attached” activity. Activity size distributions have been measured with diffusion batteries down to sizes of 10 to 15 nm4’ because con- ventional diffusion batteries have relatively little resolving power for ultrafine particle sizes. Ramamurthi and Hopke4* have reviewed a number of measurement systems for “unattached fractions” in the context of the improved understanding of penetration of particles through a single screen.
H.F. Lucas, Rev. Sci. Instr., 28 (1957) 258-259.
A.C. George, in Proceedings of 9th Midyear Health Physics Symp., Denver, CO, 1976.
9 E.M. Wellish, Philos. Msg., 6 (xxvi) (1913) 623-635. 10 J. Porstendorfer and T.T. Mercer, Health Phys., 15 (1979)
191-199. 11 S.K. Dua, P. Kotrappa and P.C. Gupta, Health Phys., 45
(1983) 152-157. 12
13
14
15
It is now understood that the “unattached” activi- ty is not a single species with one fixed diffusion coefficient, but rather an ultrafine mode in the parti- cle size spectrum between 0.5 and 5 nm. Improve- ments in measurement methods43-45 have provided the ability to determine the full range of sizes for grab samples. Systems now exist that will provide a series of size and concentration measurements without operator intervention45,46. These units are still at the research use stage and need further testing and refinement before they become routine monitor- ing techniques.
16
17
18
K.D. Chu and P.K. Hopke, presented at the 1985 National APCA Meeting, Air Pollution Control Association (APCA), Pittsburgh, PA, 1985, Paper No. 85-85.5. E. Albrecht and A. Kaul, in Assessment of Airborne Radio- activity in Nuclear Operations, International Atomic Energy Agency, Vienna, 1967. M.E. Wrenn, H. Spitz and N. Cohen, Institute of Electrical and Electronics Engineers IEEE Trans. Nucl. Sci., NS-22 (1975) 645-648. H. Spitz and M.E. Wrenn, in A.J. Breslin (Editor), Radon Workshop-February 1977, Health and Safety Laboratory, New York; HASL-325; 1977, pp. 48-64. A.C. George, in A.J. Breslin (Editor), Radon Work- shop-February 1977, Health and Safety Laboratory, New York; HASL-325, 1977 pp. 25-30. R.I. Miller, Development of a rapid response radon monitor, Final Report to U.S. Bureau of Mines, Denver, CO, Contract No. H0262019, 1979. J. Porstendorfer, A. Wicke and A. Schraub, Nat. Radiati. Environ. III, 2 (1980) 1293-1307.
19 G. Keller, K.H. Folkerts and H. Muth, Radiat. Prot. Dosim., 3 (l/2) (1982) 83-89.
20 R.A. Washington and W.J. Courneya, Health Phys., 45 (1983) 559-561.
21 J.G. Ackers, Radiat. Prot. Dosim., 7 (l-4) (1984) 199-201. 22 H. Tovedal, Radiat. Prot. Dosim., 7 (l-4) (1984) 215-218.
trends in analytical chemistry, vol. 10, no. &I991 249
23
24
25
S. Watnick, N. Latner and R.T. Graveson, Health Phy.r., 50 (1986) 645-646. E.B. Pereira, A.W. Setzer and I.F.A. Cavalcanti, Radiat. Prot. Dosim., (1989) in press. G.J. Frey, P.K. Hopkeand J.J. Stukel, Science(Washington, D.C.), 211 (1981) 480-481.
26 S.D. Goldstein and P.K. Hopke, Environ. Sci. Technol., 19 40 (1985) 146-150. 41
27 K.D. Chu and P.K. Hopke, Environ. Sci. Technol., 22 (1988) 711-717.
28
29 30 31 32
33
A. Busigin, A.W. van der Vooren, J.C. Babcock, and C.R. Phillips, Health Phys., 40 (1981) 333-343. P.K. Hopke, Health Phys., 57 (1989) 39-42. R.J. Countess, Health Phys., 31 (1970) 455-456. A.C. George, Health Phys., 46 (1984) 867-872. D.J. Gray and S.T. Windham, U.S. Environmental Protec- tion Agency Report, Washington, DC, 1987, EPA 520/5-87-005. H.M. Prichard and K.A. Marien, Health Phys., 48 (1985) 797-803.
34 35 36
B.L. Cohen and R. Nason, Health Phys., 50 (1986) 457-463. A.C. George and T. Weber, Health Phys., 58 (1990) 583-589. M. Fantini and G. Renard, in P.H. Fowler and V.M. Clapham (Editors), Solid State Nuclear Truck Detectors, Per- gamon Press, Oxford, 1982, p. 193.
31 B.C. Cartwright, E.K. Shirk and P.B. Price, Nucl. Instrum.
38
39
42
43
44
45
46
Meth., 153 (1978) 457. P. Kotrappa, J.C. Dempsey, J.R. Hickey, and L.R. Steiff, Health Phys., 54 (1988) 47-56. A.C. James, Lung Dosimetry, in W.W. Nazaroff and .4.V. Nero, Jr. (Editors), Wiley, New York, 1988, Radon and its Decay Products in Indoor Air, pp. 259-309. A.C. George, Health Phys., 23 (1972) 390-392. E.O. Knutson, in W.W. Nazaroff and A.V. Nero, Jr. (Edi- tors), Radon and its Decay Products in Indoor Air, Wiley, New York, 1988, pp. 161-202. M. Ramamurthi and P.K. Hopke, Health Phys., 56 (1989) 189-194. R.F. Holub and E.O. Knutson, in P.K. Hopke (Editor), Radon and Its Decay Products: Occurrence, Properties, and Health Effects, (ACS Symposium Series, Vol. 331), Ameri- can Chemical Society, Washington, DC, 1987, pp. 340-356. A. Reineking and J. PorstendBrfer, J. Aerosol Sci., 17 (1986) 873-879. M. Ramamurthi and P.K. Hopke, Aerosol Sci. Technol., 14 (1991) 82-92. J. Strong, J. Aerosol Sci., 19 (1988) 1327-1330.
Professor P.K. Hopke and Dr. P. Wasiolek are at the Depart- ment of Chemistry, Clarkson University, Potsdam, NY 13699. 5810, USA.
Confocal Raman microspectroscopy in biology: applications and future developments
G.J. Puppels, C. Otto and J. Greve Enschede, Netherlands
Recent progress and future developments of Raman microspectroscopy are discussed. Its great potential for cell biological investigations is illustrated with some exam- ples.
Introduction Raman spectroscopy is an important technique in
molecular biology’. It provides information about vibrational energy levels of the molecules present in a sample. A non-linear molecule of N atoms possess- es 3N degrees of freedom and therefore, subtracting 3 translations and 3 rotations, 3N-6 independent vibrational modes. Selection rules determine whether or not a vibration will be “Raman-active”. Biological macromolecules such as nucleic acids and proteins give rise to Raman spectra that contain a large num- ber of (often overlapping) lines. The position, inten- sity, polarization and width of these lines can be used to study molecular composition and conformation
0165.9936/91/$03.00. (Q Elsevier Science Publishers B .V
and interactions between molecules. From spectra of DNA-protein complexes the fol-
lowing information can be derived: DNA secondary structure2; DNA-base composition3 (see also Fig. 3B); DNA-protonation”; protein secondary structure’; presence and micro-environment of aromatic ami- no acids6; presence of S-S bridges’; DNA-protein ratios; and DNA-protein interactions’.
Raman microspectroscopy Laser light can be tightly focused into a diffraction
limited spot by means of a microscope objective. In the first half of the 1970’s it was realized that this feature could be exploited to study micro-samples and that it was possible to couple spatial and spec- troscopical information’O~‘l. Early applications in- cluded the identification of inclusions of small for- eign bodies in tissue and environmental particulate