quarterly report 2019 mr. saeed anwar member dr. muhammad amjad saqib member mr. muhammad abdullah...
TRANSCRIPT

QUARTERLY REPORT2019
JANUARY - SEPTEMBER(Un-audited)
BOPThird Quarterly Report January - September 2019 1
Corporate Information 2
Directors’ Review 3
Unconsolidated Condensed Interim Financial Statements of The Bank of Punjab 7
Consolidated Condensed Interim Financial Statements of The Bank of Punjab and its subsidiaries 45
CONTENTS
BOP Third Quarterly Report January - September 20192
Corporate Information
Board of DirectorsMr. Khalid S. Tirmizey Acting President / CEOMr. Mohammad Jehanzeb Khan DirectorMr. Muhammad Abdullah Khan Sumbal DirectorKhawaja Farooq Saeed DirectorMr. Saeed Anwar DirectorDr. Muhammad Amjad Saqib DirectorMr. Raza Saeed Secretary to the Board
Central Audit Committee (CAC) Khawaja Farooq Saeed ChairmanMr. Saeed Anwar Member
Board Risk Management Committee (BRMC)Mr. Mohammad Jehanzeb Khan ChairmanMr. Saeed Anwar MemberDr. Muhammad Amjad Saqib MemberMr. Muhammad Abdullah Khan Sumbal Member
Human Resource & Remuneration Committee (HR&RC)Khawaja Farooq Saeed ChairmanMr. Mohammad Jehanzeb Khan MemberDr. Muhammad Amjad Saqib Member
Research Development & Islamic Banking Committee Dr. Muhammad Amjad Saqib ChairmanKhawaja Farooq Saeed MemberMr. Khalid S. Tirmizey Member
Auditors EY Ford Rhodes, Chartered Accountants
Registered OfficeBOP Tower, 10-B, Block-E-II, Main Boulevard, Gulberg-III, Lahore. Telephones: +92 42 35783700–10 Fax No. +92 42 35783975 UAN: 111 200 100
RegistrarM/s. Corplink (Pvt) Limited Wings Arcade, 1-K, Commercial, Model Town, Lahore. Telephones: +92 42 35916714, 35916719, 35839182Fax No. +92 42 35869037
Website www.bop.com.pk

BOPThird Quarterly Report January - September 2019 3
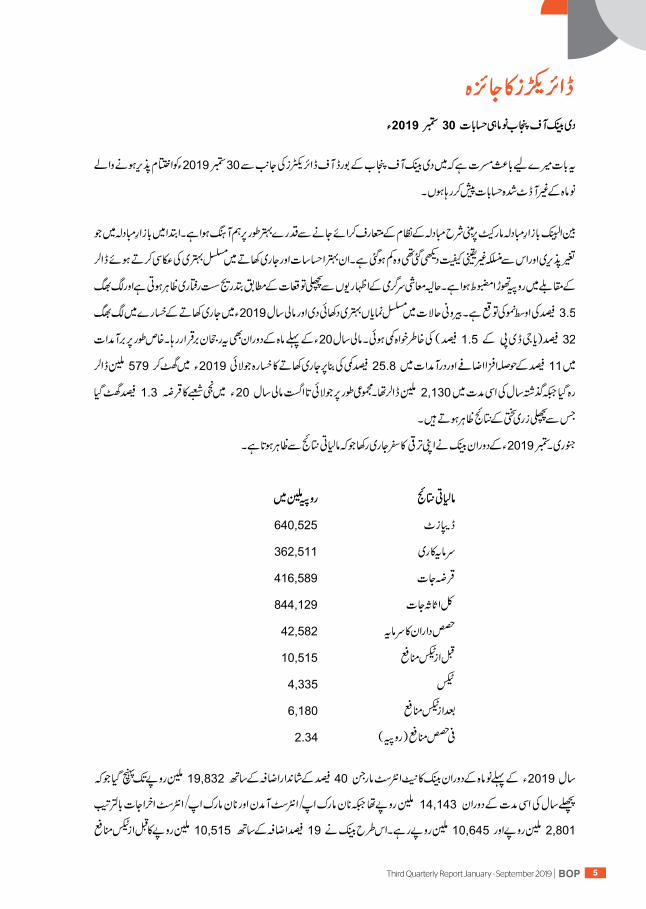
Directors’ Review
Quarterly Financial Statements – September 30, 2019
On behalf of the Board of Directors, I am pleased to present Un-audited condensed Interim Financial Statements of The Bank of Punjab for the nine months period ended September 30, 2019.
The interbank foreign exchange market has adjusted relatively well to the introduction of the market-based exchange rate system. The initial volatility and associated uncertainty in the exchange market has subsided. Reflecting these improved sentiments and continued adjustment in the current account, the rupee has strengthened modestly against the US dollar. Recent economic activity indicators show a gradual slowdown, in line with earlier expectations, and it is expected that average growth in FY20 would remain around 3.5 percent.
The external sector continues to show significant improvement with a sizeable reduction of around 32 percent (or 1.5 percent of GDP) in the current account deficit during FY19. The trend has continued in the first month of FY20 as well. Specifically, driven by an encouraging 11 percent growth in exports and a contraction of 25.8 percent in imports, the current account deficit declined to US$ 579 million in July 2019 compared to US$ 2,130 million in the same period last year. On a cumulative basis, private sector credit (PSC) contracted by 1.3 percent in Jul-Aug FY20 showing the results of previous monetary tightening. During the period Jan-Sep 2019, the Bank has maintained its growth trajectory which is reflected in below financial results: Financial Highlights: Rs. in Million
Deposits 640,525Investments-net 362,511Advances 416,589Total Assets 844,129Shareholders’ Equity 42,582Profit before taxation 10,515Taxation 4,335Profit after taxation 6,180Earnings per share (Rupees) 2.34 During first nine months of year 2019, Bank’s Net Interest Margin significantly improved to Rs. 19,832 million as against Rs. 14,143 million for the corresponding period last year, thereby registering a rise of 40%. Non Mark-up/Interest Income and Non Mark-up/Interest Expenses remained at Rs. 2,801 million and Rs. 10,645 million, respectively. Accordingly, the Bank was able to post highest ever pre-tax profit of Rs. 10,515 million as against Rs. 8,851 million for corresponding period last year thereby registering a rise of 19%. The Earnings per Share improved to Rs. 2.34 as against Rs. 2.06 for corresponding period last year.
As on September 30, 2019, the Deposits stood at Rs. 640.5 billion, while Total Assets touched the new height of Rs. 844.1 billion. Investments-net and Gross Advances were recorded at Rs. 362.5 billion and Rs. 416.6 billion, respectively. The Tier-I Equity remained at Rs. 38.7 billion as on September 30, 2019.
As on September 30, 2019, the Bank stands compliant with the Capital Adequacy Ratio (CAR) requirement prescribed by SBP. The CAR improved to 14.66% as against 13.17% as on December 31, 2018.

BOP Third Quarterly Report January - September 20194
The Bank has been assigned long term entity rating of “AA” by M/s PACRA with short term rating being at the highest rank of “A1+”. As at close of 3rd quarter, Bank’s Branch network increased to 611 branches, including 90 Taqwa Islamic Banking Branches, spanned across the country against 545 Branches on corresponding quarter of last year. Further, Bank also has a network of 546 ATMs providing 24/7 banking services to the customers.
I extend my gratitude to our valued customers and shareholders for their relentless support and assure that the Bank would continue its efforts for achievement of strategic business targets. I also wish to thank the Government of the Punjab and State Bank of Pakistan for continues support and guidance. I also highly appreciate the Bank’s management and all staff members for their contribution towards the progress of the Bank.
For and on behalf of the Board
Chairman
BOPThird Quarterly Report January - September 2019 5

BOP Third Quarterly Report January - September 20196
BOPThird Quarterly Report January - September 2019 7
Unconsolidated Condensed InterimFinancial Informationfor the period ended September 30, 2019
BOP Third Quarterly Report January - September 20198
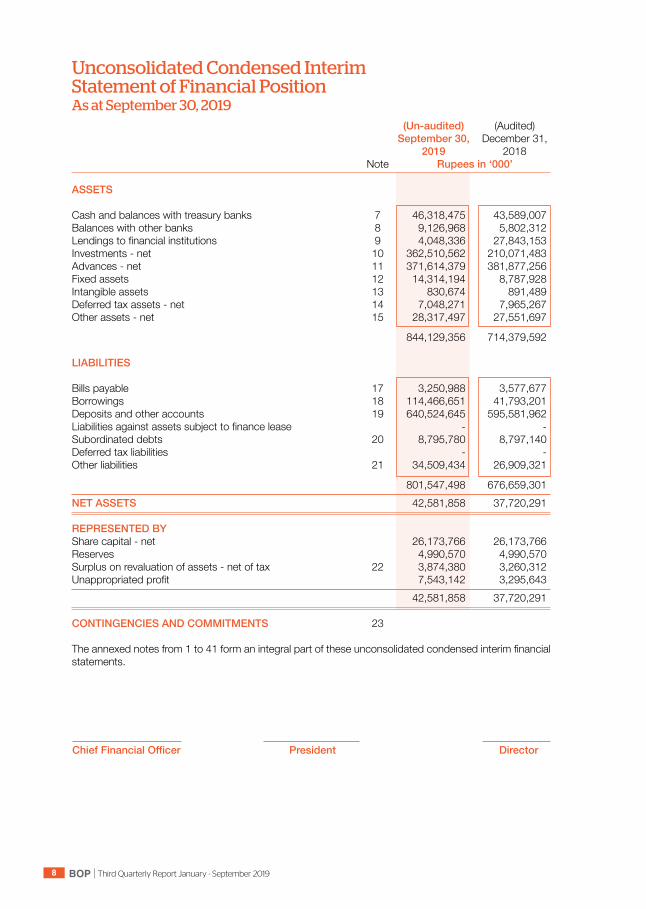
Unconsolidated Condensed Interim Statement of Financial Position As at September 30, 2019 (Un-audited) (Audited) September 30, December 31, 2019 2018 Note Rupees in ‘000’
ASSETS Cash and balances with treasury banks 7 46,318,475 43,589,007 Balances with other banks 8 9,126,968 5,802,312 Lendings to financial institutions 9 4,048,336 27,843,153 Investments - net 10 362,510,562 210,071,483 Advances - net 11 371,614,379 381,877,256 Fixed assets 12 14,314,194 8,787,928 Intangible assets 13 830,674 891,489 Deferred tax assets - net 14 7,048,271 7,965,267 Other assets - net 15 28,317,497 27,551,697
844,129,356 714,379,592 LIABILITIES Bills payable 17 3,250,988 3,577,677 Borrowings 18 114,466,651 41,793,201 Deposits and other accounts 19 640,524,645 595,581,962 Liabilities against assets subject to finance lease - - Subordinated debts 20 8,795,780 8,797,140 Deferred tax liabilities - - Other liabilities 21 34,509,434 26,909,321
801,547,498 676,659,301 NET ASSETS 42,581,858 37,720,291 REPRESENTED BY Share capital - net 26,173,766 26,173,766 Reserves 4,990,570 4,990,570 Surplus on revaluation of assets - net of tax 22 3,874,380 3,260,312 Unappropriated profit 7,543,142 3,295,643 42,581,858 37,720,291 CONTINGENCIES AND COMMITMENTS 23 The annexed notes from 1 to 41 form an integral part of these unconsolidated condensed interim financial statements.
ChiefFinancialOfficer President Director
BOPThird Quarterly Report January - September 2019 9
ChiefFinancialOfficer President Director
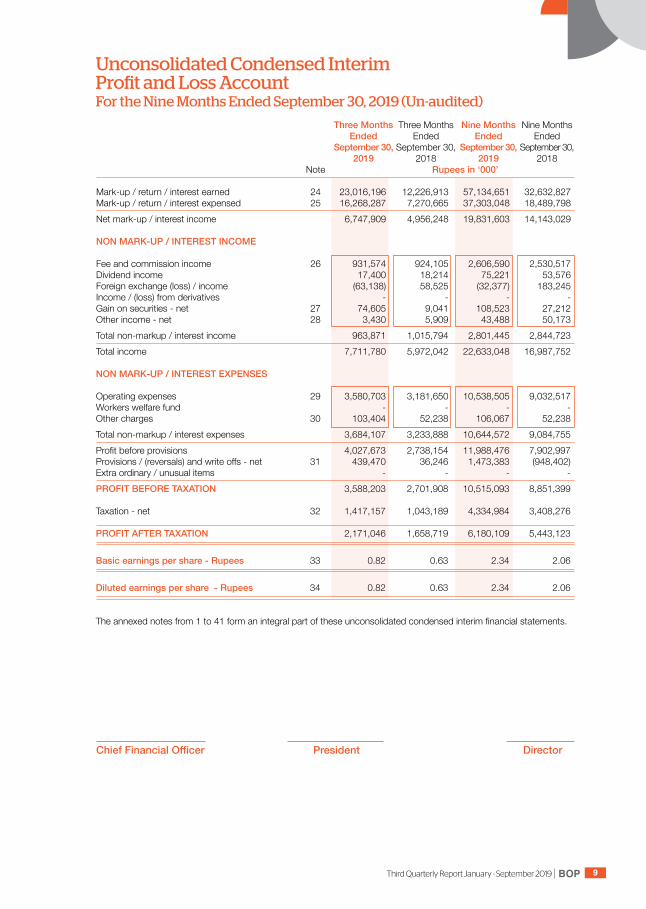
Unconsolidated Condensed Interim Profit and Loss Account For the Nine Months Ended September 30, 2019 (Un-audited)
Three Months Three Months Nine Months Nine Months Ended Ended Ended Ended September 30, September 30, September 30, September 30, 2019 2018 2019 2018 Note Rupees in ‘000’ Mark-up / return / interest earned 24 23,016,196 12,226,913 57,134,651 32,632,827 Mark-up / return / interest expensed 25 16,268,287 7,270,665 37,303,048 18,489,798 Net mark-up / interest income 6,747,909 4,956,248 19,831,603 14,143,029 NON MARK-UP / INTEREST INCOME Fee and commission income 26 931,574 924,105 2,606,590 2,530,517 Dividend income 17,400 18,214 75,221 53,576 Foreign exchange (loss) / income (63,138) 58,525 (32,377) 183,245 Income / (loss) from derivatives - - - - Gain on securities - net 27 74,605 9,041 108,523 27,212 Other income - net 28 3,430 5,909 43,488 50,173 Total non-markup / interest income 963,871 1,015,794 2,801,445 2,844,723 Total income 7,711,780 5,972,042 22,633,048 16,987,752 NON MARK-UP / INTEREST EXPENSES Operating expenses 29 3,580,703 3,181,650 10,538,505 9,032,517 Workers welfare fund - - - - Other charges 30 103,404 52,238 106,067 52,238 Total non-markup / interest expenses 3,684,107 3,233,888 10,644,572 9,084,755 Profit before provisions 4,027,673 2,738,154 11,988,476 7,902,997 Provisions / (reversals) and write offs - net 31 439,470 36,246 1,473,383 (948,402)Extra ordinary / unusual items - - - - PROFIT BEFORE TAXATION 3,588,203 2,701,908 10,515,093 8,851,399 Taxation - net 32 1,417,157 1,043,189 4,334,984 3,408,276 PROFIT AFTER TAXATION 2,171,046 1,658,719 6,180,109 5,443,123 Basic earnings per share - Rupees 33 0.82 0.63 2.34 2.06 Diluted earnings per share - Rupees 34 0.82 0.63 2.34 2.06
The annexed notes from 1 to 41 form an integral part of these unconsolidated condensed interim financial statements.
BOP Third Quarterly Report January - September 201910
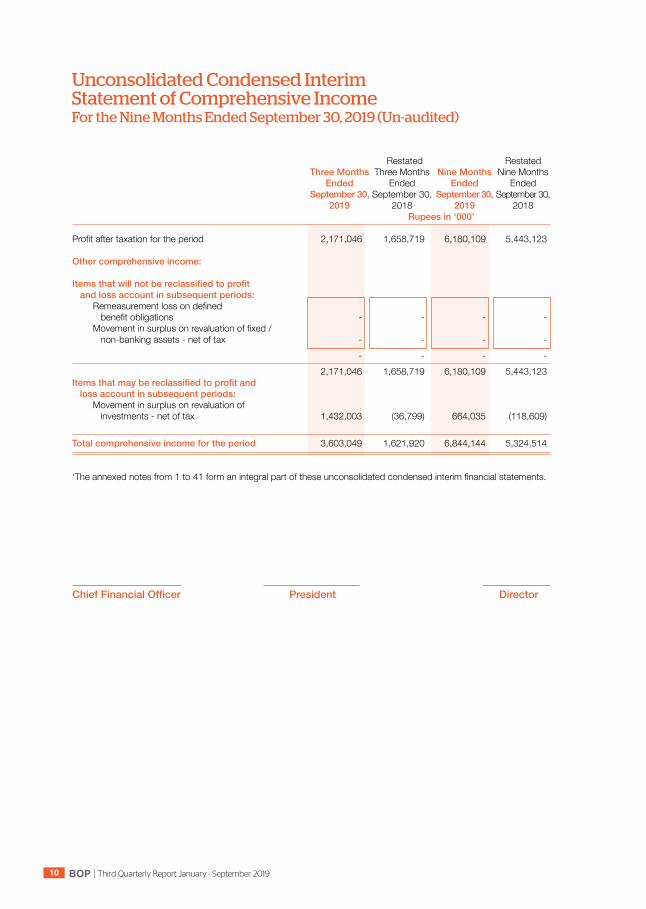
Unconsolidated Condensed Interim Statement of Comprehensive Income For the Nine Months Ended September 30, 2019 (Un-audited)
Restated Restated Three Months Three Months Nine Months Nine Months Ended Ended Ended Ended September 30, September 30, September 30, September 30, 2019 2018 2019 2018 Rupees in ‘000’ Profit after taxation for the period 2,171,046 1,658,719 6,180,109 5,443,123 Other comprehensive income: Itemsthatwillnotbereclassifiedtoprofit and loss account in subsequent periods: Remeasurement loss on defined benefit obligations - - - - Movement in surplus on revaluation of fixed / non-banking assets - net of tax - - - - - - - - 2,171,046 1,658,719 6,180,109 5,443,123 Itemsthatmaybereclassifiedtoprofitand loss account in subsequent periods: Movement in surplus on revaluation of investments - net of tax 1,432,003 (36,799) 664,035 (118,609) Total comprehensive income for the period 3,603,049 1,621,920 6,844,144 5,324,514 ‘The annexed notes from 1 to 41 form an integral part of these unconsolidated condensed interim financial statements.
ChiefFinancialOfficer President Director
BOPThird Quarterly Report January - September 2019 11
Su
rplus/(Deficit)-neto
ftax
on
reva
luat
ion
of
Share
Discounto
nSh
are
Share
Statutory
Investments
Fixed/n
on
Unapp
ropriated
Total
capital
issueof
capital
prem
ium
reserve
banking
profit/
shar
es
- net
asse
ts
(acc
umul
ated
loss
)
R
u p
e e
s
i n
‘
000’
Ba
lanc
e as
on
Janu
ary
01, 2
018
- as
rest
ated
2
6,43
6,92
4
(263
,158
) 2
6,17
3,76
6
2,2
15,0
40
1,2
62,7
91
(53,
499)
2
,940
,101
(2
,806
,439
) 2
9,73
1,76
0
Profi
t afte
r tax
atio
n fo
r the
nin
e m
onth
s en
ded
Sept
embe
r 30,
201
8 -
-
-
-
-
-
-
5
,443
,123
5
,443
,123
O
ther
com
preh
ensiv
e lo
ss
-
-
-
-
-
(118
,609
) -
-
(1
18,6
09)
Tota
l com
preh
ensiv
e in
com
e fo
r the
nin
e m
onth
s en
ded
Sept
embe
r 30,
201
8 -
-
-
-
-
(1
18,6
09)
-
5,4
43,1
23
5,3
24,5
14
Tran
sfer
from
sur
plus
on
reva
luat
ion
of fi
xed
asse
ts to
una
ppro
priat
ed p
rofit
/
(acc
umul
ated
loss
) - n
et o
f tax
-
-
-
-
-
-
(3
4,73
0)
34,
730
-
Tr
ansf
er fr
om s
urpl
us o
n re
valu
atio
n of
non
ban
king
asse
ts to
una
ppro
priat
ed p
rofit
/
(acc
umul
ated
loss
) - n
et o
f tax
-
-
-
-
-
-
(3
,078
) 3
,078
-
Tr
ansf
er fr
om s
urpl
us o
n re
valu
atio
n of
fixe
d as
sets
to u
napp
ropr
iated
pro
fit /
(a
ccum
ulat
ed lo
ss) o
n di
spos
al -
-
-
-
-
-
(7
7,59
4)
119
,375
4
1,78
1 Tr
ansf
er fr
om s
urpl
us o
n re
valu
atio
n of
non
ban
king
asse
ts to
una
ppro
priat
ed p
rofit
/
(acc
umul
ated
loss
) on
disp
osal
-
-
-
-
-
-
(3,9
78)
4,3
57
379
Bala
nce
as o
n Se
ptem
ber 3
0, 2
018
- as
rest
ated
2
6,43
6,92
4
(263
,158
) 2
6,17
3,76
6
2,2
15,0
40
1,2
62,7
91
(172
,108
) 2
,820
,721
2
,798
,224
3
5,09
8,43
4
Profi
t afte
r tax
atio
n fo
r the
thre
e m
onth
s en
ded
Dece
mbe
r 31,
201
8 -
-
-
-
-
-
-
2
,120
,570
2
,120
,570
O
ther
com
preh
ensiv
e in
com
e / (
loss
) -
-
-
-
-
1
60,7
39
509
,790
(1
72,7
31)
497
,798
Tota
l com
preh
ensiv
e in
com
e fo
r the
thre
e m
onth
s en
ded
Dece
mbe
r 31,
201
8 -
-
-
-
-
1
60,7
39
509
,790
1
,947
,839
2
,618
,368
Tr
ansf
er to
sta
tuto
ry re
serv
e -
-
-
-
1
,512
,739
-
-
(1
,512
,739
) -
Tr
ansf
er fr
om s
urpl
us o
n re
valu
atio
n of
fixe
d as
sets
to u
napp
ropr
iated
pro
fit /
(a
ccum
ulat
ed lo
ss) -
net
of t
ax
-
-
-
-
-
-
(10,
922)
1
0,92
2
-
Tran
sfer
from
sur
plus
on
reva
luat
ion
of n
on b
ankin
g as
sets
to u
napp
ropr
iated
pro
fit /
(a
ccum
ulat
ed lo
ss) -
net
of t
ax
-
-
-
-
-
-
(362
) 3
62
-
Tran
sfer
from
sur
plus
on
reva
luat
ion
of n
on b
ankin
g as
sets
to u
napp
ropr
iated
pro
fit /
(a
ccum
ulat
ed lo
ss) o
n di
spos
al -
-
-
-
-
-
(4
7,54
6)
51,
035
3
,489
Bala
nce
as o
n D
ecem
ber 3
1, 2
018
26,
436,
924
(2
63,1
58)
26,
173,
766
2
,215
,040
2
,775
,530
(1
1,36
9)
3,2
71,6
81
3,2
95,6
43
37,
720,
291
Profi
t afte
r tax
atio
n fo
r the
nin
e m
onth
s en
ded
Sept
embe
r 30,
201
9 -
-
-
-
-
-
-
6
,180
,109
6
,180
,109
O
ther
com
preh
ensiv
e In
com
e -
-
-
-
-
6
64,0
35
-
-
664
,035
Tota
l com
preh
ensiv
e in
com
e fo
r the
nin
e m
onth
s en
ded
Sept
embe
r 30,
201
9 -
-
-
-
-
6
64,0
35
-
6,1
80,1
09
6,8
44,1
44
Tran
sfer
from
sur
plus
on
reva
luat
ion
of fi
xed
asse
ts to
una
ppro
priat
ed p
rofit
/
(acc
umul
ated
loss
) - n
et o
f tax
-
-
-
-
-
-
(3
2,27
9)
32,
279
-
Tr
ansf
er fr
om s
urpl
us o
n re
valu
atio
n of
non
ban
king
asse
ts to
una
ppro
priat
ed p
rofit
/
(acc
umul
ated
loss
) - n
et o
f tax
-
-
-
-
-
-
(1
2,79
7)
12,
797
-
Tr
ansf
er fr
om s
urpl
us o
n re
valu
atio
n of
non
ban
king
asse
ts to
una
ppro
priat
ed p
rofit
/
(acc
umul
ated
loss
) on
disp
osal
-
-
-
-
-
-
(4,8
91)
5,0
83
192
Tr
ansa
ctio
ns w
ith o
wne
rs re
cogn
ized
dire
ctly
in e
quity
:
Fi
nal c
ash
divid
end
- Dec
embe
r 31,
201
8 de
clare
d su
bseq
uent
to y
ear e
nd a
t 7.5
% p
er s
hare
-
-
-
-
-
-
-
(1
,982
,769
) (1
,982
,769
)
-
-
-
-
-
-
-
(1
,982
,769
) (1
,982
,769
)
-
Bala
nce
as o
n Se
ptem
ber 3
0, 2
019
26,
436,
924
(2
63,1
58)
26,
173,
766
2
,215
,040
2
,775
,530
6
52,6
66
3,2
21,7
14
7,5
43,1
42
42,
581,
858
The
anne
xed
note
s fro
m 1
to 4
1 fo
rm a
n in
tegr
al pa
rt of
thes
e un
cons
olid
ated
con
dens
ed in
terim
fina
ncial
sta
tem
ents
.
Un
con
solid
ated
Co
nd
ense
d In
teri
m S
tate
men
t of C
han
ges
in E
quit
y
For t
he
Nin
e M
on
ths
En
ded
Sep
tem
ber 3
0, 2
019
(Un
-au
dite
d)
ChiefFinancialOfficer
President
Director

BOP Third Quarterly Report January - September 201912
Unconsolidated Condensed Interim Cash Flow StatementFor the Nine Months Ended September 30, 2019 (Un-audited)
Nine Months Ended September 30, September 30, 2019 2018 Note Rupees in ‘000’
CASH FLOWS FROM OPERATING ACTIVITIES Profit before taxation 10,515,093 8,851,399 Less: Dividend income (75,221) (53,576) 10,439,872 8,797,823 Adjustments: Depreciation on fixed assets 29 778,258 675,352 Depreciation on non banking assets acquired in satisfaction of claims 29 55,546 52,173 Depreciation on ijarah assets under IFAS - 2 29 194,849 276,258 Depreciation on right of use assets 29 607,092 - Amortization on intangible assets 29 128,190 36,136 Amortization of (discount) / premium on debt securities - net (1,345,623) 413,742 Mark-up on lease liability against right of use assets 25 544,920 - Unrealized gain / (loss) on revaluation of investments classified as held for trading 27 (25,466) 4,005 Provision / (reversal) and writeoffs - net 31 1,473,383 (948,402) (Gain) / loss on sale of fixed assets - net 28 (34,180) 419 Gain on sale of non banking assets - net (67) (36,335) Gain on securities - net 27 (83,057) (31,217) Provision for employees compensated absences 7,843 7,397 Provision for gratuity 86,094 80,707
2,387,782 530,235 12,827,654 9,328,058 (Increase) / Decrease in operating assets: Lendings to financial institutions 23,794,817 13,057,527 Held for trading securities 17,985,265 4,341,813 Advances - net 8,971,273 (75,398,911) Others assets - net (1,887,767) (1,270,801)
48,863,588 (59,270,372)Increase / (Decrease) in operating liabilities: Bills Payable (326,689) (217,956) Borrowings from financial institutions 72,883,918 (9,518,969) Deposits 44,942,683 12,061,749 Other liabilities 671,573 1,300,173
118,171,485 3,624,997 Income tax paid (2,889,535) (2,491,654)Netcashflowfrom/(usedin)operatingactivities 176,973,192 (48,808,971)
BOPThird Quarterly Report January - September 2019 13
Nine Months Ended September 30, September 30, 2019 2018 Rupees in ‘000’
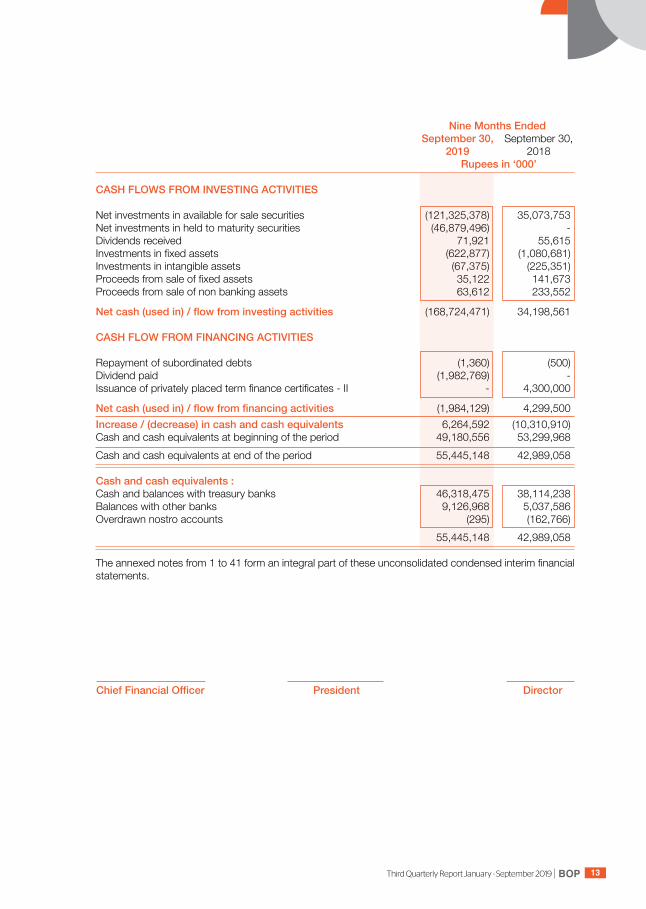
CASH FLOWS FROM INVESTING ACTIVITIES Net investments in available for sale securities (121,325,378) 35,073,753 Net investments in held to maturity securities (46,879,496) - Dividends received 71,921 55,615 Investments in fixed assets (622,877) (1,080,681)Investments in intangible assets (67,375) (225,351)Proceeds from sale of fixed assets 35,122 141,673 Proceeds from sale of non banking assets 63,612 233,552
Netcash(usedin)/flowfrominvestingactivities (168,724,471) 34,198,561 CASH FLOW FROM FINANCING ACTIVITIES Repayment of subordinated debts (1,360) (500)Dividend paid (1,982,769) - Issuance of privately placed term finance certificates - II - 4,300,000
Netcash(usedin)/flowfromfinancingactivities (1,984,129) 4,299,500 Increase / (decrease) in cash and cash equivalents 6,264,592 (10,310,910)Cash and cash equivalents at beginning of the period 49,180,556 53,299,968 Cash and cash equivalents at end of the period 55,445,148 42,989,058 Cash and cash equivalents : Cash and balances with treasury banks 46,318,475 38,114,238 Balances with other banks 9,126,968 5,037,586 Overdrawn nostro accounts (295) (162,766) 55,445,148 42,989,058 The annexed notes from 1 to 41 form an integral part of these unconsolidated condensed interim financial statements.
ChiefFinancialOfficer President Director
BOP Third Quarterly Report January - September 201914
1. STATUS AND NATURE OF BUSINESS
The Bank of Punjab (the Bank) was constituted in Pakistan pursuant to The Bank of Punjab Act, 1989. It was given the status of a scheduled bank by the State Bank of Pakistan (SBP) on September 19, 1994. It is principally engaged in commercial banking and related services with its registered office at BOP Tower, 10-B, Block E-II, Main Boulevard, Gulberg III, Lahore. The Bank has 611 branches including 14 sub branches and 90 Islamic banking branches (December 31, 2018: 576 branches including 13 sub branches and 72 Islamic banking branches) in Pakistan and Azad Jammu and Kashmir at the period end. The Bank is listed on Pakistan Stock Exchange. The majority shares of the Bank are held by Government of the Punjab (GoPb).
2 BASIS OF PRESENTATION In accordance with the directives of the Government of Pakistan regarding the conversion of
the Banking system to Islamic modes, the SBP has issued various circulars from time to time. Permissible forms of trade-related modes of financing include purchase of goods by the Banks from their customers and immediate resale to them at appropriate marked-up price on deferred payment basis. The purchases and sales arising under these arrangements are not reflected in these unconsolidated condensed interim financial statements as such but are restricted to the amount of facility actually utilized and the appropriate portion of mark-up thereon.
These unconsolidated condensed interim financial statements are separate financial statements
of the Bank in which the investment in subsidiaries is stated at cost less impairment losses (if any) and has not been accounted for on the basis of reported results and net assets of the investee. Consolidated condensed interim financial statements of the Group are being issued separately.
The financial results of Islamic Banking business have been consolidated in these unconsolidated
condensed interim financial statements for reporting purposes, after eliminating inter-branch transactions / balances. Key financial figures of the Islamic Banking business are disclosed in note 39 of these unconsolidated condensed interim financial statements.
2.1 Statement of compliance 2.1.1 These unconsolidated condensed interim financial statements have been prepared in accordance
with the accounting and reporting standards as applicable in Pakistan. The accounting and reporting standards comprise of:
- Directives issued by the SBP and the Securities Exchange Commission of Pakistan (SECP). - Requirements of The Bank of Punjab Act, 1989; - Provisions of and directives issued under the Banking Companies Ordinance, 1962 and the
Companies Act, 2017; - International Financial Reporting Standards (IFRS) issued by the International Accounting Standard
Board as are notified under the Companies Act, 2017; and - Islamic Financial Accounting Standards (IFAS) issued by the Institute of Chartered Accountants
of Pakistan as are notified under the Companies Act, 2017. Wherever the requirements of the directives issued by the SBP and Securities and Exchange
Commission of Pakistan (SECP), The Bank of Punjab Act, 1989, the Banking Companies Ordinance, 1962 and the Companies Act, 2017 differ with the requirements of these IFRS or IFAS, the requirements of the said directives, The Bank of Punjab Act, 1989, the Banking Companies Ordinance, 1962 and the Companies Act, 2017 take precedence.
Notes to the Unconsolidated Condensed Interim Financial Statements For the Nine Months Ended September 30, 2019 (Un-audited)
BOPThird Quarterly Report January - September 2019 15
2.1.2 The disclosures made in these unconsolidated condensed interim financial statements have been limited based on SBP BPRD Circular Letter No. 05 of 2019 and IAS 34 “”Interim Financial Reporting””. Accordingly, these unconsolidated condensed interim financial statements do not include all the information and disclosures required for annual unconsolidated financial statements and should be read in conjunction with the unconsolidated financial statements of the Bank for the year ended December 31, 2018.
SBP through its BPRD Circular No. 5 dated March 22, 2019 has amended the format of quarterly
and half yearly financial statements of banks. All banks are directed to prepare their quarterly financial statements on the revised format effective from accounting year starting from January 1, 2019. Accordingly, the Bank has prepared these unconsolidated condensed interim financial statements on the new format prescribed by the SBP.
2.1.3 SBP as per BSD Circular No. 10, dated August 26, 2002 has deferred the applicability of
International Accounting Standard (IAS) 39, “Financial Instruments: Recognition and Measurement” and International Accounting Standard (IAS) 40, “Investment Property” for banking companies till further instructions. Further, according to the notification of SECP dated April 28, 2008, the IFRS – 7 “Financial Instruments: Disclosures” has not been made applicable for banks. Accordingly, the requirements of these standards have not been considered in the preparation of these unconsolidated condensed interim financial statements.
2.1.4 The State Bank of Pakistan through BPRD Circular No. 04 of 2015 dated February 25, 2015 has
deferred applicability of Islamic Financial Accounting Standard - 3 for Profit & Loss Sharing on Deposits (IFAS 3) issued by the Institute of Chartered Accountants of Pakistan and notified by the SECP, vide their SRO No. 571 of 2013 dated June 12, 2013 for Institutions offering Islamic Financial Services (IIFS). The standard will result in certain new disclosures in these unconsolidated condensed interim financial statements of the Bank.
2.1.5 Newaccountingstandards/amendmentsandIFRSinterpretationsthatareeffectiveforthe
current period: During the period, certain amendments to standards, interpretations and improvements to accounting
standards became effective, however the amendments, interpretations and improvements are considered not to be relevant or do not have any significant effect on the Bank’s operations and therefore not detailed in these unconsolidated condensed interim financial statements.
During the period, IFRS 16 - Leases, became effective from January 01, 2019, the impact of
adoption of this standard is disclosed in note 4.1 to these unconsolidated condensed interim financial statements.
2.1.6 NewaccountingstandardsandIFRSinterpretationsthatarenotyeteffective: The following standards, amendments and interpretations are only effective for accounting periods,
beginning on or after the date mentioned against each of them. The Bank considers that the following standards and interpretations are either not relevant or will not have any material impact on its financial statements in the period of initial application other than IFRS 9.
The SECP, through SRO 229(I)/2019 dated February 14, 2019, has notified that IFRS 9, Financial
Instruments, is applicable for accounting periods ending on or after June 30, 2019. The Bank considers that as the Prudential Regulations and other SBP directives currently provide the accounting framework for the measurement and valuation of investments and provision against non performing loans and advances, the implementation of IFRS 9 may require changes in the regulatory regime and the SBP would issue necessary guidance in this regard. The Bank is in the process of assessing the full impact of this standard. Accordingly, based on the guidance lastly received from the SBP, the requirements of IFRS 9 have not been considered in preparation of these unconsolidated condensed interim financial statements.
StandardorInterpretations Effectivedate(accountingperiods beginning on or after) IFRS 3 Amendments to IFRS 3 (Definition of a Business) January 01, 2020 IAS 1 & 8 Amendments to IAS 1 and IAS 8 (Definition of Material) January 01, 2020
StandardorInterpretations Effectivedate(accountingperiods ending on or after)
IFRS 9 Financial Instrument : Classification and Measurement June 30, 2019
BOP Third Quarterly Report January - September 201916
3. BASIS OF MEASUREMENT 3.1 These unconsolidated condensed interim financial statements have been prepared under the
historical cost convention, except for revaluation of freehold land and buildings on freehold land, revaluation of non banking assets acquired in satisfaction of claims, valuation of certain investments and commitments in respect of forward exchange contracts at fair value, right of use assets, lease liability and certain staff retirement benefits at present value.
3.2 These unconsolidated condensed interim financial statements are presented in Pak Rupees, which
is the Bank’s functional and presentation currency. 4. SUMMARY OF SIGNIFICANT ACCOUNTING POLICIES The accounting policies adopted in the preparation of these unconsolidated condensed interim
financial statements are consistent with those applied in the preparation of the annual unconsolidated financial statements of the Bank for the year ended December 31, 2018, except for the following :
4.1 Impact of IFRS 16 - Leases During the period, IFRS 16 - Leases became applicable to the Banks. IFRS 16 replaces IAS 17-
Leases, existing interpretations and guidance on accounting for leases. IFRS 16 introduces an on-balance sheet lease accounting model for leases entered by the lessee. A lessee recognizes a right of use assets representing its right of using the underlying assets and a corresponding lease liability representing its obligations to make lease payments. Lessor accounting remains similar to the current standard i.e. lessors continue to classify leases as either finance or operating leases.
The Bank has adopted IFRS 16 from January 1, 2019 thereby recognizing right of use assets and
lease liability , in respect of leased properties, there-against on January 01, 2019 using modified retrospective restatement approach, as permitted under the specific transitional provisions in the standard, and has not restated comparatives for the corresponding reporting period of 2018. Previously, these leases were accounted for as operating leases.
As at January 01, 2019, these liabilities were initially measured at the present value of the remaining
lease payments discounted using Bank’s incremental weighted average borrowing rate of 14.33% per annum. The lease liability is subsequently measured at amortized cost using the effective interest rate method. The associated right of use assets were measured at the amount equal to the lease liability, adjusted by the amount of prepaid lease payments recognized in the unconsolidated financial statements of financial position immediately before the date of initial application.
The right of use assets recognized subsequent to the adoption are measured based on the initial
amount of the lease liability adjusted for any lease payments made at or before the commencement date, plus any initial direct costs incurred. The right of use assets are depreciated over the lease term using a straight line basis as it closely reflects the expected pattern of consumption of future economic benefits. The right of use assets are reduced by impairment losses, if any, and adjusted for certain re-measurements of lease liability.
BOPThird Quarterly Report January - September 2019 17
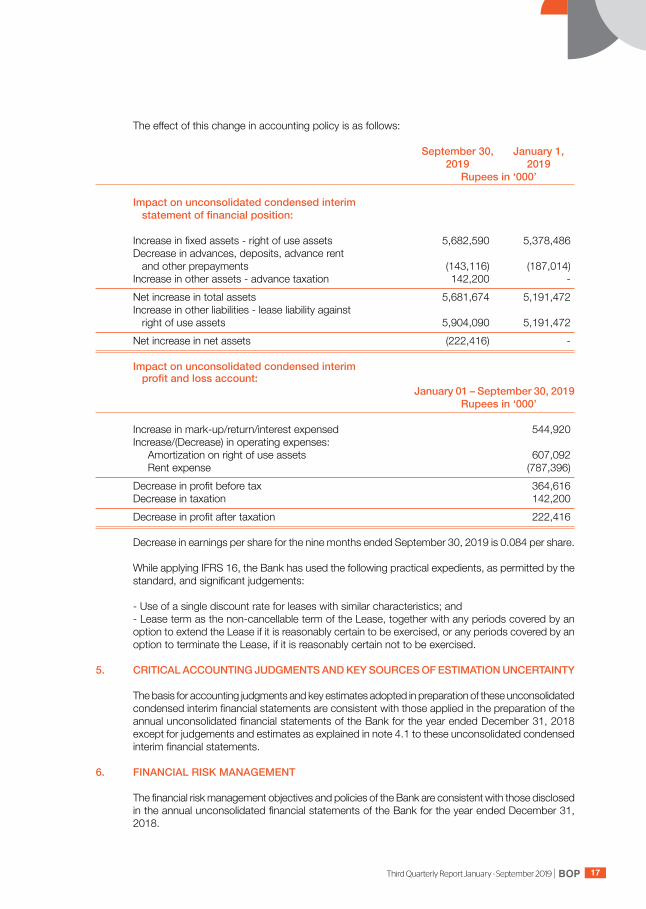
The effect of this change in accounting policy is as follows:
September 30, January 1, 2019 2019 Rupees in ‘000’ Impact on unconsolidated condensed interim statementoffinancialposition: Increase in fixed assets - right of use assets 5,682,590 5,378,486 Decrease in advances, deposits, advance rent and other prepayments (143,116) (187,014) Increase in other assets - advance taxation 142,200 - Net increase in total assets 5,681,674 5,191,472 Increase in other liabilities - lease liability against right of use assets 5,904,090 5,191,472 Net increase in net assets (222,416) - Impact on unconsolidated condensed interim profitandlossaccount: January 01 – September 30, 2019 Rupees in ‘000’
Increase in mark-up/return/interest expensed 544,920 Increase/(Decrease) in operating expenses: Amortization on right of use assets 607,092 Rent expense (787,396) Decrease in profit before tax 364,616 Decrease in taxation 142,200 Decrease in profit after taxation 222,416
Decrease in earnings per share for the nine months ended September 30, 2019 is 0.084 per share. While applying IFRS 16, the Bank has used the following practical expedients, as permitted by the
standard, and significant judgements: - Use of a single discount rate for leases with similar characteristics; and - Lease term as the non-cancellable term of the Lease, together with any periods covered by an
option to extend the Lease if it is reasonably certain to be exercised, or any periods covered by an option to terminate the Lease, if it is reasonably certain not to be exercised.
5. CRITICAL ACCOUNTING JUDGMENTS AND KEY SOURCES OF ESTIMATION UNCERTAINTY The basis for accounting judgments and key estimates adopted in preparation of these unconsolidated
condensed interim financial statements are consistent with those applied in the preparation of the annual unconsolidated financial statements of the Bank for the year ended December 31, 2018 except for judgements and estimates as explained in note 4.1 to these unconsolidated condensed interim financial statements.
6. FINANCIAL RISK MANAGEMENT The financial risk management objectives and policies of the Bank are consistent with those disclosed
in the annual unconsolidated financial statements of the Bank for the year ended December 31, 2018.
BOP Third Quarterly Report January - September 201918
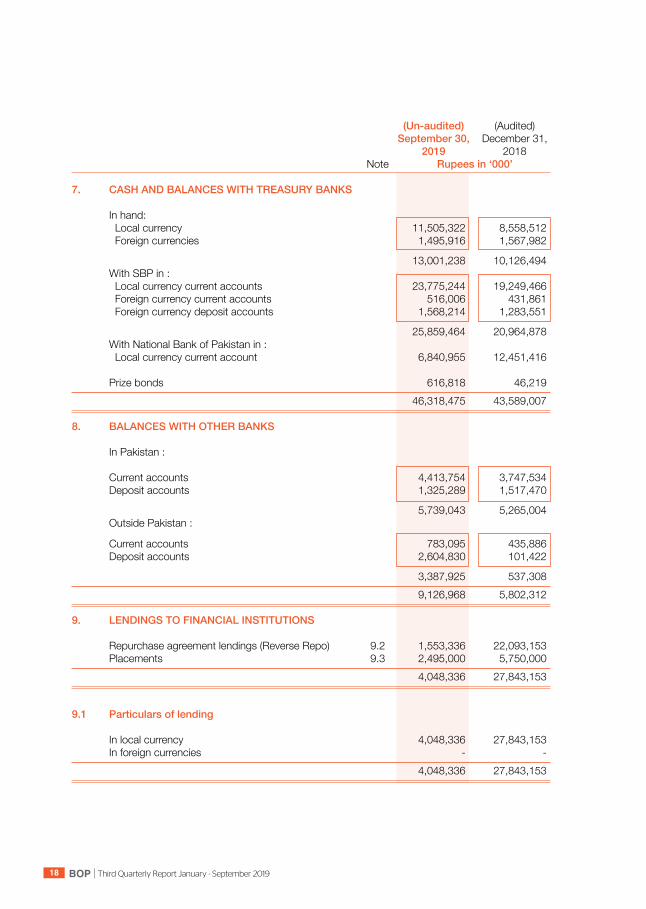
(Un-audited) (Audited) September 30, December 31, 2019 2018 Note Rupees in ‘000’ 7. CASH AND BALANCES WITH TREASURY BANKS In hand: Local currency 11,505,322 8,558,512 Foreign currencies 1,495,916 1,567,982
13,001,238 10,126,494 With SBP in : Local currency current accounts 23,775,244 19,249,466 Foreign currency current accounts 516,006 431,861 Foreign currency deposit accounts 1,568,214 1,283,551
25,859,464 20,964,878 With National Bank of Pakistan in : Local currency current account 6,840,955 12,451,416 Prize bonds 616,818 46,219 46,318,475 43,589,007 8. BALANCES WITH OTHER BANKS In Pakistan : Current accounts 4,413,754 3,747,534 Deposit accounts 1,325,289 1,517,470
5,739,043 5,265,004 Outside Pakistan : Current accounts 783,095 435,886 Deposit accounts 2,604,830 101,422
3,387,925 537,308 9,126,968 5,802,312 9. LENDINGS TO FINANCIAL INSTITUTIONS Repurchase agreement lendings (Reverse Repo) 9.2 1,553,336 22,093,153 Placements 9.3 2,495,000 5,750,000 4,048,336 27,843,153 9.1 Particulars of lending In local currency 4,048,336 27,843,153 In foreign currencies - - 4,048,336 27,843,153

BOPThird Quarterly Report January - September 2019 19
9.2 Securitiesheldascollateralagainstlendingstofinancialinstitutions
(Un-audited) (Audited) September 30, 2019 December 31, 2018 Held by Further Held by Further bank given as Total bank given as Total collateral collateral R u p e e s i n ‘ 0 0 0 ’ Market treasury bills 995,088 - 995,088 - - - Pakistan investment bonds 558,248 - 558,248 22,093,153 - 22,093,153 1,553,336 - 1,553,336 22,093,153 - 22,093,153 Market value of securities held as collateral as at September 30, 2019 amounted to Rs. 1,551,639
thousand (December 31, 2018: Rs. 21,350,630 thousand). These carry mark-up at rate ranging from 13.50% to 13.75% per annum (December 31, 2018: 10.00% to 10.50% per annum) with maturities upto November 22, 2019.
9.3 These carry profit rates ranging from 12.54% to 13.75% per annum (December 31, 2018: 9.00%
to 9.80% per annum) with maturities upto November 25, 2019.
10. INVESTMENTS - NET
10.1 Investments by type: (Un-audited) (Audited) September 30, 2019 December 31, 2018
Cost / Provision Surplus / Carrying Cost / Provision Surplus / Carrying Amortized for (Deficit) value Amortized for (Deficit) value cost diminution cost diminution
Note R u p e e s i n ‘ 0 0 0 ’Held-for-trading securities Federal government securities 10.1.1 7,093,556 - 26,044 7,119,600 25,075,868 - (1,892) 25,073,976 Ordinary shares 14,561 - (578) 13,983 12,630 - (1,849) 10,781
7,108,117 - 25,466 7,133,583 25,088,498 - (3,741) 25,084,757 Available-for-sale securities Federal government securities 10.1.1 & 10.2 297,778,844 - 1,112,416 298,891,260 177,736,092 - (44,199) 177,691,893 Shares and certificates 2,802,632 (1,199,909) (110,030) 1,492,693 2,122,045 (1,024,880) 24,614 1,121,779 Non government debt securities 9,954,737 (2,297,964) 1,716 7,658,489 8,119,488 (2,236,623) 2,094 5,884,959 Foreign securities 4,019 - - 4,019 4,019 - - 4,019
310,540,232 (3,497,873) 1,004,102 308,046,461 187,981,644 (3,261,503) (17,491) 184,702,650 Held-to-maturity securities Federal government securities 10.1.1 & 10.4 47,298,469 - - 47,298,469 250,329 - - 250,329 WAPDA bonds 400 (400) - - 400 (400) - -
47,298,869 (400) - 47,298,469 250,729 (400) - 250,329 Subsidiaries 164,945 (132,896) - 32,049 164,945 (131,198) - 33,747 Total investments 365,112,163 (3,631,169) 1,029,568 362,510,562 213,485,816 (3,393,101) (21,232) 210,071,483
10.1.1 Market treasury bills and Pakistan investment bonds are eligible for re-discounting with SBP. 10.1.2 Certain approved / Government securities are kept with the SBP to meet statutory liquidity
requirements calculated on the basis of domestic demand and time liabilities.

BOP Third Quarterly Report January - September 201920
(Un-audited) (Audited) September 30, December 31, 2019 2018 Rupees in ‘000’ 10.2 Investments given as collateral Pakistan investment bonds 19,583,293 - Market treasury bills 72,421,129 19,829,188 92,004,422 19,829,188
10.3 Provision for diminution in value of investments 10.3.1 Opening balance 3,393,101 3,145,347 Charge / reversals : Charge for the period / year 257,768 247,754 Reversals for the period / year (1,498) -
256,270 247,754 Reversal on disposal during the period / year (18,202) - Closing balance 3,631,169 3,393,101
10.3.2 Particulars of provision against debt securities Categoryofclassification (Un-audited) (Audited) September 30, 2019 December 31, 2018 NPI Provision NPI Provision Rupees in ‘000’ Domestic Other assets especially mentioned - - - - Substandard 308,606 62,839 - - Doubtful - - - - Loss 2,235,525 2,235,525 2,237,023 2,237,023 Total 2,544,131 2,298,364 2,237,023 2,237,023 10.4 Market value of held to maturity investments amounted to Rs. 48,594,718 thousand (December 31,
2018: Rs. 248,902 thousand).
11. ADVANCES - NET
Performing Non Performing Total
(Un-audited) (Audited) (Un-audited) (Audited) (Un-audited) (Audited) September 30, December 31, September 30, December 31, September 30, December 31, 2019 2018 2019 2018 2019 2018
Rupees in ‘000’ Loans, cash credits, running finances, etc. 315,461,454 324,864,552 50,361,180 49,076,188 365,822,634 373,940,740 Net book value of assets in ijarah under IFAS 2 - In Pakistan 1,575,358 337,920 216,404 215,000 1,791,762 552,920 Islamic financing and related assets 24,322,065 19,584,952 1,650,521 76,882 25,972,586 19,661,834 Bills discounted and purchased 22,984,826 31,583,488 16,992 16,992 23,001,818 31,600,480
Advances - gross 364,343,703 376,370,912 52,245,097 49,385,062 416,588,800 425,755,974 Provision against advances: - Specific - - (44,580,494) (43,530,419) (44,580,494) (43,530,419) - General (393,927) (348,299) - - (393,927) (348,299)
(393,927) (348,299) (44,580,494) (43,530,419) (44,974,421) (43,878,718)
Advances - net of provision 363,949,776 376,022,613 7,664,603 5,854,643 371,614,379 381,877,256
BOPThird Quarterly Report January - September 2019 21
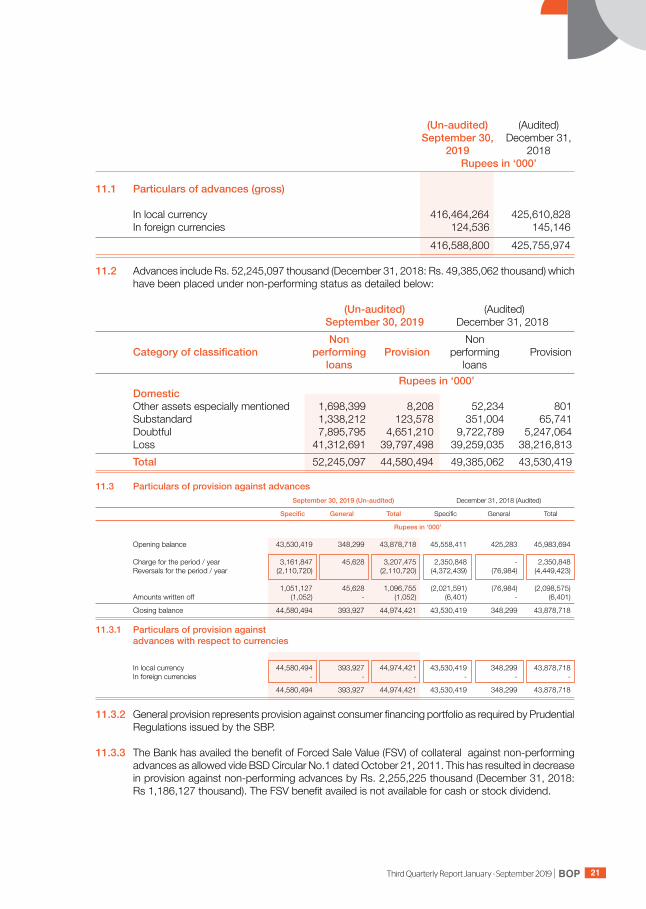
(Un-audited) (Audited) September 30, December 31, 2019 2018 Rupees in ‘000’ 11.1 Particulars of advances (gross) In local currency 416,464,264 425,610,828 In foreign currencies 124,536 145,146 416,588,800 425,755,974
11.2 Advances include Rs. 52,245,097 thousand (December 31, 2018: Rs. 49,385,062 thousand) which have been placed under non-performing status as detailed below:
(Un-audited) (Audited) September 30, 2019 December 31, 2018 Non Non Categoryofclassification performing Provision performing Provision loans loans Rupees in ‘000’ Domestic Other assets especially mentioned 1,698,399 8,208 52,234 801 Substandard 1,338,212 123,578 351,004 65,741 Doubtful 7,895,795 4,651,210 9,722,789 5,247,064 Loss 41,312,691 39,797,498 39,259,035 38,216,813 Total 52,245,097 44,580,494 49,385,062 43,530,419
11.3 Particulars of provision against advances September 30, 2019 (Un-audited) December 31, 2018 (Audited)
Specific General Total Specific General Total
Rupees in ‘000’ Opening balance 43,530,419 348,299 43,878,718 45,558,411 425,283 45,983,694
Charge for the period / year 3,161,847 45,628 3,207,475 2,350,848 - 2,350,848 Reversals for the period / year (2,110,720) (2,110,720) (4,372,439) (76,984) (4,449,423)
1,051,127 45,628 1,096,755 (2,021,591) (76,984) (2,098,575) Amounts written off (1,052) - (1,052) (6,401) - (6,401)
Closing balance 44,580,494 393,927 44,974,421 43,530,419 348,299 43,878,718
11.3.1 Particulars of provision against advances with respect to currencies
In local currency 44,580,494 393,927 44,974,421 43,530,419 348,299 43,878,718 In foreign currencies - - - - - -
44,580,494 393,927 44,974,421 43,530,419 348,299 43,878,718
11.3.2 General provision represents provision against consumer financing portfolio as required by Prudential Regulations issued by the SBP.
11.3.3 The Bank has availed the benefit of Forced Sale Value (FSV) of collateral against non-performing
advances as allowed vide BSD Circular No.1 dated October 21, 2011. This has resulted in decrease in provision against non-performing advances by Rs. 2,255,225 thousand (December 31, 2018: Rs 1,186,127 thousand). The FSV benefit availed is not available for cash or stock dividend.

BOP Third Quarterly Report January - September 201922
(Un-audited) (Audited) September 30, December 31, 2019 2018 Note Rupees in ‘000’ 12. FIXED ASSETS Capital work-in-progress 12.1 148,632 231,947 Right of use assets 4.1 5,682,590 - Property and equipment 8,482,972 8,555,981 14,314,194 8,787,928
12.1 Capital work-in-progress Civil works 148,632 201,487 Equipment - 30,460 148,632 231,947
(Un-audited) (Un-audited) September 30, September 30, 2019 2018 Rupees in ‘000’
12.2 Additionstofixedassets The following additions / (transfers) have been made to fixed assets during the period: Capital work-in-progress (83,315) 411,902 Right of use assets 6,289,682 - Property and equipment : Freehold land - 63,033 Building on freehold land 99,693 512,736 Furniture and fixture 50,360 51,964 Office equipment 202,722 255,359 Computer equipment 77,027 206,427 Lease hold improvements 242,731 69,244 Vehicles 33,659 5,523
706,192 1,164,286 6,912,559 1,576,188 12.3 Disposal of property and equipment: The net book value of property and equipment disposed off during the period is as follows: Building on freehold land - 140,471 Furniture and fixture 352 603 Office equipment 590 542 Computer equipment - 476 Vehicles - - 942 142,092 Gross carrying amount of vehicles disposed off during the period was Rs. 43,307 thousand
(September 30, 2018: Nil).

BOPThird Quarterly Report January - September 2019 23
(Un-audited) (Audited) September 30, December 31, 2019 2018 Rupees in ‘000’
13. INTANGIBLE ASSETS Intangible in progress 167,338 129,279 Softwares 663,336 762,210 830,674 891,489
(Un-audited) (Un-audited) September 30, September 30, 2019 2018 Rupees in ‘000’
13.1 Additions to intangible assets The following additions have been made to intangible assets during the period: Intangible in progress 38,059 110,910 Intangible assets purchased 29,316 114,441 67,375 225,351
(Un-audited) (Audited) September 30, December 31, 2019 2018 Rupees in ‘000’
14. DEFERRED TAX ASSETS - NET Deductible temporary differences on: Deficit on revaluation of investments - 6,122 Provision against advances, off balance sheet etc. 8,310,283 8,926,570
8,310,283 8,932,692 Taxable temporary differences on: Surplus on revaluation of fixed assets (446,112) (463,493) Accelerated tax depreciation (287,696) (320,081) Surplus on revaluation of investments (351,436) - Surplus on revaluation of non banking assets (176,768) (183,851)
(1,262,012) (967,425) 7,048,271 7,965,267

BOP Third Quarterly Report January - September 201924
(Un-audited) (Audited) September 30, December 31, 2019 2018 Note Rupees in ‘000’
15. OTHER ASSETS - NET Income / mark-up accrued in local currency 14,172,061 8,629,336 Income / mark-up accrued in foreign currency 1,970 1,961 Profit paid in advance on pehlay munafa scheme 2,467 8,027 Advances, deposits, advance rent and other prepayments 608,782 881,805 Advance taxation (payments less provisions) 2,744,420 3,630,240 Non-banking assets acquired in satisfaction of claims 7,373,484 7,467,804 Acceptances 1,646,827 4,888,386 Branch adjustment account 82,428 180,704 Mark to market gain on forward foreign exchange contracts - 146,431 Stock of stationery 214,072 108,048 Suspense account 7,540 5,044 Zakat recoverable from NITL 36,790 36,790 Unrealized gain on revaluation of foreign bills and trade loans 20,178 78,013 Fraud and forgeries 174,674 121,806 Unearned income on sale of sukuk on bai-muajjal basis 780,296 1,044,888 Others 1,104,104 829,881 28,970,093 28,059,164 Less: Provision held against other assets 15.1 (2,172,638) (2,052,280) Other assets (net of provision) 26,797,455 26,006,884 Surplus on revaluation of non-banking assets acquired in satisfaction of claims 1,520,042 1,544,813 Other assets - total 28,317,497 27,551,697
15.1 Provision held against other assets Advances, deposits, advance rent & other prepayments 35,723 35,723 Non banking assets acquired in satisfaction of claims 1,596,665 1,575,670 Zakat recoverable from NITL 36,790 36,790 Fraud and forgeries 167,867 101,364 Others 335,593 302,733 2,172,638 2,052,280
16. CONTINGENT ASSETS Contingent assets Nil Nil
17. BILLS PAYABLE In Pakistan 3,250,988 3,577,677 Outside Pakistan - - 3,250,988 3,577,677
BOPThird Quarterly Report January - September 2019 25
(Un-audited) (Audited) September 30, December 31, 2019 2018 Rupees in ‘000’
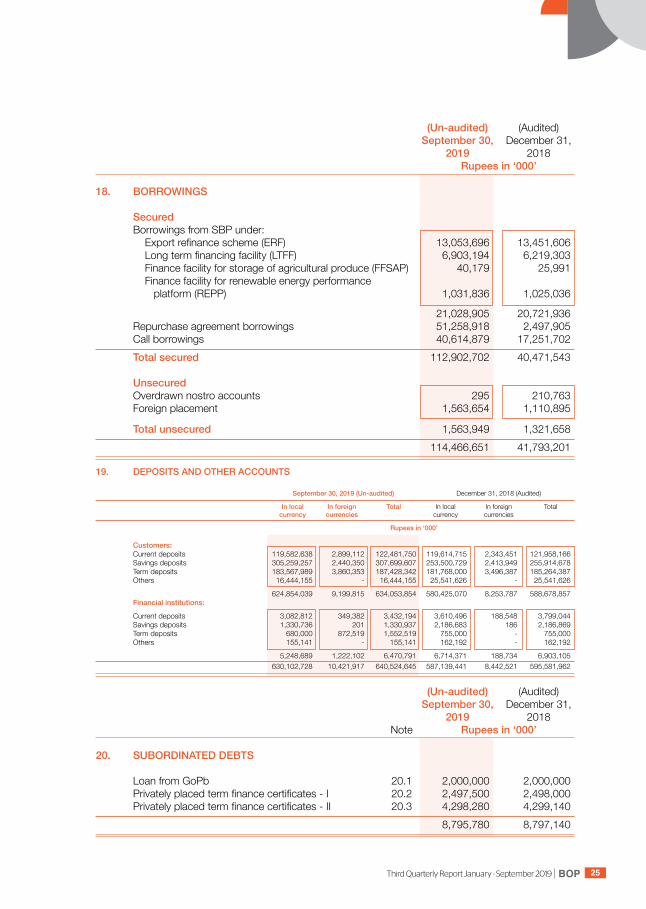
18. BORROWINGS Secured Borrowings from SBP under: Export refinance scheme (ERF) 13,053,696 13,451,606 Long term financing facility (LTFF) 6,903,194 6,219,303 Finance facility for storage of agricultural produce (FFSAP) 40,179 25,991 Finance facility for renewable energy performance platform (REPP) 1,031,836 1,025,036
21,028,905 20,721,936 Repurchase agreement borrowings 51,258,918 2,497,905 Call borrowings 40,614,879 17,251,702 Total secured 112,902,702 40,471,543 Unsecured Overdrawn nostro accounts 295 210,763 Foreign placement 1,563,654 1,110,895
Total unsecured 1,563,949 1,321,658 114,466,651 41,793,201
19. DEPOSITS AND OTHER ACCOUNTS
September 30, 2019 (Un-audited) December 31, 2018 (Audited)
In local In foreign Total In local In foreign Total currency currencies currency currencies
Rupees in ‘000’ Customers: Current deposits 119,582,638 2,899,112 122,481,750 119,614,715 2,343,451 121,958,166 Savings deposits 305,259,257 2,440,350 307,699,607 253,500,729 2,413,949 255,914,678 Term deposits 183,567,989 3,860,353 187,428,342 181,768,000 3,496,387 185,264,387 Others 16,444,155 - 16,444,155 25,541,626 - 25,541,626
624,854,039 9,199,815 634,053,854 580,425,070 8,253,787 588,678,857 Financial institutions:
Current deposits 3,082,812 349,382 3,432,194 3,610,496 188,548 3,799,044 Savings deposits 1,330,736 201 1,330,937 2,186,683 186 2,186,869 Term deposits 680,000 872,519 1,552,519 755,000 - 755,000 Others 155,141 - 155,141 162,192 - 162,192
5,248,689 1,222,102 6,470,791 6,714,371 188,734 6,903,105 630,102,728 10,421,917 640,524,645 587,139,441 8,442,521 595,581,962
(Un-audited) (Audited) September 30, December 31, 2019 2018 Note Rupees in ‘000’
20. SUBORDINATED DEBTS Loan from GoPb 20.1 2,000,000 2,000,000 Privately placed term finance certificates - I 20.2 2,497,500 2,498,000 Privately placed term finance certificates - II 20.3 4,298,280 4,299,140 8,795,780 8,797,140
BOP Third Quarterly Report January - September 201926
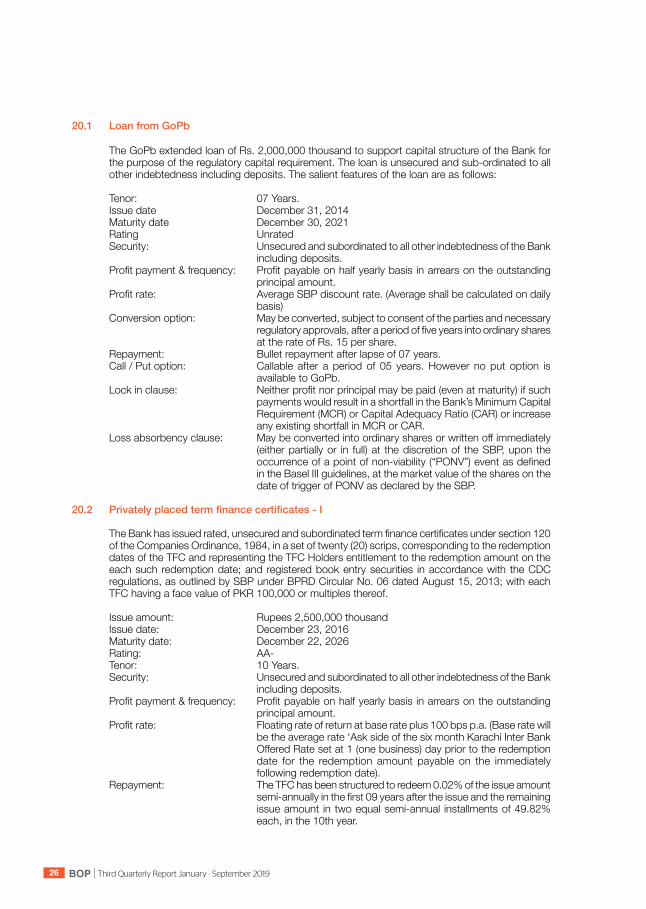
20.1 Loan from GoPb The GoPb extended loan of Rs. 2,000,000 thousand to support capital structure of the Bank for
the purpose of the regulatory capital requirement. The loan is unsecured and sub-ordinated to all other indebtedness including deposits. The salient features of the loan are as follows:
Tenor: 07 Years. Issue date December 31, 2014 Maturity date December 30, 2021 Rating Unrated Security: Unsecured and subordinated to all other indebtedness of the Bank
including deposits. Profit payment & frequency: Profit payable on half yearly basis in arrears on the outstanding
principal amount. Profit rate: Average SBP discount rate. (Average shall be calculated on daily
basis) Conversion option: May be converted, subject to consent of the parties and necessary
regulatory approvals, after a period of five years into ordinary shares at the rate of Rs. 15 per share.
Repayment: Bullet repayment after lapse of 07 years. Call / Put option: Callable after a period of 05 years. However no put option is
available to GoPb. Lock in clause: Neither profit nor principal may be paid (even at maturity) if such
payments would result in a shortfall in the Bank’s Minimum Capital Requirement (MCR) or Capital Adequacy Ratio (CAR) or increase any existing shortfall in MCR or CAR.
Loss absorbency clause: May be converted into ordinary shares or written off immediately (either partially or in full) at the discretion of the SBP, upon the occurrence of a point of non-viability (“PONV”) event as defined in the Basel III guidelines, at the market value of the shares on the date of trigger of PONV as declared by the SBP.
20.2 Privatelyplacedtermfinancecertificates-I The Bank has issued rated, unsecured and subordinated term finance certificates under section 120
of the Companies Ordinance, 1984, in a set of twenty (20) scrips, corresponding to the redemption dates of the TFC and representing the TFC Holders entitlement to the redemption amount on the each such redemption date; and registered book entry securities in accordance with the CDC regulations, as outlined by SBP under BPRD Circular No. 06 dated August 15, 2013; with each TFC having a face value of PKR 100,000 or multiples thereof.
Issue amount: Rupees 2,500,000 thousand Issue date: December 23, 2016 Maturity date: December 22, 2026 Rating: AA- Tenor: 10 Years. Security: Unsecured and subordinated to all other indebtedness of the Bank
including deposits. Profit payment & frequency: Profit payable on half yearly basis in arrears on the outstanding
principal amount. Profit rate: Floating rate of return at base rate plus 100 bps p.a. (Base rate will
be the average rate ‘Ask side of the six month Karachi Inter Bank Offered Rate set at 1 (one business) day prior to the redemption date for the redemption amount payable on the immediately following redemption date).
Repayment: The TFC has been structured to redeem 0.02% of the issue amount semi-annually in the first 09 years after the issue and the remaining issue amount in two equal semi-annual installments of 49.82% each, in the 10th year.
BOPThird Quarterly Report January - September 2019 27
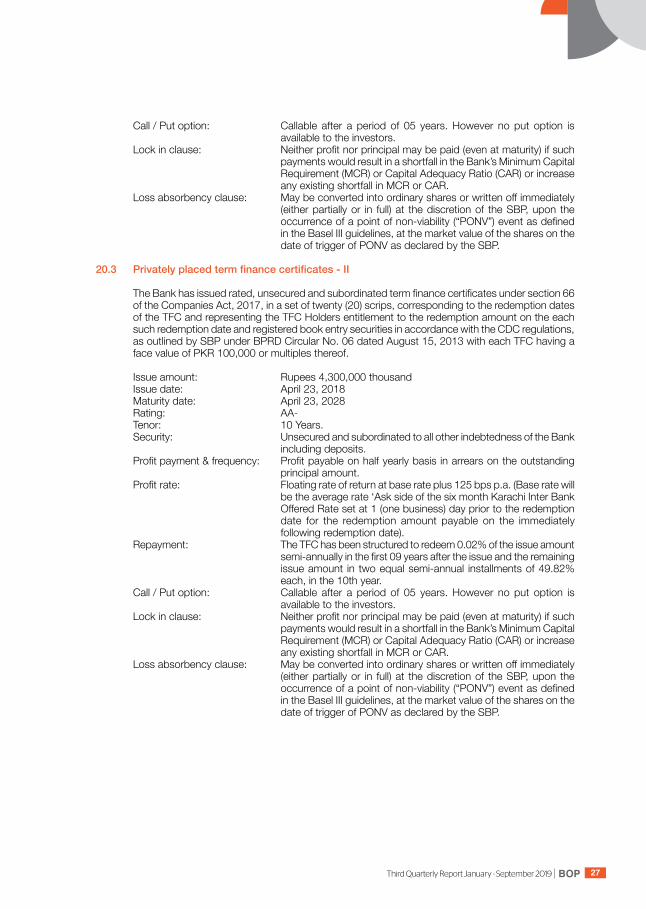
Call / Put option: Callable after a period of 05 years. However no put option is available to the investors.
Lock in clause: Neither profit nor principal may be paid (even at maturity) if such payments would result in a shortfall in the Bank’s Minimum Capital Requirement (MCR) or Capital Adequacy Ratio (CAR) or increase any existing shortfall in MCR or CAR.
Loss absorbency clause: May be converted into ordinary shares or written off immediately (either partially or in full) at the discretion of the SBP, upon the occurrence of a point of non-viability (“PONV”) event as defined in the Basel III guidelines, at the market value of the shares on the date of trigger of PONV as declared by the SBP.
20.3 Privatelyplacedtermfinancecertificates-II The Bank has issued rated, unsecured and subordinated term finance certificates under section 66
of the Companies Act, 2017, in a set of twenty (20) scrips, corresponding to the redemption dates of the TFC and representing the TFC Holders entitlement to the redemption amount on the each such redemption date and registered book entry securities in accordance with the CDC regulations, as outlined by SBP under BPRD Circular No. 06 dated August 15, 2013 with each TFC having a face value of PKR 100,000 or multiples thereof.
Issue amount: Rupees 4,300,000 thousand Issue date: April 23, 2018 Maturity date: April 23, 2028 Rating: AA- Tenor: 10 Years. Security: Unsecured and subordinated to all other indebtedness of the Bank
including deposits. Profit payment & frequency: Profit payable on half yearly basis in arrears on the outstanding
principal amount. Profit rate: Floating rate of return at base rate plus 125 bps p.a. (Base rate will
be the average rate ‘Ask side of the six month Karachi Inter Bank Offered Rate set at 1 (one business) day prior to the redemption date for the redemption amount payable on the immediately following redemption date).
Repayment: The TFC has been structured to redeem 0.02% of the issue amount semi-annually in the first 09 years after the issue and the remaining issue amount in two equal semi-annual installments of 49.82% each, in the 10th year.
Call / Put option: Callable after a period of 05 years. However no put option is available to the investors.
Lock in clause: Neither profit nor principal may be paid (even at maturity) if such payments would result in a shortfall in the Bank’s Minimum Capital Requirement (MCR) or Capital Adequacy Ratio (CAR) or increase any existing shortfall in MCR or CAR.
Loss absorbency clause: May be converted into ordinary shares or written off immediately (either partially or in full) at the discretion of the SBP, upon the occurrence of a point of non-viability (“PONV”) event as defined in the Basel III guidelines, at the market value of the shares on the date of trigger of PONV as declared by the SBP.

BOP Third Quarterly Report January - September 201928
(Un-audited) (Audited) September 30, December 31, 2019 2018 Note Rupees in ‘000’
21. OTHER LIABILITIES Mark-up / return / interest payable in local currency 11,756,852 7,260,038 Mark-up / return / interest payable in foreign currency 81,902 44,506 Lease key money 12,383,377 11,567,270 Sundry creditors and accrued expenses 679,848 999,519 Acceptances 1,646,827 4,888,386 Mark-up payable on subordinated debts 401,638 97,913 Unclaimed dividends 2,588 2,599 Mark to market loss on forward foreign exchange contracts 89,765 - Payable to gratuity fund 86,086 287,512 Gratuity payable to key management personnel 40,027 100,403 Payable to charity fund 7 114 Provision against off-balance sheet obligations 21.1 62,183 62,183 Provision for employees compensated absences 108,836 102,294 Taxes / zakat / import fee payable 283,755 193,646 Lease liability against right of use assets 4.1 5,904,090 - Deferred income on sale of sukuk on bai - muajjal basis 780,296 1,044,888 Others 201,357 258,050 34,509,434 26,909,321
21.1 Provisionagainstoff-balancesheetobligations 62,183 62,183 The above provision has been made against letters of guarantee issued by the Bank.
(Un-audited) (Audited) September 30, December 31, 2019 2018 Note Rupees in ‘000’
22. SURPLUS ON REVALUATION OF ASSETS - NET OF TAX Surplus / (deficit) on revaluation of : - Available for sale securities 10.1 1,004,102 (17,491) - Fixed assets 2,324,552 2,374,212 - Non-banking assets acquired in satisfaction of claims 15 1,520,042 1,544,813
4,848,696 3,901,534 Deferred tax on (surplus) / deficit on revaluation of : - Available for sale securities (351,436) 6,122 - Fixed assets (446,112) (463,493) - Non-banking assets acquired in satisfaction of claims (176,768) (183,851)
(974,316) (641,222) 3,874,380 3,260,312
BOPThird Quarterly Report January - September 2019 29
(Un-audited) (Audited) September 30, December 31, 2019 2018 Note Rupees in ‘000’
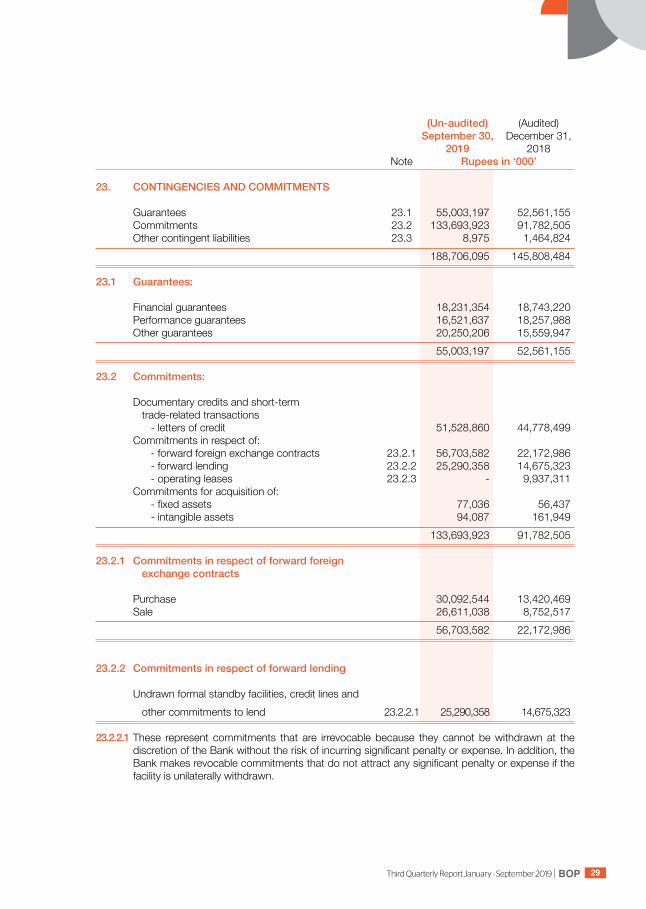
23. CONTINGENCIES AND COMMITMENTS Guarantees 23.1 55,003,197 52,561,155 Commitments 23.2 133,693,923 91,782,505 Other contingent liabilities 23.3 8,975 1,464,824 188,706,095 145,808,484 23.1 Guarantees: Financial guarantees 18,231,354 18,743,220 Performance guarantees 16,521,637 18,257,988 Other guarantees 20,250,206 15,559,947 55,003,197 52,561,155 23.2 Commitments: Documentary credits and short-term trade-related transactions - letters of credit 51,528,860 44,778,499 Commitments in respect of: - forward foreign exchange contracts 23.2.1 56,703,582 22,172,986 - forward lending 23.2.2 25,290,358 14,675,323 - operating leases 23.2.3 - 9,937,311 Commitments for acquisition of: - fixed assets 77,036 56,437 - intangible assets 94,087 161,949 133,693,923 91,782,505 23.2.1 Commitments in respect of forward foreign exchangecontracts Purchase 30,092,544 13,420,469 Sale 26,611,038 8,752,517 56,703,582 22,172,986
23.2.2 Commitments in respect of forward lending Undrawn formal standby facilities, credit lines and other commitments to lend 23.2.2.1 25,290,358 14,675,323 23.2.2.1 These represent commitments that are irrevocable because they cannot be withdrawn at the
discretion of the Bank without the risk of incurring significant penalty or expense. In addition, the Bank makes revocable commitments that do not attract any significant penalty or expense if the facility is unilaterally withdrawn.
BOP Third Quarterly Report January - September 201930
(Un-audited) (Audited) September 30, December 31, 2019 2018 Rupees in ‘000’
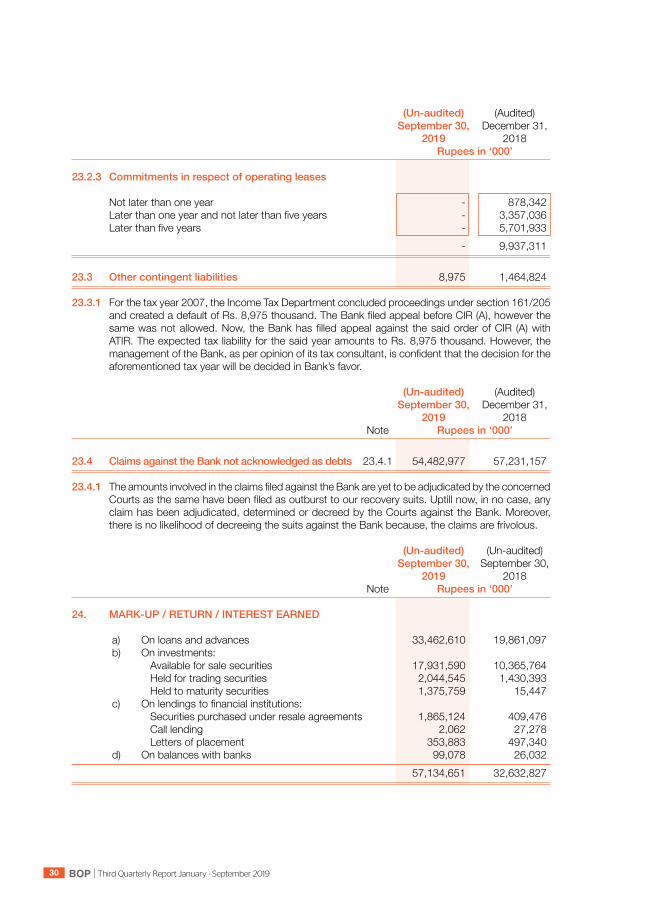
23.2.3 Commitments in respect of operating leases
Not later than one year - 878,342 Later than one year and not later than five years - 3,357,036 Later than five years - 5,701,933 - 9,937,311 23.3 Other contingent liabilities 8,975 1,464,824 23.3.1 For the tax year 2007, the Income Tax Department concluded proceedings under section 161/205
and created a default of Rs. 8,975 thousand. The Bank filed appeal before CIR (A), however the same was not allowed. Now, the Bank has filled appeal against the said order of CIR (A) with ATIR. The expected tax liability for the said year amounts to Rs. 8,975 thousand. However, the management of the Bank, as per opinion of its tax consultant, is confident that the decision for the aforementioned tax year will be decided in Bank’s favor.
(Un-audited) (Audited) September 30, December 31, 2019 2018 Note Rupees in ‘000’ 23.4 Claims against the Bank not acknowledged as debts 23.4.1 54,482,977 57,231,157 23.4.1 The amounts involved in the claims filed against the Bank are yet to be adjudicated by the concerned
Courts as the same have been filed as outburst to our recovery suits. Uptill now, in no case, any claim has been adjudicated, determined or decreed by the Courts against the Bank. Moreover, there is no likelihood of decreeing the suits against the Bank because, the claims are frivolous.
(Un-audited) (Un-audited) September 30, September 30, 2019 2018 Note Rupees in ‘000’ 24. MARK-UP / RETURN / INTEREST EARNED a) On loans and advances 33,462,610 19,861,097 b) On investments: Available for sale securities 17,931,590 10,365,764 Held for trading securities 2,044,545 1,430,393 Held to maturity securities 1,375,759 15,447 c) On lendings to financial institutions: Securities purchased under resale agreements 1,865,124 409,476 Call lending 2,062 27,278 Letters of placement 353,883 497,340 d) On balances with banks 99,078 26,032 57,134,651 32,632,827

BOPThird Quarterly Report January - September 2019 31
(Un-audited) (Un-audited) September 30, September 30, 2019 2018 Note Rupees in ‘000’
25. MARK-UP / RETURN / INTEREST EXPENSED Deposits and other accounts 32,569,674 16,140,593 Borrowings: Securities sold under repurchase agreements 1,176,753 907,666 Foreign placements 42,231 - Call borrowings 1,845,261 728,075 SBP refinance borrowing 326,643 313,520 Subordinated debts: Mark-up on subordinated loan from GoPb 180,493 104,520 Mark-up on privately placed term finance certificates 617,073 295,424 Mark-up on lease liability against right of use assets 544,920 - 37,303,048 18,489,798 26. FEE AND COMMISSION INCOME Branch banking customer fees 435,899 463,914 Consumer finance related fees 161,499 202,090 Card related fees 387,072 264,533 Credit related fees 295,180 430,780 Branchless banking fees 50,538 40,654 Commission on trade 428,317 395,630 Commission on guarantees 110,668 243,774 Commission on cash management 145,033 17,068 Commission on remittances including home remittances 193,075 203,764 Commission on bancassurance 96,177 91,196 Commission on wheat financing 133,977 79,438 SMS banking income 169,155 97,676 2,606,590 2,530,517 27. GAIN ON SECURITIES - NET Realized gain / (loss) on sale of securities - net 27.1 83,057 31,217 Unrealized gain / (loss) - held for trading 25,466 (4,005) 108,523 27,212 27.1 Realized gain / (loss) on sale of securities - net: Federal Government 59,299 (2,051) Shares and certificates 14,501 34,466 Term finance certificates 9,257 (1,198) 83,057 31,217
28. OTHER INCOME - NET Rent on property 1,169 3,619 Gain / (loss) on sale of fixed assets - net 34,180 (419) Gain on sale of non banking assets - net 67 36,335 Notice pay on resignations 8,072 10,638 43,488 50,173

BOP Third Quarterly Report January - September 201932
(Un-audited) (Un-audited) September 30, September 30, 2019 2018 Note Rupees in ‘000’
29. OPERATING EXPENSES
Totalcompensationexpense 5,353,537 4,545,350
Propertyexpense: Rent and taxes 36,023 703,635 Insurance 14,282 10,065 Utilities cost 459,826 367,840 Security 911 987 Repair and maintenance including janitorial charges 12,455 17,364 Depreciation 396,789 324,819 Depreciation on right of use assets 607,092 - Others 3,443 -
1,530,821 1,424,710 Informationtechnologyexpenses: Software maintenance 246,695 136,866 Hardware maintenance 79,810 59,305 Depreciation on computer equipment 167,564 161,408 Amortization on intangible assets 128,190 36,136 Network charges 236,015 203,894
858,274 597,609 Otheroperatingexpenses: Directors’ fees and allowances 6,368 2,645 Fees and allowances to shariah board 3,205 2,084 Legal and professional charges 71,660 120,083 Subscription charges 11,433 14,453 Outsourced staff services costs 179,258 198,841 Travelling and conveyance 419,497 341,056 NIFT clearing charges 43,045 38,007 Depreciation 213,905 189,125 Depreciation on non banking assets 55,546 52,173 Depreciation on ijarah assets 194,849 276,258 Training and development 16,391 11,631 Postage and courier charges 113,344 77,777 Stationery and printing 134,439 126,979 Marketing, advertisement and publicity 67,317 109,980 Donations 29.1 1,000 - Insurance 97,324 74,575 Deposit protection fee 253,032 79,840 Repair and maintenance 122,793 101,494 Entertainment expenses 72,740 66,375 Fuel for generator 78,379 70,277 Commission and brokerage 98,587 84,964 Bank charges 65,540 51,043 SMS banking charges 30,041 18,233 ATM charges including ATM maintenance charges 96,244 54,161 Cash remittance charges 141,634 150,386 Branch license fee 13,060 13,032 CNIC verification / ECIB charges 59,999 25,231 Miscellaneous expenses 135,243 114,145
2,795,873 2,464,848 10,538,505 9,032,517
BOPThird Quarterly Report January - September 2019 33
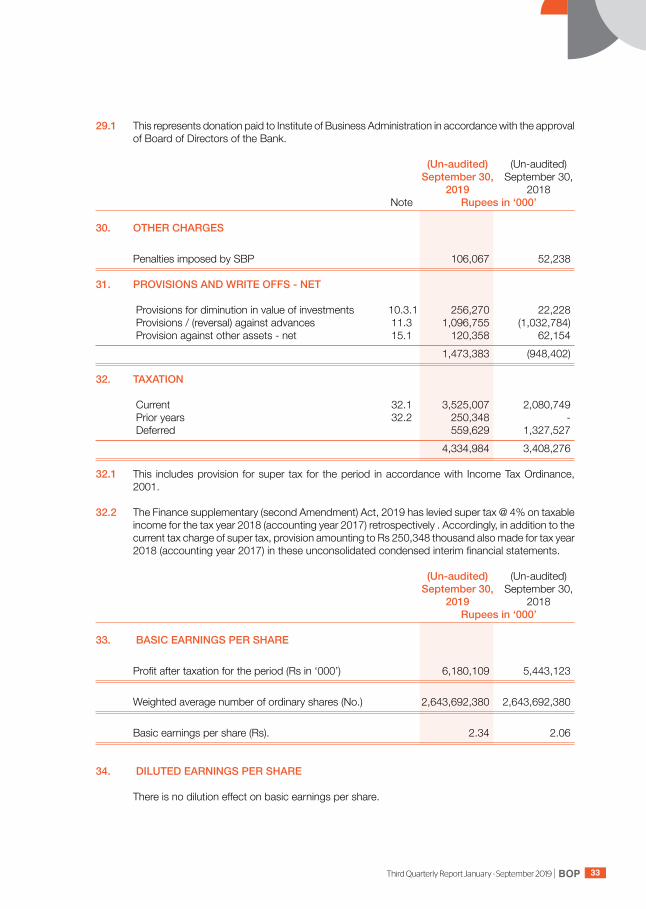
29.1 This represents donation paid to Institute of Business Administration in accordance with the approval of Board of Directors of the Bank.
(Un-audited) (Un-audited) September 30, September 30, 2019 2018 Note Rupees in ‘000’
30. OTHER CHARGES Penalties imposed by SBP 106,067 52,238 31. PROVISIONS AND WRITE OFFS - NET Provisions for diminution in value of investments 10.3.1 256,270 22,228 Provisions / (reversal) against advances 11.3 1,096,755 (1,032,784) Provision against other assets - net 15.1 120,358 62,154 1,473,383 (948,402) 32. TAXATION Current 32.1 3,525,007 2,080,749 Prior years 32.2 250,348 - Deferred 559,629 1,327,527 4,334,984 3,408,276 32.1 This includes provision for super tax for the period in accordance with Income Tax Ordinance,
2001. 32.2 The Finance supplementary (second Amendment) Act, 2019 has levied super tax @ 4% on taxable
income for the tax year 2018 (accounting year 2017) retrospectively . Accordingly, in addition to the current tax charge of super tax, provision amounting to Rs 250,348 thousand also made for tax year 2018 (accounting year 2017) in these unconsolidated condensed interim financial statements.
(Un-audited) (Un-audited) September 30, September 30, 2019 2018 Rupees in ‘000’
33. BASIC EARNINGS PER SHARE Profit after taxation for the period (Rs in ‘000’) 6,180,109 5,443,123 Weighted average number of ordinary shares (No.) 2,643,692,380 2,643,692,380 Basic earnings per share (Rs). 2.34 2.06
34. DILUTED EARNINGS PER SHARE There is no dilution effect on basic earnings per share.
BOP Third Quarterly Report January - September 201934
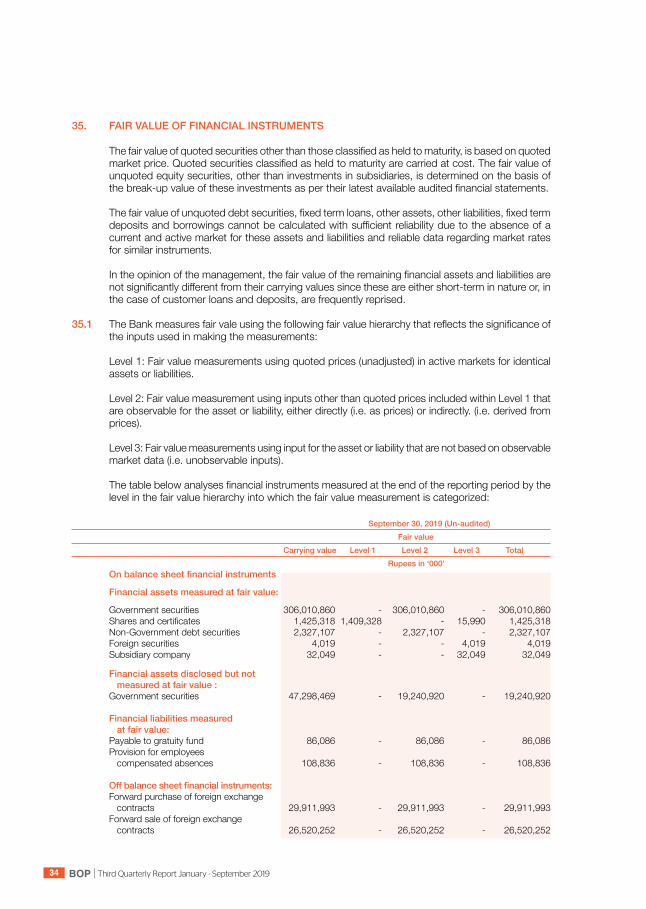
35. FAIR VALUE OF FINANCIAL INSTRUMENTS The fair value of quoted securities other than those classified as held to maturity, is based on quoted
market price. Quoted securities classified as held to maturity are carried at cost. The fair value of unquoted equity securities, other than investments in subsidiaries, is determined on the basis of the break-up value of these investments as per their latest available audited financial statements.
The fair value of unquoted debt securities, fixed term loans, other assets, other liabilities, fixed term
deposits and borrowings cannot be calculated with sufficient reliability due to the absence of a current and active market for these assets and liabilities and reliable data regarding market rates for similar instruments.
In the opinion of the management, the fair value of the remaining financial assets and liabilities are
not significantly different from their carrying values since these are either short-term in nature or, in the case of customer loans and deposits, are frequently reprised.
35.1 The Bank measures fair vale using the following fair value hierarchy that reflects the significance of
the inputs used in making the measurements:
Level 1: Fair value measurements using quoted prices (unadjusted) in active markets for identical assets or liabilities.
Level 2: Fair value measurement using inputs other than quoted prices included within Level 1 that are observable for the asset or liability, either directly (i.e. as prices) or indirectly. (i.e. derived from prices).
Level 3: Fair value measurements using input for the asset or liability that are not based on observable market data (i.e. unobservable inputs).
The table below analyses financial instruments measured at the end of the reporting period by the level in the fair value hierarchy into which the fair value measurement is categorized:
September 30, 2019 (Un-audited) Fair value Carrying value Level 1 Level 2 Level 3 Total Rupees in ‘000’ Onbalancesheetfinancialinstruments Financial assets measured at fair value: Government securities 306,010,860 - 306,010,860 - 306,010,860 Shares and certificates 1,425,318 1,409,328 - 15,990 1,425,318 Non-Government debt securities 2,327,107 - 2,327,107 - 2,327,107 Foreign securities 4,019 - - 4,019 4,019 Subsidiary company 32,049 - - 32,049 32,049 Financial assets disclosed but not measured at fair value : Government securities 47,298,469 - 19,240,920 - 19,240,920 Financial liabilities measured at fair value: Payable to gratuity fund 86,086 - 86,086 - 86,086 Provision for employees compensated absences 108,836 - 108,836 - 108,836 Offbalancesheetfinancialinstruments: Forward purchase of foreign exchange contracts 29,911,993 - 29,911,993 - 29,911,993 Forward sale of foreign exchange contracts 26,520,252 - 26,520,252 - 26,520,252
BOPThird Quarterly Report January - September 2019 35
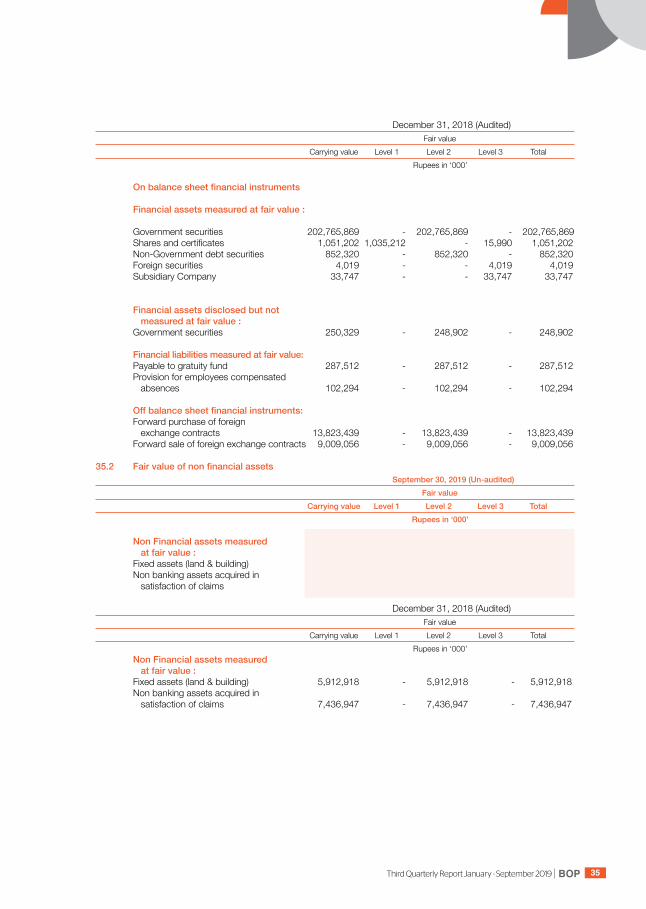
December 31, 2018 (Audited) Fair value Carrying value Level 1 Level 2 Level 3 Total Rupees in ‘000’
Onbalancesheetfinancialinstruments Financial assets measured at fair value : Government securities 202,765,869 - 202,765,869 - 202,765,869 Shares and certificates 1,051,202 1,035,212 - 15,990 1,051,202 Non-Government debt securities 852,320 - 852,320 - 852,320 Foreign securities 4,019 - - 4,019 4,019 Subsidiary Company 33,747 - - 33,747 33,747 Financial assets disclosed but not measured at fair value : Government securities 250,329 - 248,902 - 248,902 Financial liabilities measured at fair value: Payable to gratuity fund 287,512 - 287,512 - 287,512 Provision for employees compensated absences 102,294 - 102,294 - 102,294 Offbalancesheetfinancialinstruments: Forward purchase of foreign exchange contracts 13,823,439 - 13,823,439 - 13,823,439 Forward sale of foreign exchange contracts 9,009,056 - 9,009,056 - 9,009,056 35.2 Fairvalueofnonfinancialassets September 30, 2019 (Un-audited) Fair value Carrying value Level 1 Level 2 Level 3 Total Rupees in ‘000’ Non Financial assets measured at fair value : Fixed assets (land & building) 5,875,221 - 5,875,221 - 5,875,221 Non banking assets acquired in satisfaction of claims 7,296,861 - 7,296,861 - 7,296,861 December 31, 2018 (Audited) Fair value Carrying value Level 1 Level 2 Level 3 Total Rupees in ‘000’ Non Financial assets measured at fair value : Fixed assets (land & building) 5,912,918 - 5,912,918 - 5,912,918 Non banking assets acquired in satisfaction of claims 7,436,947 - 7,436,947 - 7,436,947
BOP Third Quarterly Report January - September 201936
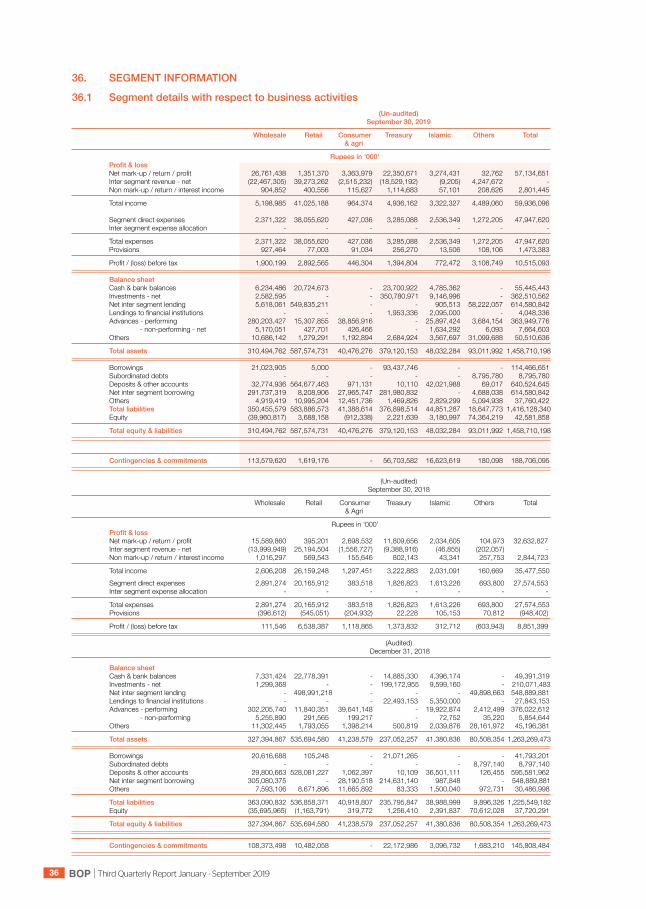
36. SEGMENT INFORMATION 36.1 Segment details with respect to business activities (Un-audited) September 30, 2019
Wholesale Retail Consumer Treasury Islamic Others Total & agri
Rupees in ‘000’ Profit&loss Net mark-up / return / profit 26,761,438 1,351,370 3,363,979 22,350,671 3,274,431 32,762 57,134,651 Inter segment revenue - net (22,467,305) 39,273,262 (2,515,232) (18,529,192) (9,205) 4,247,672 - Non mark-up / return / interest income 904,852 400,556 115,627 1,114,683 57,101 208,626 2,801,445
Total income 5,198,985 41,025,188 964,374 4,936,162 3,322,327 4,489,060 59,936,096 Segment direct expenses 2,371,322 38,055,620 427,036 3,285,088 2,536,349 1,272,205 47,947,620 Inter segment expense allocation - - - - - - -
Total expenses 2,371,322 38,055,620 427,036 3,285,088 2,536,349 1,272,205 47,947,620 Provisions 927,464 77,003 91,034 256,270 13,506 108,106 1,473,383
Profit / (loss) before tax 1,900,199 2,892,565 446,304 1,394,804 772,472 3,108,749 10,515,093 Balance sheet Cash & bank balances 6,234,486 20,724,673 - 23,700,922 4,785,362 - 55,445,443 Investments - net 2,582,595 - - 350,780,971 9,146,996 - 362,510,562 Net inter segment lending 5,618,061 549,835,211 - - 905,513 58,222,057 614,580,842 Lendings to financial institutions - - - 1,953,336 2,095,000 - 4,048,336 Advances - performing 280,203,427 15,307,855 38,856,916 - 25,897,424 3,684,154 363,949,776 - non-performing - net 5,170,051 427,701 426,466 - 1,634,292 6,093 7,664,603 Others 10,686,142 1,279,291 1,192,894 2,684,924 3,567,697 31,099,688 50,510,636
Total assets 310,494,762 587,574,731 40,476,276 379,120,153 48,032,284 93,011,992 1,458,710,198 Borrowings 21,023,905 5,000 - 93,437,746 - - 114,466,651 Subordinated debts - - - - - 8,795,780 8,795,780 Deposits & other accounts 32,774,936 564,677,463 971,131 10,110 42,021,988 69,017 640,524,645 Net inter segment borrowing 291,737,319 8,208,906 27,965,747 281,980,832 - 4,688,038 614,580,842 Others 4,919,419 10,995,204 12,451,736 1,469,826 2,829,299 5,094,938 37,760,422 Total liabilities 350,455,579 583,886,573 41,388,614 376,898,514 44,851,287 18,647,773 1,416,128,340 Equity (39,960,817) 3,688,158 (912,338) 2,221,639 3,180,997 74,364,219 42,581,858
Total equity & liabilities 310,494,762 587,574,731 40,476,276 379,120,153 48,032,284 93,011,992 1,458,710,198
Contingencies & commitments 113,579,620 1,619,176 - 56,703,582 16,623,619 180,098 188,706,095 (Un-audited) September 30, 2018
Wholesale Retail Consumer Treasury Islamic Others Total & Agri
Rupees in ‘000’ Profit&loss Net mark-up / return / profit 15,589,860 395,201 2,698,532 11,809,656 2,034,605 104,973 32,632,827 Inter segment revenue - net (13,999,949) 25,194,504 (1,556,727) (9,388,916) (46,855) (202,057) - Non mark-up / return / interest income 1,016,297 569,543 155,646 802,143 43,341 257,753 2,844,723
Total income 2,606,208 26,159,248 1,297,451 3,222,883 2,031,091 160,669 35,477,550 Segment direct expenses 2,891,274 20,165,912 383,518 1,826,823 1,613,226 693,800 27,574,553 Inter segment expense allocation - - - - - - -
Total expenses 2,891,274 20,165,912 383,518 1,826,823 1,613,226 693,800 27,574,553 Provisions (396,612) (545,051) (204,932) 22,228 105,153 70,812 (948,402)
Profit / (loss) before tax 111,546 6,538,387 1,118,865 1,373,832 312,712 (603,943) 8,851,399 (Audited) December 31, 2018
Balance sheet Cash & bank balances 7,331,424 22,778,391 - 14,885,330 4,396,174 - 49,391,319 Investments - net 1,299,368 - - 199,172,955 9,599,160 - 210,071,483 Net inter segment lending - 498,991,218 - - - 49,898,663 548,889,881 Lendings to financial institutions - - - 22,493,153 5,350,000 - 27,843,153 Advances - performing 302,205,740 11,840,351 39,641,148 - 19,922,874 2,412,499 376,022,612 - non-performing 5,255,890 291,565 199,217 - 72,752 35,220 5,854,644 Others 11,302,445 1,793,055 1,398,214 500,819 2,039,876 28,161,972 45,196,381
Total assets 327,394,867 535,694,580 41,238,579 237,052,257 41,380,836 80,508,354 1,263,269,473 Borrowings 20,616,688 105,248 - 21,071,265 - - 41,793,201 Subordinated debts - - - - - 8,797,140 8,797,140 Deposits & other accounts 29,800,663 528,081,227 1,062,397 10,109 36,501,111 126,455 595,581,962 Net inter segment borrowing 305,080,375 - 28,190,518 214,631,140 987,848 - 548,889,881 Others 7,593,106 8,671,896 11,665,892 83,333 1,500,040 972,731 30,486,998
Total liabilities 363,090,832 536,858,371 40,918,807 235,795,847 38,988,999 9,896,326 1,225,549,182 Equity (35,695,965) (1,163,791) 319,772 1,256,410 2,391,837 70,612,028 37,720,291
Total equity & liabilities 327,394,867 535,694,580 41,238,579 237,052,257 41,380,836 80,508,354 1,263,269,473
Contingencies & commitments 108,373,498 10,482,058 - 22,172,986 3,096,732 1,683,210 145,808,484

BOPThird Quarterly Report January - September 2019 37
37. RELATED PARTY TRANSACTIONS
Related parties comprise subsidiary, key management personnel and entities in which key management personnel are office holders / members. The Bank in the normal course of business carries out transactions with various related parties on arm’s length basis. Amounts due from and due to related parties are shown under receivables and payables. In addition key management personnel are paid terminal and short-term terminal benefits.
September 30, 2019 (Un-audited) December 31, 2018 (Audited) Key Subsidiary Employee Other Key Subsidiary Employee Other management company funds related management company funds related personnel and parties personnel and parties managed managed modaraba modaraba Rupees in ‘000’ Rupees in ‘000’ Lendingstofinancialinstitutions: Opening balance - 400,000 - - - 400,000 - - Addition during the period - 1,200,000 - - - 1,600,000 - - Repaid during the period - 1,200,000 - - - 1,600,000 - -
Closing balance - 400,000 - - - 400,000 - -
Investments (gross) : - 164,945 - - - 164,945 - - Provision for diminution in value
of investments - 132,896 - - - 131,198 - -
September 30, 2019 (Un-audited) December 31, 2018 (Audited) Key Subsidiary Employee Other Key Subsidiary Employee Other management company funds related management company funds related personnel and parties personnel and parties managed managed modaraba modaraba Rupees in ‘000’ Rupees in ‘000’
Advances : Opening balance 197,801 1,287,780 - - 182,129 1,199,047 - - Addition during the period 128,272 742,478 - - 90,341 1,132,228 - - Repaid during the period 91,493 757,920 - - 74,669 1,043,495 - -
Closing balance 234,580 1,272,338 - - 197,801 1,287,780 - - Provision held against advances - 54,455 - - - 46,199 - - Advance Rent - - - - - - - 67,317 Right of use asset - - - 94,668 - - - - Lease liability against right of use asset - - - 37,224 - - - - Deposits and other accounts: Opening balance 37,682 19,999 2,398,389 7,753 24,414 98,198 2,770,528 2,396 Received during the period 417,775 857,424 936,643 70,379 553,084 1,236,350 791,508 156,480 Withdrawn during the period 438,700 872,292 728,715 76,258 539,816 1,314,549 1,163,647 151,123
Closing balance 16,757 5,131 2,606,317 1,874 37,682 19,999 2,398,389 7,753
September 30, 2019 (Un-audited) September 30, 2018 (Un-audited)
Rupees in ‘000’ Rupees in ‘000’ Income : Mark-up / return / interest earned 11,640 146,870 - - 6,500 77,986 - - Net gain on sale of fixed assets - - - - - - - 6,505 Mark-up on lease liability against right of use asset - - - 3,548 - - - - Expense: Mark-up / return / interest paid 1,103 - 220,566 960 913 - 117,240 47 Depreciation on right of use asset - - - 3,860 - - - - Compensation expense 233,517 - - - 329,756 - - - Commission expense - 36 - - - 401 - - Provision : Charge of provision - investment - 1,698 - - - - - - Charge of provision - advances - 8,256 - - - 5,607 - -
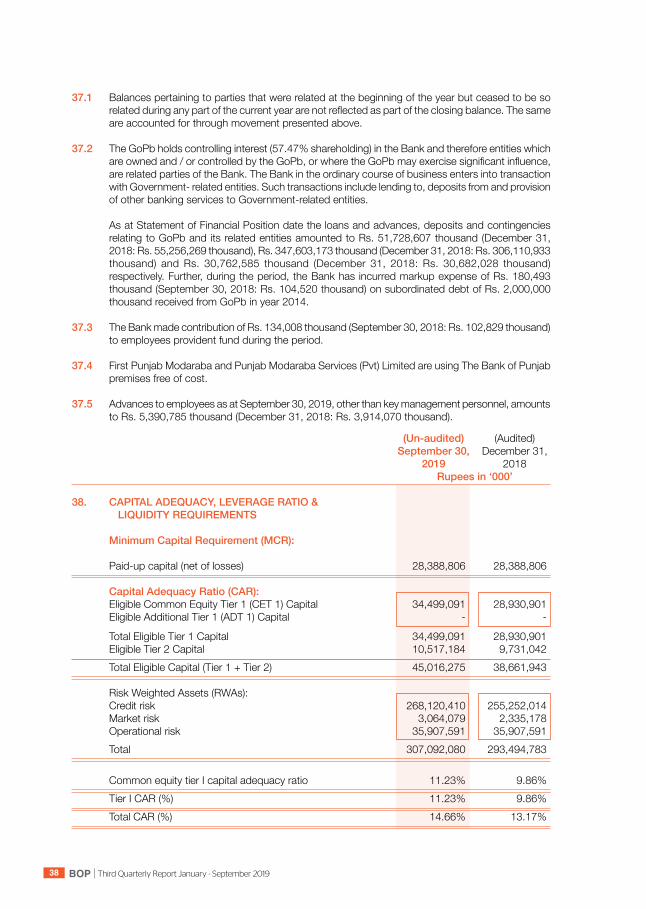
BOP Third Quarterly Report January - September 201938
37.1 Balances pertaining to parties that were related at the beginning of the year but ceased to be so related during any part of the current year are not reflected as part of the closing balance. The same are accounted for through movement presented above.
37.2 The GoPb holds controlling interest (57.47% shareholding) in the Bank and therefore entities which
are owned and / or controlled by the GoPb, or where the GoPb may exercise significant influence, are related parties of the Bank. The Bank in the ordinary course of business enters into transaction with Government- related entities. Such transactions include lending to, deposits from and provision of other banking services to Government-related entities.
As at Statement of Financial Position date the loans and advances, deposits and contingencies
relating to GoPb and its related entities amounted to Rs. 51,728,607 thousand (December 31, 2018: Rs. 55,256,269 thousand), Rs. 347,603,173 thousand (December 31, 2018: Rs. 306,110,933 thousand) and Rs. 30,762,585 thousand (December 31, 2018: Rs. 30,682,028 thousand) respectively. Further, during the period, the Bank has incurred markup expense of Rs. 180,493 thousand (September 30, 2018: Rs. 104,520 thousand) on subordinated debt of Rs. 2,000,000 thousand received from GoPb in year 2014.
37.3 The Bank made contribution of Rs. 134,008 thousand (September 30, 2018: Rs. 102,829 thousand)
to employees provident fund during the period. 37.4 First Punjab Modaraba and Punjab Modaraba Services (Pvt) Limited are using The Bank of Punjab
premises free of cost. 37.5 Advances to employees as at September 30, 2019, other than key management personnel, amounts
to Rs. 5,390,785 thousand (December 31, 2018: Rs. 3,914,070 thousand). (Un-audited) (Audited) September 30, December 31, 2019 2018 Rupees in ‘000’
38. CAPITAL ADEQUACY, LEVERAGE RATIO & LIQUIDITY REQUIREMENTS Minimum Capital Requirement (MCR): Paid-up capital (net of losses) 28,388,806 28,388,806
Capital Adequacy Ratio (CAR): Eligible Common Equity Tier 1 (CET 1) Capital 34,499,091 28,930,901 Eligible Additional Tier 1 (ADT 1) Capital - -
Total Eligible Tier 1 Capital 34,499,091 28,930,901 Eligible Tier 2 Capital 10,517,184 9,731,042 Total Eligible Capital (Tier 1 + Tier 2) 45,016,275 38,661,943 Risk Weighted Assets (RWAs): Credit risk 268,120,410 255,252,014 Market risk 3,064,079 2,335,178 Operational risk 35,907,591 35,907,591 Total 307,092,080 293,494,783 Common equity tier I capital adequacy ratio 11.23% 9.86% Tier I CAR (%) 11.23% 9.86% Total CAR (%) 14.66% 13.17%

BOPThird Quarterly Report January - September 2019 39
(Un-audited) (Audited) September 30, December 31, 2019 2018 Rupees in ‘000’
38.1 Leverage Ratio (LR): Eligible Tier-I Capital 34,499,091 28,930,901 Total exposures 1,034,116,854 851,906,956 LR (%) 3.34% 3.40% 38.2 Liquidity Coverage Ratio (LCR): Total high quality liquid assets 312,393,869 272,221,864 Total net cash outflow 273,626,484 203,539,146 LCR (%) 114.17% 133.74% Net Stable Funding Ratio (NSFR): Total available stable funding 460,412,567 417,010,019 Total required stable funding 449,733,003 371,740,462 NSFR (%) 102.37% 112.18%
39. ISLAMIC BANKING BUSINESS
The Bank has started Islamic banking operations in the year 2013. As at close of the September 30, 2019, the Bank is operating 88 Islamic banking branches and 02 sub Islamic banking branches (December 31, 2018: 72 Islamic banking branches and 02 sub Islamic banking branches).

BOP Third Quarterly Report January - September 201940
(Un-audited) (Audited) September 30, December 31, 2019 2018 Note Rupees in ‘000’
ASSETS Cash and balances with treasury banks 3,205,119 2,753,286 Balances with other banks 1,580,243 1,642,888 Due from financial institutions 39.1 2,095,000 5,350,000 Investments - net 39.2 9,146,996 9,599,160 Islamic financing and related assets - net 39.3 27,531,716 19,995,626 Fixed assets 1,515,514 309,063 Intangible assets 3,834 - Due from head office 905,513 - Other assets 2,048,349 1,730,813
Total assets 48,032,284 41,380,836 LIABILITIES Bills payable 170,145 209,762 Due to financial institutions - - Deposits and other accounts 39.4 42,021,988 36,501,111 Due to head office - 187,187 Subordinated debt - - Other liabilities 2,659,154 2,085,897
44,851,287 38,983,957 NET ASSETS 3,180,997 2,396,879 REPRESENTED BY Islamic banking fund 1,500,000 1,500,000 Reserves 24,578 7,313 Surplus on revaluation of assets 14,753 20,372 Unappropriated profit 39.5 1,641,666 869,194 3,180,997 2,396,879 CONTINGENCIES AND COMMITMENTS 39.6
STATEMENT OF FINANCIAL POSITIONAs At September 30, 2019
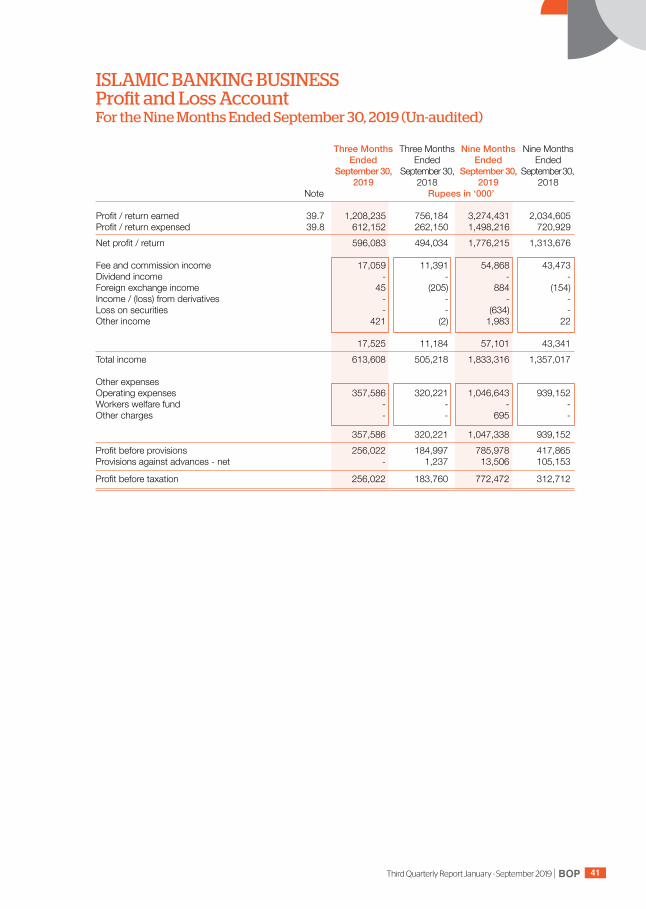
BOPThird Quarterly Report January - September 2019 41
ISLAMIC BANKING BUSINESS Profit and Loss Account For the Nine Months Ended September 30, 2019 (Un-audited)
Three Months Three Months Nine Months Nine Months Ended Ended Ended Ended September 30, September 30, September 30, September 30, 2019 2018 2019 2018 Note Rupees in ‘000’ Profit / return earned 39.7 1,208,235 756,184 3,274,431 2,034,605 Profit / return expensed 39.8 612,152 262,150 1,498,216 720,929 Net profit / return 596,083 494,034 1,776,215 1,313,676 Fee and commission income 17,059 11,391 54,868 43,473 Dividend income - - - - Foreign exchange income 45 (205) 884 (154)Income / (loss) from derivatives - - - - Loss on securities - - (634) - Other income 421 (2) 1,983 22
17,525 11,184 57,101 43,341 Total income 613,608 505,218 1,833,316 1,357,017 Other expenses Operating expenses 357,586 320,221 1,046,643 939,152 Workers welfare fund - - - - Other charges - - 695 -
357,586 320,221 1,047,338 939,152 Profit before provisions 256,022 184,997 785,978 417,865 Provisions against advances - net - 1,237 13,506 105,153
Profit before taxation 256,022 183,760 772,472 312,712
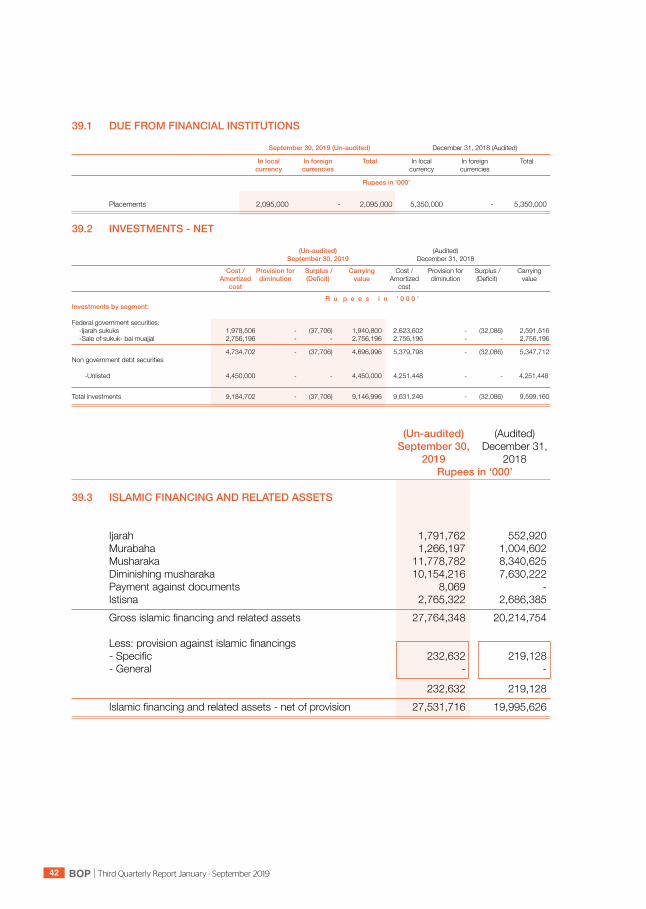
BOP Third Quarterly Report January - September 201942
39.1 DUE FROM FINANCIAL INSTITUTIONS
September 30, 2019 (Un-audited) December 31, 2018 (Audited)
In local In foreign Total In local In foreign Total currency currencies currency currencies
Rupees in ‘000’
Placements 2,095,000 - 2,095,000 5,350,000 - 5,350,000
39.2 INVESTMENTS - NET
(Un-audited) (Audited) September 30, 2019 December 31, 2018
Cost / Provision for Surplus / Carrying Cost / Provision for Surplus / Carrying Amortized diminution (Deficit) value Amortized diminution (Deficit) value cost cost
R u p e e s i n ‘ 0 0 0 ’Investments by segment:
Federal government securities: -Ijarah sukuks 1,978,506 - (37,706) 1,940,800 2,623,602 - (32,086) 2,591,516 -Sale of sukuk- bai muajjal 2,756,196 - - 2,756,196 2,756,196 - - 2,756,196
4,734,702 - (37,706) 4,696,996 5,379,798 - (32,086) 5,347,712 Non government debt securities
-Unlisted 4,450,000 - - 4,450,000 4,251,448 - - 4,251,448
Total investments 9,184,702 - (37,706) 9,146,996 9,631,246 - (32,086) 9,599,160
(Un-audited) (Audited) September 30, December 31, 2019 2018 Rupees in ‘000’
39.3 ISLAMIC FINANCING AND RELATED ASSETS Ijarah 1,791,762 552,920 Murabaha 1,266,197 1,004,602 Musharaka 11,778,782 8,340,625 Diminishing musharaka 10,154,216 7,630,222 Payment against documents 8,069 - Istisna 2,765,322 2,686,385 Gross islamic financing and related assets 27,764,348 20,214,754 Less: provision against islamic financings - Specific 232,632 219,128 - General - -
232,632 219,128 Islamic financing and related assets - net of provision 27,531,716 19,995,626
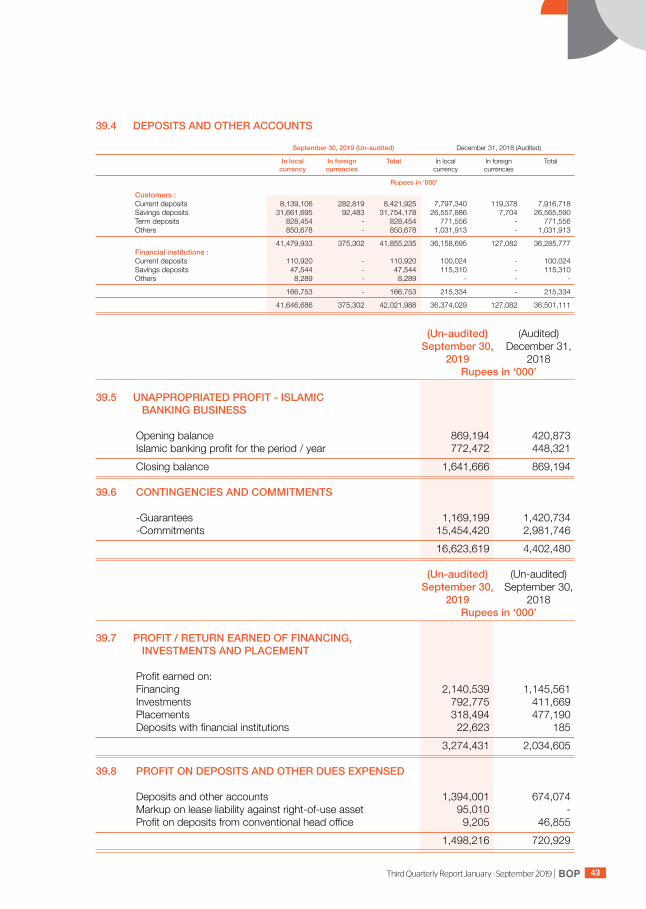
BOPThird Quarterly Report January - September 2019 43
39.4 DEPOSITS AND OTHER ACCOUNTS
September 30, 2019 (Un-audited) December 31, 2018 (Audited)
In local In foreign Total In local In foreign Total currency currencies currency currencies
Rupees in ‘000’ Customers : Current deposits 8,139,106 282,819 8,421,925 7,797,340 119,378 7,916,718 Savings deposits 31,661,695 92,483 31,754,178 26,557,886 7,704 26,565,590 Term deposits 828,454 - 828,454 771,556 - 771,556 Others 850,678 - 850,678 1,031,913 - 1,031,913
41,479,933 375,302 41,855,235 36,158,695 127,082 36,285,777 Financial institutions : Current deposits 110,920 - 110,920 100,024 - 100,024 Savings deposits 47,544 - 47,544 115,310 - 115,310 Others 8,289 - 8,289 - - -
166,753 - 166,753 215,334 - 215,334
41,646,686 375,302 42,021,988 36,374,029 127,082 36,501,111
(Un-audited) (Audited) September 30, December 31, 2019 2018 Rupees in ‘000’
39.5 UNAPPROPRIATED PROFIT - ISLAMIC BANKING BUSINESS Opening balance 869,194 420,873 Islamic banking profit for the period / year 772,472 448,321 Closing balance 1,641,666 869,194 39.6 CONTINGENCIES AND COMMITMENTS -Guarantees 1,169,199 1,420,734 -Commitments 15,454,420 2,981,746 16,623,619 4,402,480 (Un-audited) (Un-audited) September 30, September 30, 2019 2018 Rupees in ‘000’
39.7 PROFIT / RETURN EARNED OF FINANCING, INVESTMENTS AND PLACEMENT Profit earned on: Financing 2,140,539 1,145,561 Investments 792,775 411,669 Placements 318,494 477,190 Deposits with financial institutions 22,623 185 3,274,431 2,034,605 39.8 PROFIT ON DEPOSITS AND OTHER DUES EXPENSED Deposits and other accounts 1,394,001 674,074 Markup on lease liability against right-of-use asset 95,010 - Profit on deposits from conventional head office 9,205 46,855 1,498,216 720,929

BOP Third Quarterly Report January - September 201944
39.9 During the period, following pools have been closed by the islamic banking: Special Pool-III Special Pool-V Special Pool-X Special Pool-XI Further, Special Pool-XIV has been created during the period. The main characteristics of the pool
are as under: i) Profit sharing ratio between Mudarib and Rab-ul-mal is 40:60. ii) Profit equilization reserve upto 2% of net income will be created, if needed. iii) Investment risk reserve upto 1% of distributable profit of depositors will be created, if needed. 40. DATE OF AUTHORIZATION FOR ISSUE These unconsolidated condensed interim financial statements were authorized for issue on
October 18, 2019 by the Board of Directors of the Bank. 41. GENERAL 41.1 Figures have been rounded off to the nearest thousand rupees. 41.2 Under BPRD circular letter No. 05 of 2019 dated March 22, 2019 comparative information has been
reclassified, rearranged in these unconsolidated condensed interim financial statements. However, no other significant reclassifications have been made.
ChiefFinancialOfficer President Director

BOPThird Quarterly Report January - September 2019 45
Consolidated Condensed InterimFinancial Statements
for the period ended September 30, 2019(The Bank of Punjab & Its Subsidiaries)
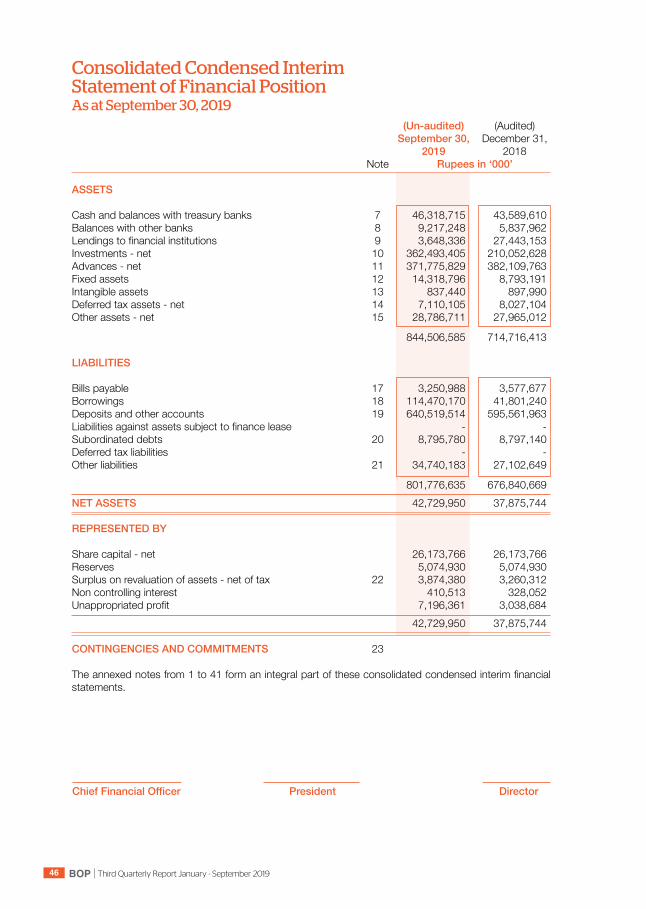
BOP Third Quarterly Report January - September 201946
Consolidated Condensed Interim Statement of Financial Position As at September 30, 2019 (Un-audited) (Audited) September 30, December 31, 2019 2018 Note Rupees in ‘000’
ASSETS Cash and balances with treasury banks 7 46,318,715 43,589,610 Balances with other banks 8 9,217,248 5,837,962 Lendings to financial institutions 9 3,648,336 27,443,153 Investments - net 10 362,493,405 210,052,628 Advances - net 11 371,775,829 382,109,763 Fixed assets 12 14,318,796 8,793,191 Intangible assets 13 837,440 897,990 Deferred tax assets - net 14 7,110,105 8,027,104 Other assets - net 15 28,786,711 27,965,012
844,506,585 714,716,413 LIABILITIES Bills payable 17 3,250,988 3,577,677 Borrowings 18 114,470,170 41,801,240 Deposits and other accounts 19 640,519,514 595,561,963 Liabilities against assets subject to finance lease - - Subordinated debts 20 8,795,780 8,797,140 Deferred tax liabilities - - Other liabilities 21 34,740,183 27,102,649
801,776,635 676,840,669 NET ASSETS 42,729,950 37,875,744 REPRESENTED BY Share capital - net 26,173,766 26,173,766 Reserves 5,074,930 5,074,930 Surplus on revaluation of assets - net of tax 22 3,874,380 3,260,312 Non controlling interest 410,513 328,052 Unappropriated profit 7,196,361 3,038,684 42,729,950 37,875,744 CONTINGENCIES AND COMMITMENTS 23 The annexed notes from 1 to 41 form an integral part of these consolidated condensed interim financial statements.
ChiefFinancialOfficer President Director

BOPThird Quarterly Report January - September 2019 47
ChiefFinancialOfficer President Director
Consolidated Condensed Interim Profit and Loss Account For the Nine Months Ended September 30, 2019 (Un-audited)
ThreeMonths Three Months NineMonths Nine Months Ended Ended Ended Ended September 30, September 30, September 30, September 30, 2019 2018 2019 2018 Note Rupees in ‘000’ Mark-up / return / interest earned 24 23,026,003 12,244,487 57,187,813 32,684,007 Mark-up / return / interest expensed 25 16,268,922 7,270,715 37,302,709 18,490,263 Net mark-up / interest income 6,757,081 4,973,772 19,885,104 14,193,744 NON MARK-UP / INTEREST INCOME Fee and commission income 26 934,942 920,119 2,622,496 2,537,432 Dividend income 17,400 18,214 75,221 53,576 Foreign exchange (loss) / income (63,138) 58,525 (32,377) 183,245 Income / (loss) from derivatives - - - - Gain on securities - net 27 74,605 8,674 108,523 26,845 Other income - net 28 3,828 16,227 47,580 60,321 Total non-markup / interest income 967,637 1,021,759 2,821,443 2,861,419 Total income 7,724,718 5,995,531 22,706,547 17,055,163 NON MARK-UP / INTEREST EXPENSES Operating expenses 29 3,610,704 3,212,216 10,636,686 9,107,316 Workers welfare fund - - - - Other charges 30 103,404 52,238 106,067 52,238 Total non-markup / interest expenses 3,714,108 3,264,454 10,742,753 9,159,554 Profit before provisions 4,010,610 2,731,077 11,963,794 7,895,609 Provisions / (reversals) and write offs - net 31 435,187 28,192 1,455,918 (1,023,471)Extra ordinary / unusual items - - - - PROFIT BEFORE TAXATION 3,575,423 2,702,885 10,507,876 8,919,080 Taxation - net 32 1,416,719 1,045,075 4,335,128 3,411,110 PROFIT AFTER TAXATION 2,158,704 1,657,810 6,172,748 5,507,970 Basic earnings per share - Rupees 33 0.81 0.62 2.33 2.08 Diluted earnings per share - Rupees 34 0.81 0.62 2.33 2.08 PROFIT ATTRIBUTEABLE TO : Equity holders of the parent 2,132,297 1,669,469 6,090,287 5,507,970 Non-controlling interest 26,407 8,069 82,461 19,728 2,158,704 1,677,538 6,172,748 5,527,698
The annexed notes from 1 to 41 form an integral part of these consolidated condensed interim financial statements.
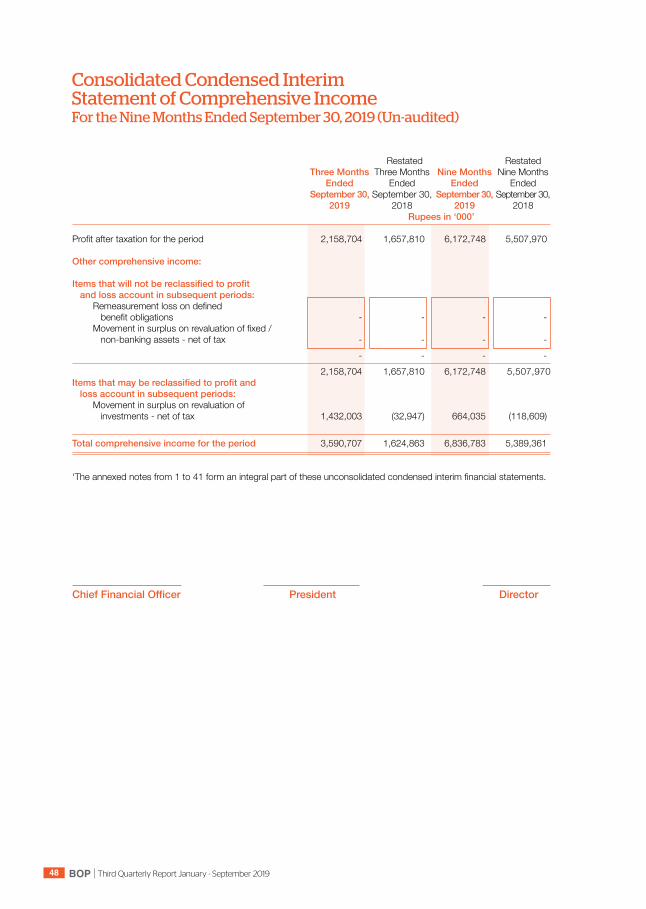
BOP Third Quarterly Report January - September 201948
Consolidated Condensed Interim Statement of Comprehensive Income For the Nine Months Ended September 30, 2019 (Un-audited)
Restated Restated ThreeMonths Three Months NineMonths Nine Months Ended Ended Ended Ended September 30, September 30, September 30, September 30, 2019 2018 2019 2018 Rupees in ‘000’ Profit after taxation for the period 2,158,704 1,657,810 6,172,748 5,507,970 Othercomprehensiveincome: Itemsthatwillnotbereclassifiedtoprofitandlossaccountinsubsequentperiods: Remeasurement loss on defined benefit obligations - - - - Movement in surplus on revaluation of fixed / non-banking assets - net of tax - - - - - - - - 2,158,704 1,657,810 6,172,748 5,507,970 Itemsthatmaybereclassifiedtoprofitandlossaccountinsubsequentperiods: Movement in surplus on revaluation of investments - net of tax 1,432,003 (32,947) 664,035 (118,609) Totalcomprehensiveincomefortheperiod 3,590,707 1,624,863 6,836,783 5,389,361 ‘The annexed notes from 1 to 41 form an integral part of these unconsolidated condensed interim financial statements.
ChiefFinancialOfficer President Director

BOPThird Quarterly Report January - September 2019 49
Co
nso
lidat
ed C
on
den
sed
Inte
rim
Sta
tem
ent o
f Ch
ange
s in
Equ
ity
Fo
r th
e N
ine
Mo
nth
s E
nd
ed S
epte
mbe
r 30
, 20
19 (U
n-a
ud
ited
)
Su
rplus/(Deficit)-neto
ftax
onrevaluationof
Share
Discounto
nSh
are
Share
Statutory
Investments
Fixed/n
on
Unapp
ropriated
Non-
Total
capital
issueof
capital
prem
ium
reserve
banking
profit/
controlling
shar
es
- net
asse
ts
(acc
umul
ated
in
tere
st
loss)
R u
p e
e s
i
n
‘00
0’
BalanceasonJanuary01,2018-a
srestated
2
6,43
6,92
4
(263
,158
) 2
6,17
3,76
6
2,2
15,0
40
1,3
44,8
99
(53,
499)
2
,940
,101
(3
,034
,749
) 2
54,3
20
29,
839,
878
Profi
t afte
r tax
atio
n fo
r the
nin
e m
onth
s en
ded
Sept
embe
r 30,
201
8 -
-
-
-
-
-
-
5
,488
,242
1
9,72
8
5,5
07,9
70
Oth
er c
ompr
ehen
sive
loss
-
-
-
-
-
(1
18,6
09)
-
-
-
(118
,609
)
Tota
l com
preh
ensiv
e in
com
e fo
r the
nin
e m
onth
s en
ded
Sept
embe
r 30,
201
8 -
-
-
-
-
(1
18,6
09)
-
5,4
88,2
42
19,
728
5
,389
,361
Tr
ansf
er fr
om s
urpl
us o
n re
valu
atio
n of
fixe
d as
sets
to u
napp
ropr
iated
pro
fit /
(a
ccum
ulat
ed lo
ss) -
net
of t
ax
-
-
-
-
-
-
(34,
730)
3
4,73
0
-
-
Tran
sfer
from
sur
plus
on
reva
luat
ion
of n
on b
ankin
g as
sets
to u
napp
ropr
iated
pro
fit /
(a
ccum
ulat
ed lo
ss) -
net
of t
ax
-
-
-
-
-
-
(3,0
78)
3,0
78
-
-
Tran
sfer
from
sur
plus
on
reva
luat
ion
of fi
xed
asse
ts to
una
ppro
priat
ed p
rofit
/
(acc
umul
ated
loss
) on
disp
osal
-
-
-
-
-
-
(77,
594)
1
19,3
75
-
41,
781
Tran
sfer
from
sur
plus
on
reva
luat
ion
of n
on b
ankin
g as
sets
to u
napp
ropr
iated
pro
fit /
(a
ccum
ulat
ed lo
ss) o
n di
spos
al -
-
-
-
-
-
(3
,978
) 4
,357
-
3
79
BalanceasonSe
ptem
ber30,2018-a
srestated
2
6,43
6,92
4
(263
,158
) 2
6,17
3,76
6
2,2
15,0
40
1,3
44,8
99
(172
,108
) 2
,820
,721
2
,615
,033
2
74,0
48
35,
271,
399
Profi
t afte
r tax
atio
n fo
r the
thre
e m
onth
s en
ded
Dece
mbe
r 31,
201
8 -
-
-
-
-
-
-
2
,049
,054
6
4,35
4
2,1
13,4
08
Oth
er c
ompr
ehen
sive
inco
me
/ (lo
ss)
-
-
-
-
-
160
,739
5
09,7
90
(172
,731
) -
4
97,7
98
Tota
l com
preh
ensiv
e in
com
e fo
r the
thre
e m
onth
s en
ded
Dece
mbe
r 31,
201
8 -
-
-
-
-
1
60,7
39
509
,790
1
,876
,323
6
4,35
4
2,6
11,2
06
Tran
sfer
to s
tatu
tory
rese
rve
-
-
-
-
1,5
14,9
91
-
-
(1,5
14,9
91)
-
-
Tran
sfer
from
sur
plus
on
reva
luat
ion
of fi
xed
asse
ts to
una
ppro
priat
ed p
rofit
/
(acc
umul
ated
loss
) - n
et o
f tax
-
-
-
-
-
-
(1
0,92
2)
10,
922
-
-
Tr
ansf
er fr
om s
urpl
us o
n re
valu
atio
n of
non
ban
king
asse
ts to
una
ppro
priat
ed p
rofit
/
(acc
umul
ated
loss
) - n
et o
f tax
-
-
-
-
-
-
(3
62)
362
-
-
Tr
ansf
er fr
om s
urpl
us o
n re
valu
atio
n of
non
ban
king
asse
ts to
una
ppro
priat
ed p
rofit
/
(acc
umul
ated
loss
) on
disp
osal
-
-
-
-
-
-
(47,
546)
5
1,03
5
-
3,4
89
Tran
sfer
from
sur
plus
on
reva
luat
ion
of n
on b
ankin
g as
sets
to u
napp
ropr
iated
pro
fit /
(a
ccum
ulat
ed lo
ss) o
n di
spos
al -
-
-
-
-
-
-
-
(1
0,35
0)
(10,
350)
BalanceasonDecem
ber31,2018
26,
436,
924
(2
63,1
58)
26,
173,
766
2
,215
,040
2
,859
,890
(1
1,36
9)
3,2
71,6
81
3,0
38,6
84
328
,052
3
7,87
5,74
4
Profi
t afte
r tax
atio
n fo
r the
nin
e m
onth
s en
ded
Sept
embe
r 30,
201
9 -
-
-
-
-
-
-
6
,090
,287
8
2,46
1
6,1
72,7
48
Oth
er c
ompr
ehen
sive
Inco
me
-
-
-
-
-
664
,035
-
-
-
6
64,0
35
Tota
l com
preh
ensiv
e in
com
e fo
r the
nin
e m
onth
s en
ded
Sept
embe
r 30,
201
9 -
-
-
-
-
6
64,0
35
-
6,0
90,2
87
82,
461
6
,836
,783
Tr
ansfe
r fro
m s
urpl
us o
n re
valua
tion
of fix
ed a
sset
s to
una
ppro
priat
ed p
rofit
/ (ac
cum
ulate
d los
s) - n
et o
f tax
-
-
-
-
-
-
(3
2,27
9)
32,
279
-
-
Tr
ansf
er fr
om s
urpl
us o
n re
valu
atio
n of
non
ban
king
asse
ts to
una
ppro
priat
ed p
rofit
/
(acc
umul
ated
loss
) - n
et o
f tax
-
-
-
-
-
-
(1
2,79
7)
12,
797
-
-
Tr
ansf
er fr
om s
urpl
us o
n re
valu
atio
n of
non
ban
king
asse
ts to
una
ppro
priat
ed p
rofit
/
(acc
umul
ated
loss
) on
disp
osal
-
-
-
-
-
-
(4,8
91)
5,0
83
-
192
Transactionswithownersrecognizeddirectlyinequity:
Fina
l cas
h di
viden
d - D
ecem
ber 3
1, 2
018
decla
red
subs
eque
nt to
yea
r end
at 7
.5%
per
sha
re
-
-
-
-
-
-
-
(1,9
82,7
69)
-
(1,9
82,7
69)
-
-
-
-
-
-
-
(1
,982
,769
) -
(1
,982
,769
)
Ba
lanceasonSe
ptem
ber30,2019
26,
436,
924
(2
63,1
58)
26,
173,
766
2
,215
,040
2
,859
,890
6
52,6
66
3,2
21,7
14
7,1
96,3
61
410
,513
4
2,72
9,95
0
Th
e an
nexe
d no
tes
from
1 to
41
form
an
inte
gral
part
of th
ese
cons
olid
ated
con
dens
ed in
terim
fina
ncial
sta
tem
ents
.
ChiefFinancialOfficer
President
Director
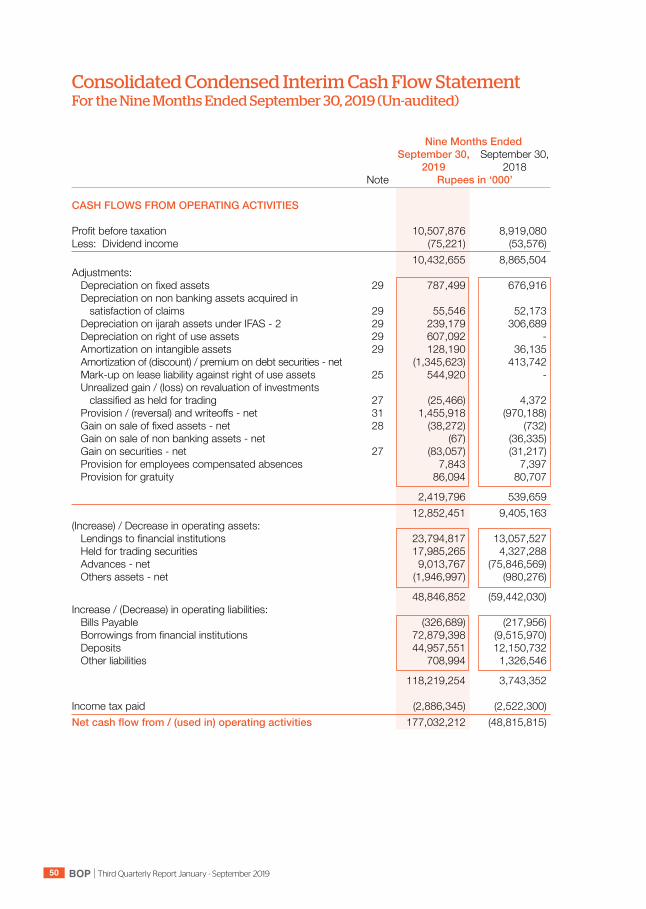
BOP Third Quarterly Report January - September 201950
Consolidated Condensed Interim Cash Flow StatementFor the Nine Months Ended September 30, 2019 (Un-audited)
NineMonthsEnded September 30, September 30, 2019 2018 Note Rupees in ‘000’
CASH FLOWS FROM OPERATING ACTIVITIES Profit before taxation 10,507,876 8,919,080 Less: Dividend income (75,221) (53,576) 10,432,655 8,865,504 Adjustments: Depreciation on fixed assets 29 787,499 676,916 Depreciation on non banking assets acquired in satisfaction of claims 29 55,546 52,173 Depreciation on ijarah assets under IFAS - 2 29 239,179 306,689 Depreciation on right of use assets 29 607,092 - Amortization on intangible assets 29 128,190 36,135 Amortization of (discount) / premium on debt securities - net (1,345,623) 413,742 Mark-up on lease liability against right of use assets 25 544,920 - Unrealized gain / (loss) on revaluation of investments classified as held for trading 27 (25,466) 4,372 Provision / (reversal) and writeoffs - net 31 1,455,918 (970,188) Gain on sale of fixed assets - net 28 (38,272) (732) Gain on sale of non banking assets - net (67) (36,335) Gain on securities - net 27 (83,057) (31,217) Provision for employees compensated absences 7,843 7,397 Provision for gratuity 86,094 80,707
2,419,796 539,659 12,852,451 9,405,163 (Increase) / Decrease in operating assets: Lendings to financial institutions 23,794,817 13,057,527 Held for trading securities 17,985,265 4,327,288 Advances - net 9,013,767 (75,846,569) Others assets - net (1,946,997) (980,276)
48,846,852 (59,442,030)Increase / (Decrease) in operating liabilities: Bills Payable (326,689) (217,956) Borrowings from financial institutions 72,879,398 (9,515,970) Deposits 44,957,551 12,150,732 Other liabilities 708,994 1,326,546
118,219,254 3,743,352 Income tax paid (2,886,345) (2,522,300)Netcashflowfrom/(usedin)operatingactivities 177,032,212 (48,815,815)
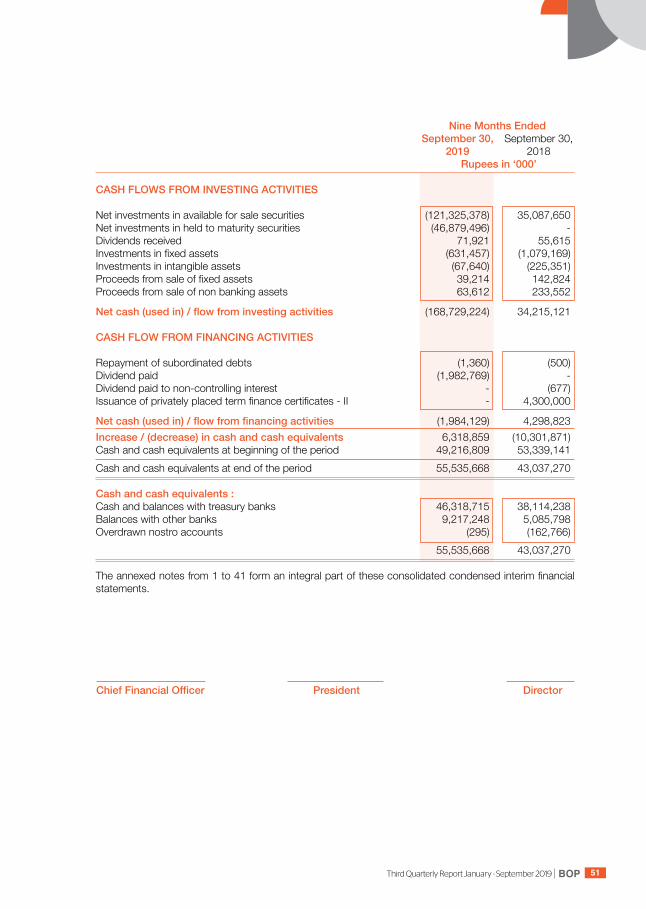
BOPThird Quarterly Report January - September 2019 51
NineMonthsEnded September 30, September 30, 2019 2018 Rupees in ‘000’
CASH FLOWS FROM INVESTING ACTIVITIES Net investments in available for sale securities (121,325,378) 35,087,650 Net investments in held to maturity securities (46,879,496) - Dividends received 71,921 55,615 Investments in fixed assets (631,457) (1,079,169)Investments in intangible assets (67,640) (225,351)Proceeds from sale of fixed assets 39,214 142,824 Proceeds from sale of non banking assets 63,612 233,552
Netcash(usedin)/flowfrominvestingactivities (168,729,224) 34,215,121 CASH FLOW FROM FINANCING ACTIVITIES Repayment of subordinated debts (1,360) (500)Dividend paid (1,982,769) - Dividend paid to non-controlling interest - (677)Issuance of privately placed term finance certificates - II - 4,300,000
Netcash(usedin)/flowfromfinancingactivities (1,984,129) 4,298,823 Increase/(decrease)incashandcashequivalents 6,318,859 (10,301,871)Cash and cash equivalents at beginning of the period 49,216,809 53,339,141 Cash and cash equivalents at end of the period 55,535,668 43,037,270 Cashandcashequivalents: Cash and balances with treasury banks 46,318,715 38,114,238 Balances with other banks 9,217,248 5,085,798 Overdrawn nostro accounts (295) (162,766) 55,535,668 43,037,270 The annexed notes from 1 to 41 form an integral part of these consolidated condensed interim financial statements.
ChiefFinancialOfficer President Director
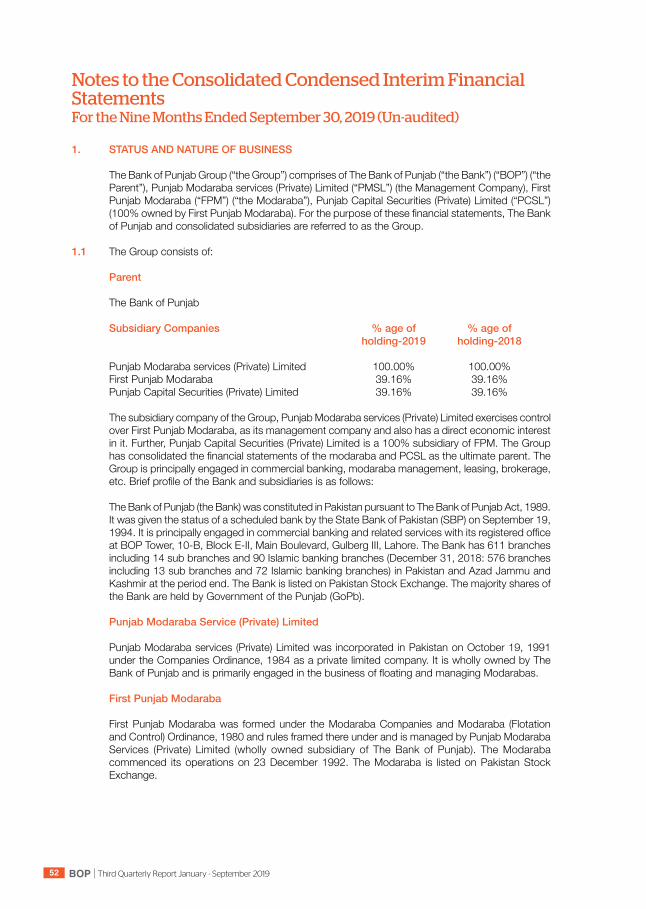
BOP Third Quarterly Report January - September 201952
1. STATUS AND NATURE OF BUSINESS
The Bank of Punjab Group (“the Group”) comprises of The Bank of Punjab (“the Bank”) (“BOP”) (“the Parent”), Punjab Modaraba services (Private) Limited (“PMSL”) (the Management Company), First Punjab Modaraba (“FPM”) (“the Modaraba”), Punjab Capital Securities (Private) Limited (“PCSL”) (100% owned by First Punjab Modaraba). For the purpose of these financial statements, The Bank of Punjab and consolidated subsidiaries are referred to as the Group.
1.1 The Group consists of:
Parent The Bank of Punjab SubsidiaryCompanies %ageof %ageof holding-2019 holding-2018
Punjab Modaraba services (Private) Limited 100.00% 100.00% First Punjab Modaraba 39.16% 39.16% Punjab Capital Securities (Private) Limited 39.16% 39.16%
The subsidiary company of the Group, Punjab Modaraba services (Private) Limited exercises control over First Punjab Modaraba, as its management company and also has a direct economic interest in it. Further, Punjab Capital Securities (Private) Limited is a 100% subsidiary of FPM. The Group has consolidated the financial statements of the modaraba and PCSL as the ultimate parent. The Group is principally engaged in commercial banking, modaraba management, leasing, brokerage, etc. Brief profile of the Bank and subsidiaries is as follows:
The Bank of Punjab (the Bank) was constituted in Pakistan pursuant to The Bank of Punjab Act, 1989.
It was given the status of a scheduled bank by the State Bank of Pakistan (SBP) on September 19, 1994. It is principally engaged in commercial banking and related services with its registered office at BOP Tower, 10-B, Block E-II, Main Boulevard, Gulberg III, Lahore. The Bank has 611 branches including 14 sub branches and 90 Islamic banking branches (December 31, 2018: 576 branches including 13 sub branches and 72 Islamic banking branches) in Pakistan and Azad Jammu and Kashmir at the period end. The Bank is listed on Pakistan Stock Exchange. The majority shares of the Bank are held by Government of the Punjab (GoPb).
PunjabModarabaService(Private)Limited Punjab Modaraba services (Private) Limited was incorporated in Pakistan on October 19, 1991
under the Companies Ordinance, 1984 as a private limited company. It is wholly owned by The Bank of Punjab and is primarily engaged in the business of floating and managing Modarabas.
FirstPunjabModaraba First Punjab Modaraba was formed under the Modaraba Companies and Modaraba (Flotation
and Control) Ordinance, 1980 and rules framed there under and is managed by Punjab Modaraba Services (Private) Limited (wholly owned subsidiary of The Bank of Punjab). The Modaraba commenced its operations on 23 December 1992. The Modaraba is listed on Pakistan Stock Exchange.
Notes to the Consolidated Condensed Interim Financial Statements For the Nine Months Ended September 30, 2019 (Un-audited)
BOPThird Quarterly Report January - September 2019 53
PunjabCapitalSecurities(Private)Limited Punjab Capital Securities (Private) Limited is registered under the Companies Ordinance, 1984
as company limited by shares from the 29th day of November 2016. PCSL is mainly engaged in business of brokerage services, portfolio management and consultancy services. The registered office of the company is situated at Room No 319, 3rd Floor, LSE Building, Lahore. The Company is wholly-owned subsidiary of First Punjab Modaraba.
1.2 BasisofConsolidation Subsidiaries are all entities over which the bank has the power to govern the financial and operating
policies generally accompanying a shareholding of more than one half of the voting rights. The existence and effect of potential voting rights that are currently exercisable or convertible are considered when assessing whether the Parent controls another entity. The Bank also assesses existence of control where it does not have more than 50% of the voting power but is able to govern the financial and operating policies by virtue of de-facto control. De-facto control may arise in circumstances where the size of the Bank’s voting rights relative to the size and dispersion of holdings of other shareholders give the Bank the power to govern the financial and operating policies, etc.
The Group financial statements include the financial statements of the Bank and its subsidiaries. Subsidiaries are fully consolidated from the date on which control is transferred to the Bank. They
are deconsolidated from the date that control ceases. The financial statements of subsidiaries have been consolidated on line by line basis. All significant inter-company transactions, balances, income and expenses on transactions between group companies are eliminated. Profits and losses resulting from inter-company transactions that are recognized in assets are also eliminated.
The Bank applies the acquisition method to account for business combinations. The consideration
transferred for the acquisition of a subsidiary is the fair values of the assets transferred, the liabilities incurred to the former owners of the acquiree and the equity interests issued by the Group. The consideration transferred includes the fair value of any asset or liability resulting from a contingent consideration arrangement. Identifiable assets acquired and liabilities and contingent liabilities assumed in a business combination are measured initially at their fair values at the acquisition date. The Bank recognizes any non-controlling interest in the acquiree on an acquisition- by-acquisition basis, at the non-controlling interest’s proportionate share of the recognized amounts of acquiree’s identifiable net assets. The Financial Statements of the Bank and its subsidiaries are prepared upto the same reporting date using consistent accounting policies.
Acquisition-related costs are expensed as incurred. If the business combination is achieved in
stages, the acquisition date fair value of the acquirer’s previously held equity interest in the acquiree is remeasured to fair value at the acquisition date through income statement.
Any contingent consideration to be transferred by the Bank is recognised at fair value at the
acquisition date. Subsequent changes to the fair value of the contingent consideration that is deemed to be an asset or liability is recognized either in profit or loss or as a change to other comprehensive income. Contingent consideration that is classified as equity is not remeasured, and its subsequent settlement is accounted for within equity.
Goodwill, if any, is initially measured as the excess of the aggregate of the consideration transferred
and the fair value of non-controlling interest over the net identifiable assets acquired and liabilities assumed. If this consideration is lower than the fair value of the net assets of the subsidiary acquired, the difference is recognized in income statement. After initial recognition, is measured at carrying value i.e. cost at the date of acquisition less any accumulated impairment.

BOP Third Quarterly Report January - September 201954
Transactions with non-controlling interests that do not result in loss of control are accounted for as equity transactions – that is, as transactions with the owners in their capacity as owners. The difference between fair value of any consideration paid and the relevant share acquired of the carrying value of net assets of the subsidiary is recorded in equity. Gains or losses on disposals to non-controlling interests are also recorded in equity.
When the Bank ceases to have control any retained interest in the entity is re-measured to its fair
value at the date when control is lost, with the change in carrying amount recognized in profit or loss. The fair value is the initial carrying amount for the purposes of subsequently accounting for the retained interest as an associate, joint venture or financial asset. In addition, any amounts previously recognized in other comprehensive income in respect of that entity are accounted for as if the Bank had directly disposed of the related assets or liabilities. This may mean that amounts previously recognized in other comprehensive income are reclassified to profit or loss
2. BASIS OF PRESENTATION These consolidated condensed interim financial statements are the consolidated financial statements
of the Group in which investments in subsidiaries is accounted for on the basis of acquisition method. Standalone financial statements of the Bank and its subsidiaries are prepared separately.
In accordance with the directives of the Government of Pakistan regarding the conversion of
the Banking system to Islamic modes, the SBP has issued various circulars from time to time. Permissible forms of trade-related modes of financing include purchase of goods by the Banks from their customers and immediate resale to them at appropriate marked-up price on deferred payment basis. The purchases and sales arising under these arrangements are not reflected in these consolidated condensed interim financial statements as such but are restricted to the amount of facility actually utilized and the appropriate portion of mark-up thereon.
The financial results of Islamic Banking business have been consolidated in these consolidated
financial statements for reporting purposes, after eliminating inter-branch transactions / balances. Key financial figures of the Islamic Banking business are disclosed in note 39 of these consolidated condensed interim financial statements.
2.1 Statementofcompliance 2.1.1 These consolidated condensed interim financial statements have been prepared in accordance with
the accounting and reporting standards as applicable in Pakistan. The accounting and reporting standards comprise of:
- Directives issued by the SBP and the Securities and Exchange Commission of Pakistan (SECP); - Requirements of The Bank of Punjab Act, 1989; - Provisions of and directives issued under the Banking Companies Ordinance, 1962 and the
Companies Act, 2017; - International Financial Reporting Standards (IFRS) issued by the International Accounting Standard
Board as are notified under the Companies Act, 2017; and - Islamic Financial Accounting Standards (IFAS) issued by the Institute of Chartered Accountants
of Pakistan as are notified under the Companies Act, 2017. Wherever the requirements of the directives issued by the SBP and Securities and Exchange
Commission of Pakistan (SECP), The Bank of Punjab Act, 1989, the Banking Companies Ordinance, 1962 and the Companies Act, 2017 differ with the requirements of these IFRS or IFAS, the requirements of the said directives, The Bank of Punjab Act, 1989, the Banking Companies Ordinance, 1962 and the Companies Act, 2017 take precedence.
BOPThird Quarterly Report January - September 2019 55
2.1.2 The disclosures made in these consolidated condensed interim financial statements have been limited based on SBP BPRD circular letter No. 05 of 2019 and IAS 34 “Interim Financial Reporting”. Accordingly, these consolidated condensed interim financial statements do not include all the information and disclosures required for annual consolidated financial statements and should be read in conjuction with the consolidated financial statements of the Bank for the year ended December 31, 2018.
2.1.3 SBP as per BSD Circular No. 10, dated August 26, 2002 has deferred the applicability of
International Accounting Standard (IAS) 39, “Financial Instruments: Recognition and Measurement” and International Accounting Standard (IAS) 40, “Investment Property” for banking companies till further instructions. Further, according to the notification of SECP dated April 28, 2008, the IFRS – 7 “Financial Instruments: Disclosures” has not been made applicable for banks. Accordingly, the requirements of these Standards have not been considered in the preparation of these consolidated condensed interim financial statements.
2.1.4 The State Bank of Pakistan through BPRD Circular No. 04 of 2015 dated February 25, 2015 has
deferred applicability of Islamic Financial Accounting Standard - 3 for Profit & Loss Sharing on Deposits (IFAS 3) issued by the Institute of Chartered Accountants of Pakistan and notified by the SECP, vide their SRO No. 571 of 2013 dated June 12, 2013 for Institutions offering Islamic Financial Services (IIFS). The standard will result in certain new disclosures in these consolidated condensed interim financial statements of the Bank.
2.1.5 Newaccountingstandards/amendmentsandIFRSinterpretationsthatareeffectiveforthe
currentperiod: During the period, certain amendments to standards, interpretations and improvements to accounting
standards became effective, however the amendments, interpretations and improvements are considered not to be relevant or do not have any significant effect on the Groups’s operations and therefore not detailed in these consolidated condensed interim financial statements.
During the period, IFRS 16 - Leases, became effective from January 01, 2019, the impact of adoption
of this standard is disclosed in note 4.1 to these consolidated condensed interim financial statements. 2.1.6 NewaccountingstandardsandIFRSinterpretationsthatarenotyeteffective: The following standards, amendments and interpretations are only effective for accounting periods,
beginning on or after the date mentioned against each of them. The Group considers that the following standards and interpretations are either not relevant or will not have any material impact on its financial statements in the period of initial application other than IFRS 9.
The SECP, through SRO 229(I)/2019 dated February 14, 2019, has notified that IFRS 9, Financial
Instruments, is applicable for accounting periods ending on or after June 30, 2019. The Bank considers that as the Prudential Regulations and other SBP directives currently provide the accounting framework for the measurement and valuation of investments and provision against non performing loans and advances, the implementation of IFRS 9 may require changes in the regulatory regime and the SBP would issue necessary guidance in this regard. The Bank is in the process of assessing the full impact of this standard. Accordingly, based on the guidance lastly received from the SBP, the requirements of IFRS 9 have not been considered in preparation of these unconsolidated condensed interim financial statements.
StandardorInterpretations Effectivedate(accountingperiods beginningonorafter)
IFRS 3 Amendments to IFRS 3 (Definition of a Business) January 01, 2020 IAS 1 & 8 Amendments to IAS 1 and IAS 8 (Definition of Material) January 01, 2020
StandardorInterpretations Effectivedate(accountingperiods endingonorafter)
IFRS 9 Financial Instrument : Classification and Measurement June 30, 2019
BOP Third Quarterly Report January - September 201956
3. BASIS OF MEASUREMENT 3.1 These consolidated condensed interim financial statements have been prepared under the historical
cost convention, except for revaluation of freehold land and buildings on freehold land, revaluation of non banking assets acquired in satisfaction of claims, valuation of certain investments and commitments in respect of forward exchange contracts at fair value and certain staff retirement benefits at present value.
3.2 These consolidated condensed interim financial statements are presented in Pak Rupees, which
is the Group’s functional and presentation currency. 4. SUMMARY OF SIGNIFICANT ACCOUNTING POLICIES The accounting policies adopted in the preparation of these consolidated condensed interim financial
statements are consistent with those applied in the preparation of the annual consolidated financial statements of the Group for the year ended December 31, 2018.
4.1 ImpactofIFRS16-Leases During the period, IFRS 16 - Leases became applicable. IFRS 16 replaces IAS 17- Leases, existing
interpretations and guidance on accounting for leases. IFRS 16 introduces an on-balance sheet lease accounting model for leases entered by the lessee. A lessee recognizes a right of use asset representing its right of using the underlying asset and a corresponding lease liability representing its obligations to make lease payments. Lessor accounting remains similar to the current standard i.e. lessors continue to classify leases as either finance or operating leases.
The Group has adopted IFRS 16 from January 1, 2019 thereby recognizing right of use assets
and lease liability there-against on January 01, 2019 using modified retrospective restatement approach, as permitted under the specific transitional provisions in the standard, and has not restated comparatives for the corresponding reporting period of 2018. Previously, these leases were accounted for as operating leases.
As at January 01, 2019, these liabilities were initially measured at the present value of the remaining
lease payments discounted using Group’s incremental weighted average borrowing rate of 14.33% per annum. The lease liability is subsequently measured at amortized cost using the effective interest rate method. The associated right of use assets were measured at the amount equal to the lease liability, adjusted by the amount of prepaid lease payments recognized in the consolidated financial statements of financial position immediately before the date of initial application.
The right of use assets recognized subsequent to the adoption are measured based on the initial
amount of the lease liability adjusted for any lease payments made at or before the commencement date, plus any initial direct costs incurred. The right of use assets are amortized over the lease term using a straight line basis as it closely reflects the expected pattern of consumption of future economic benefits. The right of use assets are reduced by impairment losses, if any, and adjusted for certain re-measurements of lease liability.
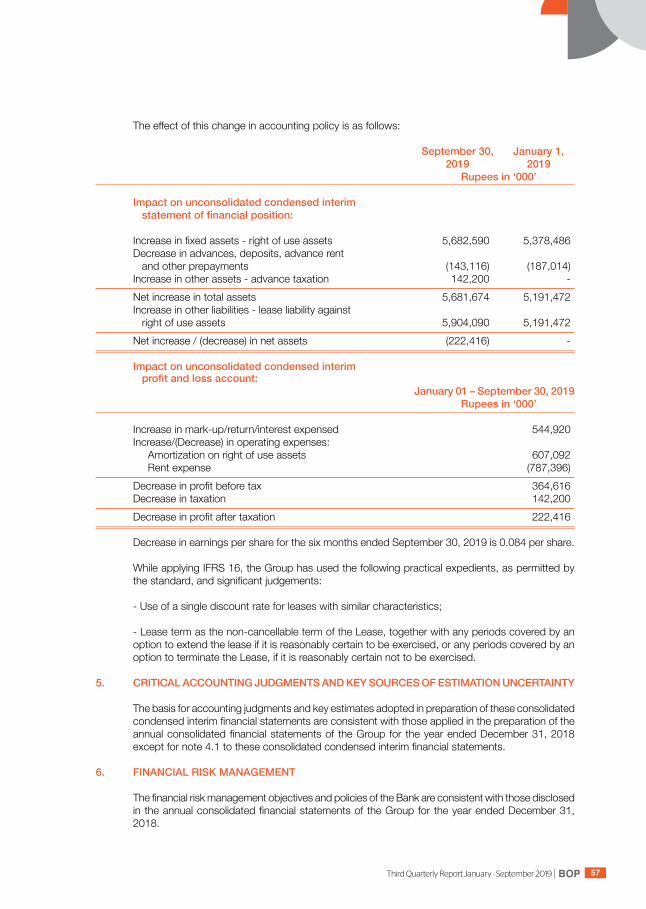
BOPThird Quarterly Report January - September 2019 57
The effect of this change in accounting policy is as follows:
September 30, January1, 2019 2019 Rupees in ‘000’ Impactonunconsolidatedcondensedinterim statementoffinancialposition: Increase in fixed assets - right of use assets 5,682,590 5,378,486 Decrease in advances, deposits, advance rent and other prepayments (143,116) (187,014) Increase in other assets - advance taxation 142,200 - Net increase in total assets 5,681,674 5,191,472 Increase in other liabilities - lease liability against right of use assets 5,904,090 5,191,472 Net increase / (decrease) in net assets (222,416) - Impactonunconsolidatedcondensedinterim profitandlossaccount: January01–September30,2019 Rupees in ‘000’
Increase in mark-up/return/interest expensed 544,920 Increase/(Decrease) in operating expenses: Amortization on right of use assets 607,092 Rent expense (787,396) Decrease in profit before tax 364,616 Decrease in taxation 142,200 Decrease in profit after taxation 222,416
Decrease in earnings per share for the six months ended September 30, 2019 is 0.084 per share. While applying IFRS 16, the Group has used the following practical expedients, as permitted by
the standard, and significant judgements: - Use of a single discount rate for leases with similar characteristics;
- Lease term as the non-cancellable term of the Lease, together with any periods covered by an option to extend the lease if it is reasonably certain to be exercised, or any periods covered by an option to terminate the Lease, if it is reasonably certain not to be exercised.
5. CRITICALACCOUNTINGJUDGMENTSANDKEYSOURCESOFESTIMATIONUNCERTAINTY The basis for accounting judgments and key estimates adopted in preparation of these consolidated
condensed interim financial statements are consistent with those applied in the preparation of the annual consolidated financial statements of the Group for the year ended December 31, 2018 except for note 4.1 to these consolidated condensed interim financial statements.
6. FINANCIAL RISK MANAGEMENT The financial risk management objectives and policies of the Bank are consistent with those disclosed
in the annual consolidated financial statements of the Group for the year ended December 31, 2018.
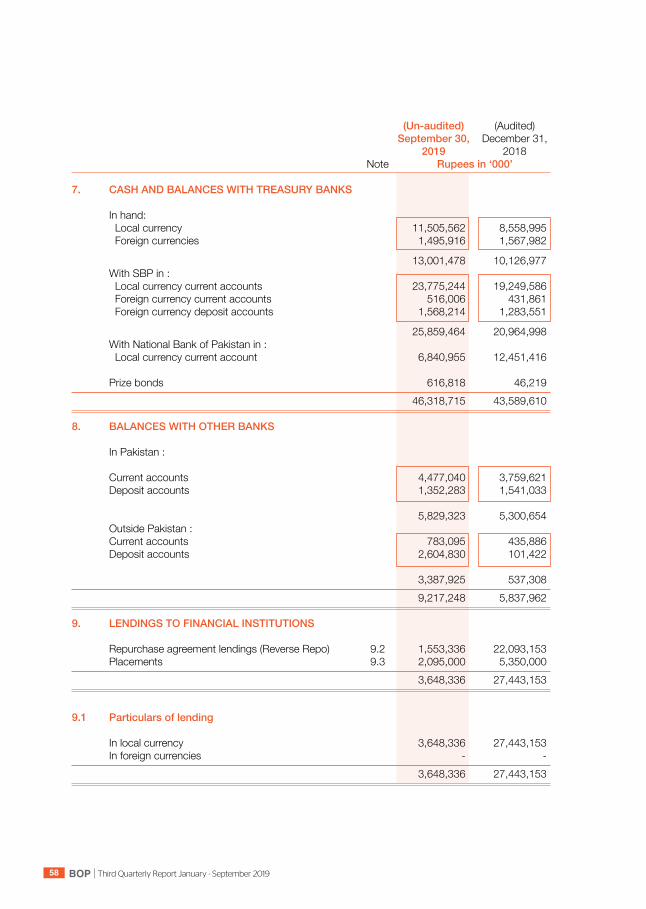
BOP Third Quarterly Report January - September 201958
(Un-audited) (Audited) September 30, December 31, 2019 2018 Note Rupees in ‘000’ 7. CASH AND BALANCES WITH TREASURY BANKS In hand: Local currency 11,505,562 8,558,995 Foreign currencies 1,495,916 1,567,982
13,001,478 10,126,977 With SBP in : Local currency current accounts 23,775,244 19,249,586 Foreign currency current accounts 516,006 431,861 Foreign currency deposit accounts 1,568,214 1,283,551
25,859,464 20,964,998 With National Bank of Pakistan in : Local currency current account 6,840,955 12,451,416 Prize bonds 616,818 46,219 46,318,715 43,589,610 8. BALANCESWITHOTHERBANKS In Pakistan : Current accounts 4,477,040 3,759,621 Deposit accounts 1,352,283 1,541,033 5,829,323 5,300,654 Outside Pakistan : Current accounts 783,095 435,886 Deposit accounts 2,604,830 101,422 3,387,925 537,308 9,217,248 5,837,962 9. LENDINGS TO FINANCIAL INSTITUTIONS Repurchase agreement lendings (Reverse Repo) 9.2 1,553,336 22,093,153 Placements 9.3 2,095,000 5,350,000 3,648,336 27,443,153 9.1 Particularsoflending In local currency 3,648,336 27,443,153 In foreign currencies - - 3,648,336 27,443,153

BOPThird Quarterly Report January - September 2019 59
9.2 Securitiesheldascollateralrepurchaseagreementlendings(ReverseRepo)
(Un-audited) (Audited) September 30, 2019 December 31, 2018 Held by Further Held by Further bank givenas Total bank given as Total collateral collateral R u p e e s i n ‘ 0 0 0 ’ Market treasury bills 995,088 - 995,088 - - - Pakistan investment bonds 558,248 - 558,248 22,093,153 - 22,093,153 1,553,336 - 1,553,336 22,093,153 - 22,093,153 Market value of securities held as collateral as at September 30, 2019 amounted to Rs. 1,551,639
thousand (December 31, 2018: Rs. 21,350,630 thousand). These carry mark-up at rate ranging from 13.50% to 13.75% per annum (December 31, 2018: 10.00% to 10.50% per annum) with maturities upto November 22, 2019.
9.3 These carry profit rates ranging from 12.54% to 13.75% per annum (December 31, 2018: 9.00%
to 9.80% per annum) with maturities upto November 25, 2019.
10. INVESTMENTS - NET
10.1 Investmentsbytype: (Un-audited) (Audited) September 30, 2019 December 31, 2018
Cost/ Provision Surplus/ Carrying Cost / Provision Surplus / Carrying Amortized for (Deficit) value Amortized for (Deficit) value cost diminution cost diminution
Note R u p e e s i n ‘ 0 0 0 ’Held-for-tradingsecurities Federal government securities 10.1.1 7,093,556 - 26,044 7,119,600 25,075,868 - (1,892) 25,073,976 Ordinary shares 14,561 - (578) 13,983 12,630 - (1,849) 10,781
7,108,117 - 25,466 7,133,583 25,088,498 - (3,741) 25,084,757 Available-for-salesecurities Federal government securities 10.1.1 & 10.2 297,778,844 - 1,112,416 298,891,260 177,736,092 - (44,199) 177,691,893 Shares and certificates 2,817,524 (1,199,909) (110,030) 1,507,585 2,136,937 (1,024,880) 24,614 1,136,671 Non government debt securities 9,954,737 (2,297,964) 1,716 7,658,489 8,119,488 (2,236,623) 2,094 5,884,959 Foreign securities 4,019 - - 4,019 4,019 - - 4,019
310,555,124 (3,497,873) 1,004,102 308,061,353 187,996,536 (3,261,503) (17,491) 184,717,542 Held-to-maturitysecurities Federal government securities 10.1.1 & 10.4 47,298,469 - - 47,298,469 250,329 - - 250,329 WAPDA bonds 400 (400) - - 400 (400) - -
47,298,869 (400) - 47,298,469 250,729 (400) - 250,329 Totalinvestments 364,962,110 (3,498,273) 1,029,568 362,493,405 213,335,763 (3,261,903) (21,232) 210,052,628
10.1.1 Market treasury bills and Pakistan investment bonds are eligible for re-discounting with SBP. 10.1.2 Certain approved / Government securities are kept with the SBP to meet statutory liquidity
requirements calculated on the basis of domestic demand and time liabilities.

BOP Third Quarterly Report January - September 201960
(Un-audited) (Audited) September 30, December 31, 2019 2018 Rupees in ‘000’ 10.2 Investmentsgivenascollateral Pakistan investment bonds 19,583,293 - Market treasury bills 72,421,129 19,829,188 92,004,422 19,829,188
10.3 Provisionfordiminutioninvalueofinvestments 10.3.1 Opening balance 3,261,903 3,014,149 Charge / reversals : Charge for the period / year 256,070 247,754 Reversals for the period / year (1,498) -
254,572 247,754 Reversal on disposal during the period / year (18,202) - Closing balance 3,498,273 3,261,903
10.3.2 Particularsofprovisionagainstdebtsecurities Categoryofclassification (Un-audited) (Audited) September 30, 2019 December 31, 2018 NPI Provision NPI Provision Rupees in ‘000’ Domestic Other assets especially mentioned - - - - Substandard 3 08,606 62,839 - - Doubtful - - - - Loss 2,235,525 2,235,525 2,237,023 2,237,023 Total 2,544,131 2,298,364 2,237,023 2,237,023 10.4 Market value of held to maturity investments amounted to Rs. 48,594,718 thousand (December 31,
2018: Rs. 248,902 thousand).
11. ADVANCES - NET
Performing NonPerforming Total
(Un-audited) (Audited) (Un-audited) (Audited) (Un-audited) (Audited) September 30, December 31, September 30, December 31, September 30, December 31, 2019 2018 2019 2018 2019 2018
Rupees in ‘000’ Loans, cash credits, running finances, etc. 315,622,904 324,935,141 50,578,984 49,471,677 366,201,888 374,406,818 Net book value of assets in ijarah under IFAS 2 - In Pakistan 1,575,358 337,920 216,404 215,000 1,791,762 552,920 Islamic financing and related assets 24,322,065 19,584,952 1,650,521 76,882 25,972,586 19,661,834 Bills discounted and purchased 22,984,826 31,583,488 16,992 16,992 23,001,818 31,600,480
Advances - gross 364,505,153 376,441,501 52,462,901 49,780,551 416,968,054 426,222,052 Provision against advances: - Specific - - (44,798,298) (43,763,990) (44,798,298) (43,763,990) - General (393,927) (348,299) - - (393,927) (348,299)
(393,927) (348,299) (44,798,298) (43,763,990) (45,192,225) (44,112,289)
Advances - net of provision 364,111,226 376,093,202 7,664,603 6,016,561 371,775,829 382,109,763

BOPThird Quarterly Report January - September 2019 61
(Un-audited) (Audited) September 30, December 31, 2019 2018 Rupees in ‘000’ 11.1 Particularsofadvances(gross) In local currency 416,843,518 426,076,906 In foreign currencies 124,536 145,146 416,968,054 426,222,052
11.2 Advances include Rs. 52,245,097 thousand (December 31, 2018: Rs. 49,385,062 thousand) which have been placed under non-performing status as detailed below:
(Un-audited) (Audited) September 30, 2019 December 31, 2018 Non Non Categoryofclassification performing Provision performing Provision loans loans Rupees in ‘000’ Domestic Other assets especially mentioned 1,698,399 8,208 52,234 801 Substandard 1,338,212 123,578 351,004 65,741 Doubtful 7,895,795 4,651,210 9,722,789 5,247,064 Loss 41,530,495 40,015,302 39,654,524 38,450,384 Total 52,462,901 44,798,298 49,780,551 43,763,990
11.3 Particularsofprovisionagainstadvances September 30, 2019 (Un-audited) December 31, 2018 (Audited)
Specific General Total Specific General Total
Rupees in ‘000’ Opening balance 43,763,990 348,299 44,112,289 45,842,665 425,283 46,267,948 Charge for the period / year 3,146,080 45,628 3,191,708 2,364,557 - 2,364,557 Reversals for the period / year (2,110,720) (2,110,720) (4,436,831) (76,984) (4,513,815) 1,035,360 45,628 1,080,988 (2,072,274) (76,984) (2,149,258) Amounts written off (1,052) - (1,052) (6,401) - (6,401)
Closing balance 44,798,298 393,927 45,192,225 43,763,990 348,299 44,112,289
11.3.1 Particularsofprovisionagainst advanceswithrespecttocurrencies
In local currency 44,798,298 393,927 45,192,225 43,763,990 348,299 44,112,289 In foreign currencies - - - - - -
44,798,298 393,927 45,192,225 43,763,990 348,299 44,112,289
11.3.2 General provision represents provision against consumer financing portfolio as required by Prudential Regulations issued by the SBP.
11.3.3 The Bank has availed the benefit of Forced Sale Value (FSV) of collateral against non-performing
advances as allowed vide BSD Circular No.1 dated October 21, 2011. This has resulted in decrease in provision against non-performing advances by Rs. 2,255,225 thousand (December 31, 2018: Rs 1,186,127 thousand). The FSV benefit availed is not available for cash or stock dividend.
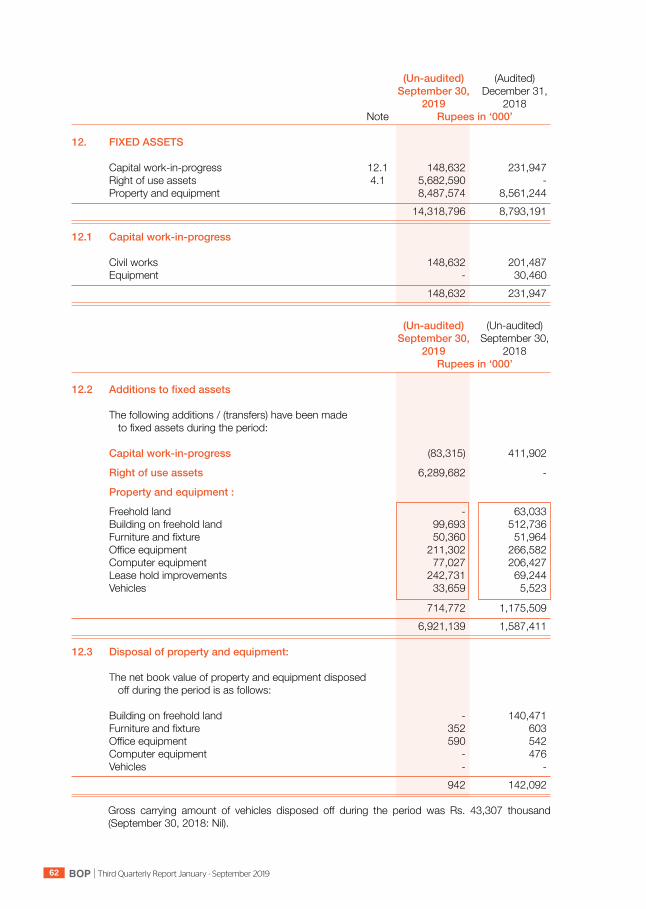
BOP Third Quarterly Report January - September 201962
(Un-audited) (Audited) September 30, December 31, 2019 2018 Note Rupees in ‘000’ 12. FIXED ASSETS Capital work-in-progress 12.1 148,632 231,947 Right of use assets 4.1 5,682,590 - Property and equipment 8,487,574 8,561,244 14,318,796 8,793,191
12.1 Capitalwork-in-progress Civil works 148,632 201,487 Equipment - 30,460 148,632 231,947
(Un-audited) (Un-audited) September 30, September 30, 2019 2018 Rupees in ‘000’
12.2 Additionstofixedassets The following additions / (transfers) have been made to fixed assets during the period: Capitalwork-in-progress (83,315) 411,902 Rightofuseassets 6,289,682 - Propertyandequipment: Freehold land - 63,033 Building on freehold land 99,693 512,736 Furniture and fixture 50,360 51,964 Office equipment 211,302 266,582 Computer equipment 77,027 206,427 Lease hold improvements 242,731 69,244 Vehicles 33,659 5,523
714,772 1,175,509 6,921,139 1,587,411 12.3 Disposalofpropertyandequipment: The net book value of property and equipment disposed off during the period is as follows: Building on freehold land - 140,471 Furniture and fixture 352 603 Office equipment 590 542 Computer equipment - 476 Vehicles - - 942 142,092 Gross carrying amount of vehicles disposed off during the period was Rs. 43,307 thousand
(September 30, 2018: Nil).
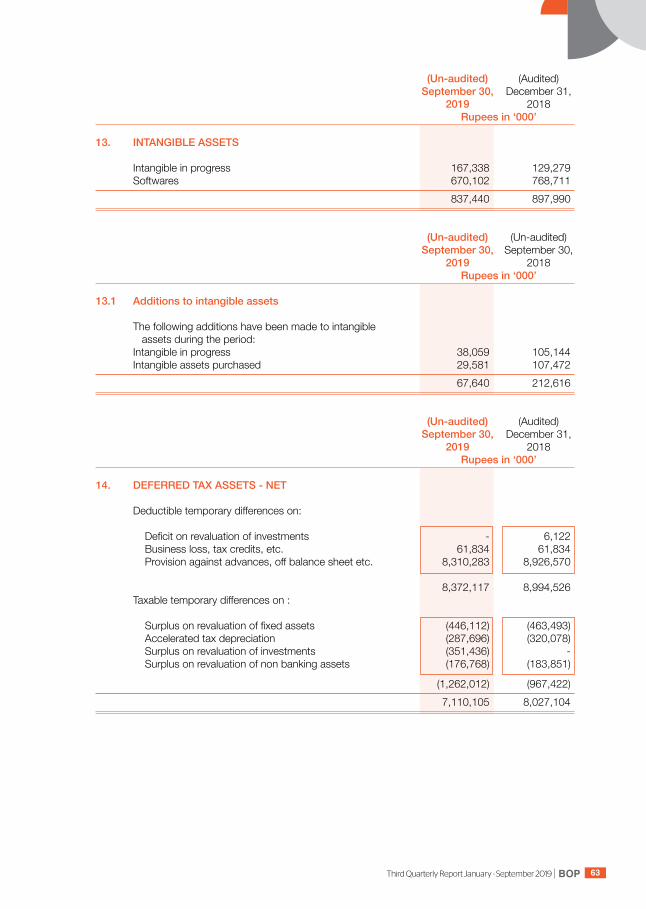
BOPThird Quarterly Report January - September 2019 63
(Un-audited) (Audited) September 30, December 31, 2019 2018 Rupees in ‘000’
13. INTANGIBLE ASSETS Intangible in progress 167,338 129,279 Softwares 670,102 768,711 837,440 897,990
(Un-audited) (Un-audited) September 30, September 30, 2019 2018 Rupees in ‘000’
13.1 Additionstointangibleassets The following additions have been made to intangible assets during the period: Intangible in progress 38,059 105,144 Intangible assets purchased 29,581 107,472 67,640 212,616
(Un-audited) (Audited) September 30, December 31, 2019 2018 Rupees in ‘000’
14. DEFERRED TAX ASSETS - NET Deductible temporary differences on: Deficit on revaluation of investments - 6,122 Business loss, tax credits, etc. 61,834 61,834 Provision against advances, off balance sheet etc. 8,310,283 8,926,570
8,372,117 8,994,526 Taxable temporary differences on : Surplus on revaluation of fixed assets (446,112) (463,493) Accelerated tax depreciation (287,696) (320,078) Surplus on revaluation of investments (351,436) - Surplus on revaluation of non banking assets (176,768) (183,851)
(1,262,012) (967,422) 7,110,105 8,027,104
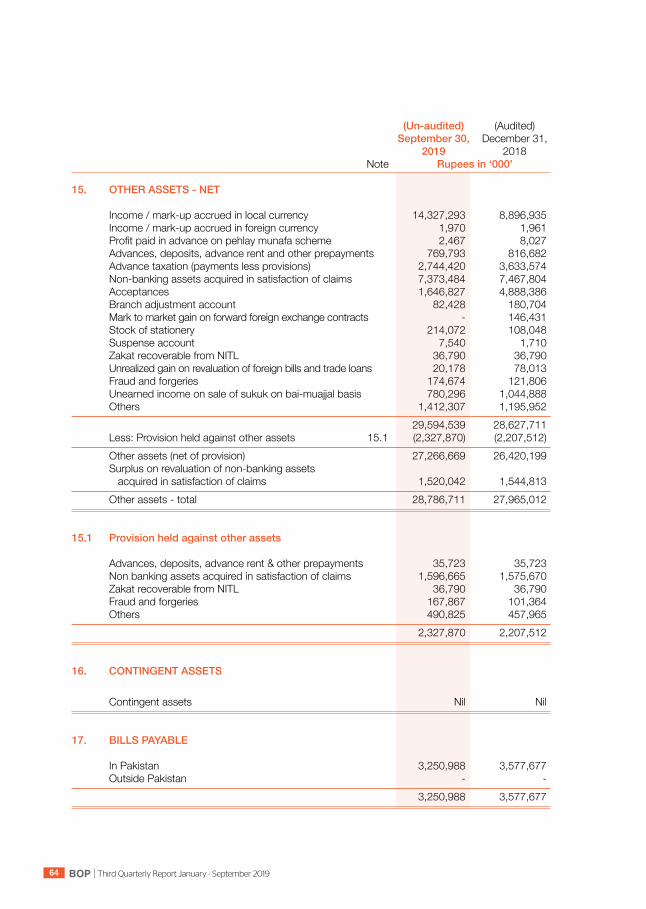
BOP Third Quarterly Report January - September 201964
(Un-audited) (Audited) September 30, December 31, 2019 2018 Note Rupees in ‘000’
15. OTHER ASSETS - NET Income / mark-up accrued in local currency 14,327,293 8,896,935 Income / mark-up accrued in foreign currency 1,970 1,961 Profit paid in advance on pehlay munafa scheme 2,467 8,027 Advances, deposits, advance rent and other prepayments 769,793 816,682 Advance taxation (payments less provisions) 2,744,420 3,633,574 Non-banking assets acquired in satisfaction of claims 7,373,484 7,467,804 Acceptances 1,646,827 4,888,386 Branch adjustment account 82,428 180,704 Mark to market gain on forward foreign exchange contracts - 146,431 Stock of stationery 214,072 108,048 Suspense account 7,540 1,710 Zakat recoverable from NITL 36,790 36,790 Unrealized gain on revaluation of foreign bills and trade loans 20,178 78,013 Fraud and forgeries 174,674 121,806 Unearned income on sale of sukuk on bai-muajjal basis 780,296 1,044,888 Others 1,412,307 1,195,952 29,594,539 28,627,711 Less: Provision held against other assets 15.1 (2,327,870) (2,207,512) Other assets (net of provision) 27,266,669 26,420,199 Surplus on revaluation of non-banking assets acquired in satisfaction of claims 1,520,042 1,544,813 Other assets - total 28,786,711 27,965,012
15.1 Provisionheldagainstotherassets Advances, deposits, advance rent & other prepayments 35,723 35,723 Non banking assets acquired in satisfaction of claims 1,596,665 1,575,670 Zakat recoverable from NITL 36,790 36,790 Fraud and forgeries 167,867 101,364 Others 490,825 457,965 2,327,870 2,207,512
16. CONTINGENT ASSETS Contingent assets Nil Nil
17. BILLS PAYABLE In Pakistan 3,250,988 3,577,677 Outside Pakistan - - 3,250,988 3,577,677
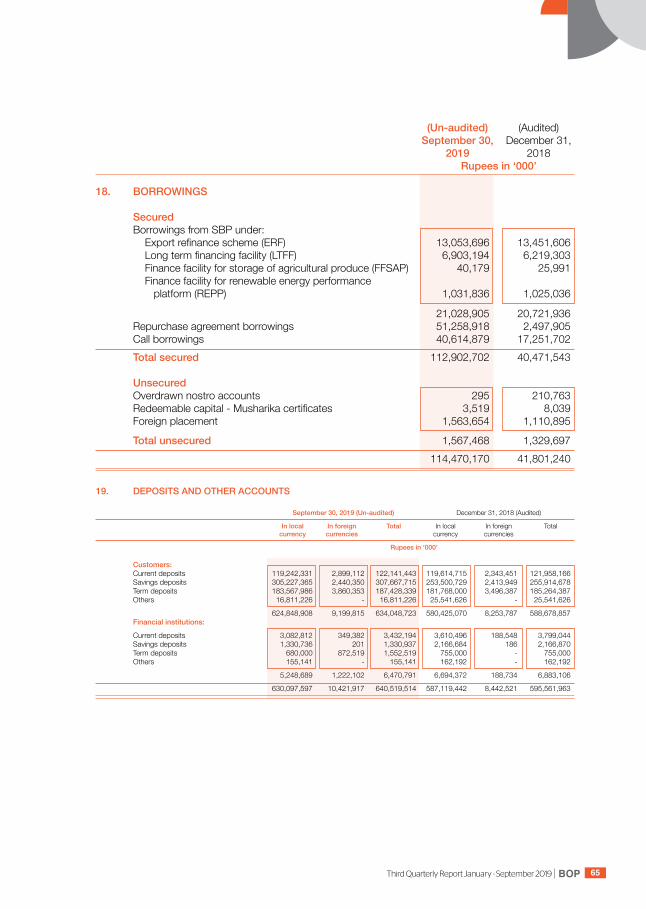
BOPThird Quarterly Report January - September 2019 65
(Un-audited) (Audited) September 30, December 31, 2019 2018 Rupees in ‘000’
18. BORROWINGS Secured Borrowings from SBP under: Export refinance scheme (ERF) 13,053,696 13,451,606 Long term financing facility (LTFF) 6,903,194 6,219,303 Finance facility for storage of agricultural produce (FFSAP) 40,179 25,991 Finance facility for renewable energy performance platform (REPP) 1,031,836 1,025,036
21,028,905 20,721,936 Repurchase agreement borrowings 51,258,918 2,497,905 Call borrowings 40,614,879 17,251,702 Totalsecured 112,902,702 40,471,543 Unsecured Overdrawn nostro accounts 295 210,763 Redeemable capital - Musharika certificates 3,519 8,039 Foreign placement 1,563,654 1,110,895
Totalunsecured 1,567,468 1,329,697 114,470,170 41,801,240
19. DEPOSITS AND OTHER ACCOUNTS
September 30, 2019 (Un-audited) December 31, 2018 (Audited)
Inlocal Inforeign Total In local In foreign Total currency currencies currency currencies
Rupees in ‘000’ Customers: Current deposits 119,242,331 2,899,112 122,141,443 119,614,715 2,343,451 121,958,166 Savings deposits 305,227,365 2,440,350 307,667,715 253,500,729 2,413,949 255,914,678 Term deposits 183,567,986 3,860,353 187,428,339 181,768,000 3,496,387 185,264,387 Others 16,811,226 - 16,811,226 25,541,626 - 25,541,626
624,848,908 9,199,815 634,048,723 580,425,070 8,253,787 588,678,857 Financialinstitutions:
Current deposits 3,082,812 349,382 3,432,194 3,610,496 188,548 3,799,044 Savings deposits 1,330,736 201 1,330,937 2,166,684 186 2,166,870 Term deposits 680,000 872,519 1,552,519 755,000 - 755,000 Others 155,141 - 155,141 162,192 - 162,192
5,248,689 1,222,102 6,470,791 6,694,372 188,734 6,883,106
630,097,597 10,421,917 640,519,514 587,119,442 8,442,521 595,561,963
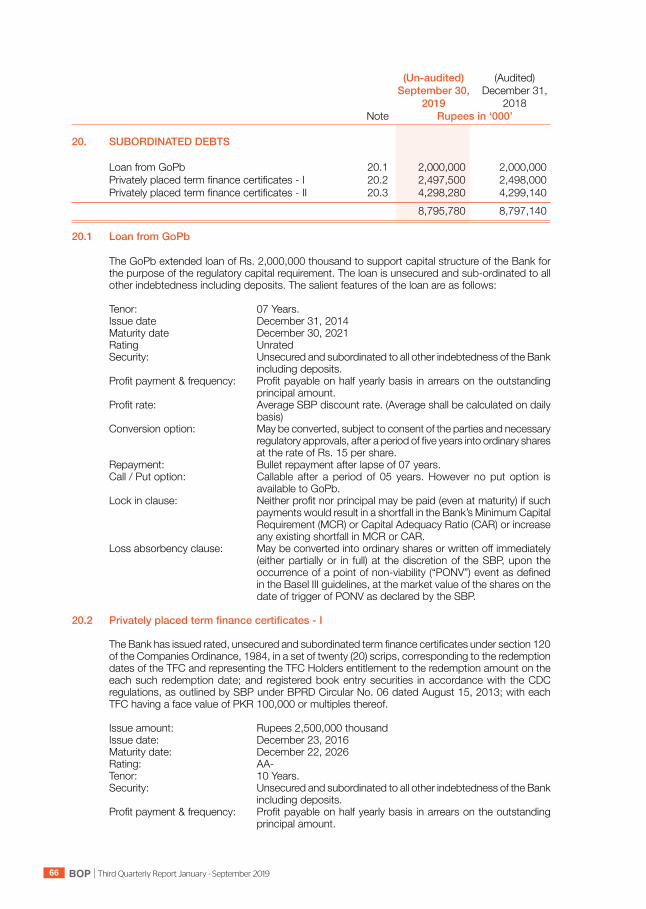
BOP Third Quarterly Report January - September 201966
(Un-audited) (Audited) September 30, December 31, 2019 2018 Note Rupees in ‘000’
20. SUBORDINATED DEBTS Loan from GoPb 20.1 2,000,000 2,000,000 Privately placed term finance certificates - I 20.2 2,497,500 2,498,000 Privately placed term finance certificates - II 20.3 4,298,280 4,299,140 8,795,780 8,797,140
20.1 LoanfromGoPb The GoPb extended loan of Rs. 2,000,000 thousand to support capital structure of the Bank for
the purpose of the regulatory capital requirement. The loan is unsecured and sub-ordinated to all other indebtedness including deposits. The salient features of the loan are as follows:
Tenor: 07 Years. Issue date December 31, 2014 Maturity date December 30, 2021 Rating Unrated Security: Unsecured and subordinated to all other indebtedness of the Bank
including deposits. Profit payment & frequency: Profit payable on half yearly basis in arrears on the outstanding
principal amount. Profit rate: Average SBP discount rate. (Average shall be calculated on daily
basis) Conversion option: May be converted, subject to consent of the parties and necessary
regulatory approvals, after a period of five years into ordinary shares at the rate of Rs. 15 per share.
Repayment: Bullet repayment after lapse of 07 years. Call / Put option: Callable after a period of 05 years. However no put option is
available to GoPb. Lock in clause: Neither profit nor principal may be paid (even at maturity) if such
payments would result in a shortfall in the Bank’s Minimum Capital Requirement (MCR) or Capital Adequacy Ratio (CAR) or increase any existing shortfall in MCR or CAR.
Loss absorbency clause: May be converted into ordinary shares or written off immediately (either partially or in full) at the discretion of the SBP, upon the occurrence of a point of non-viability (“PONV”) event as defined in the Basel III guidelines, at the market value of the shares on the date of trigger of PONV as declared by the SBP.
20.2 Privatelyplacedtermfinancecertificates-I The Bank has issued rated, unsecured and subordinated term finance certificates under section 120
of the Companies Ordinance, 1984, in a set of twenty (20) scrips, corresponding to the redemption dates of the TFC and representing the TFC Holders entitlement to the redemption amount on the each such redemption date; and registered book entry securities in accordance with the CDC regulations, as outlined by SBP under BPRD Circular No. 06 dated August 15, 2013; with each TFC having a face value of PKR 100,000 or multiples thereof.
Issue amount: Rupees 2,500,000 thousand Issue date: December 23, 2016 Maturity date: December 22, 2026 Rating: AA- Tenor: 10 Years. Security: Unsecured and subordinated to all other indebtedness of the Bank
including deposits. Profit payment & frequency: Profit payable on half yearly basis in arrears on the outstanding
principal amount.
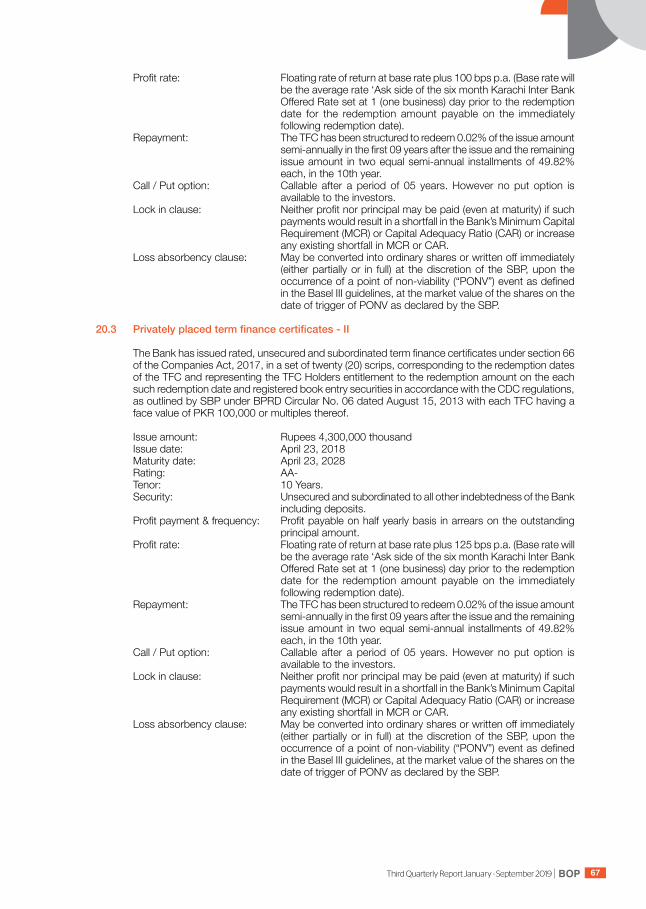
BOPThird Quarterly Report January - September 2019 67
Profit rate: Floating rate of return at base rate plus 100 bps p.a. (Base rate will be the average rate ‘Ask side of the six month Karachi Inter Bank Offered Rate set at 1 (one business) day prior to the redemption date for the redemption amount payable on the immediately following redemption date).
Repayment: The TFC has been structured to redeem 0.02% of the issue amount semi-annually in the first 09 years after the issue and the remaining issue amount in two equal semi-annual installments of 49.82% each, in the 10th year.
Call / Put option: Callable after a period of 05 years. However no put option is available to the investors.
Lock in clause: Neither profit nor principal may be paid (even at maturity) if such payments would result in a shortfall in the Bank’s Minimum Capital Requirement (MCR) or Capital Adequacy Ratio (CAR) or increase any existing shortfall in MCR or CAR.
Loss absorbency clause: May be converted into ordinary shares or written off immediately (either partially or in full) at the discretion of the SBP, upon the occurrence of a point of non-viability (“PONV”) event as defined in the Basel III guidelines, at the market value of the shares on the date of trigger of PONV as declared by the SBP.
20.3 Privatelyplacedtermfinancecertificates-II The Bank has issued rated, unsecured and subordinated term finance certificates under section 66
of the Companies Act, 2017, in a set of twenty (20) scrips, corresponding to the redemption dates of the TFC and representing the TFC Holders entitlement to the redemption amount on the each such redemption date and registered book entry securities in accordance with the CDC regulations, as outlined by SBP under BPRD Circular No. 06 dated August 15, 2013 with each TFC having a face value of PKR 100,000 or multiples thereof.
Issue amount: Rupees 4,300,000 thousand Issue date: April 23, 2018 Maturity date: April 23, 2028 Rating: AA- Tenor: 10 Years. Security: Unsecured and subordinated to all other indebtedness of the Bank
including deposits. Profit payment & frequency: Profit payable on half yearly basis in arrears on the outstanding
principal amount. Profit rate: Floating rate of return at base rate plus 125 bps p.a. (Base rate will
be the average rate ‘Ask side of the six month Karachi Inter Bank Offered Rate set at 1 (one business) day prior to the redemption date for the redemption amount payable on the immediately following redemption date).
Repayment: The TFC has been structured to redeem 0.02% of the issue amount semi-annually in the first 09 years after the issue and the remaining issue amount in two equal semi-annual installments of 49.82% each, in the 10th year.
Call / Put option: Callable after a period of 05 years. However no put option is available to the investors.
Lock in clause: Neither profit nor principal may be paid (even at maturity) if such payments would result in a shortfall in the Bank’s Minimum Capital Requirement (MCR) or Capital Adequacy Ratio (CAR) or increase any existing shortfall in MCR or CAR.
Loss absorbency clause: May be converted into ordinary shares or written off immediately (either partially or in full) at the discretion of the SBP, upon the occurrence of a point of non-viability (“PONV”) event as defined in the Basel III guidelines, at the market value of the shares on the date of trigger of PONV as declared by the SBP.
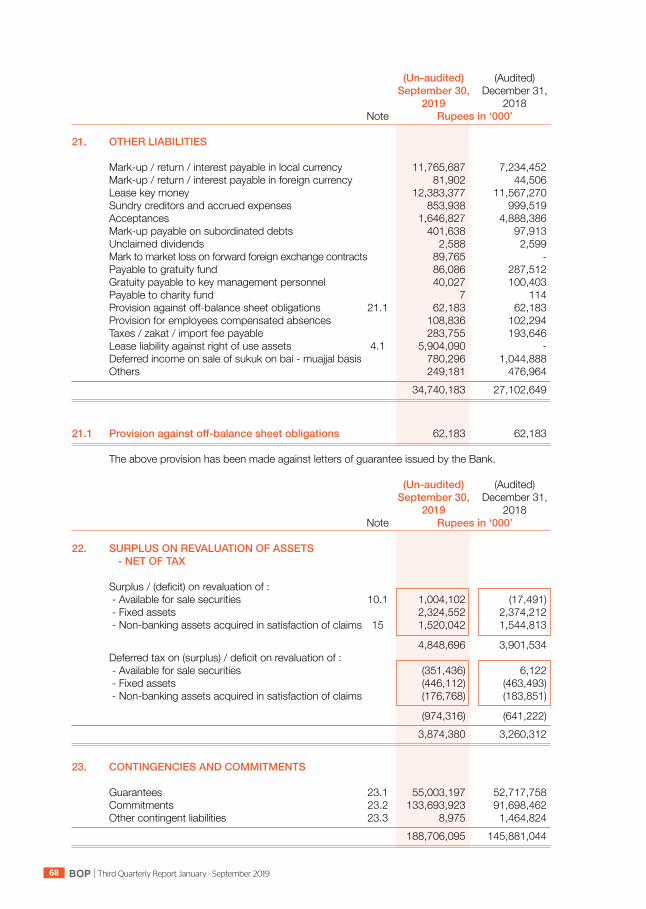
BOP Third Quarterly Report January - September 201968
(Un-audited) (Audited) September 30, December 31, 2019 2018 Note Rupees in ‘000’
21. OTHER LIABILITIES Mark-up / return / interest payable in local currency 11,765,687 7,234,452 Mark-up / return / interest payable in foreign currency 81,902 44,506 Lease key money 12,383,377 11,567,270 Sundry creditors and accrued expenses 853,938 999,519 Acceptances 1,646,827 4,888,386 Mark-up payable on subordinated debts 401,638 97,913 Unclaimed dividends 2,588 2,599 Mark to market loss on forward foreign exchange contracts 89,765 - Payable to gratuity fund 86,086 287,512 Gratuity payable to key management personnel 40,027 100,403 Payable to charity fund 7 114 Provision against off-balance sheet obligations 21.1 62,183 62,183 Provision for employees compensated absences 108,836 102,294 Taxes / zakat / import fee payable 283,755 193,646 Lease liability against right of use assets 4.1 5,904,090 - Deferred income on sale of sukuk on bai - muajjal basis 780,296 1,044,888 Others 249,181 476,964 34,740,183 27,102,649
21.1 Provisionagainstoff-balancesheetobligations 62,183 62,183 The above provision has been made against letters of guarantee issued by the Bank.
(Un-audited) (Audited) September 30, December 31, 2019 2018 Note Rupees in ‘000’
22. SURPLUS ON REVALUATION OF ASSETS - NET OF TAX Surplus / (deficit) on revaluation of : - Available for sale securities 10.1 1,004,102 (17,491) - Fixed assets 2,324,552 2,374,212 - Non-banking assets acquired in satisfaction of claims 15 1,520,042 1,544,813
4,848,696 3,901,534 Deferred tax on (surplus) / deficit on revaluation of : - Available for sale securities (351,436) 6,122 - Fixed assets (446,112) (463,493) - Non-banking assets acquired in satisfaction of claims (176,768) (183,851)
(974,316) (641,222) 3,874,380 3,260,312
23. CONTINGENCIES AND COMMITMENTS Guarantees 23.1 55,003,197 52,717,758 Commitments 23.2 133,693,923 91,698,462 Other contingent liabilities 23.3 8,975 1,464,824 188,706,095 145,881,044
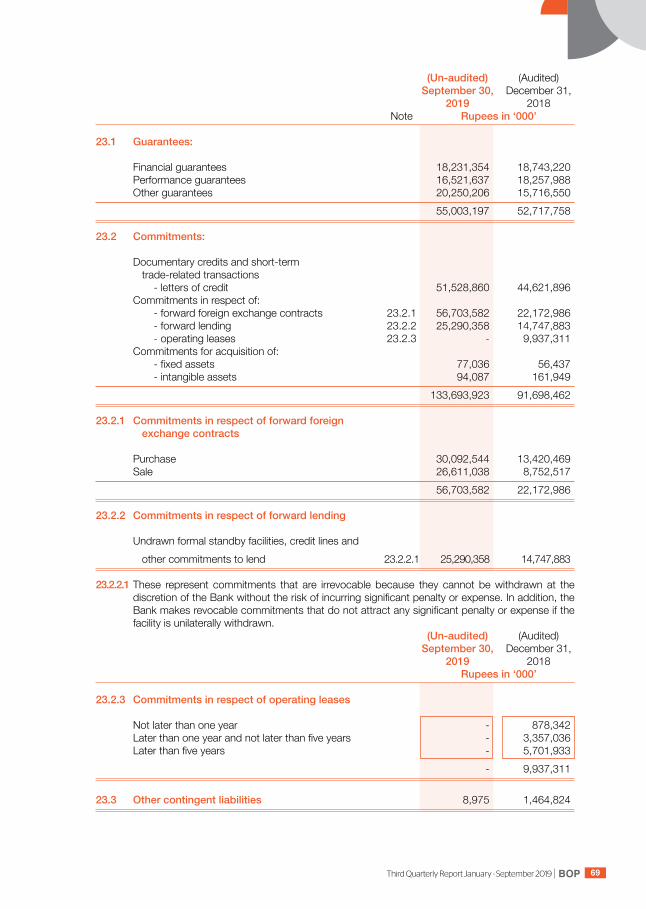
BOPThird Quarterly Report January - September 2019 69
(Un-audited) (Audited) September 30, December 31, 2019 2018 Note Rupees in ‘000’
23.1 Guarantees: Financial guarantees 18,231,354 18,743,220 Performance guarantees 16,521,637 18,257,988 Other guarantees 20,250,206 15,716,550 55,003,197 52,717,758 23.2 Commitments: Documentary credits and short-term trade-related transactions - letters of credit 51,528,860 44,621,896 Commitments in respect of: - forward foreign exchange contracts 23.2.1 56,703,582 22,172,986 - forward lending 23.2.2 25,290,358 14,747,883 - operating leases 23.2.3 - 9,937,311 Commitments for acquisition of: - fixed assets 77,036 56,437 - intangible assets 94,087 161,949 133,693,923 91,698,462 23.2.1 Commitmentsinrespectofforwardforeign exchangecontracts Purchase 30,092,544 13,420,469 Sale 26,611,038 8,752,517 56,703,582 22,172,986
23.2.2 Commitmentsinrespectofforwardlending Undrawn formal standby facilities, credit lines and other commitments to lend 23.2.2.1 25,290,358 14,747,883 23.2.2.1 These represent commitments that are irrevocable because they cannot be withdrawn at the
discretion of the Bank without the risk of incurring significant penalty or expense. In addition, the Bank makes revocable commitments that do not attract any significant penalty or expense if the facility is unilaterally withdrawn.
(Un-audited) (Audited) September 30, December 31, 2019 2018 Rupees in ‘000’
23.2.3 Commitmentsinrespectofoperatingleases
Not later than one year - 878,342 Later than one year and not later than five years - 3,357,036 Later than five years - 5,701,933 - 9,937,311 23.3 Othercontingentliabilities 8,975 1,464,824

BOP Third Quarterly Report January - September 201970
23.3.1 For the tax year 2007, the Income Tax Department concluded proceedings under section 161/205 and created a default of Rs. 8,975 thousand. The Bank filed appeal before CIR (A), however the same was not allowed. Now, the Bank has filled appeal against the said order of CIR (A) with ATIR. The expected tax liability for the said year amounts to Rs. 8,975 thousand. However, the management of the Bank, as per opinion of its tax consultant, is confident that the decision for the aforementioned tax year will be decided in Bank’s favor.
(Un-audited) (Audited) September 30, December 31, 2019 2018 Note Rupees in ‘000’ 23.4 ClaimsagainsttheBanknotacknowledgedasdebts 23.4.1 54,482,977 57,231,157 23.4.1 The amounts involved in the claims filed against the Bank are yet to be adjudicated by the concerned
Courts as the same have been filed as outburst to our recovery suits. Uptill now, in no case, any claim has been adjudicated, determined or decreed by the Courts against the Bank. Moreover, there is no likelihood of decreeing the suits against the Bank because, the claims are frivolous.
(Un-audited) (Un-audited) September 30, September 30, 2019 2018 Note Rupees in ‘000’ 24. MARK-UP / RETURN / INTEREST EARNED a) On loans and advances 33,515,772 19,912,277 b) On investments: Available for sale securities 17,931,590 10,365,764 Held for trading securities 2,044,545 1,430,393 Held to maturity securities 1,375,759 15,447 c) On lendings to financial institutions: Securities purchased under resale agreements 1,865,124 409,476 Certificates of investment Call lending 2,062 27,278 Letters of placement 353,883 497,340 d) On balances with banks 99,078 26,032 57,187,813 32,684,007 25. MARK-UP / RETURN / INTEREST EXPENSED Deposits and other accounts 32,569,683 16,140,593 Borrowings: Securities sold under repurchase agreements 1,176,753 907,666 Foreign placements 42,231 - Call borrowings 1,844,913 728,540 SBP refinance borrowing 326,643 313,520 Subordinated debts: Mark-up on subordinated loan from GoPb 180,493 104,520 Mark-up on privately placed term finance certificates 617,073 295,424 Mark-up on lease liability against right of use assets 544,920 - 37,302,709 18,490,263
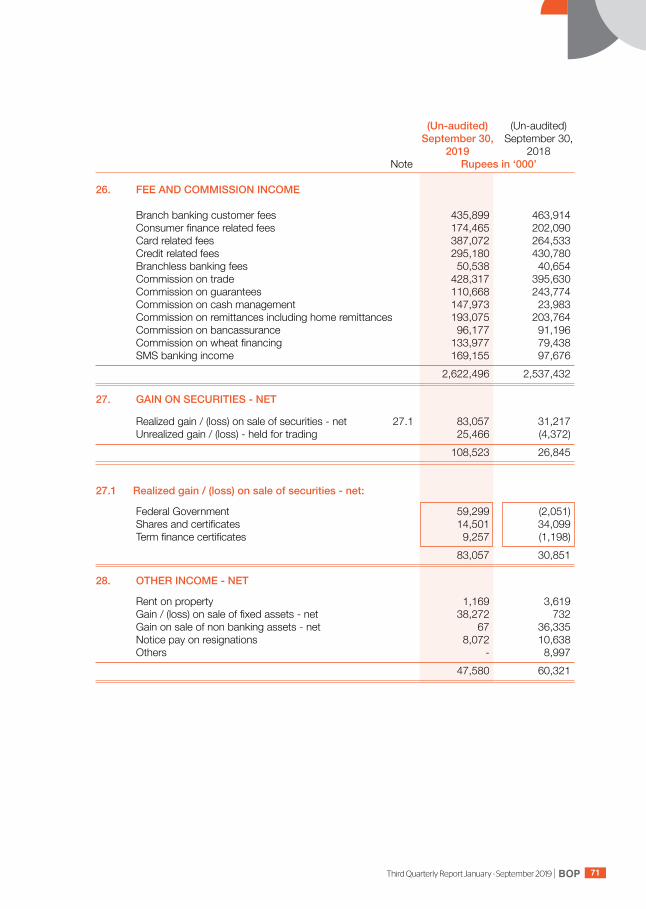
BOPThird Quarterly Report January - September 2019 71
(Un-audited) (Un-audited) September 30, September 30, 2019 2018 Note Rupees in ‘000’
26. FEE AND COMMISSION INCOME Branch banking customer fees 435,899 463,914 Consumer finance related fees 174,465 202,090 Card related fees 387,072 264,533 Credit related fees 295,180 430,780 Branchless banking fees 50,538 40,654 Commission on trade 428,317 395,630 Commission on guarantees 110,668 243,774 Commission on cash management 147,973 23,983 Commission on remittances including home remittances 193,075 203,764 Commission on bancassurance 96,177 91,196 Commission on wheat financing 133,977 79,438 SMS banking income 169,155 97,676 2,622,496 2,537,432 27. GAIN ON SECURITIES - NET Realized gain / (loss) on sale of securities - net 27.1 83,057 31,217 Unrealized gain / (loss) - held for trading 25,466 (4,372) 108,523 26,845
27.1 Realizedgain/(loss)onsaleofsecurities-net: Federal Government 59,299 (2,051) Shares and certificates 14,501 34,099 Term finance certificates 9,257 (1,198) 83,057 30,851
28. OTHERINCOME-NET Rent on property 1,169 3,619 Gain / (loss) on sale of fixed assets - net 38,272 732 Gain on sale of non banking assets - net 67 36,335 Notice pay on resignations 8,072 10,638 Others - 8,997 47,580 60,321
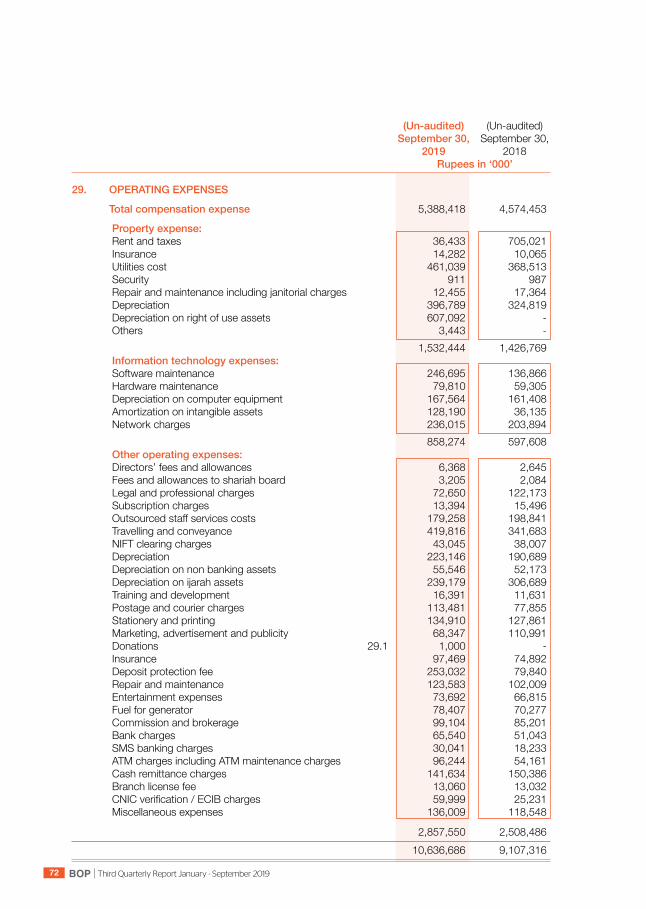
BOP Third Quarterly Report January - September 201972
(Un-audited) (Un-audited) September 30, September 30, 2019 2018 Rupees in ‘000’
29. OPERATING EXPENSES
Totalcompensationexpense 5,388,418 4,574,453
Propertyexpense: Rent and taxes 36,433 705,021 Insurance 14,282 10,065 Utilities cost 461,039 368,513 Security 911 987 Repair and maintenance including janitorial charges 12,455 17,364 Depreciation 396,789 324,819 Depreciation on right of use assets 607,092 - Others 3,443 - 1,532,444 1,426,769 Informationtechnologyexpenses: Software maintenance 246,695 136,866 Hardware maintenance 79,810 59,305 Depreciation on computer equipment 167,564 161,408 Amortization on intangible assets 128,190 36,135 Network charges 236,015 203,894 858,274 597,608 Otheroperatingexpenses: Directors’ fees and allowances 6,368 2,645 Fees and allowances to shariah board 3,205 2,084 Legal and professional charges 72,650 122,173 Subscription charges 13,394 15,496 Outsourced staff services costs 179,258 198,841 Travelling and conveyance 419,816 341,683 NIFT clearing charges 43,045 38,007 Depreciation 223,146 190,689 Depreciation on non banking assets 55,546 52,173 Depreciation on ijarah assets 239,179 306,689 Training and development 16,391 11,631 Postage and courier charges 113,481 77,855 Stationery and printing 134,910 127,861 Marketing, advertisement and publicity 68,347 110,991 Donations 29.1 1,000 - Insurance 97,469 74,892 Deposit protection fee 253,032 79,840 Repair and maintenance 123,583 102,009 Entertainment expenses 73,692 66,815 Fuel for generator 78,407 70,277 Commission and brokerage 99,104 85,201 Bank charges 65,540 51,043 SMS banking charges 30,041 18,233 ATM charges including ATM maintenance charges 96,244 54,161 Cash remittance charges 141,634 150,386 Branch license fee 13,060 13,032 CNIC verification / ECIB charges 59,999 25,231 Miscellaneous expenses 136,009 118,548
2,857,550 2,508,486 10,636,686 9,107,316
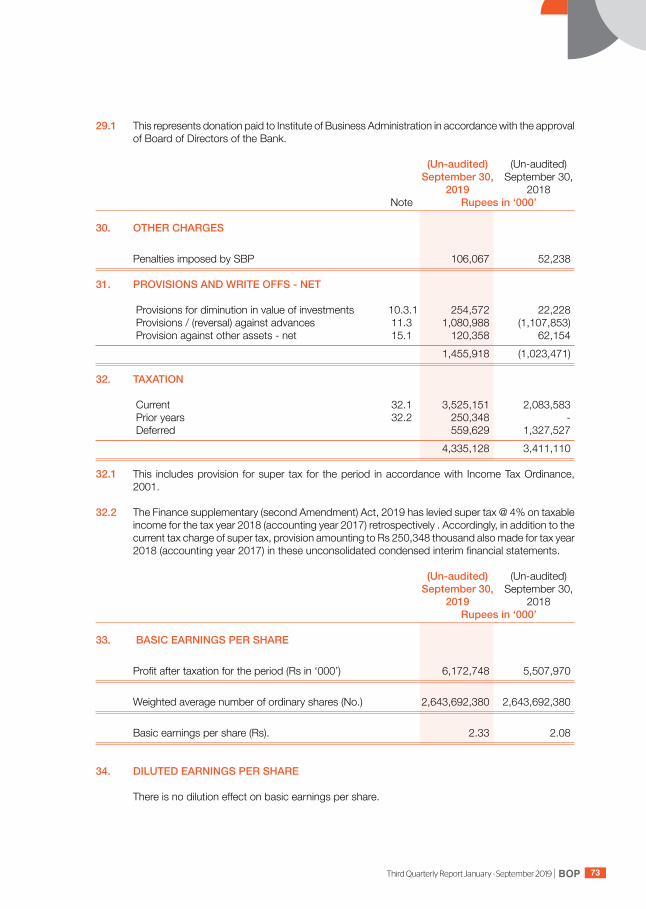
BOPThird Quarterly Report January - September 2019 73
29.1 This represents donation paid to Institute of Business Administration in accordance with the approval of Board of Directors of the Bank.
(Un-audited) (Un-audited) September 30, September 30, 2019 2018 Note Rupees in ‘000’
30. OTHER CHARGES Penalties imposed by SBP 106,067 52,238 31. PROVISIONS AND WRITE OFFS - NET Provisions for diminution in value of investments 10.3.1 254,572 22,228 Provisions / (reversal) against advances 11.3 1,080,988 (1,107,853) Provision against other assets - net 15.1 120,358 62,154 1,455,918 (1,023,471) 32. TAXATION Current 32.1 3,525,151 2,083,583 Prior years 32.2 250,348 - Deferred 559,629 1,327,527 4,335,128 3,411,110 32.1 This includes provision for super tax for the period in accordance with Income Tax Ordinance,
2001. 32.2 The Finance supplementary (second Amendment) Act, 2019 has levied super tax @ 4% on taxable
income for the tax year 2018 (accounting year 2017) retrospectively . Accordingly, in addition to the current tax charge of super tax, provision amounting to Rs 250,348 thousand also made for tax year 2018 (accounting year 2017) in these unconsolidated condensed interim financial statements.
(Un-audited) (Un-audited) September 30, September 30, 2019 2018 Rupees in ‘000’
33. BASIC EARNINGS PER SHARE Profit after taxation for the period (Rs in ‘000’) 6,172,748 5,507,970 Weighted average number of ordinary shares (No.) 2,643,692,380 2,643,692,380 Basic earnings per share (Rs). 2.33 2.08
34. DILUTED EARNINGS PER SHARE There is no dilution effect on basic earnings per share.
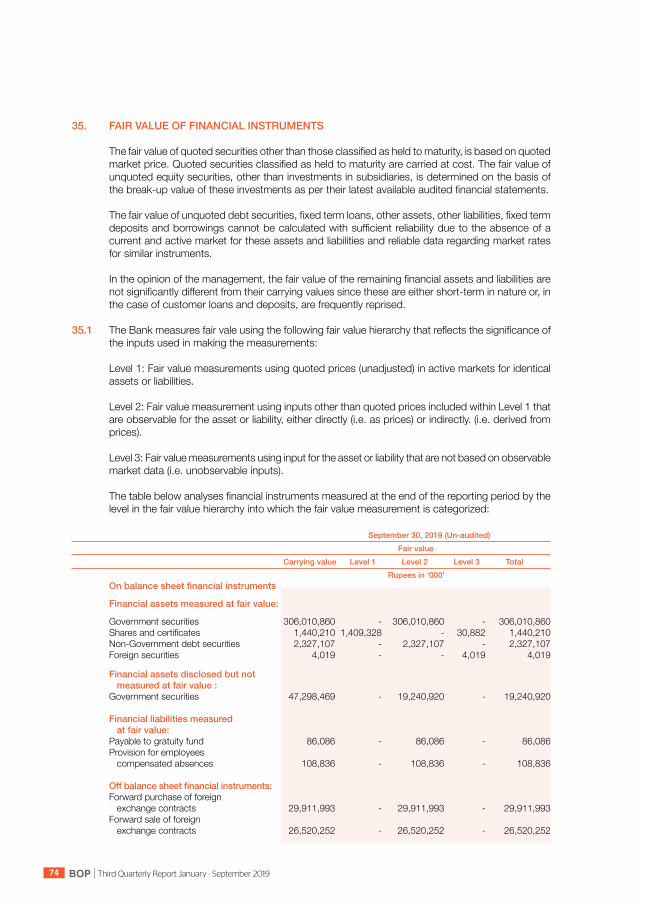
BOP Third Quarterly Report January - September 201974
35. FAIR VALUE OF FINANCIAL INSTRUMENTS The fair value of quoted securities other than those classified as held to maturity, is based on quoted
market price. Quoted securities classified as held to maturity are carried at cost. The fair value of unquoted equity securities, other than investments in subsidiaries, is determined on the basis of the break-up value of these investments as per their latest available audited financial statements.
The fair value of unquoted debt securities, fixed term loans, other assets, other liabilities, fixed term
deposits and borrowings cannot be calculated with sufficient reliability due to the absence of a current and active market for these assets and liabilities and reliable data regarding market rates for similar instruments.
In the opinion of the management, the fair value of the remaining financial assets and liabilities are
not significantly different from their carrying values since these are either short-term in nature or, in the case of customer loans and deposits, are frequently reprised.
35.1 The Bank measures fair vale using the following fair value hierarchy that reflects the significance of
the inputs used in making the measurements:
Level 1: Fair value measurements using quoted prices (unadjusted) in active markets for identical assets or liabilities.
Level 2: Fair value measurement using inputs other than quoted prices included within Level 1 that are observable for the asset or liability, either directly (i.e. as prices) or indirectly. (i.e. derived from prices).
Level 3: Fair value measurements using input for the asset or liability that are not based on observable market data (i.e. unobservable inputs).
The table below analyses financial instruments measured at the end of the reporting period by the level in the fair value hierarchy into which the fair value measurement is categorized:
September 30, 2019 (Un-audited) Fairvalue Carryingvalue Level1 Level2 Level3 Total Rupees in ‘000’ Onbalancesheetfinancialinstruments Financialassetsmeasuredatfairvalue: Government securities 306,010,860 - 306,010,860 - 306,010,860 Shares and certificates 1,440,210 1,409,328 - 30,882 1,440,210 Non-Government debt securities 2,327,107 - 2,327,107 - 2,327,107 Foreign securities 4,019 - - 4,019 4,019 Financialassetsdisclosedbutnot measuredatfairvalue: Government securities 47,298,469 - 19,240,920 - 19,240,920 Financial liabilities measured atfairvalue: Payable to gratuity fund 86,086 - 86,086 - 86,086 Provision for employees compensated absences 108,836 - 108,836 - 108,836 Offbalancesheetfinancialinstruments: Forward purchase of foreign exchange contracts 29,911,993 - 29,911,993 - 29,911,993 Forward sale of foreign exchange contracts 26,520,252 - 26,520,252 - 26,520,252

BOPThird Quarterly Report January - September 2019 75
December 31, 2018 (Audited) Fair value Carrying value Level 1 Level 2 Level 3 Total Rupees in ‘000’
Onbalancesheetfinancialinstruments Financialassetsmeasuredatfairvalue: Government securities 202,765,869 - 202,765,869 - 202,765,869 Shares and certificates 1,066,094 1,050,104 - 15,990 1,066,094 Non-Government debt securities 852,320 - 852,320 - 852,320 Foreign securities 4,019 - - 4,019 4,019 Financialassetsdisclosedbutnot measuredatfairvalue: Government securities 250,329 - 248,902 - 248,902 Financial liabilities measured atfairvalue: Payable to gratuity fund 287,512 - 287,512 - 287,512 Provision for employees compensated absences 102,294 - 102,294 - 102,294 Offbalancesheetfinancialinstruments: Forward purchase of foreign exchange contracts 13,823,439 - 13,823,439 - 13,823,439 Forward sale of foreign exchange contracts 9,009,056 - 9,009,056 - 9,009,056 35.2 Fairvalueofnonfinancialassets September 30, 2019 (Un-audited) Fairvalue Carryingvalue Level1 Level2 Level3 Total Rupees in ‘000’ NonFinancialassetsmeasured atfairvalue: Fixed assets (land & building) 5,875,221 - 5,875,221 - 5,875,221 Non banking assets acquired in satisfaction of claims 7,296,861 - 7,296,861 - 7,296,861 December 31, 2018 (Audited) Fair value Carrying value Level 1 Level 2 Level 3 Total Rupees in ‘000’ NonFinancialassetsmeasured atfairvalue: Fixed assets (land & building) 5,912,918 - 5,912,918 - 5,912,918 Non banking assets acquired in satisfaction of claims 7,436,947 - 7,436,947 - 7,436,947
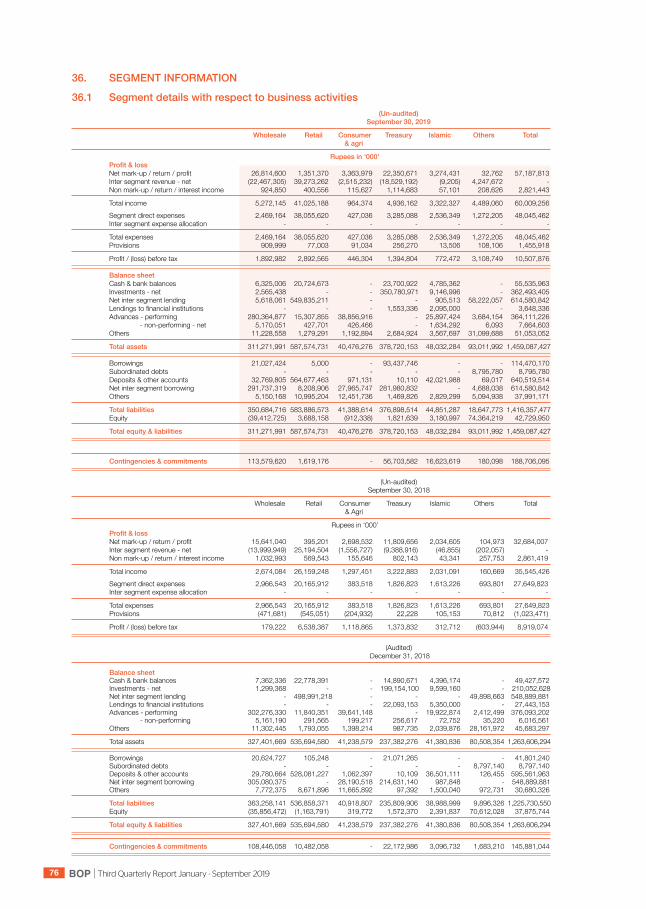
BOP Third Quarterly Report January - September 201976
36. SEGMENT INFORMATION
36.1 Segmentdetailswithrespecttobusinessactivities (Un-audited) September 30, 2019
Wholesale Retail Consumer Treasury Islamic Others Total & agri
Rupees in ‘000’ Profit&loss Net mark-up / return / profit 26,814,600 1,351,370 3,363,979 22,350,671 3,274,431 32,762 57,187,813 Inter segment revenue - net (22,467,305) 39,273,262 (2,515,232) (18,529,192) (9,205) 4,247,672 - Non mark-up / return / interest income 924,850 400,556 115,627 1,114,683 57,101 208,626 2,821,443
Total income 5,272,145 41,025,188 964,374 4,936,162 3,322,327 4,489,060 60,009,256 Segment direct expenses 2,469,164 38,055,620 427,036 3,285,088 2,536,349 1,272,205 48,045,462 Inter segment expense allocation - - - - - - -
Total expenses 2,469,164 38,055,620 427,036 3,285,088 2,536,349 1,272,205 48,045,462 Provisions 909,999 77,003 91,034 256,270 13,506 108,106 1,455,918
Profit / (loss) before tax 1,892,982 2,892,565 446,304 1,394,804 772,472 3,108,749 10,507,876 Balance sheet Cash & bank balances 6,325,006 20,724,673 - 23,700,922 4,785,362 - 55,535,963 Investments - net 2,565,438 - - 350,780,971 9,146,996 - 362,493,405 Net inter segment lending 5,618,061 549,835,211 - - 905,513 58,222,057 614,580,842 Lendings to financial institutions - - - 1,553,336 2,095,000 - 3,648,336 Advances - performing 280,364,877 15,307,855 38,856,916 - 25,897,424 3,684,154 364,111,226 - non-performing - net 5,170,051 427,701 426,466 - 1,634,292 6,093 7,664,603 Others 11,228,558 1,279,291 1,192,894 2,684,924 3,567,697 31,099,688 51,053,052
Totalassets 311,271,991 587,574,731 40,476,276 378,720,153 48,032,284 93,011,992 1,459,087,427 Borrowings 21,027,424 5,000 - 93,437,746 - - 114,470,170 Subordinated debts - - - - - 8,795,780 8,795,780 Deposits & other accounts 32,769,805 564,677,463 971,131 10,110 42,021,988 69,017 640,519,514 Net inter segment borrowing 291,737,319 8,208,906 27,965,747 281,980,832 - 4,688,038 614,580,842 Others 5,150,168 10,995,204 12,451,736 1,469,826 2,829,299 5,094,938 37,991,171
Totalliabilities 350,684,716 583,886,573 41,388,614 376,898,514 44,851,287 18,647,773 1,416,357,477 Equity (39,412,725) 3,688,158 (912,338) 1,821,639 3,180,997 74,364,219 42,729,950
Totalequity&liabilities 311,271,991 587,574,731 40,476,276 378,720,153 48,032,284 93,011,992 1,459,087,427
Contingencies&commitments 113,579,620 1,619,176 - 56,703,582 16,623,619 180,098 188,706,095 (Un-audited) September 30, 2018
Wholesale Retail Consumer Treasury Islamic Others Total & Agri
Rupees in ‘000’ Profit&loss Net mark-up / return / profit 15,641,040 395,201 2,698,532 11,809,656 2,034,605 104,973 32,684,007 Inter segment revenue - net (13,999,949) 25,194,504 (1,556,727) (9,388,916) (46,855) (202,057) - Non mark-up / return / interest income 1,032,993 569,543 155,646 802,143 43,341 257,753 2,861,419
Total income 2,674,084 26,159,248 1,297,451 3,222,883 2,031,091 160,669 35,545,426 Segment direct expenses 2,966,543 20,165,912 383,518 1,826,823 1,613,226 693,801 27,649,823 Inter segment expense allocation - - - - - - -
Total expenses 2,966,543 20,165,912 383,518 1,826,823 1,613,226 693,801 27,649,823 Provisions (471,681) (545,051) (204,932) 22,228 105,153 70,812 (1,023,471)
Profit / (loss) before tax 179,222 6,538,387 1,118,865 1,373,832 312,712 (603,944) 8,919,074 (Audited) December 31, 2018
Balance sheet Cash & bank balances 7,362,336 22,778,391 - 14,890,671 4,396,174 - 49,427,572 Investments - net 1,299,368 - - 199,154,100 9,599,160 - 210,052,628 Net inter segment lending - 498,991,218 - - - 49,898,663 548,889,881 Lendings to financial institutions - - - 22,093,153 5,350,000 - 27,443,153 Advances - performing 302,276,330 11,840,351 39,641,148 - 19,922,874 2,412,499 376,093,202 - non-performing 5,161,190 291,565 199,217 256,617 72,752 35,220 6,016,561 Others 11,302,445 1,793,055 1,398,214 987,735 2,039,876 28,161,972 45,683,297
Total assets 327,401,669 535,694,580 41,238,579 237,382,276 41,380,836 80,508,354 1,263,606,294 Borrowings 20,624,727 105,248 - 21,071,265 - - 41,801,240 Subordinated debts - - - - - 8,797,140 8,797,140 Deposits & other accounts 29,780,664 528,081,227 1,062,397 10,109 36,501,111 126,455 595,561,963 Net inter segment borrowing 305,080,375 - 28,190,518 214,631,140 987,848 - 548,889,881 Others 7,772,375 8,671,896 11,665,892 97,392 1,500,040 972,731 30,680,326
Totalliabilities 363,258,141 536,858,371 40,918,807 235,809,906 38,988,999 9,896,326 1,225,730,550 Equity (35,856,472) (1,163,791) 319,772 1,572,370 2,391,837 70,612,028 37,875,744
Totalequity&liabilities 327,401,669 535,694,580 41,238,579 237,382,276 41,380,836 80,508,354 1,263,606,294
Contingencies&commitments 108,446,058 10,482,058 - 22,172,986 3,096,732 1,683,210 145,881,044
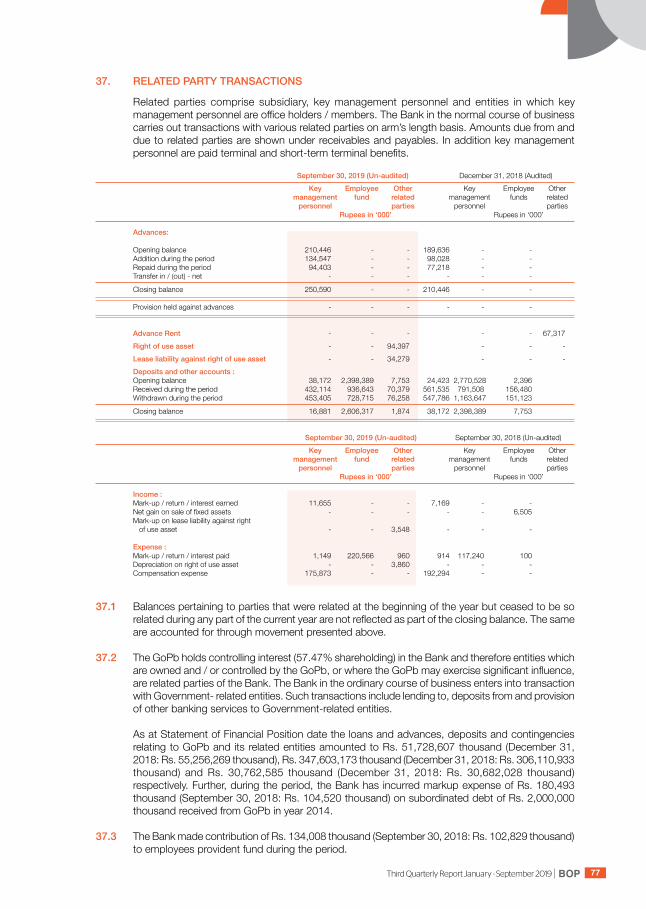
BOPThird Quarterly Report January - September 2019 77
37. RELATED PARTY TRANSACTIONS Related parties comprise subsidiary, key management personnel and entities in which key
management personnel are office holders / members. The Bank in the normal course of business carries out transactions with various related parties on arm’s length basis. Amounts due from and due to related parties are shown under receivables and payables. In addition key management personnel are paid terminal and short-term terminal benefits.
September 30, 2019 (Un-audited) December 31, 2018 (Audited) Key Employee Other Key Employee Other management fund related management funds related personnel parties personnel parties Rupees in ‘000’ Rupees in ‘000’ Advances: Opening balance 210,446 - - 189,636 - - Addition during the period 134,547 - - 98,028 - - Repaid during the period 94,403 - - 77,218 - - Transfer in / (out) - net - - - - - -
Closing balance 250,590 - - 210,446 - - Provision held against advances - - - - - - AdvanceRent - - - - - 67,317 Rightofuseasset - - 94,397 - - - Leaseliabilityagainstrightofuseasset - - 34,279 - - - Depositsandotheraccounts: Opening balance 38,172 2,398,389 7,753 24,423 2,770,528 2,396 Received during the period 432,114 936,643 70,379 561,535 791,508 156,480 Withdrawn during the period 453,405 728,715 76,258 547,786 1,163,647 151,123
Closing balance 16,881 2,606,317 1,874 38,172 2,398,389 7,753
September 30, 2019 (Un-audited) September 30, 2018 (Un-audited) Key Employee Other Key Employee Other management fund related management funds related personnel parties personnel parties Rupees in ‘000’ Rupees in ‘000’
Income: Mark-up / return / interest earned 11,655 - - 7,169 - - Net gain on sale of fixed assets - - - - - 6,505 Mark-up on lease liability against right of use asset - - 3,548 - - - Expense: Mark-up / return / interest paid 1,149 220,566 960 914 117,240 100 Depreciation on right of use asset - - 3,860 - - - Compensation expense 175,873 - - 192,294 - -
37.1 Balances pertaining to parties that were related at the beginning of the year but ceased to be so related during any part of the current year are not reflected as part of the closing balance. The same are accounted for through movement presented above.
37.2 The GoPb holds controlling interest (57.47% shareholding) in the Bank and therefore entities which
are owned and / or controlled by the GoPb, or where the GoPb may exercise significant influence, are related parties of the Bank. The Bank in the ordinary course of business enters into transaction with Government- related entities. Such transactions include lending to, deposits from and provision of other banking services to Government-related entities.
As at Statement of Financial Position date the loans and advances, deposits and contingencies
relating to GoPb and its related entities amounted to Rs. 51,728,607 thousand (December 31, 2018: Rs. 55,256,269 thousand), Rs. 347,603,173 thousand (December 31, 2018: Rs. 306,110,933 thousand) and Rs. 30,762,585 thousand (December 31, 2018: Rs. 30,682,028 thousand) respectively. Further, during the period, the Bank has incurred markup expense of Rs. 180,493 thousand (September 30, 2018: Rs. 104,520 thousand) on subordinated debt of Rs. 2,000,000 thousand received from GoPb in year 2014.
37.3 The Bank made contribution of Rs. 134,008 thousand (September 30, 2018: Rs. 102,829 thousand)
to employees provident fund during the period.
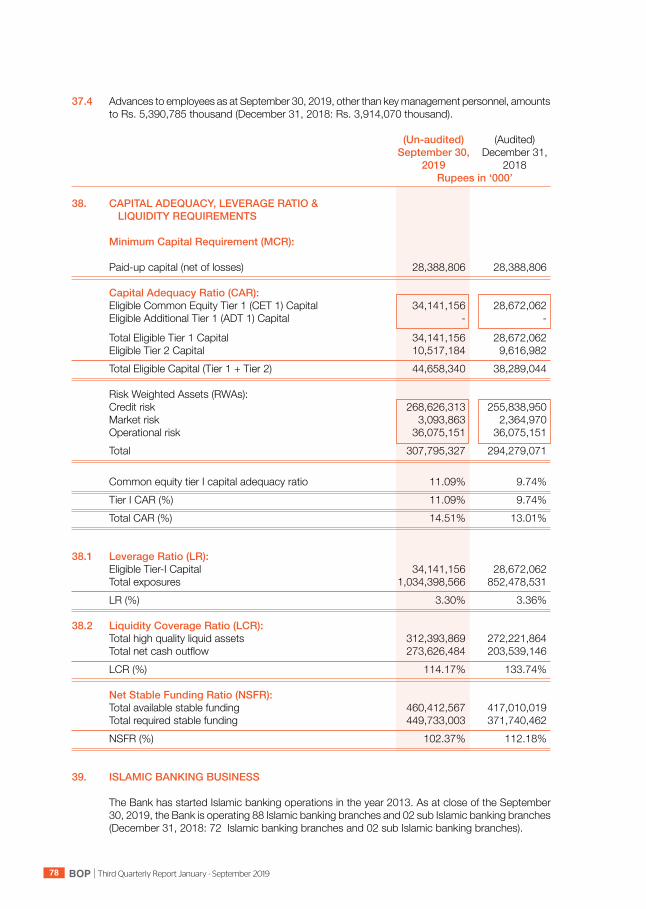
BOP Third Quarterly Report January - September 201978
37.4 Advances to employees as at September 30, 2019, other than key management personnel, amounts to Rs. 5,390,785 thousand (December 31, 2018: Rs. 3,914,070 thousand).
(Un-audited) (Audited) September 30, December 31, 2019 2018 Rupees in ‘000’
38. CAPITALADEQUACY,LEVERAGERATIO& LIQUIDITYREQUIREMENTS MinimumCapitalRequirement(MCR): Paid-up capital (net of losses) 28,388,806 28,388,806
CapitalAdequacyRatio(CAR): Eligible Common Equity Tier 1 (CET 1) Capital 34,141,156 28,672,062 Eligible Additional Tier 1 (ADT 1) Capital - - Total Eligible Tier 1 Capital 34,141,156 28,672,062 Eligible Tier 2 Capital 10,517,184 9,616,982 Total Eligible Capital (Tier 1 + Tier 2) 44,658,340 38,289,044 Risk Weighted Assets (RWAs): Credit risk 268,626,313 255,838,950 Market risk 3,093,863 2,364,970 Operational risk 36,075,151 36,075,151 Total 307,795,327 294,279,071 Common equity tier I capital adequacy ratio 11.09% 9.74% Tier I CAR (%) 11.09% 9.74% Total CAR (%) 14.51% 13.01% 38.1 LeverageRatio(LR): Eligible Tier-I Capital 34,141,156 28,672,062 Total exposures 1,034,398,566 852,478,531 LR (%) 3.30% 3.36% 38.2 LiquidityCoverageRatio(LCR): Total high quality liquid assets 312,393,869 272,221,864 Total net cash outflow 273,626,484 203,539,146 LCR (%) 114.17% 133.74% NetStableFundingRatio(NSFR): Total available stable funding 460,412,567 417,010,019 Total required stable funding 449,733,003 371,740,462 NSFR (%) 102.37% 112.18%
39. ISLAMIC BANKING BUSINESS
The Bank has started Islamic banking operations in the year 2013. As at close of the September 30, 2019, the Bank is operating 88 Islamic banking branches and 02 sub Islamic banking branches (December 31, 2018: 72 Islamic banking branches and 02 sub Islamic banking branches).
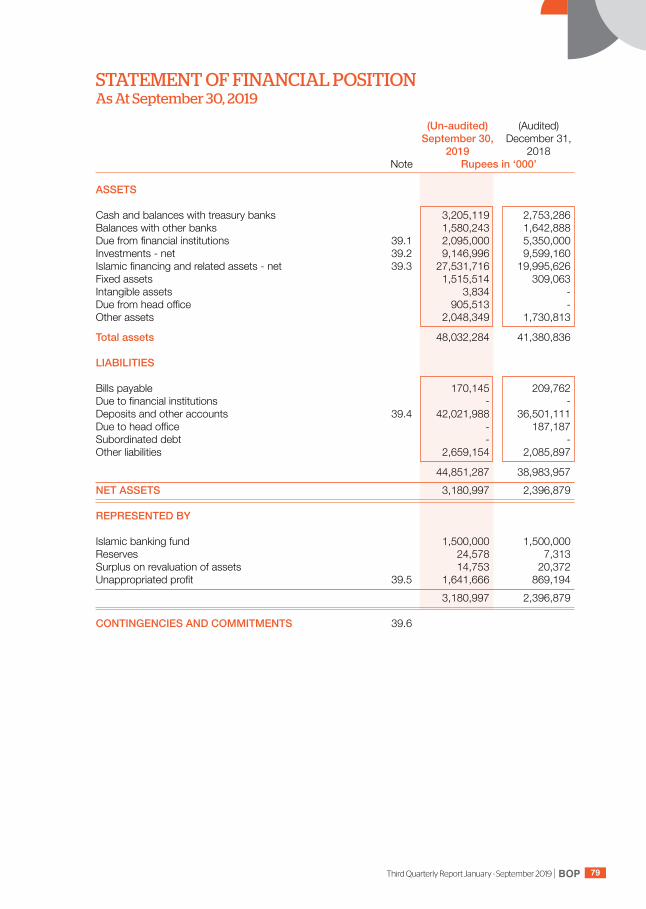
BOPThird Quarterly Report January - September 2019 79
(Un-audited) (Audited) September 30, December 31, 2019 2018 Note Rupees in ‘000’
ASSETS Cash and balances with treasury banks 3,205,119 2,753,286 Balances with other banks 1,580,243 1,642,888 Due from financial institutions 39.1 2,095,000 5,350,000 Investments - net 39.2 9,146,996 9,599,160 Islamic financing and related assets - net 39.3 27,531,716 19,995,626 Fixed assets 1,515,514 309,063 Intangible assets 3,834 - Due from head office 905,513 - Other assets 2,048,349 1,730,813
Totalassets 48,032,284 41,380,836 LIABILITIES Bills payable 170,145 209,762 Due to financial institutions - - Deposits and other accounts 39.4 42,021,988 36,501,111 Due to head office - 187,187 Subordinated debt - - Other liabilities 2,659,154 2,085,897
44,851,287 38,983,957 NET ASSETS 3,180,997 2,396,879 REPRESENTED BY Islamic banking fund 1,500,000 1,500,000 Reserves 24,578 7,313 Surplus on revaluation of assets 14,753 20,372 Unappropriated profit 39.5 1,641,666 869,194 3,180,997 2,396,879 CONTINGENCIES AND COMMITMENTS 39.6
STATEMENT OF FINANCIAL POSITIONAs At September 30, 2019
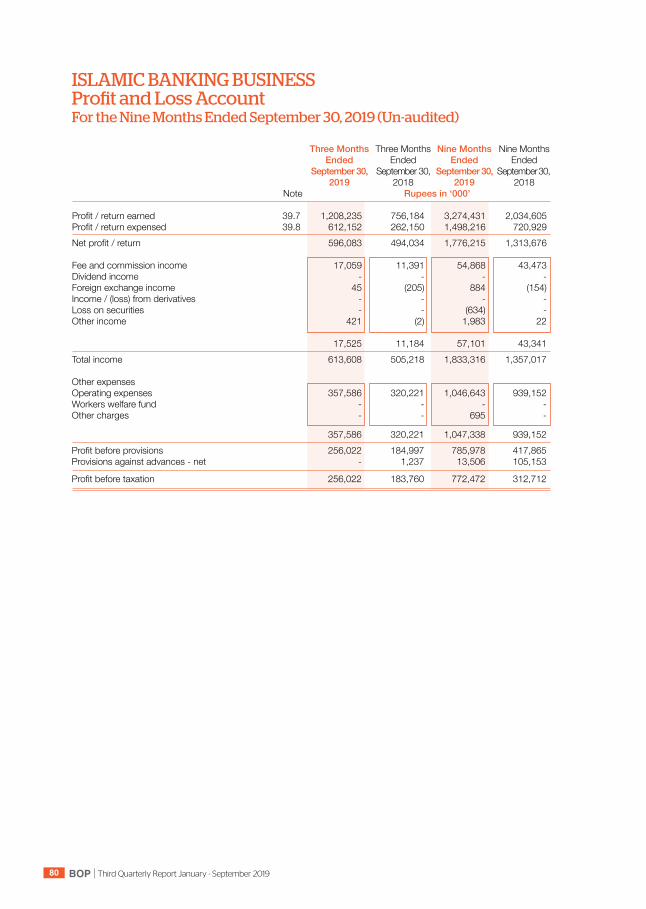
BOP Third Quarterly Report January - September 201980
ISLAMIC BANKING BUSINESS Profit and Loss Account For the Nine Months Ended September 30, 2019 (Un-audited)
ThreeMonths Three Months NineMonths Nine Months Ended Ended Ended Ended September 30, September 30, September 30, September 30, 2019 2018 2019 2018 Note Rupees in ‘000’ Profit / return earned 39.7 1,208,235 756,184 3,274,431 2,034,605 Profit / return expensed 39.8 612,152 262,150 1,498,216 720,929 Net profit / return 596,083 494,034 1,776,215 1,313,676 Fee and commission income 17,059 11,391 54,868 43,473 Dividend income - - - - Foreign exchange income 45 (205) 884 (154)Income / (loss) from derivatives - - - - Loss on securities - - (634) - Other income 421 (2) 1,983 22
17,525 11,184 57,101 43,341 Total income 613,608 505,218 1,833,316 1,357,017 Other expenses Operating expenses 357,586 320,221 1,046,643 939,152 Workers welfare fund - - - - Other charges - - 695 -
357,586 320,221 1,047,338 939,152 Profit before provisions 256,022 184,997 785,978 417,865 Provisions against advances - net - 1,237 13,506 105,153
Profit before taxation 256,022 183,760 772,472 312,712

BOPThird Quarterly Report January - September 2019 81
39.1 DUE FROM FINANCIAL INSTITUTIONS
September 30, 2019 (Un-audited) December 31, 2018 (Audited)
Inlocal Inforeign Total In local In foreign Total currency currencies currency currencies
Rupees in ‘000’
Placements 2,095,000 - 2,095,000 5,350,000 - 5,350,000
39.2 INVESTMENTS - NET
Investmentsbysegment: (Un-audited) (Audited) September 30, 2019 December 31, 2018
Cost/ Provisionfor Surplus/ Carrying Cost / Provision for Surplus / Carrying Amortized diminution (Deficit) value Amortized diminution (Deficit) value cost cost
R u p e e s i n ‘ 0 0 0 ’
Federal government securities: -Ijarah sukuks 1,978,506 - (37,706) 1,940,800 2,623,602 - (32,086) 2,591,516 -Sale of sukuk- bai muajjal 2,756,196 - - 2,756,196 2,756,196 - - 2,756,196
4,734,702 - (37,706) 4,696,996 5,379,798 - (32,086) 5,347,712 Non government debt securities
-Unlisted 4,450,000 - - 4,450,000 4,251,448 - - 4,251,448
Total investments 9,184,702 - (37,706) 9,146,996 9,631,246 - (32,086) 9,599,160
(Un-audited) (Audited) September 30, December 31, 2019 2018 Rupees in ‘000’
39.3 ISLAMIC FINANCING AND RELATED ASSETS Ijarah 1,791,762 552,920 Murabaha 1,266,197 1,004,602 Musharaka 11,778,782 8,340,625 Diminishing musharaka 10,154,216 7,630,222 Payment against documents 8,069 - Istisna 2,765,322 2,686,385 Gross islamic financing and related assets 27,764,348 20,214,754 Less: provision against islamic financings - Specific 232,632 219,128 - General - -
232,632 219,128 Islamic financing and related assets - net of provision 27,531,716 19,995,626

BOP Third Quarterly Report January - September 201982
39.4 DEPOSITS AND OTHER ACCOUNTS
September 30, 2019 (Un-audited) December 31, 2018 (Audited)
Inlocal Inforeign Total In local In foreign Total currency currencies currency currencies
Rupees in ‘000’ Customers: Current deposits 8,139,106 282,819 8,421,925 7,797,340 119,378 7,916,718 Savings deposits 31,661,695 92,483 31,754,178 26,557,886 7,704 26,565,590 Term deposits 828,454 - 828,454 771,556 - 771,556 Others 850,678 - 850,678 1,031,913 - 1,031,913
41,479,933 375,302 41,855,235 36,158,695 127,082 36,285,777 Financialinstitutions: Current deposits 110,920 - 110,920 100,024 - 100,024 Savings deposits 47,544 - 47,544 115,310 - 115,310 Others 8,289 - 8,289 - - -
166,753 - 166,753 215,334 - 215,334
41,646,686 375,302 42,021,988 36,374,029 127,082 36,501,111
(Un-audited) (Audited) September 30, December 31, 2019 2018 Rupees in ‘000’
39.5 UNAPPROPRIATED PROFIT - ISLAMIC BANKING BUSINESS Opening balance 869,194 420,873 Islamic banking profit for the period / year 772,472 448,321 Closing balance 1,641,666 869,194 39.6 CONTINGENCIES AND COMMITMENTS -Guarantees 1,169,199 1,420,734 -Commitments 15,454,420 2,981,746 16,623,619 4,402,480 (Un-audited) (Un-audited) September 30, September 30, 2019 2018 Rupees in ‘000’
39.7 PROFIT / RETURN EARNED OF FINANCING, INVESTMENTS AND PLACEMENT Profit earned on: Financing 2,140,539 1,145,561 Investments 792,775 411,669 Placements 318,494 477,190 Deposits with financial institutions 22,623 185 3,274,431 2,034,605 39.8 PROFITONDEPOSITSANDOTHERDUESEXPENSED Deposits and other accounts 1,394,001 674,074 Markup on lease liability against right-of-use asset 95,010 - Profit on deposits from conventional head office 9,205 46,855 1,498,216 720,929
BOPThird Quarterly Report January - September 2019 83
39.9 During the period, following pools have been closed by the islamic banking: Special Pool-III Special Pool-V Special Pool-X Special Pool-XI Further, Special Pool-XIV has been created during the period. The main characteristics of the pool
are as under: i) Profit sharing ratio between Mudarib and Rab-ul-mal is 40:60. ii) Profit equilization reserve upto 2% of net income will be created, if needed. iii) Investment risk reserve upto 1% of distributable profit of depositors will be created, if needed. 40. DATE OF AUTHORIZATION FOR ISSUE These consolidated condensed interim financial statements were authorized for issue on
October 18, 2019 by the Board of Directors of the Bank. 41. GENERAL 41.1 Figures have been rounded off to the nearest thousand rupees. 41.2 Under BPRD circular letter No. 05 of 2019 dated March 22, 2019 comparative information has been
reclassified, rearranged in these consolidated condensed interim financial statements. However, no other significant reclassifications have been made.
ChiefFinancialOfficer President Director

BOP Third Quarterly Report January - September 201984
Head O�ceBOP Tower, 10-B block E/II,Main boulevard, Gulberg-III, LahoreUAN: 111-200-100www.bop.com.pk