quarterly meeting 1/2019 -...
TRANSCRIPT
4Q18 & 2018 Performance & Outlook
27 February 2019
Quarterly Meeting
1/2019
2 © 2019 ERAWAN. All rights reserved.
The views expressed here contain some information derived from publicly available sources
that have not been independently verified. No representation or warranty is made as to the
accuracy, completeness or reliability of the information. Any forward looking information in
this presentation has been prepared on the basis of a number of assumptions which may
prove to be incorrect. This presentation should not be relied upon as a recommendation or
forecast by The Erawan Group PLC. Nothing in this release should be construed as either
an offer to sell or a solicitation of an offer to buy or sell shares in any jurisdiction.
3 © 2019 ERAWAN. All rights reserved.
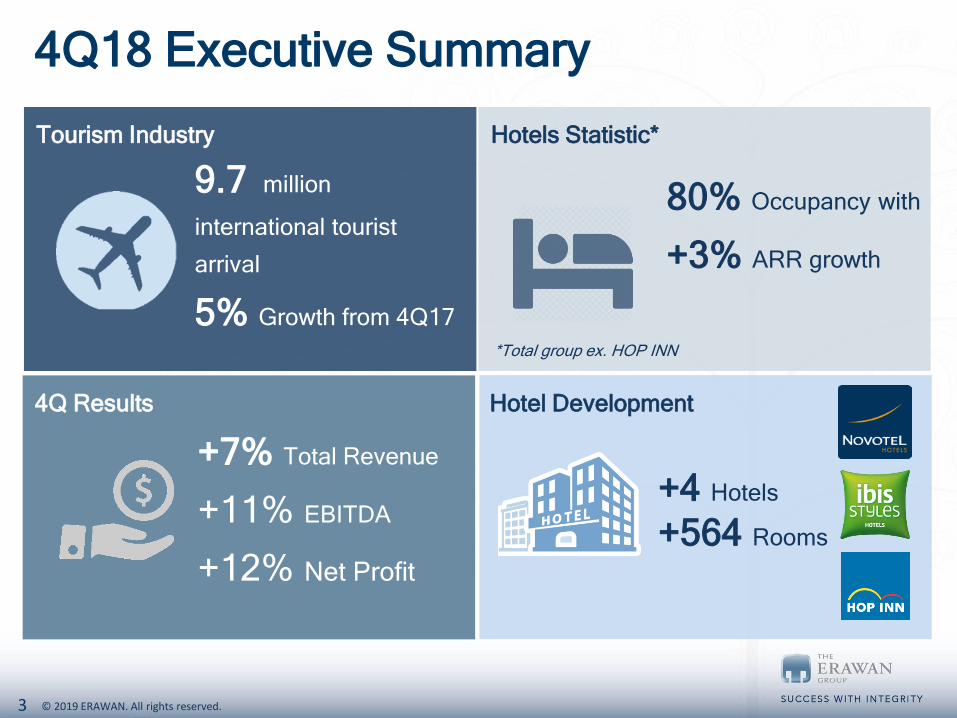
4Q18 Executive Summary
9.7 million
international tourist
arrival
5% Growth from 4Q17
Tourism Industry Hotels Statistic*
80% Occupancy with
+3% ARR growth
4Q Results
+7% Total Revenue
+11% EBITDA
+12% Net Profit
Hotel Development
*Total group ex. HOP INN
+4 Hotels
+564 Rooms

44 © 2019 ERAWAN. All rights reserved.
Industry Update
5 © 2019 ERAWAN. All rights reserved.
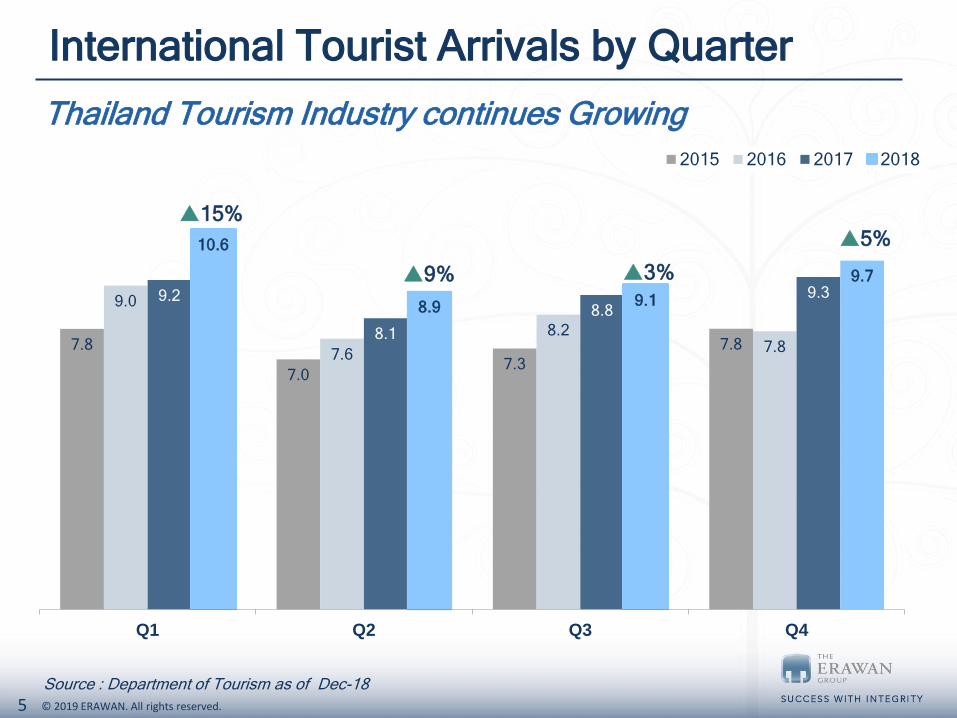
International Tourist Arrivals by Quarter
Source : Department of Tourism as of Dec-18
7.8
7.07.3
7.8
9.0
7.6
8.27.8
9.2
8.1
8.89.3
10.6
8.9 9.1
9.7
Q1 Q2 Q3 Q4
2015 2016 2017 2018
15%
Thailand Tourism Industry continues Growing
9% 3%
5%
6 © 2019 ERAWAN. All rights reserved.
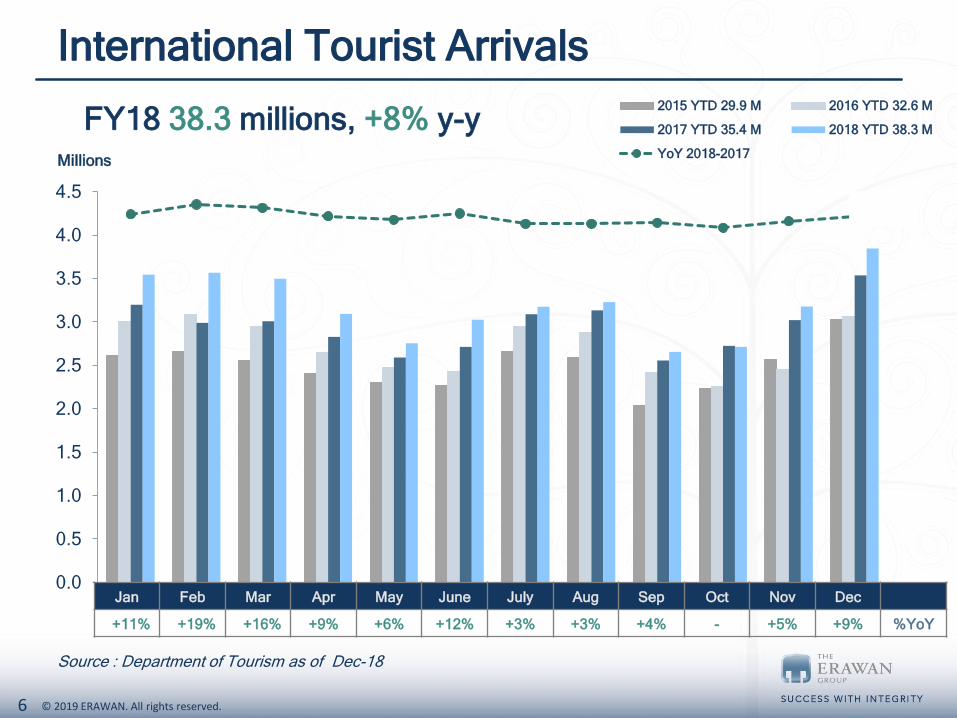
International Tourist Arrivals
Source : Department of Tourism as of Dec-18
0.0
0.5
1.0
1.5
2.0
2.5
3.0
3.5
4.0
4.5
Jan Feb Mar Apr May June July Aug Sep Oct Nov Dec
2015 YTD 29.9 M 2016 YTD 32.6 M
2017 YTD 35.4 M 2018 YTD 38.3 M
YoY 2018-2017Millions
FY18 38.3 millions, +8% y-y
Jan Feb Mar Apr May June July Aug Sep Oct Nov Dec
+11% +19% +16% +9% +6% +12% +3% +3% +4% - +5% +9% %YoY
7 © 2019 ERAWAN. All rights reserved.
-30%
-20%
-10%
0%
10%
20%
30%
40%
50%
60% Chinese Russian India
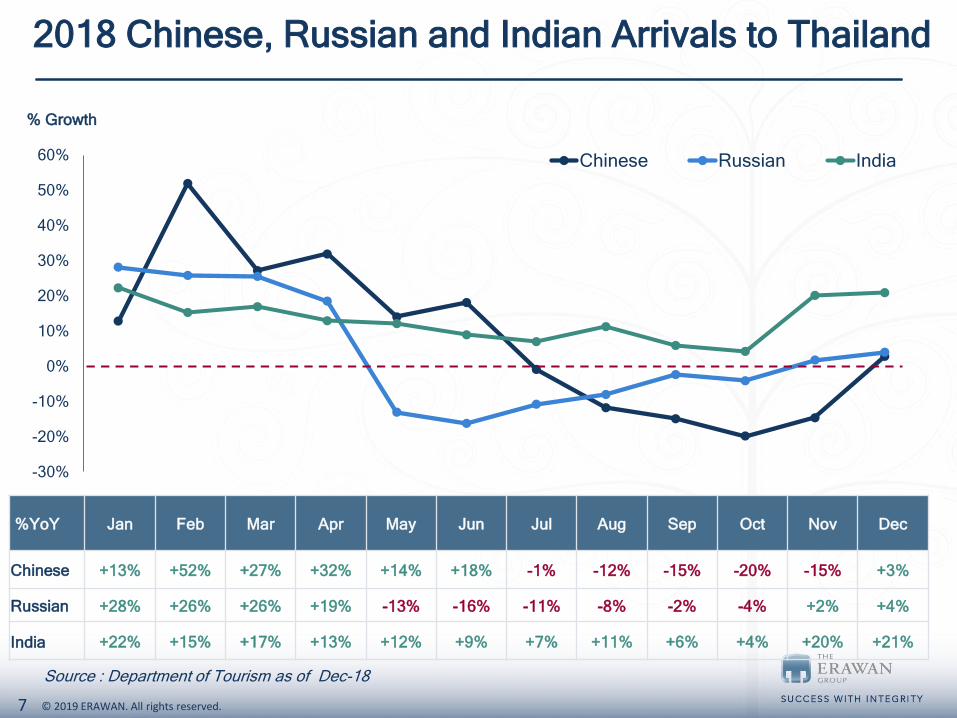
2018 Chinese, Russian and Indian Arrivals to Thailand
Source : Department of Tourism as of Dec-18
%YoY Jan Feb Mar Apr May Jun Jul Aug Sep Oct Nov Dec
Chinese +13% +52% +27% +32% +14% +18% -1% -12% -15% -20% -15% +3%
Russian +28% +26% +26% +19% -13% -16% -11% -8% -2% -4% +2% +4%
India +22% +15% +17% +13% +12% +9% +7% +11% +6% +4% +20% +21%
% Growth
8 © 2019 ERAWAN. All rights reserved.
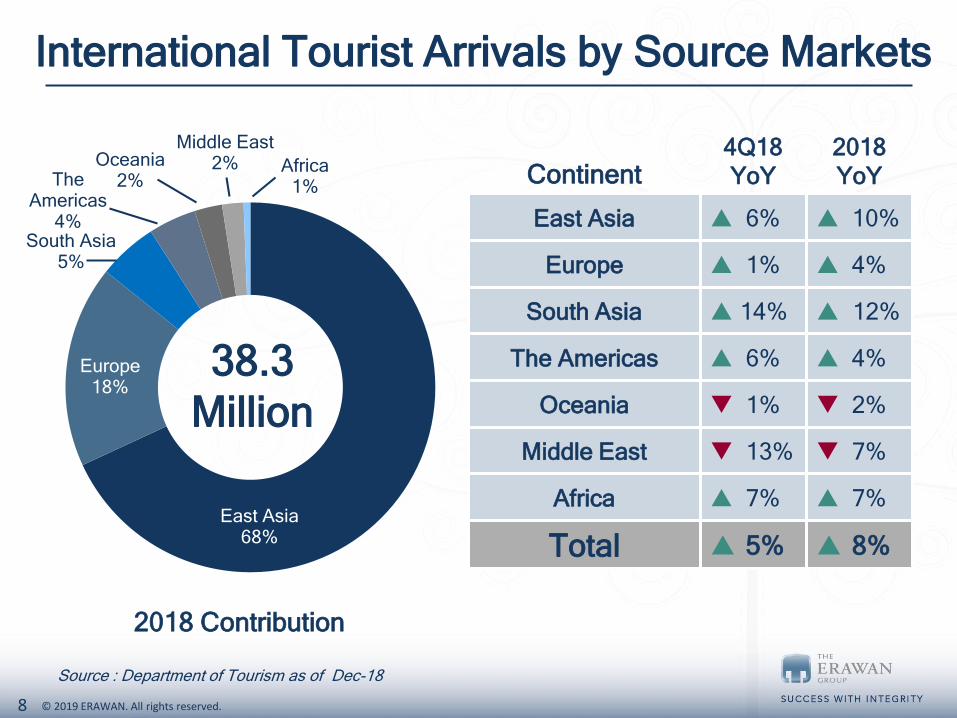
International Tourist Arrivals by Source Markets
Source : Department of Tourism as of Dec-18
Continent4Q18
YoY
2018
YoY
East Asia 6% 10%
Europe 1% 4%
South Asia 14% 12%
The Americas 6% 4%
Oceania 1% 2%
Middle East 13% 7%
Africa 7% 7%
Total 5% 8%
2018 Contribution
East Asia68%
Europe18%
South Asia5%
The Americas
4%
Oceania2%
Middle East2% Africa
1%
38.3
Million
9 © 2019 ERAWAN. All rights reserved.
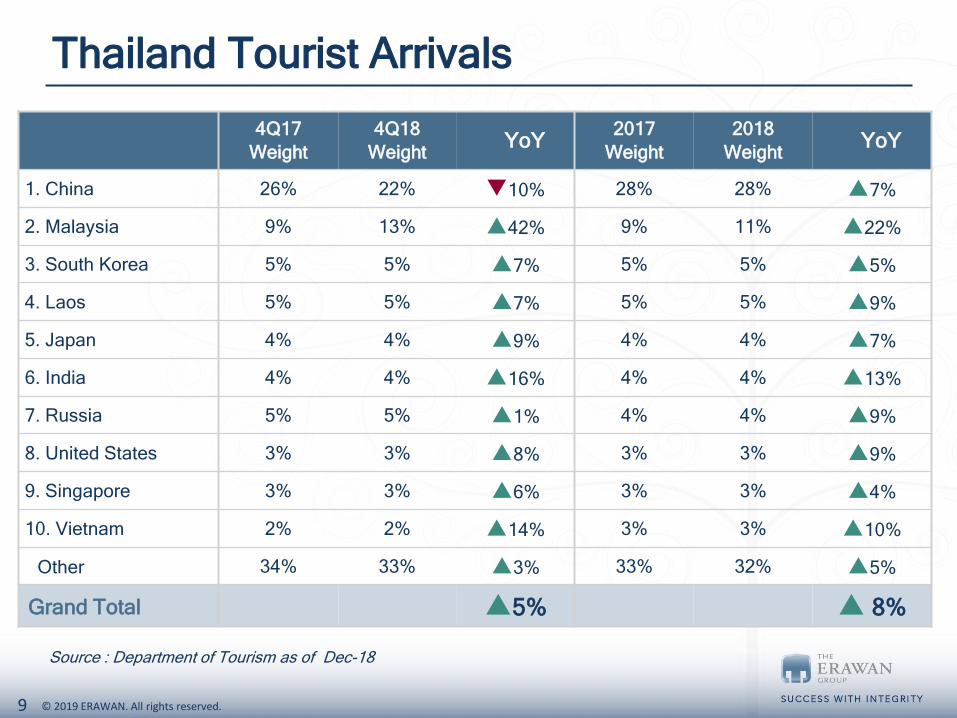
Thailand Tourist Arrivals
Source : Department of Tourism as of Dec-18
4Q17
Weight
4Q18
WeightYoY
2017
Weight
2018
WeightYoY
1. China 26% 22% 10% 28% 28% 7%
2. Malaysia 9% 13% 42% 9% 11% 22%
3. South Korea 5% 5% 7% 5% 5% 5%
4. Laos 5% 5% 7% 5% 5% 9%
5. Japan 4% 4% 9% 4% 4% 7%
6. India 4% 4% 16% 4% 4% 13%
7. Russia 5% 5% 1% 4% 4% 9%
8. United States 3% 3% 8% 3% 3% 9%
9. Singapore 3% 3% 6% 3% 3% 4%
10. Vietnam 2% 2% 14% 3% 3% 10%
Other 34% 33% 3% 33% 32% 5%
Grand Total 5% 8%
10 © 2019 ERAWAN. All rights reserved.
Performance Review 4Q18 & 2018
11 © 2019 ERAWAN. All rights reserved.
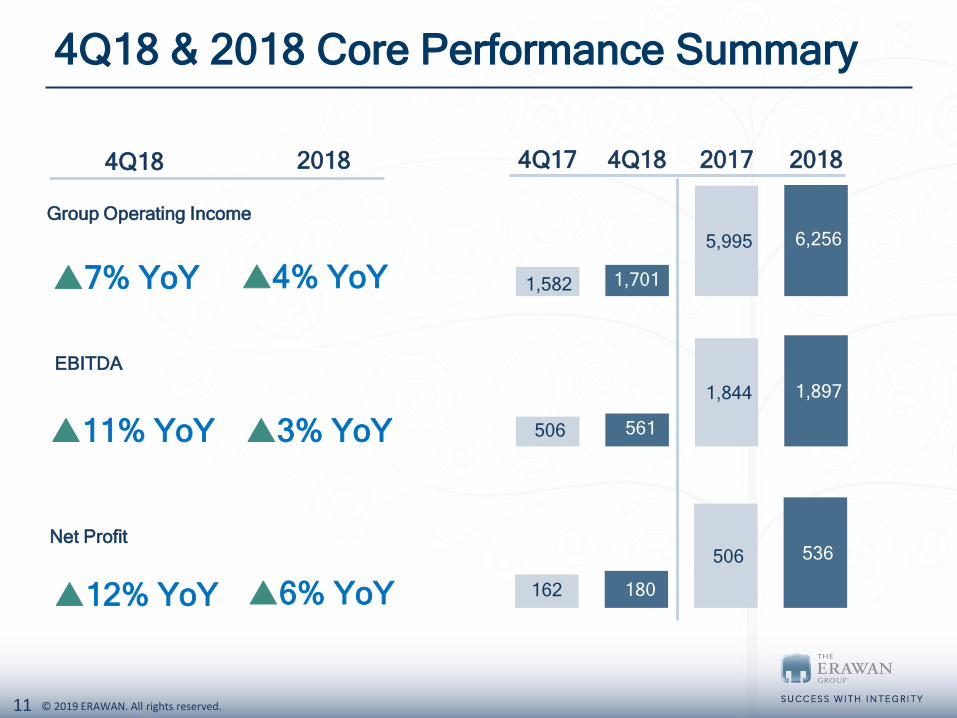
1,582 1,701
5,995 6,256
4Q17 4Q18 2017 2018
4Q18 & 2018 Core Performance Summary
Group Operating Income
EBITDA
506 561
1,844 1,897
162 180
506 536
4% YoY7% YoY
3% YoY11% YoY
Net Profit
6% YoY12% YoY
4Q18 2018
12 © 2019 ERAWAN. All rights reserved.
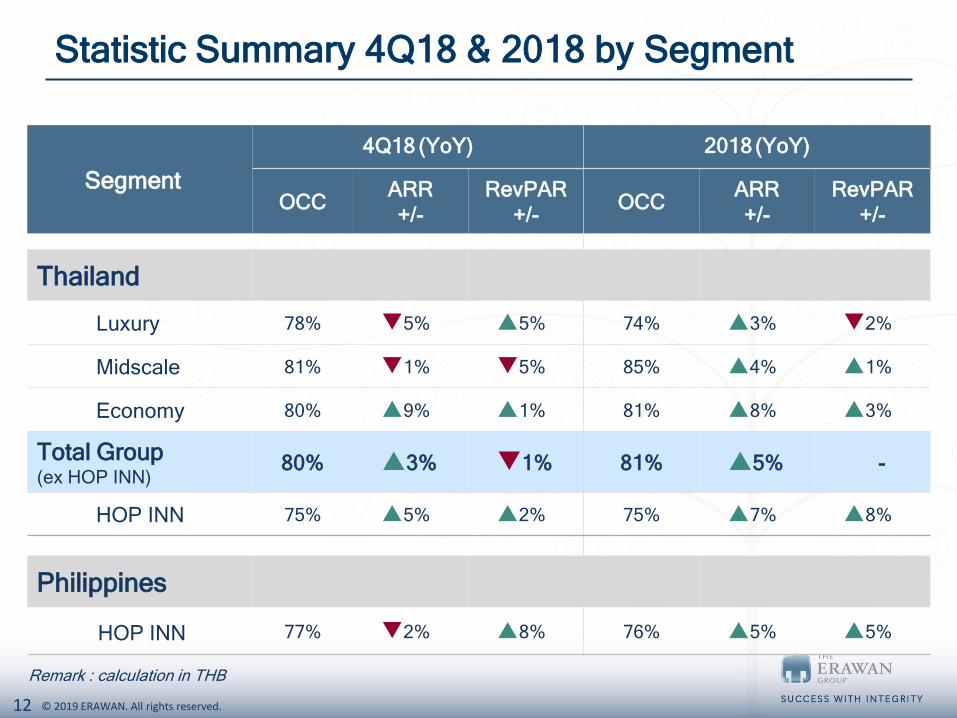
Statistic Summary 4Q18 & 2018 by Segment
Segment
4Q18 (YoY) 2018 (YoY)
OCCARR
+/-
RevPAR
+/-OCC
ARR
+/-
RevPAR
+/-
Thailand
Luxury 78% 5% 5% 74% 3% 2%
Midscale 81% 1% 5% 85% 4% 1%
Economy 80% 9% 1% 81% 8% 3%
Total Group(ex HOP INN)
80% 3% 1% 81% 5% -
HOP INN 75% 5% 2% 75% 7% 8%
Philippines
HOP INN 77% 2% 8% 76% 5% 5%
Remark : calculation in THB
13 © 2019 ERAWAN. All rights reserved.
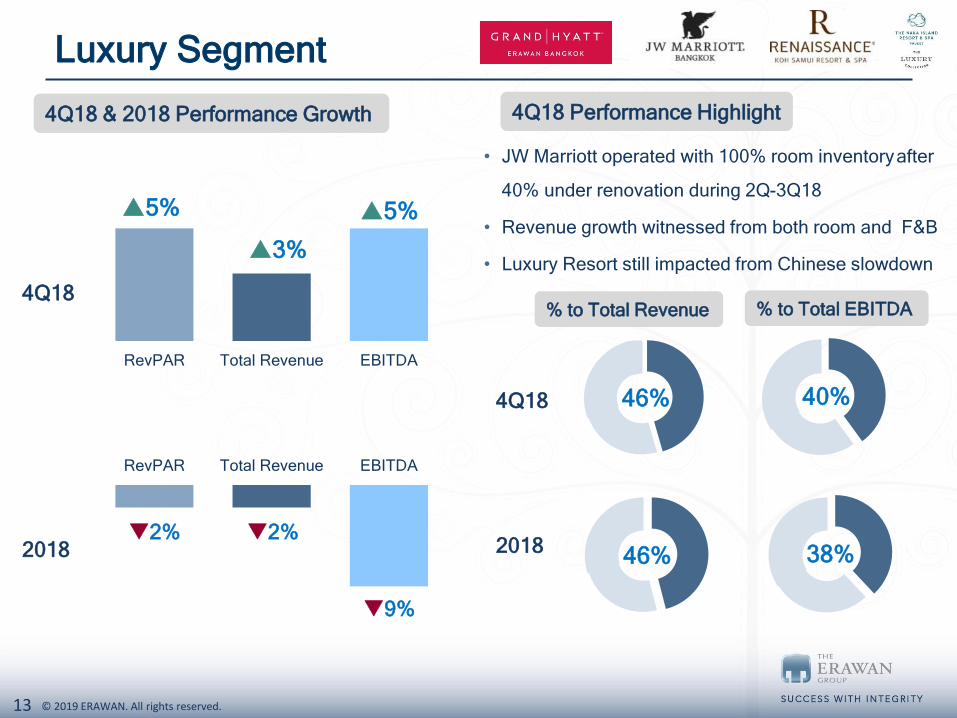
Luxury Segment
4Q18
RevPAR Total Revenue EBITDA
5%
3%
5%
2018
RevPAR Total Revenue EBITDA
2% 2%
9%
4Q18 & 2018 Performance Growth
• JW Marriott operated with 100% room inventoryafter
40% under renovation during 2Q-3Q18
• Revenue growth witnessed from both room and F&B
• Luxury Resort still impacted from Chinese slowdown
% to Total Revenue % to Total EBITDA
4Q18 Performance Highlight
46% 40%
2018
4Q18
46% 38%
14 © 2019 ERAWAN. All rights reserved.
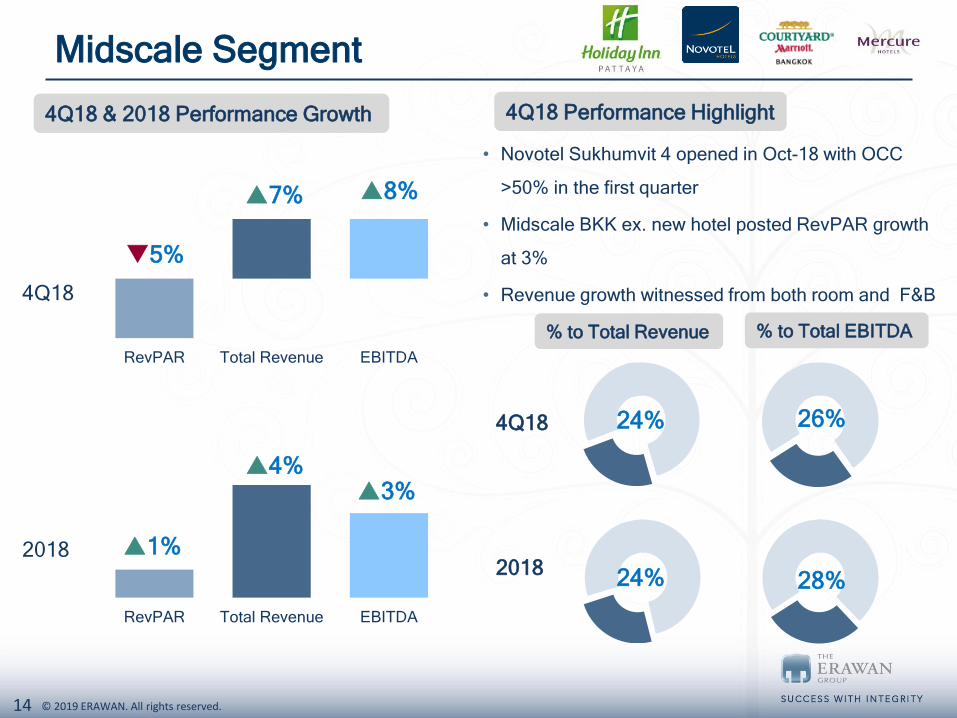
Midscale Segment
4Q18
RevPAR Total Revenue EBITDA
5%
7% 8%
2018
RevPAR Total Revenue EBITDA
1%
4%3%
• Novotel Sukhumvit 4 opened in Oct-18 with OCC
>50% in the first quarter
• Midscale BKK ex. new hotel posted RevPAR growth
at 3%
• Revenue growth witnessed from both room and F&B
4Q18 Performance Highlight4Q18 & 2018 Performance Growth
% to Total Revenue % to Total EBITDA
24% 26%
2018
4Q18
24% 28%
15 © 2019 ERAWAN. All rights reserved.
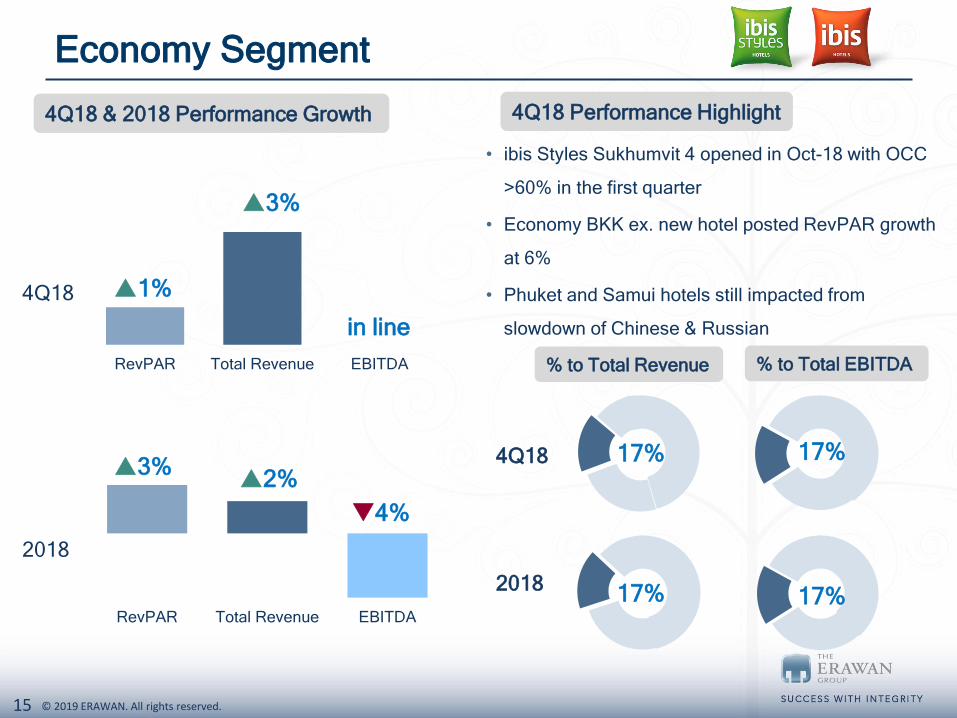
Economy Segment
4Q18
2018
RevPAR Total Revenue EBITDA
4Q18 & 2018 Performance Growth
• ibis Styles Sukhumvit 4 opened in Oct-18 with OCC
>60% in the first quarter
• Economy BKK ex. new hotel posted RevPAR growth
at 6%
• Phuket and Samui hotels still impacted from
slowdown of Chinese & Russian
3%2%
RevPAR Total Revenue EBITDA
1%
3%
in line
4%
4Q18 Performance Highlight
% to Total Revenue % to Total EBITDA
17% 17%
2018
4Q18
17% 17%
16 © 2019 ERAWAN. All rights reserved.
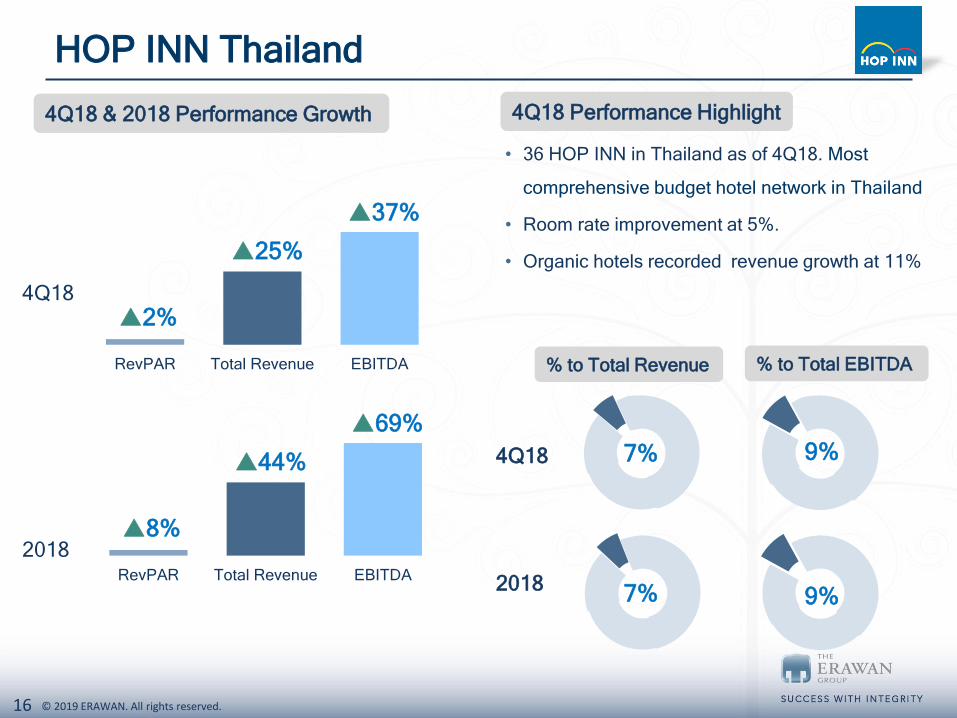
HOP INN Thailand
4Q18
2018
4Q18 & 2018 Performance Growth
• 36 HOP INN in Thailand as of 4Q18. Most
comprehensive budget hotel network in Thailand
• Room rate improvement at 5%.
• Organic hotels recorded revenue growth at 11%
RevPAR Total Revenue EBITDA
2%
25%
37%
RevPAR Total Revenue EBITDA
8%
44%
69%
4Q18 Performance Highlight
% to Total Revenue % to Total EBITDA
7% 9%
2018
4Q18
7% 9%
17 © 2019 ERAWAN. All rights reserved.
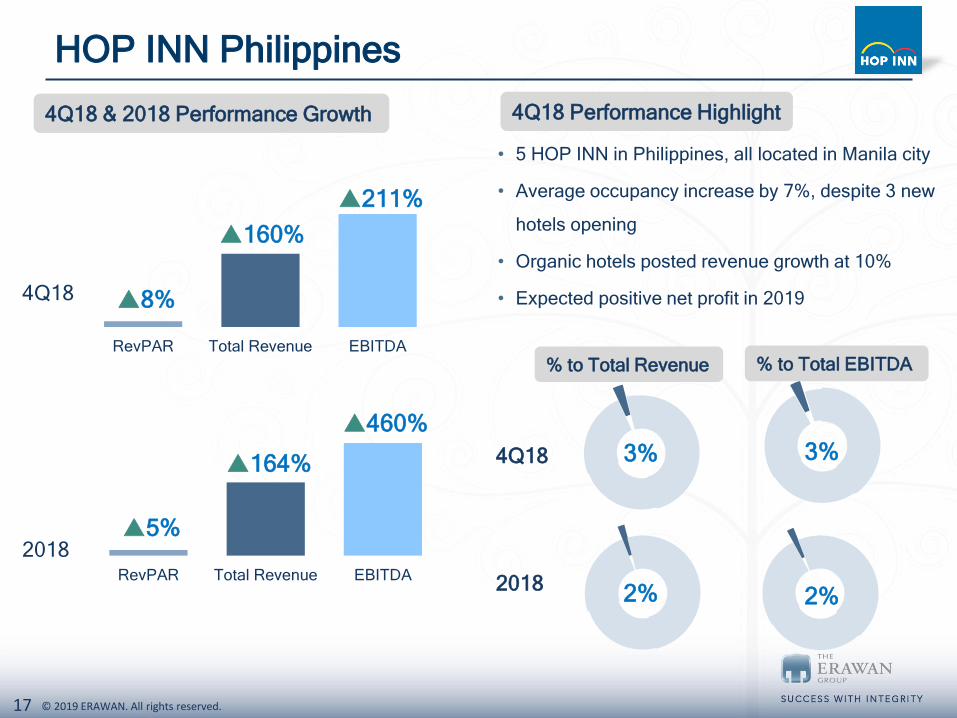
HOP INN Philippines
4Q18
2018
4Q18 & 2018 Performance Growth
• 5 HOP INN in Philippines, all located in Manila city
• Average occupancy increase by 7%, despite 3 new
hotels opening
• Organic hotels posted revenue growth at 10%
• Expected positive net profit in 2019
RevPAR Total Revenue EBITDA
5%
164%
460%
RevPAR Total Revenue EBITDA
8%
160%
211%
4Q18 Performance Highlight
% to Total Revenue % to Total EBITDA
3% 3%
2018
4Q18
2% 2%
18 © 2019 ERAWAN. All rights reserved.
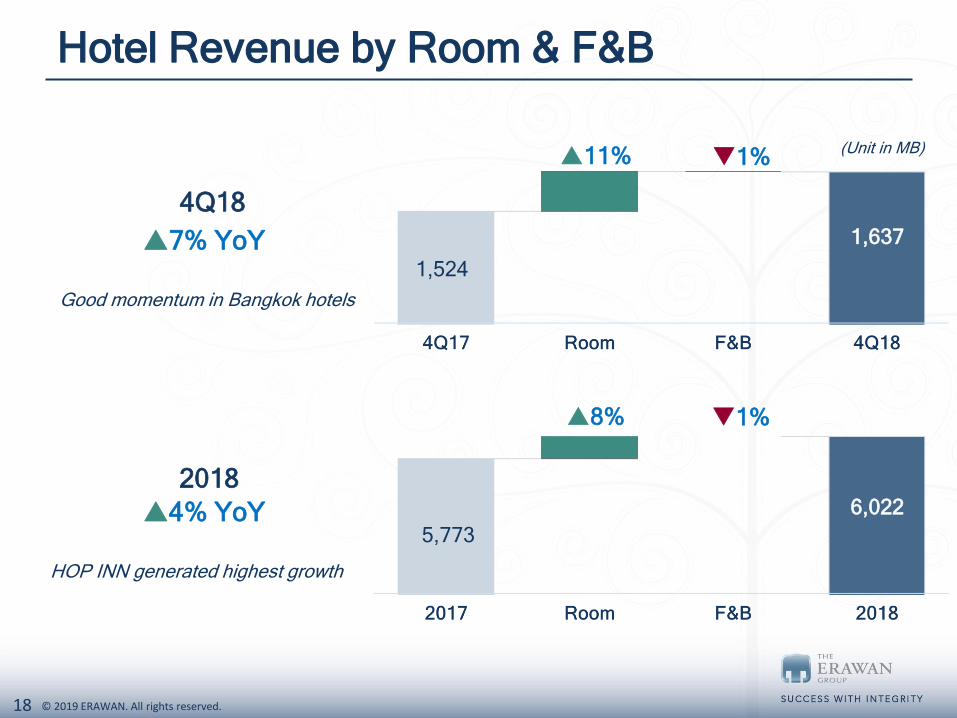
Hotel Revenue by Room & F&B
(Unit in MB)11% 1%
1,524
1,637
8%
5,773
6,022
4Q18
7% YoY
2018
4% YoY
1%
Good momentum in Bangkok hotels
HOP INN generated highest growth
19 © 2019 ERAWAN. All rights reserved.
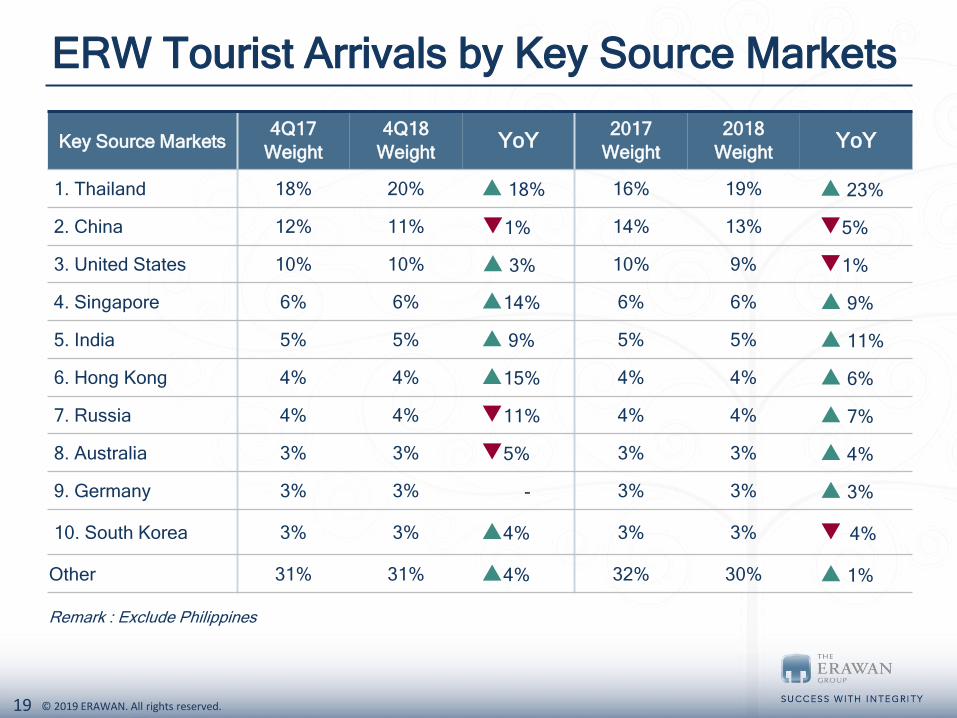
ERW Tourist Arrivals by Key Source Markets
Remark : Exclude Philippines
Key Source Markets4Q17
Weight
4Q18
WeightYoY
2017
Weight
2018
WeightYoY
1. Thailand 18% 20% 18% 16% 19% 23%
2. China 12% 11% 1% 14% 13% 5%
3. United States 10% 10% 3% 10% 9% 1%
4. Singapore 6% 6% 14% 6% 6% 9%
5. India 5% 5% 9% 5% 5% 11%
6. Hong Kong 4% 4% 15% 4% 4% 6%
7. Russia 4% 4% 11% 4% 4% 7%
8. Australia 3% 3% 5% 3% 3% 4%
9. Germany 3% 3% - 3% 3% 3%
10. South Korea 3% 3% 4% 3% 3% 4%
Other 31% 31% 4% 32% 30% 1%
20 © 2019 ERAWAN. All rights reserved.
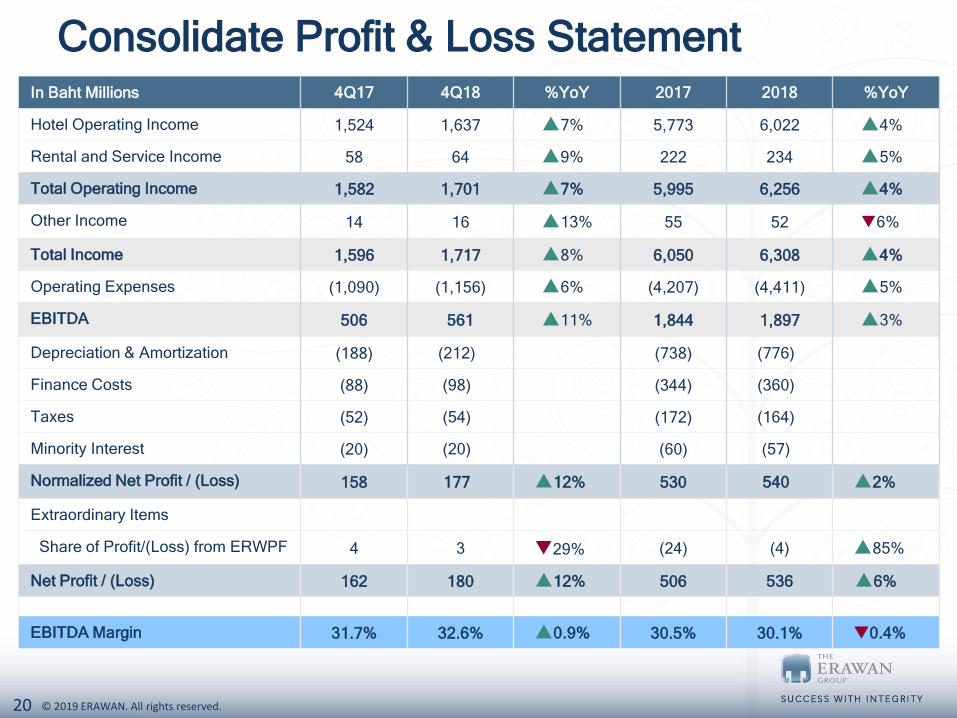
Consolidate Profit & Loss StatementIn Baht Millions 4Q17 4Q18 %YoY 2017 2018 %YoY
Hotel Operating Income 1,524 1,637 7% 5,773 6,022 4%
Rental and Service Income 58 64 9% 222 234 5%
Total Operating Income 1,582 1,701 7% 5,995 6,256 4%
Other Income 14 16 13% 55 52 6%
Total Income 1,596 1,717 8% 6,050 6,308 4%
Operating Expenses (1,090) (1,156) 6% (4,207) (4,411) 5%
EBITDA 506 561 11% 1,844 1,897 3%
Depreciation & Amortization (188) (212) (738) (776)
Finance Costs (88) (98) (344) (360)
Taxes (52) (54) (172) (164)
Minority Interest (20) (20) (60) (57)
Normalized Net Profit / (Loss) 158 177 12% 530 540 2%
Extraordinary Items
Share of Profit/(Loss) from ERWPF 4 3 29% (24) (4) 85%
Net Profit / (Loss) 162 180 12% 506 536 6%
EBITDA Margin 31.7% 32.6% 0.9% 30.5% 30.1% 0.4%
21 © 2019 ERAWAN. All rights reserved.
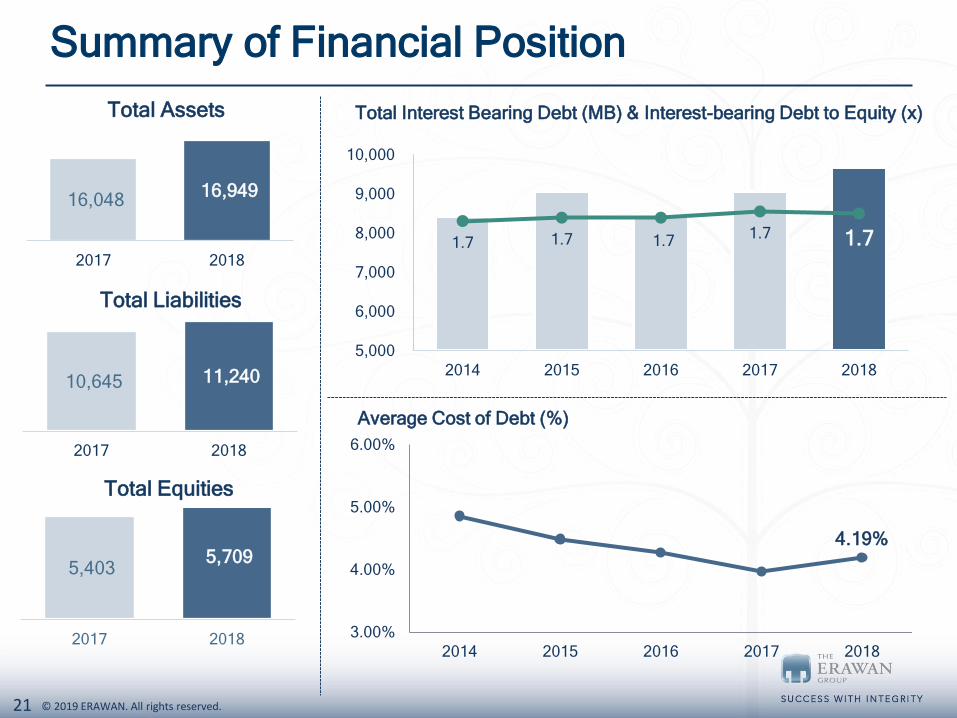
16,048 16,949
2017 2018
Total Assets
Summary of Financial Position
10,645 11,240
2017 2018
Total Liabilities
5,403 5,709
2017 2018
Total Equities
1.7 1.7 1.71.7 1.7
1.0
1.2
1.4
1.6
1.8
2.0
5,000
6,000
7,000
8,000
9,000
10,000
2014 2015 2016 2017 2018
Total Interest Bearing Debt (MB) & Interest-bearing Debt to Equity (x)
3.00%
4.00%
5.00%
6.00%
2014 2015 2016 2017 2018
Average Cost of Debt (%)
4.19%
22 © 2019 ERAWAN. All rights reserved.
Phuket, Kata
Strategy
23 © 2019 ERAWAN. All rights reserved.
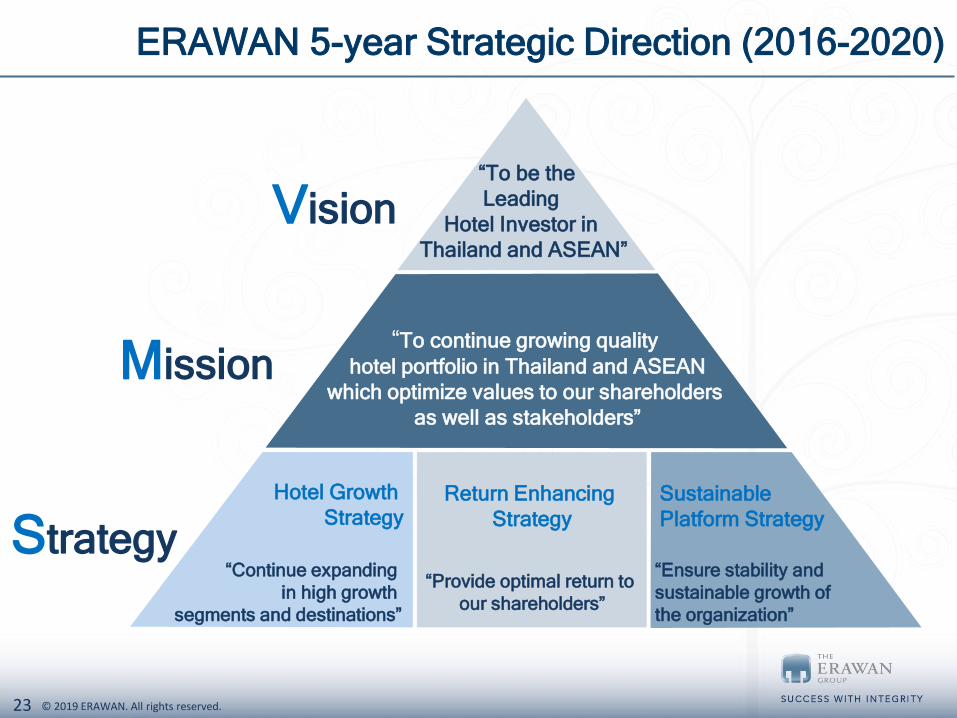
ERAWAN 5-year Strategic Direction (2016-2020)
Vision
Mission
Strategy
“To be the
Leading
Hotel Investor in
Thailand and ASEAN”
“To continue growing quality
hotel portfolio in Thailand and ASEAN
which optimize values to our shareholders
as well as stakeholders”
Hotel Growth
Strategy
“Continue expanding
in high growth
segments and destinations”
“Provide optimal return to
our shareholders”
Return Enhancing
Strategy
“Ensure stability and
sustainable growth of
the organization”
Sustainable
Platform Strategy
24 © 2019 ERAWAN. All rights reserved.
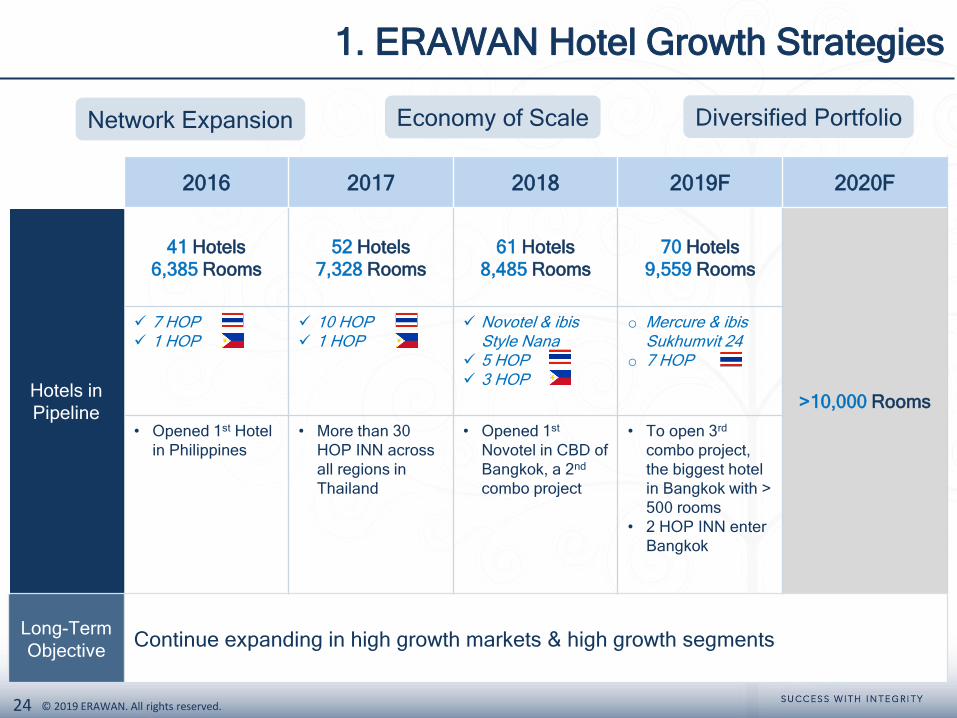
2016 2017 2018 2019F 2020F
Hotels in
Pipeline
41 Hotels
6,385 Rooms
52 Hotels
7,328 Rooms
61 Hotels
8,485 Rooms
70 Hotels
9,559 Rooms
>10,000 Rooms
7 HOP 1 HOP
10 HOP 1 HOP
Novotel & ibis Style Nana
5 HOP 3 HOP
o Mercure & ibis Sukhumvit 24
o 7 HOP
• Opened 1st Hotel
in Philippines
• More than 30
HOP INN across
all regions in
Thailand
• Opened 1st
Novotel in CBD of
Bangkok, a 2nd
combo project
• To open 3rd
combo project,
the biggest hotel
in Bangkok with >
500 rooms
• 2 HOP INN enter
Bangkok
Long-Term
ObjectiveContinue expanding in high growth markets & high growth segments
1. ERAWAN Hotel Growth Strategies
Network Expansion Economy of Scale Diversified Portfolio

25 © 2019 ERAWAN. All rights reserved.
Non Bangkok (46 hotels)
2 Luxury
36 Budget
2 Midscale
6 Economy
Erawan Portfolio in Thailand
2 Luxury
Bangkok (10 hotels)
3 Midscale
5 Economy
56 Hotels in Thailand
No. of hotel and room as of 31 December 2018
26 © 2019 ERAWAN. All rights reserved.
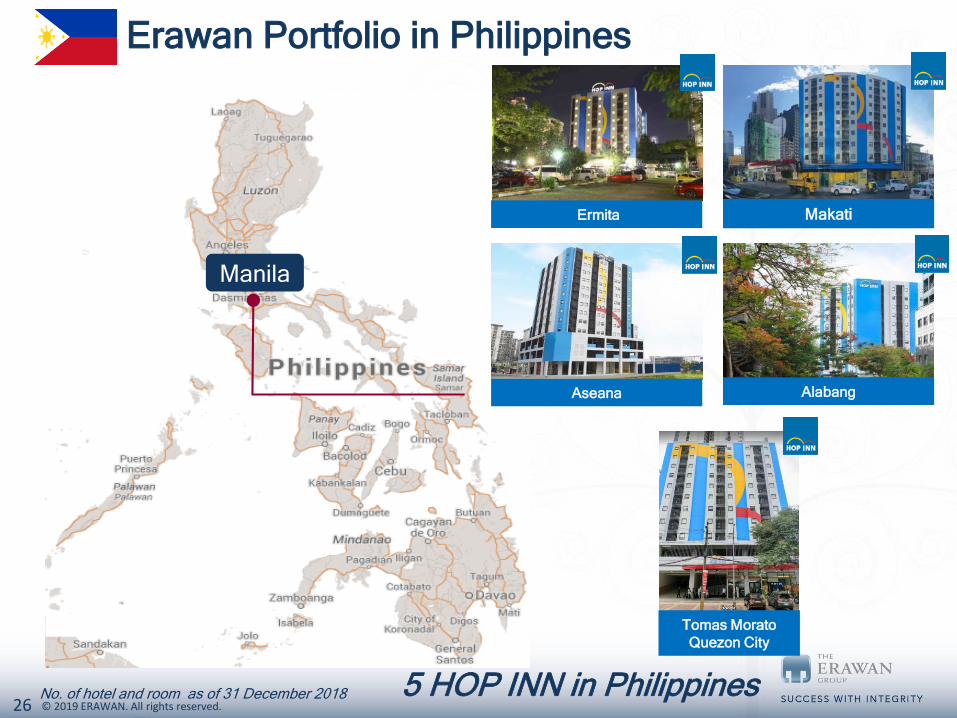
Erawan Portfolio in Philippines
Manila
Ermita Makati
Aseana Alabang
Tomas Morato
Quezon City
5 HOP INN in PhilippinesNo. of hotel and room as of 31 December 2018
27 © 2019 ERAWAN. All rights reserved.
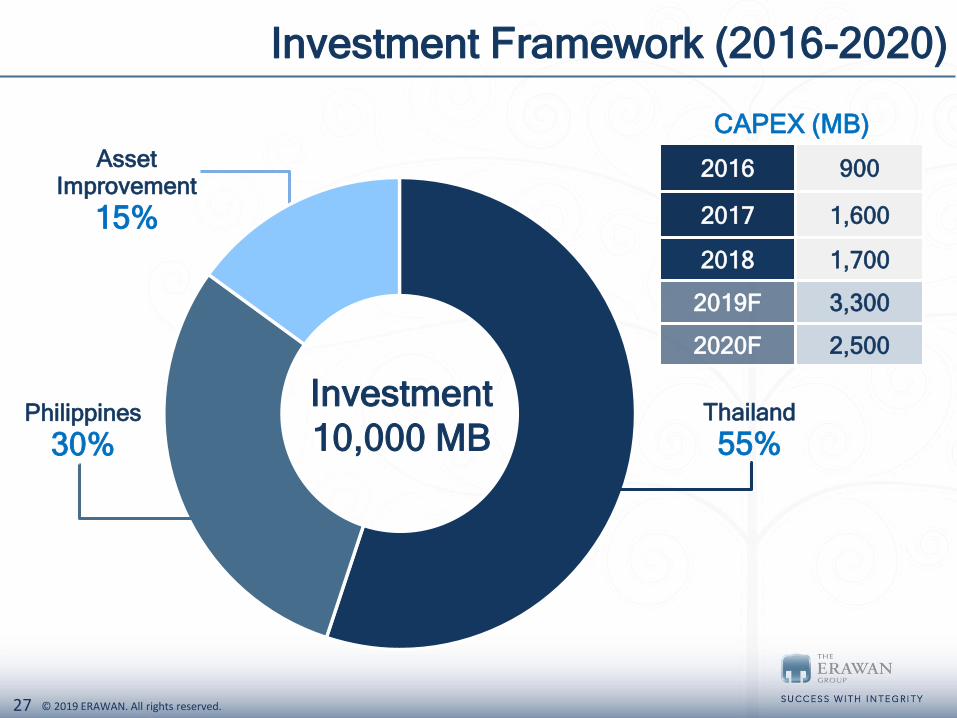
Thailand
55%Philippines
30%
Asset Improvement
15%
Investment Framework (2016-2020)
Investment
10,000 MB
CAPEX (MB)
2016 900
2017 1,600
2018 1,700
2019F 3,300
2020F 2,500
28 © 2019 ERAWAN. All rights reserved.
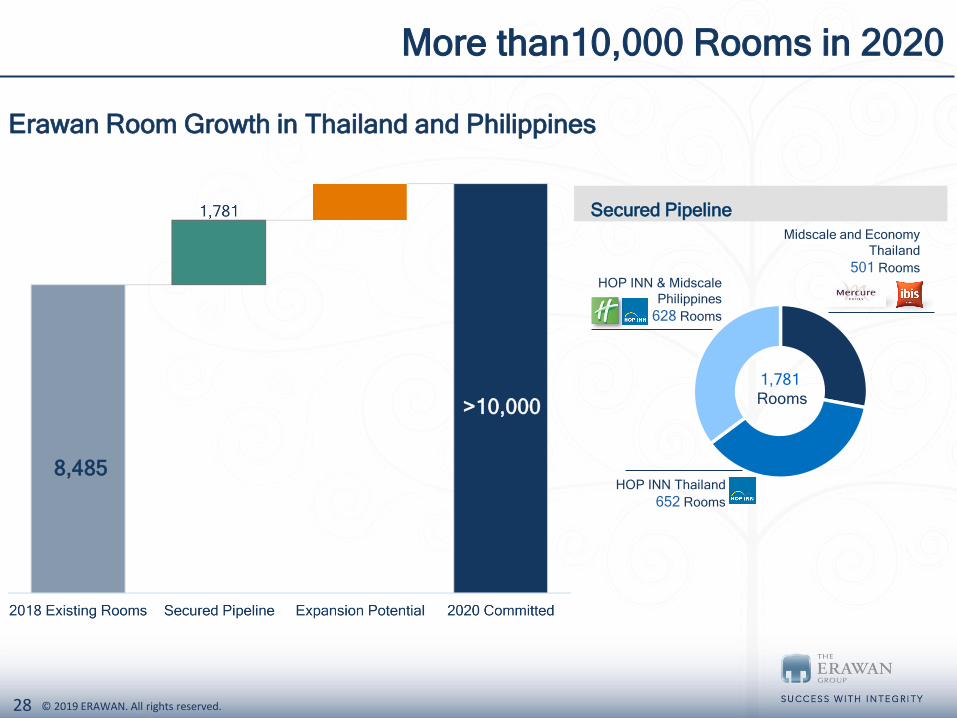
More than10,000 Rooms in 2020
Erawan Room Growth in Thailand and Philippines
8,485
>10,000
HOP INN Thailand
652 Rooms
Midscale and Economy
Thailand
501 Rooms
1,781
Rooms
HOP INN & Midscale
Philippines
628 Rooms
Secured Pipeline
29 © 2019 ERAWAN. All rights reserved.
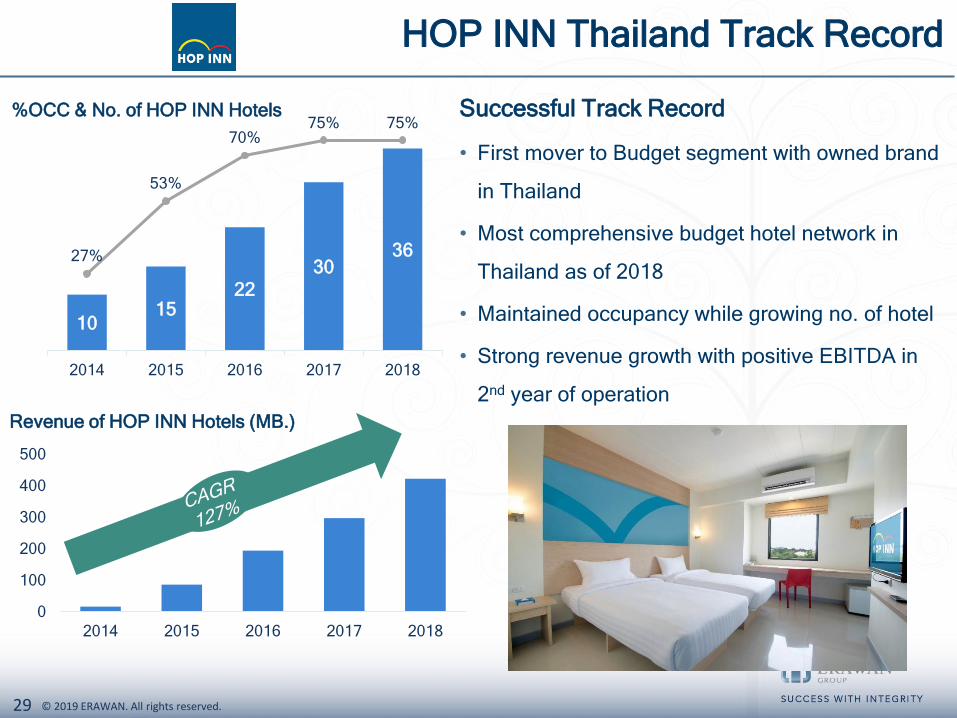
HOP INN Thailand Track Record
1015
22
303627%
53%
70%75% 75%
0%
10%
20%
30%
40%
50%
60%
70%
80%
2014 2015 2016 2017 2018
0
5
10
15
20
25
30
35
40%OCC & No. of HOP INN Hotels Successful Track Record
• First mover to Budget segment with owned brand
in Thailand
• Most comprehensive budget hotel network in
Thailand as of 2018
• Maintained occupancy while growing no. of hotel
• Strong revenue growth with positive EBITDA in
2nd year of operation
0
100
200
300
400
500
2014 2015 2016 2017 2018
Revenue of HOP INN Hotels (MB.)
30 © 2019 ERAWAN. All rights reserved.
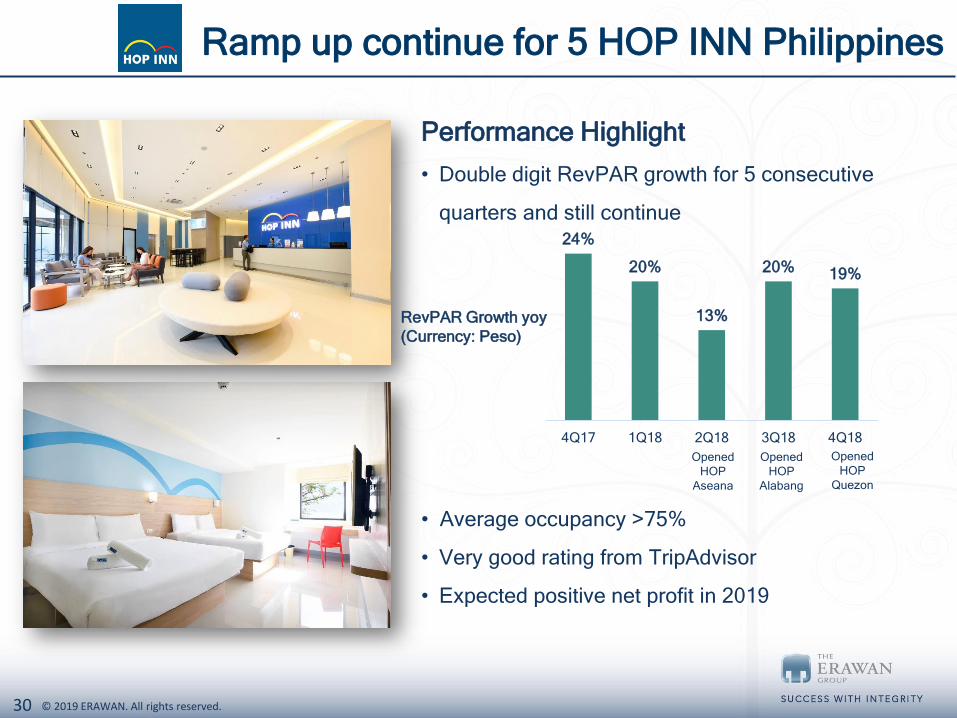
Performance Highlight
• Double digit RevPAR growth for 5 consecutive
quarters and still continue
• Average occupancy >75%
• Very good rating from TripAdvisor
• Expected positive net profit in 2019
Ramp up continue for 5 HOP INN Philippines
24%
20%
13%
20% 19%
4Q17 1Q18 2Q18 3Q18 4Q18
Opened
HOP
Aseana
Opened
HOP
Alabang
RevPAR Growth yoy
(Currency: Peso)
Opened
HOP
Quezon
31 © 2019 ERAWAN. All rights reserved.
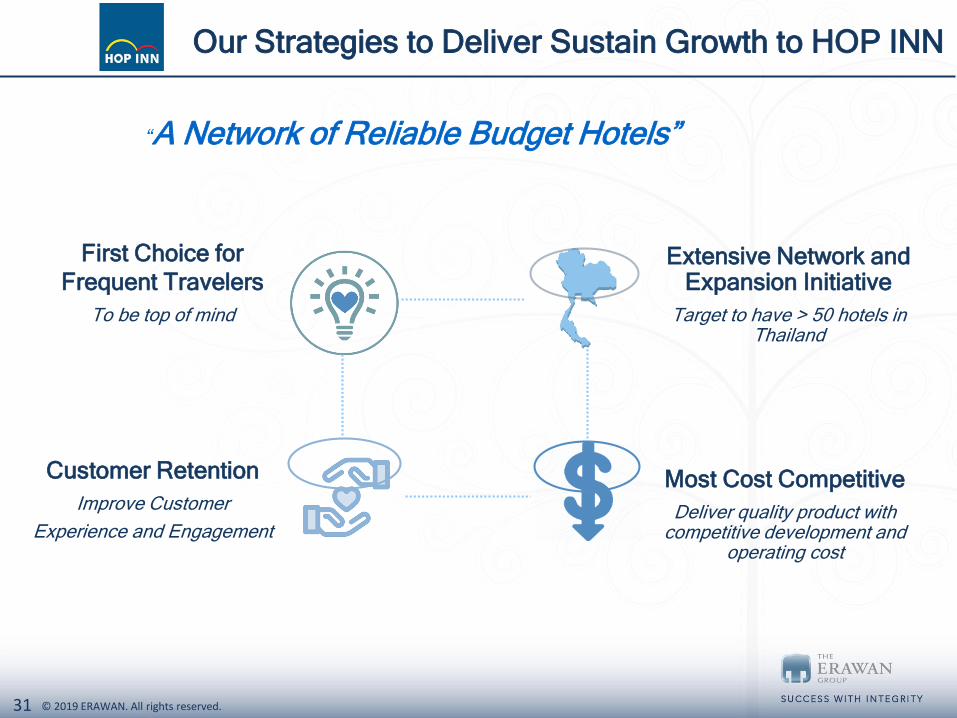
Our Strategies to Deliver Sustain Growth to HOP INN
“A Network of Reliable Budget Hotels”
First Choice for
Frequent Travelers
To be top of mind
Most Cost Competitive
Deliver quality product with competitive development and
operating cost
Extensive Network and Expansion Initiative
Target to have > 50 hotels in Thailand
Customer Retention
Improve Customer
Experience and Engagement
32 © 2019 ERAWAN. All rights reserved.
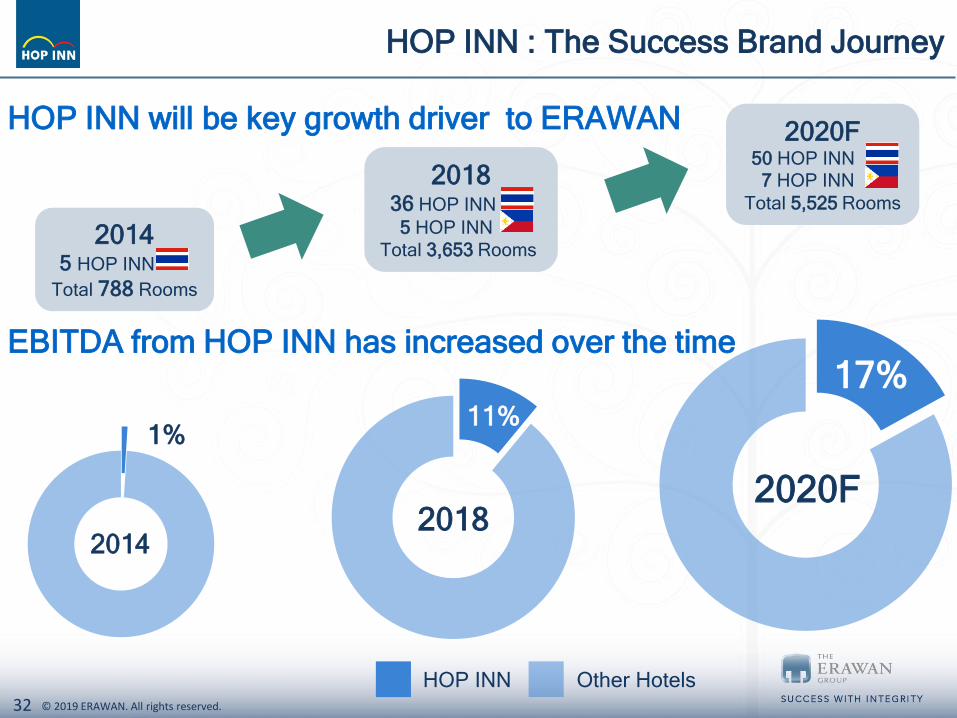
HOP INN : The Success Brand Journey
1%11%
17%
20145 HOP INN
Total 788 Rooms
201836 HOP INN
5 HOP INN
Total 3,653 Rooms
HOP INN Other Hotels
2020F50 HOP INN
7 HOP INN
Total 5,525 Rooms
EBITDA from HOP INN has increased over the time
20142018
2020F
HOP INN will be key growth driver to ERAWAN
33 © 2019 ERAWAN. All rights reserved.
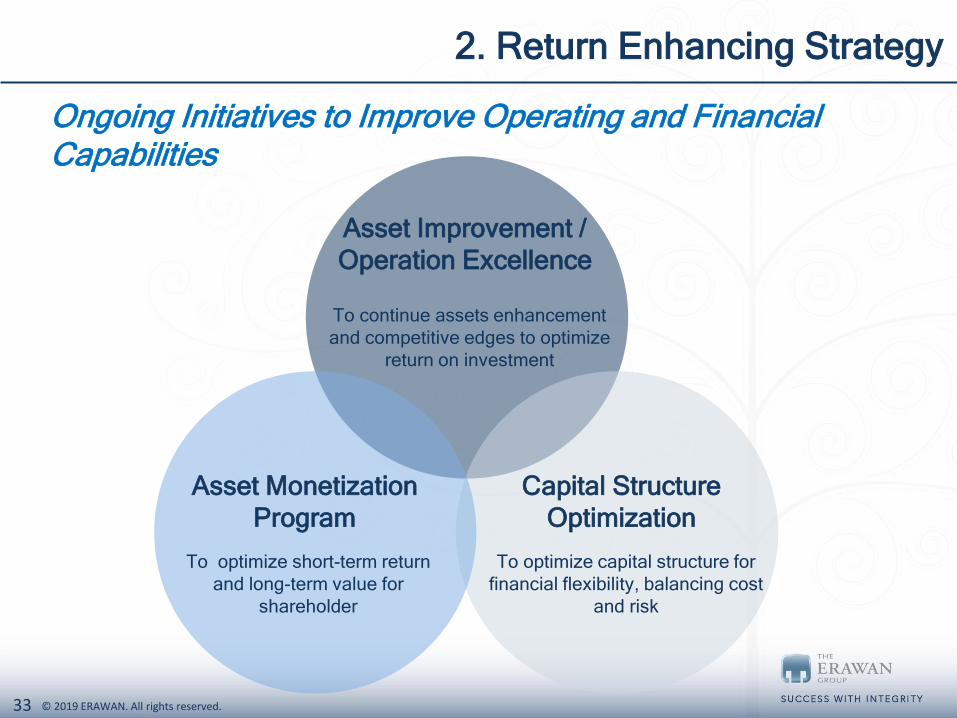
Ongoing Initiatives to Improve Operating and Financial Capabilities
Asset Improvement /
Operation Excellence
Capital Structure
Optimization
Asset Monetization
Program
To continue assets enhancement
and competitive edges to optimize
return on investment
To optimize capital structure for
financial flexibility, balancing cost
and risk
To optimize short-term return
and long-term value for
shareholder
2. Return Enhancing Strategy
34 © 2019 ERAWAN. All rights reserved.
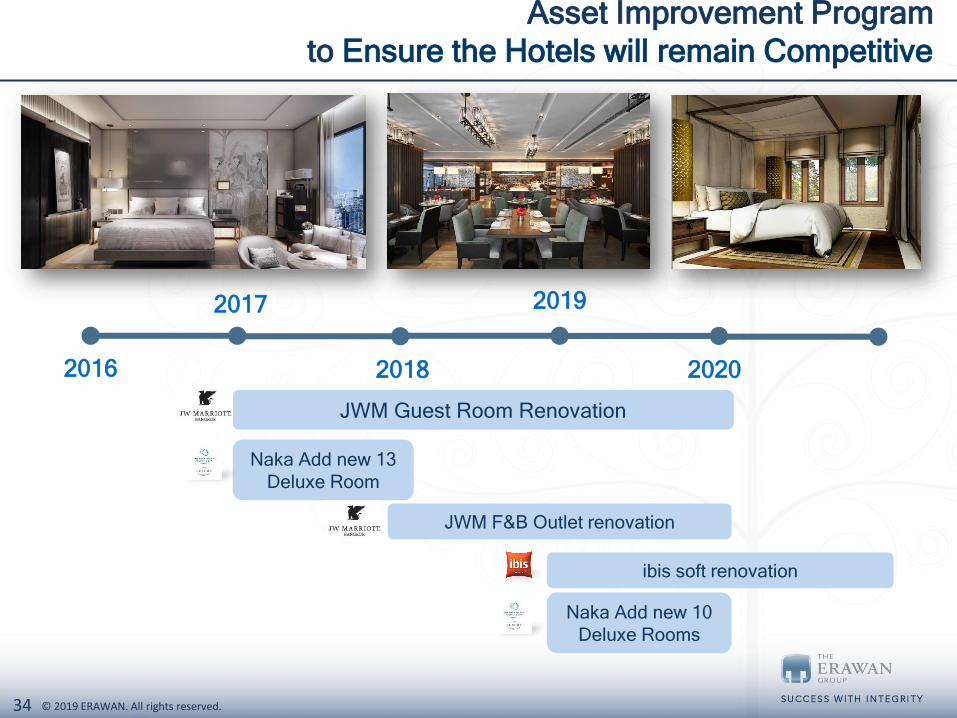
Asset Improvement Program
to Ensure the Hotels will remain Competitive
2016
2017
2018
2019
2020
JWM Guest Room Renovation
JWM F&B Outlet renovation
Naka Add new 13
Deluxe Room
ibis soft renovation
Naka Add new 10
Deluxe Rooms
35 © 2019 ERAWAN. All rights reserved.
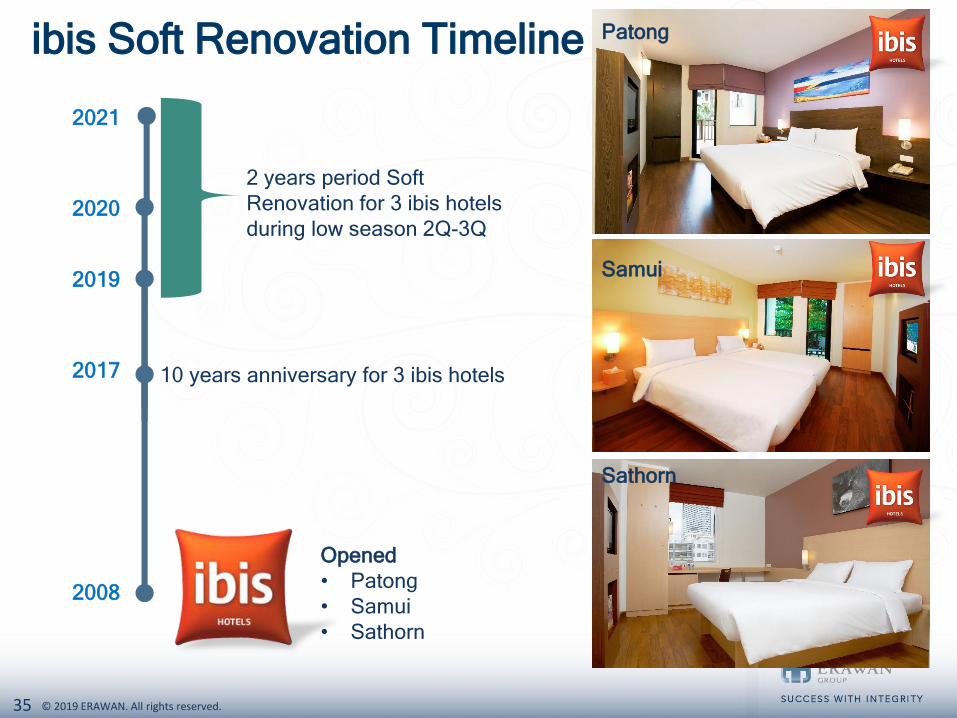
ibis Soft Renovation Timeline
Opened
• Patong
• Samui
• Sathorn
2008
2019
2020
2021
2 years period Soft
Renovation for 3 ibis hotels
during low season 2Q-3Q
2017 10 years anniversary for 3 ibis hotels
Patong
Samui
Sathorn
36 © 2019 ERAWAN. All rights reserved.
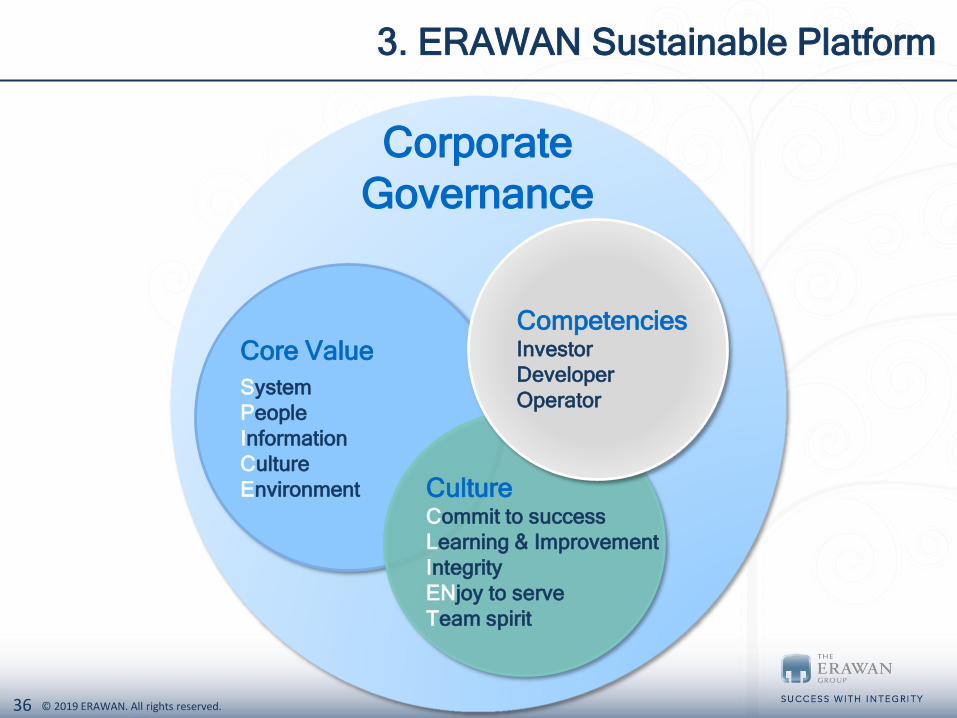
Corporate
Governance
Core Value
System
People
Information
Culture
Environment CultureCommit to success
Learning & Improvement
Integrity
ENjoy to serve
Team spirit
CompetenciesInvestor
Developer
Operator
3. ERAWAN Sustainable Platform
3737 © 2019 ERAWAN. All rights reserved.
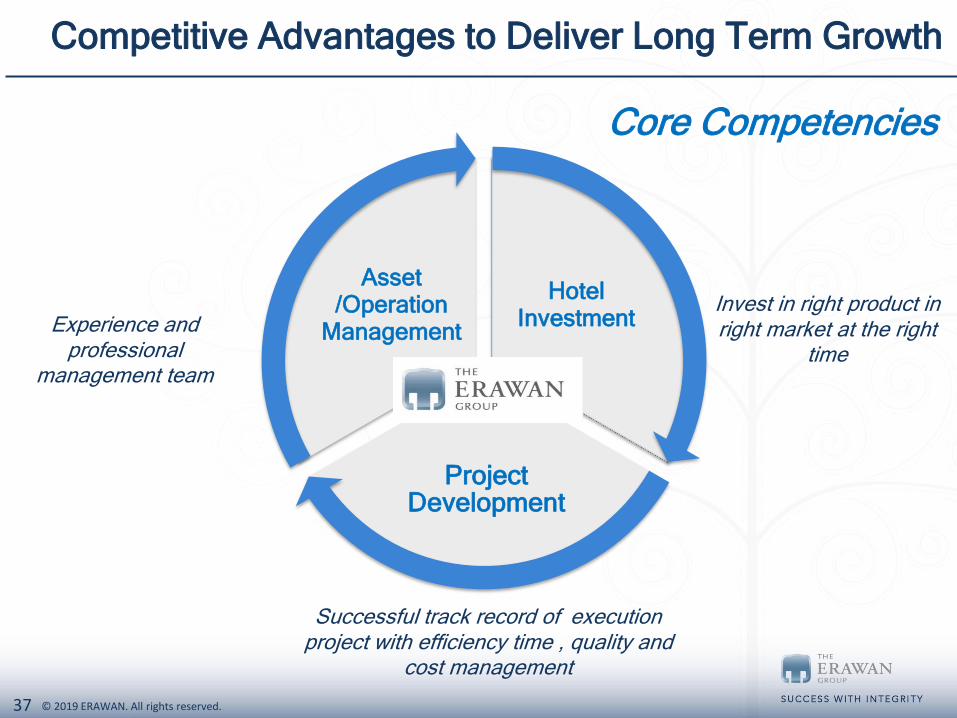
Hotel Investment
Project Development
Asset /Operation
ManagementExperience and professional
management team
Successful track record of execution project with efficiency time , quality and
cost management
Invest in right product in right market at the right
time
Competitive Advantages to Deliver Long Term Growth
Core Competencies
3838 © 2019 ERAWAN. All rights reserved.
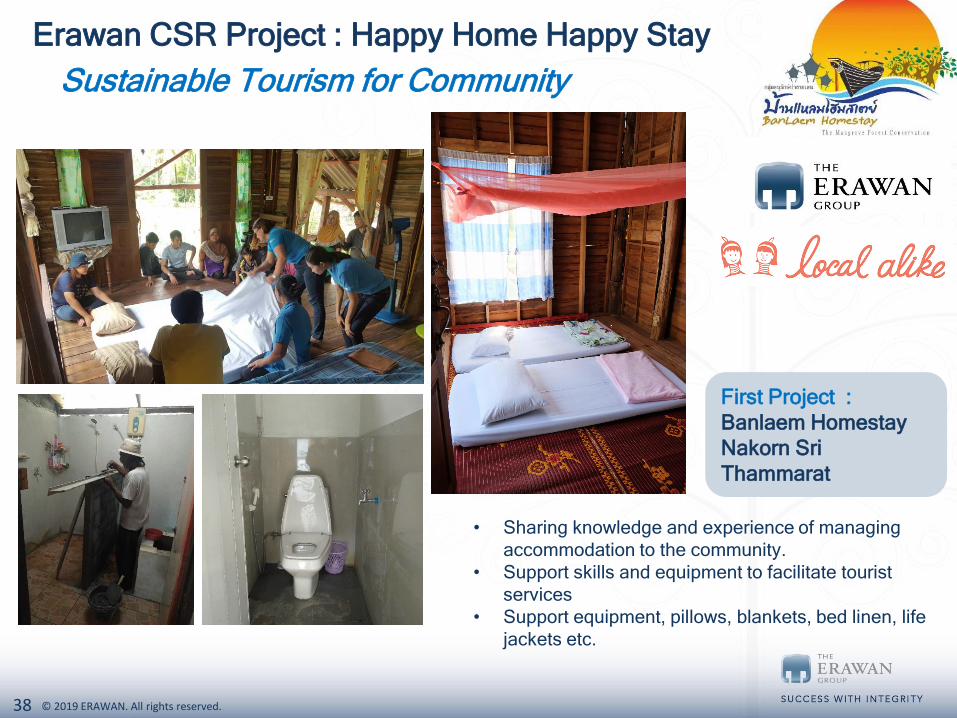
Erawan CSR Project : Happy Home Happy Stay
• Sharing knowledge and experience of managing
accommodation to the community.
• Support skills and equipment to facilitate tourist
services
• Support equipment, pillows, blankets, bed linen, life
jackets etc.
Sustainable Tourism for Community
First Project :
Banlaem Homestay
Nakorn Sri
Thammarat
39 © 2019 ERAWAN. All rights reserved.
2019 Outlook
40 © 2019 ERAWAN. All rights reserved.
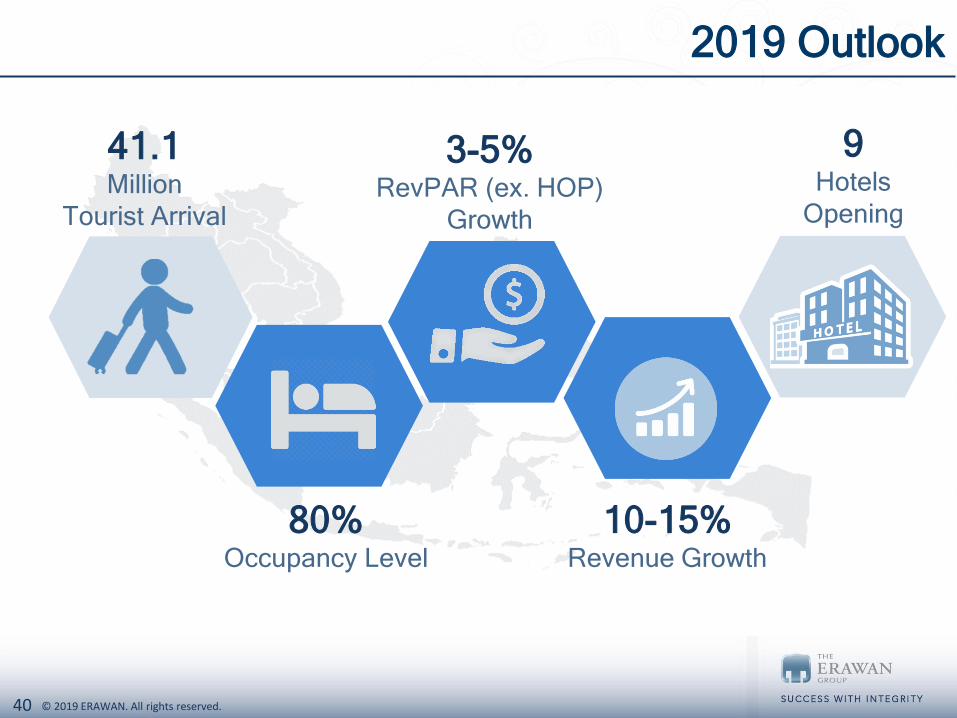
2019 Outlook
41.1Million
Tourist Arrival
80%Occupancy Level
3-5%RevPAR (ex. HOP)
Growth
10-15%Revenue Growth
9Hotels
Opening
41 © 2019 ERAWAN. All rights reserved.
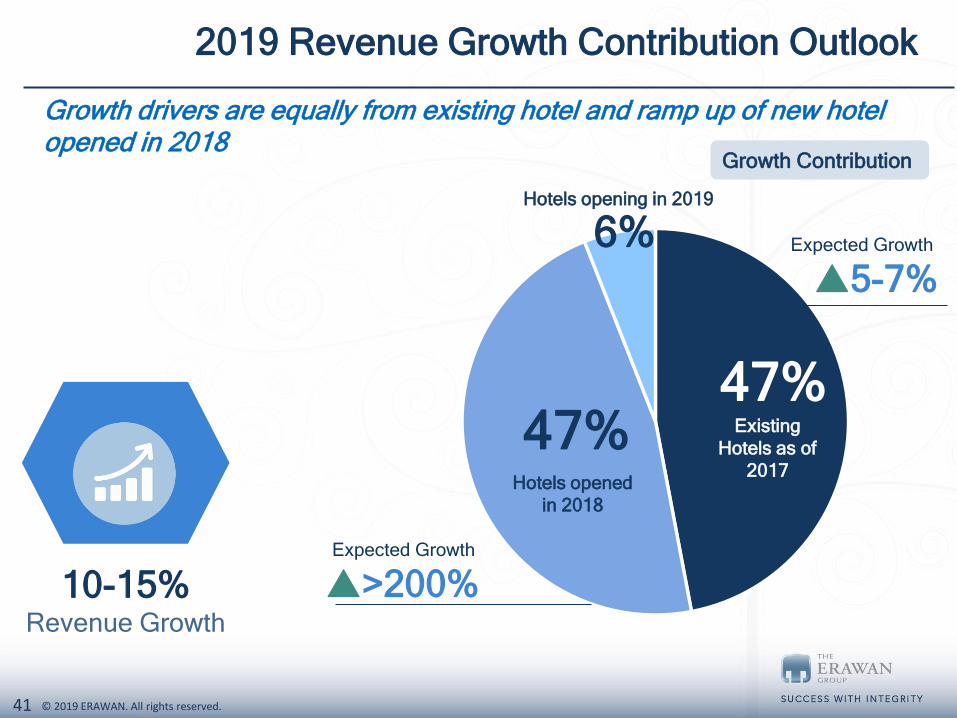
2019 Revenue Growth Contribution Outlook
Existing
Hotels as of
2017
47%47%
Hotels opening in 2019
6% Expected Growth
5-7%
Expected Growth
>200%
Hotels opened
in 2018
10-15%Revenue Growth
Growth drivers are equally from existing hotel and ramp up of new hotel opened in 2018
Growth Contribution
42 © 2019 ERAWAN. All rights reserved.
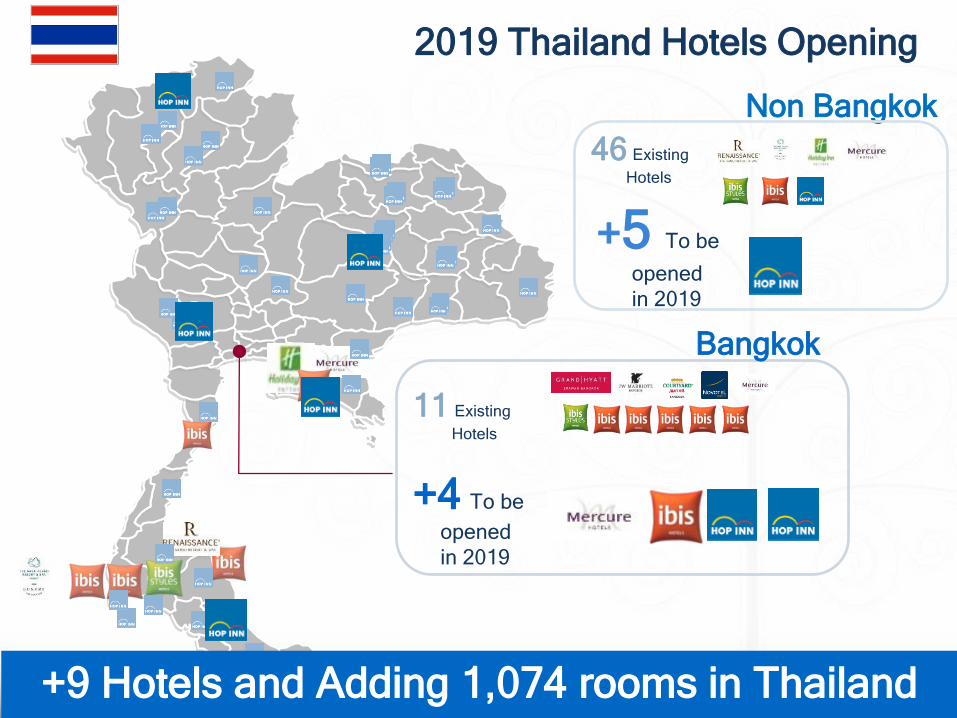
+4 To be
opened
in 2019
2019 Thailand Hotels Opening
+9 Hotels and Adding 1,074 rooms in Thailand
Non Bangkok
46 Existing
Hotels
+5 To be
opened
in 2019
Bangkok
11 Existing
Hotels
43 © 2019 ERAWAN. All rights reserved.
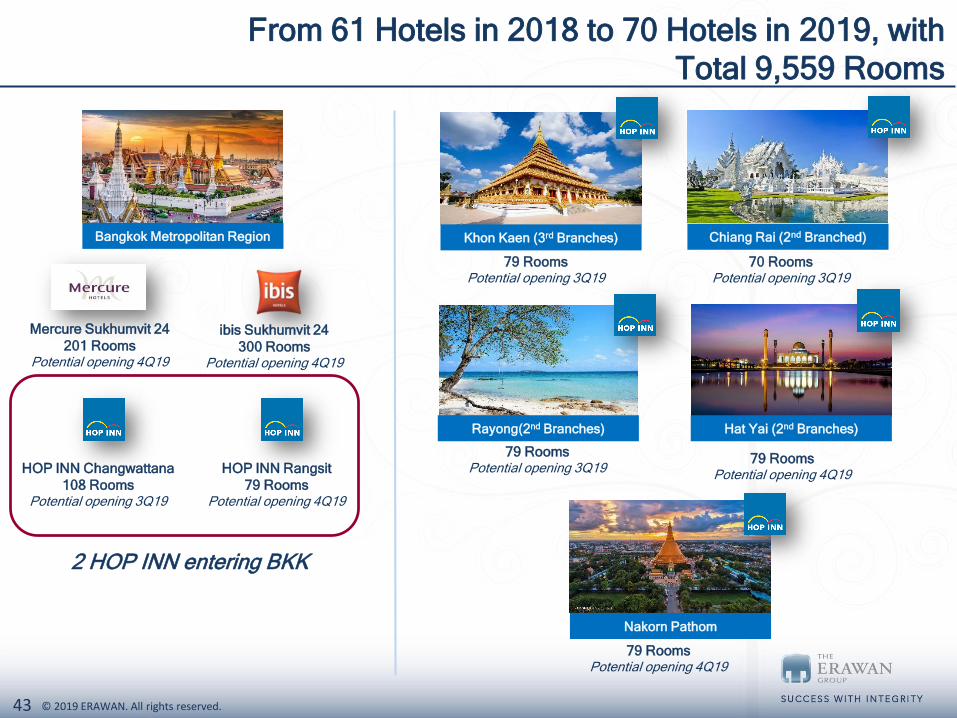
Bangkok Metropolitan Region
Mercure Sukhumvit 24
201 Rooms Potential opening 4Q19
ibis Sukhumvit 24
300 Rooms Potential opening 4Q19
HOP INN Changwattana
108 Rooms Potential opening 3Q19
Khon Kaen (3rd Branches)
HOP INN Rangsit
79 Rooms Potential opening 4Q19
79 Rooms Potential opening 3Q19
Chiang Rai (2nd Branched)
70 Rooms Potential opening 3Q19
Rayong(2nd Branches)
79 Rooms Potential opening 3Q19
Hat Yai (2nd Branches)
79 Rooms Potential opening 4Q19
Nakorn Pathom
79 Rooms Potential opening 4Q19
From 61 Hotels in 2018 to 70 Hotels in 2019, with
Total 9,559 Rooms
2 HOP INN entering BKK
44 © 2019 ERAWAN. All rights reserved.
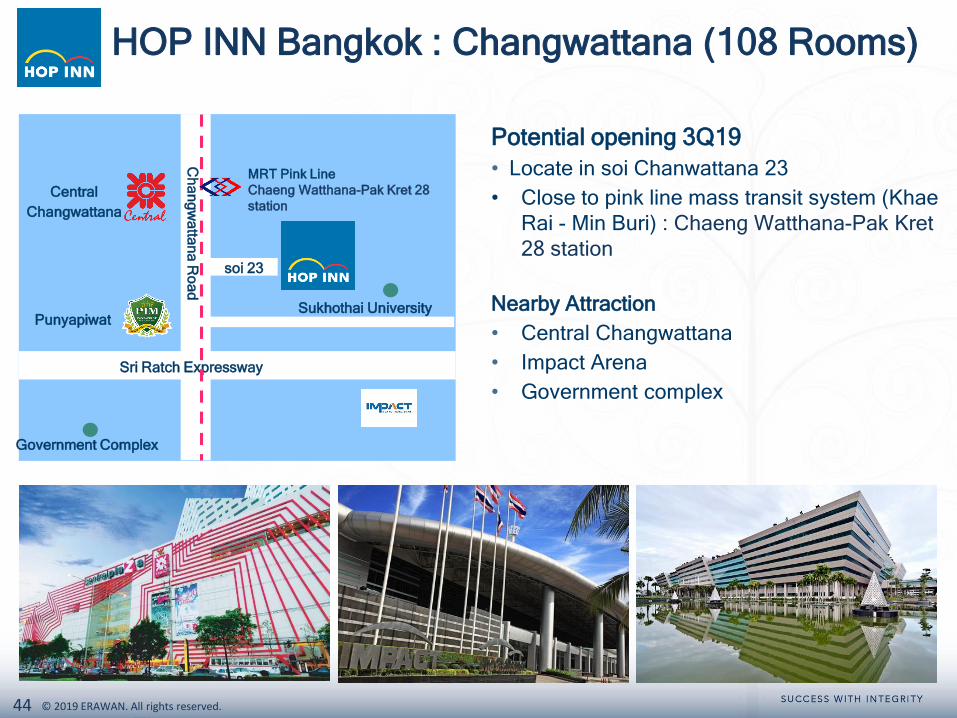
HOP INN Bangkok : Changwattana (108 Rooms)
Potential opening 3Q19
• Locate in soi Chanwattana 23
• Close to pink line mass transit system (Khae
Rai - Min Buri) : Chaeng Watthana-Pak Kret
28 station
Nearby Attraction
• Central Changwattana
• Impact Arena
• Government complex
soi 23
Sri Ratch Expressway
Ch
an
gw
atta
na
Ro
ad
Sukhothai University
Government Complex
Punyapiwat
Central
Changwattana
MRT Pink Line
Chaeng Watthana-Pak Kret 28
station
45 © 2019 ERAWAN. All rights reserved.
Phaholyothin Road
Ra
ng
sit-N
akh
on
Na
yo
kro
ad
ad
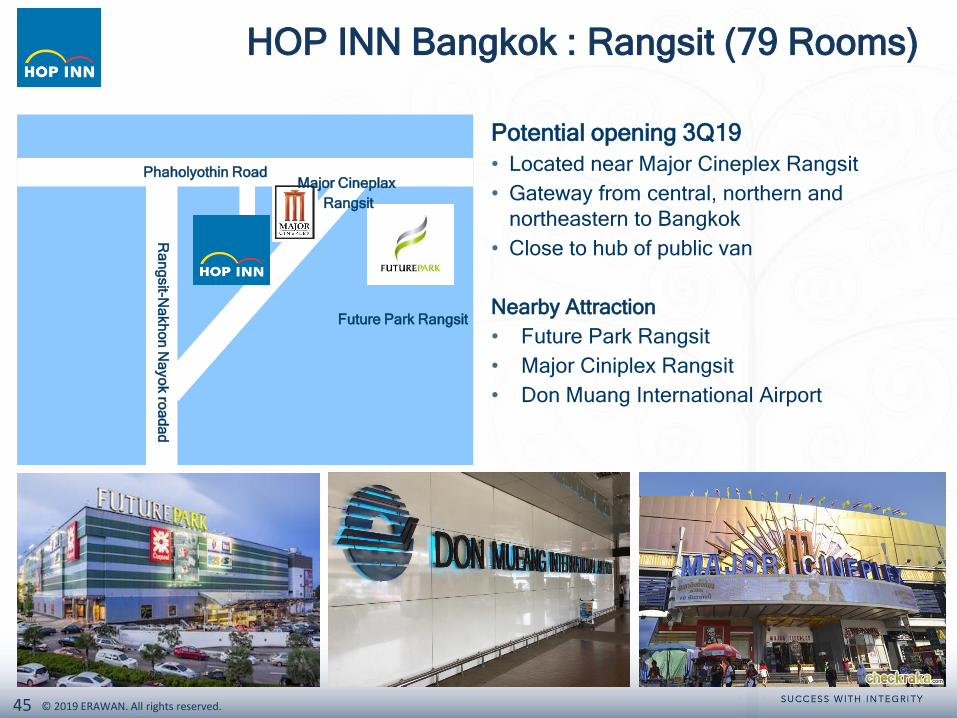
HOP INN Bangkok : Rangsit (79 Rooms)
Potential opening 3Q19
• Located near Major Cineplex Rangsit
• Gateway from central, northern and
northeastern to Bangkok
• Close to hub of public van
Nearby Attraction
• Future Park Rangsit
• Major Ciniplex Rangsit
• Don Muang International Airport
Future Park Rangsit
Major Cineplax
Rangsit
46 © 2019 ERAWAN. All rights reserved.
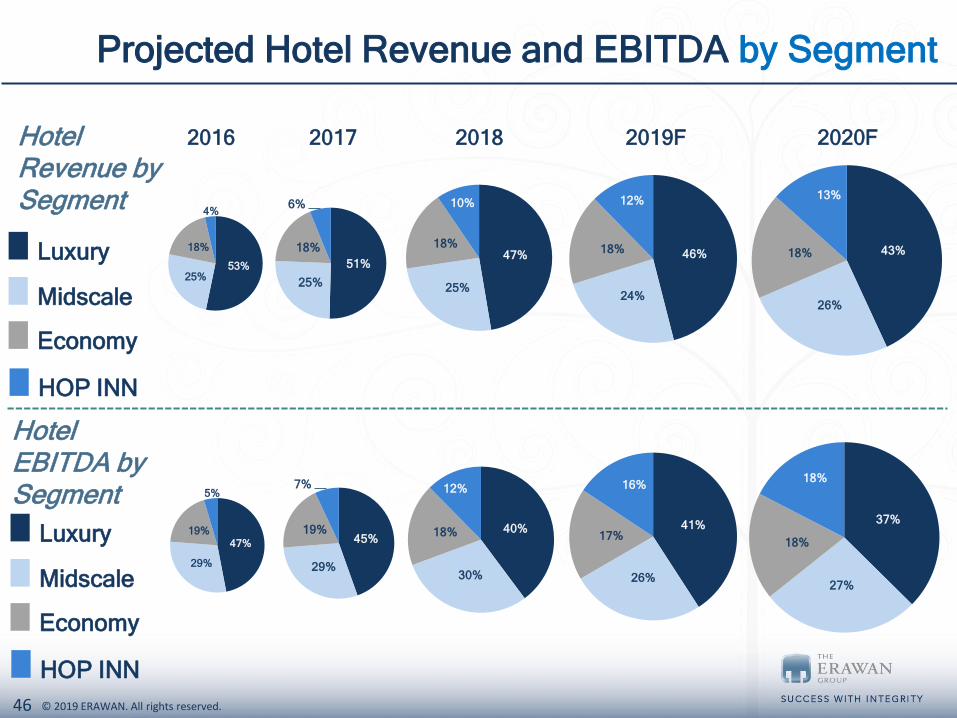
Luxury
Midscale
Economy
HOP INN
Luxury
Midscale
Economy
HOP INN
53%25%
18%
4%
2016
47%
29%
19%
5%
2019F
46%
24%
18%
12%
41%
26%
17%
16%
Projected Hotel Revenue and EBITDA by Segment
Hotel Revenue by Segment
Hotel EBITDA by Segment
2020F
43%
26%
18%
13%
37%
27%
18%
18%
2017
45%
29%
19%
7%
51%
25%
18%
6%
47%
25%
18%
10%
2018
40%
30%
18%
12%
47 © 2019 ERAWAN. All rights reserved.
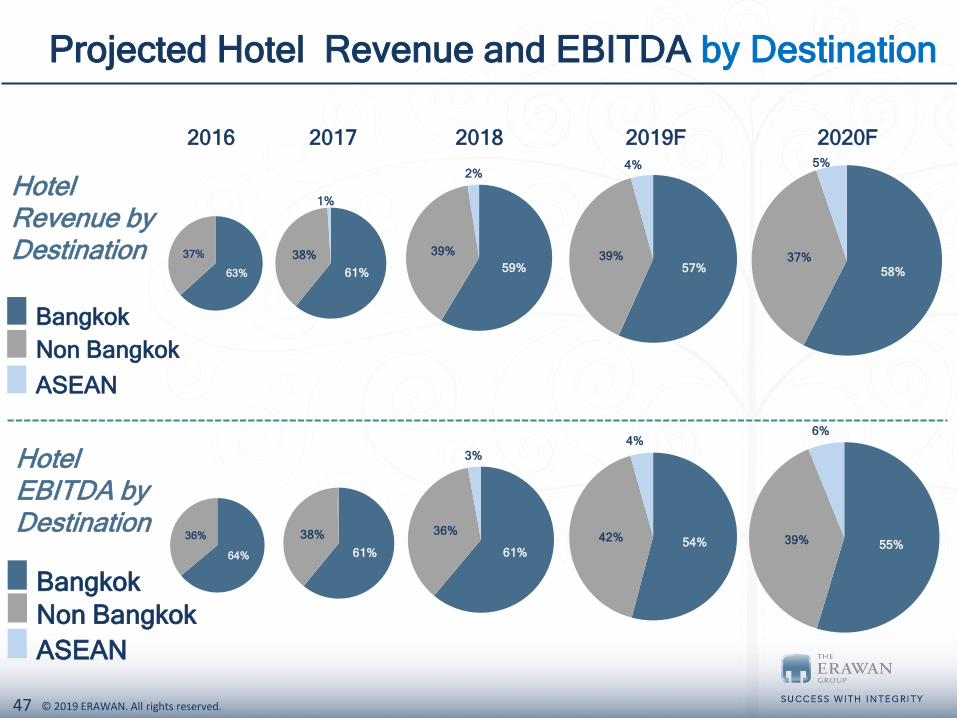
2020F
58%
37%
5%
55%39%
6%
2019F
57%39%
4%
54%42%
4%
63%
37%
2016
64%
36%
59%
39%
2%
2018
61%
36%
3%
2017
61%
38%
61%
38%
1%
Projected Hotel Revenue and EBITDA by Destination
Bangkok
ASEAN
Non Bangkok
Bangkok
ASEAN
Non Bangkok
Hotel Revenue by Destination
Hotel EBITDA by Destination
48 © 2019 ERAWAN. All rights reserved.
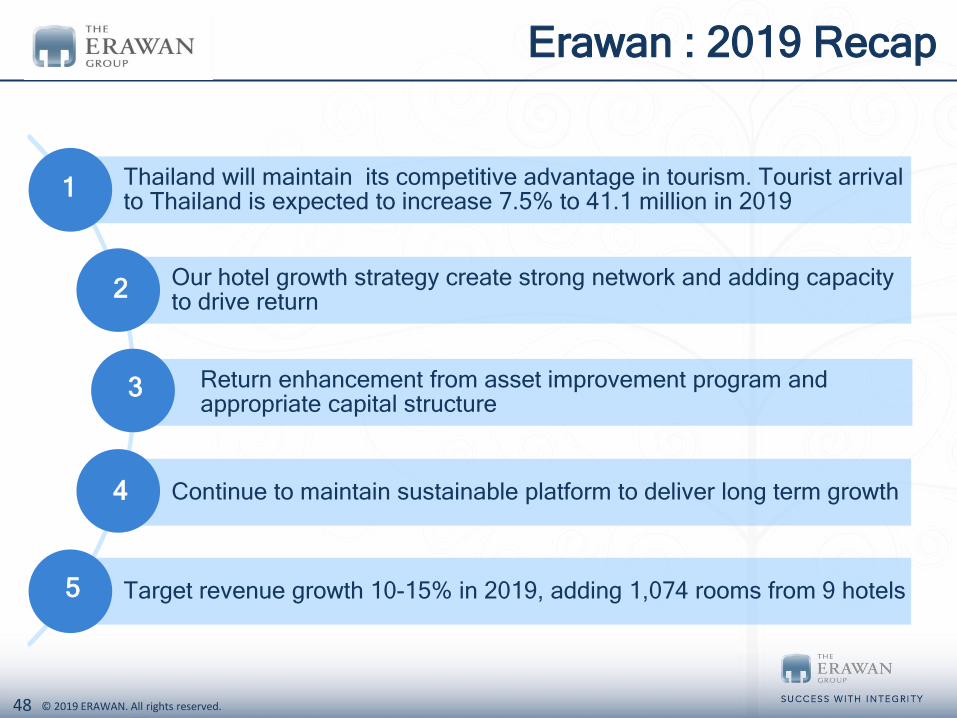
Erawan : 2019 Recap
Thailand will maintain its competitive advantage in tourism. Tourist arrival to Thailand is expected to increase 7.5% to 41.1 million in 2019
Our hotel growth strategy create strong network and adding capacity to drive return
Return enhancement from asset improvement program and appropriate capital structure
Continue to maintain sustainable platform to deliver long term growth
Target revenue growth 10-15% in 2019, adding 1,074 rooms from 9 hotels
1
2
3
4
5

49 © 2019 ERAWAN. All rights reserved.
Q & A

50 © 2019 ERAWAN. All rights reserved.
Success with Integrity
5151 © 2016 ERAWAN. All rights reserved.
Appendix
4Q18 & 2018 Review
5252 © 2016 ERAWAN. All rights reserved.
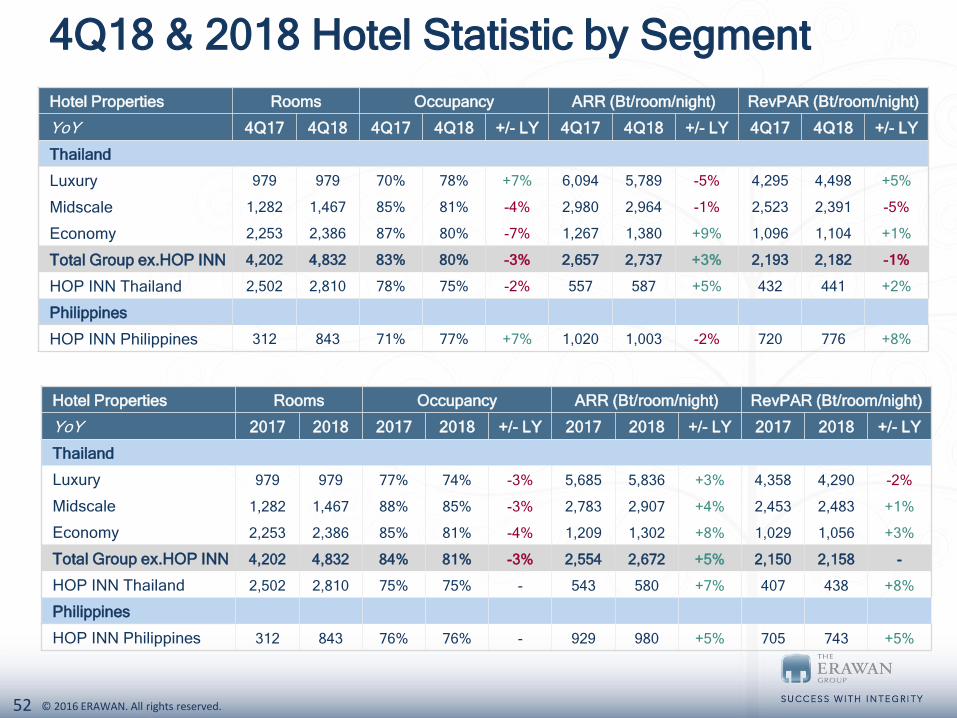
4Q18 & 2018 Hotel Statistic by Segment
Hotel Properties Rooms Occupancy ARR (Bt/room/night) RevPAR (Bt/room/night)
YoY 4Q17 4Q18 4Q17 4Q18 +/- LY 4Q17 4Q18 +/- LY 4Q17 4Q18 +/- LY
Thailand
Luxury 979 979 70% 78% +7% 6,094 5,789 -5% 4,295 4,498 +5%
Midscale 1,282 1,467 85% 81% -4% 2,980 2,964 -1% 2,523 2,391 -5%
Economy 2,253 2,386 87% 80% -7% 1,267 1,380 +9% 1,096 1,104 +1%
Total Group ex.HOP INN 4,202 4,832 83% 80% -3% 2,657 2,737 +3% 2,193 2,182 -1%
HOP INN Thailand 2,502 2,810 78% 75% -2% 557 587 +5% 432 441 +2%
Philippines
HOP INN Philippines 312 843 71% 77% +7% 1,020 1,003 -2% 720 776 +8%
Hotel Properties Rooms Occupancy ARR (Bt/room/night) RevPAR (Bt/room/night)
YoY 2017 2018 2017 2018 +/- LY 2017 2018 +/- LY 2017 2018 +/- LY
Thailand
Luxury 979 979 77% 74% -3% 5,685 5,836 +3% 4,358 4,290 -2%
Midscale 1,282 1,467 88% 85% -3% 2,783 2,907 +4% 2,453 2,483 +1%
Economy 2,253 2,386 85% 81% -4% 1,209 1,302 +8% 1,029 1,056 +3%
Total Group ex.HOP INN 4,202 4,832 84% 81% -3% 2,554 2,672 +5% 2,150 2,158 -
HOP INN Thailand 2,502 2,810 75% 75% - 543 580 +7% 407 438 +8%
Philippines
HOP INN Philippines 312 843 76% 76% - 929 980 +5% 705 743 +5%

53 © 2019 ERAWAN. All rights reserved.
Success with Integrity