quantitatively analyze the impact of land use/land cover change on annual runoff decrease
TRANSCRIPT
ORI GIN AL PA PER
Quantitatively analyze the impact of land use/land coverchange on annual runoff decrease
Jianzhu Li • Senming Tan • Fulong Chen • Ping Feng
Received: 13 December 2013 / Accepted: 12 May 2014� Springer Science+Business Media Dordrecht 2014
Abstract Annual runoff in Luanhe river basin was detected a downward trend and
caused water crisis in Tianjin, China. To quantify the decreased runoff volume, Mann–
Kendall test and Pettitt test were employed to check whether there existed significant trend
and change points for annual rainfall and runoff time series in Panjiakou reservoir basin
and 8 sub-watersheds. It was found that the annual runoff time series had a significant
downward trend at 5 % confidence level, and the change point was at 1979 in Panjiakou
reservoir watershed. Then double mass curve of annual rainfall and annual runoff was
plotted, and two lines were fitted before and after 1979, respectively. Based on this method,
the comprehensive effects of land use/land cover change on annual runoff were estimated.
To further quantify the contributions of each main factor to annual runoff decrease, water
stored in check dams and social water use in different periods were surveyed first. And then
multi-linear regression was used to develop the relations between annual runoff and the
driven factors. Water area decrease was identified to be the main factor contributing to
annual runoff reduction. The results in this study can provide valuable information for
water resources planners and policy makers.
Keywords Runoff decrease quantification � Land use/land cover change � Trend
test � Change point detection � Luanhe river basin
1 Introduction
Environmental change caused by climate change and human activities has triggered many
environmental, biological, hydrological, and social problems and so on (Christensen et al.
2004; Ghosh and Misra 2010; Ferguson and Maxwell 2012). Climate change in global
J. Li (&) � S. Tan � F. Chen � P. FengState Key Laboratory of Hydraulic Engineering Simulation and Safety, Tianjin University,Tianjin 300072, Chinae-mail: [email protected]
123
Nat HazardsDOI 10.1007/s11069-014-1237-x
scale has led to sea level rise and extreme floods and droughts in different areas (Dub-
rovsky et al. 2009; Ranger et al. 2011), and human activities may intensify these natural
hazards caused by climate change (Liu et al. 2004; Saghafian et al. 2008). Water resources
variation is such a problem that caused by climate change and human activities and
difficult to distinguish the contributions of the two controlling factors.
Statistics and hydrological models are effective tools for research of water resources
evolution (Kim and Kaluarachchi 2009). Linear model (Shahin et al. 1993) and Mann–
Kendall rank correlation test are popular methods to test trend in time series, and they can
give a reasonable results under a confidence level (Mann 1945; Kendall 1975). The sim-
plest of linear trend detection models is Student’s t test, which requires that the series under
testing should be normally distributed. Thus, whether or not the sample data follow a
normal distribution has to be examined prior in order to applying the Student’s t test. If
normality is violated, the Mann–Kendall test is commonly applied. Another important
trend test is the Spearman Rank Order Correlation test, which has been applied by Khan
(2001) and Adeloye and Montaseri (2002). However, the managers wondered to know the
driven factors of water resources variation except the trend. Many studies have docu-
mented concerns toward the hydrological effects of intensified human activities (Schulze
2000; Ma et al. 2010). Dooge et al. (1999) and Milly and Dunne (2002) provided a
framework for evaluating the sensitivity of the annual runoff to precipitation and potential
evapotranspiration and had been widely used in recent years. Generally, the hydrological
models were established based on water balance equation for their large time scale. Ren
et al. (2002) estimated the effect of human activities on the runoff by computing the
impacts on each component of a water balance equation. However, these studies treated the
research areas as one uniform unit, giving little consideration on spatial heterogeneity
within the basin.
The Luanhe river basin suffered from water crisis in the past decades due to less rainfall
and human activities. The basin is very important to Tianjin city, a very large city in China, for
water supply. It was planned to introduce water of 10 9 108 m3 to Tianjin every year from
Luanhe river basin. But the actual amount of water transferred to Tianjin was less than the
planned in several years, especially in the last decade (Feng et al. 2008). The basin had been
disturbed severely by soil and water conservation after 1980, and the average annual runoff
had decreased by 30 % after 1980 due to rainfall reduction and soil and water conservation (Li
and Feng 2007). However, little quantitative research of the effects of climate change and
human activities on water resources had been carried out in the Luanhe river basin.
The main objectives of this study were to (1) analyze the tendency of annual runoff in
Panjiakou reservoir watershed using long time series from 1956 to 2002, (2) detect the
change point of the annual runoff time series to classify undisturbed and disturbed periods,
and (3) quantify the contributions of the main factors to water resources reduction. It is of
great significance for water resources managers to make plan and decisions.
2 Study area
The area controlled by Panjiakou reservoir in the Luanhe river basin was selected as the
study area for its great importance in Tianjin water supply and for its completed meteo-
rological and hydrological time series. Luanhe river basin, located in the northeast part of
China, has a drainage area of 33,700 km2 and lies between 115�400–119�200E longitude
and 39�100–42�350N latitude with the elevation ranging from 2 to 2205 m (the mean
elevation is 766 m). About 98 % of the drainage area is mountainous region, and about
Nat Hazards
123
2 % is plain. The watershed receives an average precipitation of 560 mm, mostly in the
summer (70–80 %), especially in July and August and an average runoff of
46.94 9 108 m3 per year. The flood is often resulted from rainstorm, and also in July and
August. Because of the short duration and high intensity of the rainstorms, the flood is of
high peak and large amount, and the duration of the flood is between 3 and 6 days. The
average temperature is between -0.3–11 �C and gradually lowers from southeast to
northwest. The average potential evapotranspiration reaches 950–1,150 mm per year, and
the highest can reach 1,801 mm per year. The average absolute humidity is 9.6 mba, and
the average relative humidity is 60–70 %.
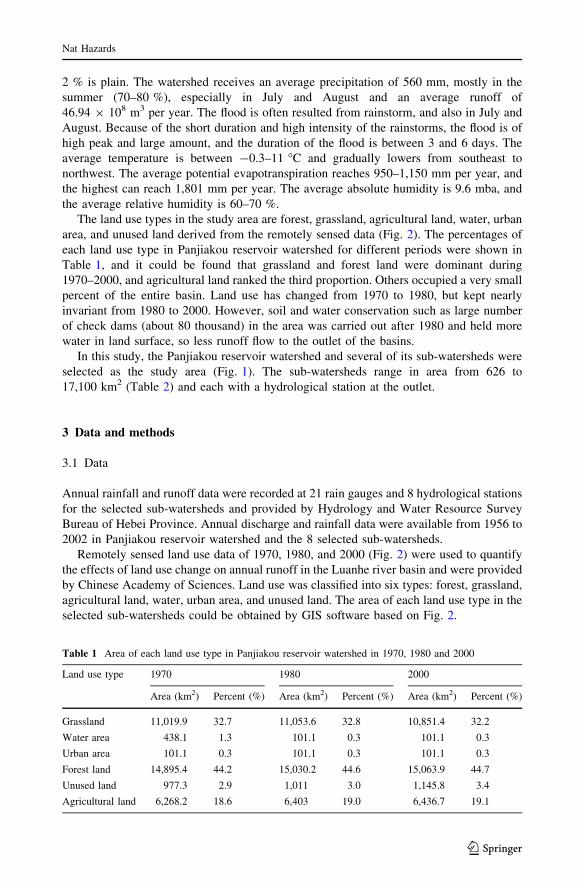
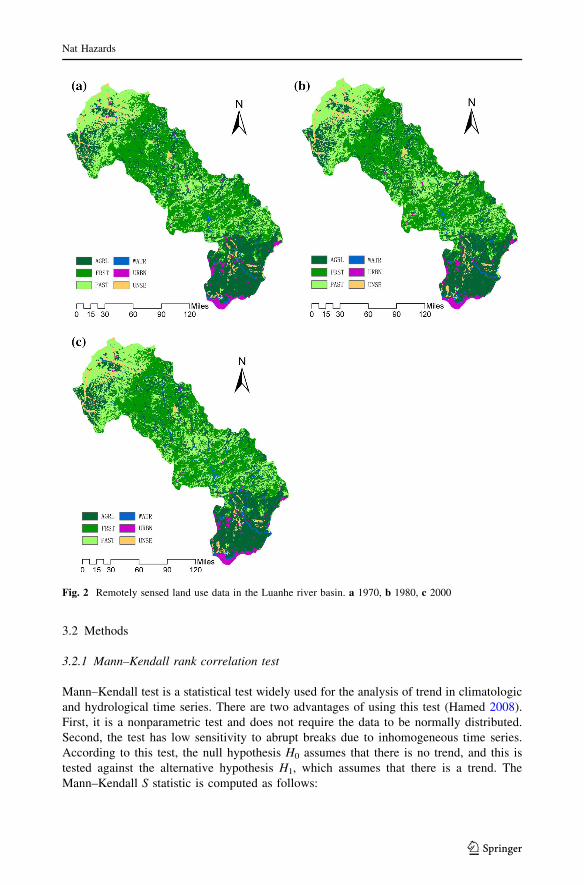
The land use types in the study area are forest, grassland, agricultural land, water, urban
area, and unused land derived from the remotely sensed data (Fig. 2). The percentages of
each land use type in Panjiakou reservoir watershed for different periods were shown in
Table 1, and it could be found that grassland and forest land were dominant during
1970–2000, and agricultural land ranked the third proportion. Others occupied a very small
percent of the entire basin. Land use has changed from 1970 to 1980, but kept nearly
invariant from 1980 to 2000. However, soil and water conservation such as large number
of check dams (about 80 thousand) in the area was carried out after 1980 and held more
water in land surface, so less runoff flow to the outlet of the basins.
In this study, the Panjiakou reservoir watershed and several of its sub-watersheds were
selected as the study area (Fig. 1). The sub-watersheds range in area from 626 to
17,100 km2 (Table 2) and each with a hydrological station at the outlet.
3 Data and methods
3.1 Data
Annual rainfall and runoff data were recorded at 21 rain gauges and 8 hydrological stations
for the selected sub-watersheds and provided by Hydrology and Water Resource Survey
Bureau of Hebei Province. Annual discharge and rainfall data were available from 1956 to
2002 in Panjiakou reservoir watershed and the 8 selected sub-watersheds.
Remotely sensed land use data of 1970, 1980, and 2000 (Fig. 2) were used to quantify
the effects of land use change on annual runoff in the Luanhe river basin and were provided
by Chinese Academy of Sciences. Land use was classified into six types: forest, grassland,
agricultural land, water, urban area, and unused land. The area of each land use type in the
selected sub-watersheds could be obtained by GIS software based on Fig. 2.
Table 1 Area of each land use type in Panjiakou reservoir watershed in 1970, 1980 and 2000
Land use type 1970 1980 2000
Area (km2) Percent (%) Area (km2) Percent (%) Area (km2) Percent (%)
Grassland 11,019.9 32.7 11,053.6 32.8 10,851.4 32.2
Water area 438.1 1.3 101.1 0.3 101.1 0.3
Urban area 101.1 0.3 101.1 0.3 101.1 0.3
Forest land 14,895.4 44.2 15,030.2 44.6 15,063.9 44.7
Unused land 977.3 2.9 1,011 3.0 1,145.8 3.4
Agricultural land 6,268.2 18.6 6,403 19.0 6,436.7 19.1
Nat Hazards
123
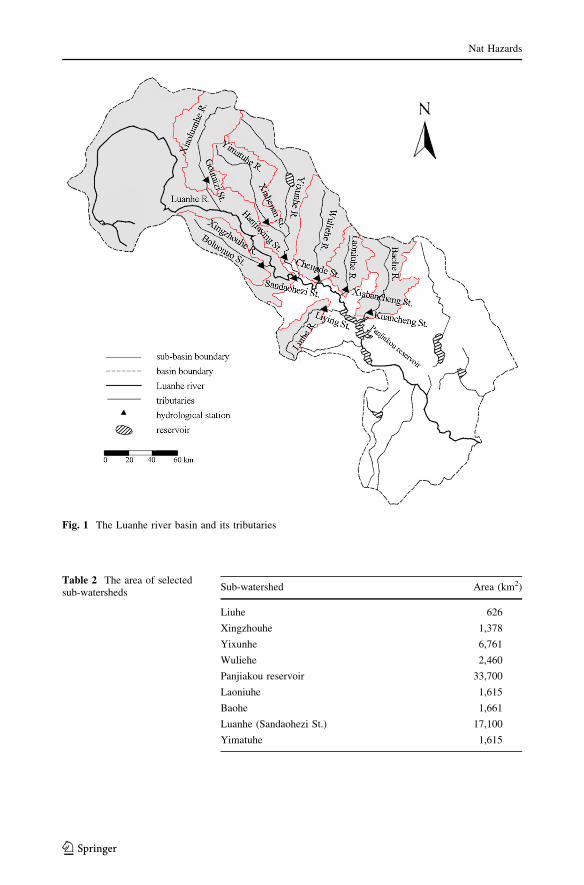
Fig. 1 The Luanhe river basin and its tributaries
Table 2 The area of selectedsub-watersheds
Sub-watershed Area (km2)
Liuhe 626
Xingzhouhe 1,378
Yixunhe 6,761
Wuliehe 2,460
Panjiakou reservoir 33,700
Laoniuhe 1,615
Baohe 1,661
Luanhe (Sandaohezi St.) 17,100
Yimatuhe 1,615
Nat Hazards
123
3.2 Methods
3.2.1 Mann–Kendall rank correlation test
Mann–Kendall test is a statistical test widely used for the analysis of trend in climatologic
and hydrological time series. There are two advantages of using this test (Hamed 2008).
First, it is a nonparametric test and does not require the data to be normally distributed.
Second, the test has low sensitivity to abrupt breaks due to inhomogeneous time series.
According to this test, the null hypothesis H0 assumes that there is no trend, and this is
tested against the alternative hypothesis H1, which assumes that there is a trend. The
Mann–Kendall S statistic is computed as follows:
Fig. 2 Remotely sensed land use data in the Luanhe river basin. a 1970, b 1980, c 2000
Nat Hazards
123
S ¼Xn�1
i¼1
Xn
j¼iþ1
signðTj � TiÞ ð1Þ
signðTj � TiÞ ¼1 if Tj � Ti [ 0
0 if Tj � Ti ¼ 0
�1 if Tj � Ti\0
8><
>:ð2Þ
where Tj and Ti are annual values in years j and i, j [ i, respectively.
The two-tailed test is used. At certain probability level, H0 is rejected in favor of H1 if
the absolute value of S equals or exceeds a specified value S/2, where S/2 is the smallest
S which has the probability less than /2 to appear in case of no trend. A positive (negative)
value of S indicates an upward (downward) trend.
3.2.2 Pettitt test
A number of methods can be applied to determine change points of a time series. In this
study, the nonparametric Pettitt change point test is used first to detect occurrence of the
abrupt change. It is a rank-based and distribution-free test for detecting a significant change
in the mean of a time series (Pettitt 1979). The Pettitt test considers a time series as two
samples represented by x1,…, xt and xt?1,…,xT. For continuous, data the indices V(t) and
U(t) can be calculated from the following formula
Ut;T ¼ Ut�1;T þ Vt;T ð3Þ
For t = 2,…,T,
Vt;T ¼XT
j¼1
sgnðxt � xjÞ ð4Þ
where,
sgnðhÞ ¼1 h[ 0
0 h ¼ 0
�1 h\0
8><
>:
The most significant change point is found where the value |Ut,T| is maximum. The
approximate significance probability, p(t), of a change point can then be calculated from
pðtÞ ¼ 1� exp�6U2
t;T
T3 þ T2
!ð5Þ
3.2.3 Multiple linear regression
The impacts of check dams on annual runoff were surveyed, and the quantitative contri-
butions of land use to annual runoff were obtained by multi-linear regression (MLR). MLR
is a method used to model the linear relationship between a dependent variable and one or
more independent variables. There is a dependent variable, y, a number of independent
variables, x1, x2,…, xp, and the model is defined in general terms by:
Nat Hazards
123
y ¼ b0 þ b1x1 þ b2x2 þ � � � þ bpxp þ n ð6Þ
where n, the ‘‘noise’’ variable, is a normally distributed random variable with a mean
equaling zero and a standard deviation of r, whose magnitude is not known. The values of
the coefficients b0, b1, b2,…, bp are to be estimated so as to minimize the sum of squares of
differences between the observed y values in the data and the ones predicted by Eq. (6).
Herein, annual runoff was considered as the dependent variable, and the independent
variables included nine possible related factors such as annual rainfall, mean slope and area
of the sub-watersheds, and each land use type. By using this method, there are some
assumptions: (1) Annual runoff has a linear correlation with all the control factors. (2) All
control factors are irrelevant with each other, so we can use the selected variables to make
regression analysis directly. (3) Except the selected variables, other factors such as
watershed elevation, soil types are considered to have a slight influence on runoff gen-
eration. But this effect was covered by land use. Because there are many different soil
types, and it is difficult to make MLR analysis, and we ignore it. The most advantages of
MLR are that less hydro-meteorological data are needed, and runoff generation mechanism
is not necessarily known compared with hydrological modeling.
MLR technique was applied to each input and output dataset to determine best corre-
lation between parameters. For output parameter (annual runoff), input parameters
changing from one to nine variables were tried to obtain best correlation between them,
and best correlations were obtained using several of the eight input parameters for each
output parameter.
4 Results
4.1 Annual rainfall and runoff trend
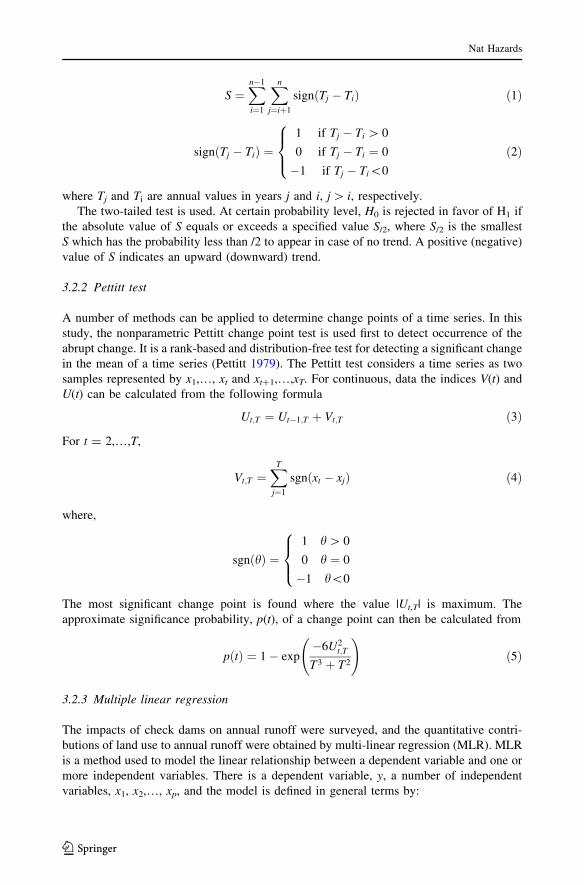
The annual rainfall and runoff time series during 1956–2002 are shown in Fig. 3, and the
rainfall exhibit a fluctuation and no trends for all the sub-watersheds. However, we could
see a stepwise decrease in Luanhe and Panjiakou reservoir for annual runoff, but no visible
trend in other sub-watersheds.
The trends of annual rainfall and runoff time series of Panjiakou reservoir watershed
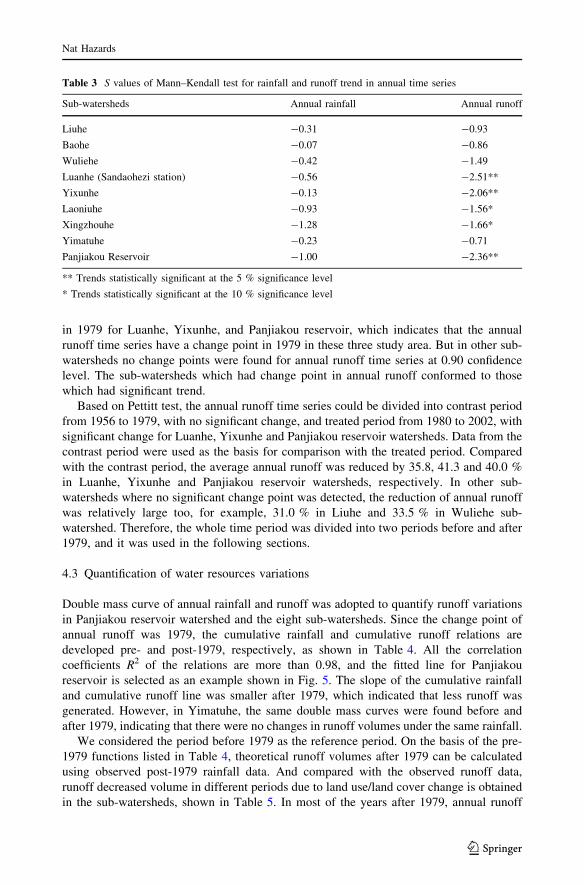
and the 8 sub-watersheds were then tested by Mann–Kendall method, and the statistic
S values are listed in Table 3. All sub-watersheds did not exhibit significant downward
trends for the annual rainfall time series at 5 % significance level. However, Luanhe
(Sandaohezi station), Yixunhe, and Panjiakou reservoir exhibited significant downward
trends at 5 % significance level for annual runoff time series, and Wuliehe and Xingzhouhe
had significant downward trend at 10 % significance level. No significant trends were
detected in Liuhe, Baohe, Wuliehe, and Yimatuhe sub-watersheds. Therefore, the decrease
trend of annual runoff in Panjiakou reservoir was mainly caused by runoff decrease in
Luanhe, Yixunhe, Laoniuhe and Xingzhouhe sub-watersheds.
4.2 Change point detection of annual rainfall and runoff
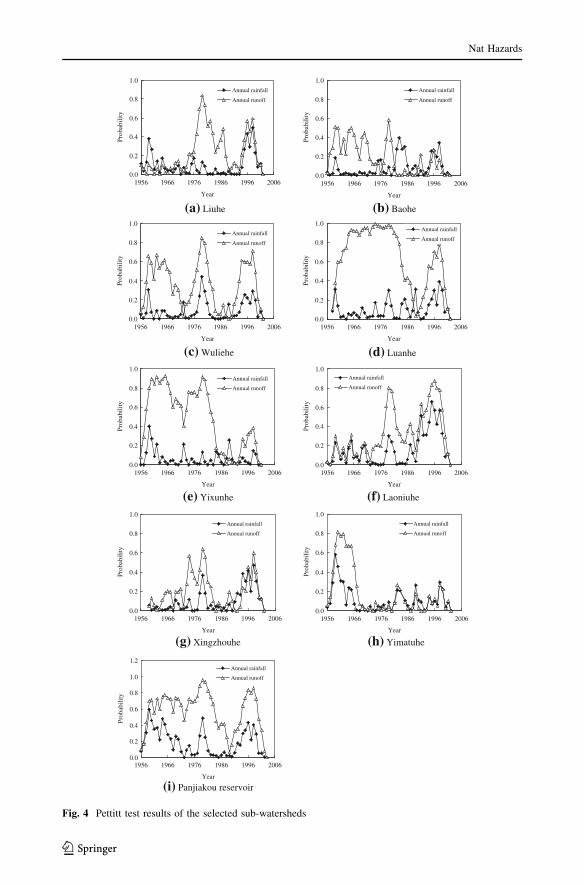
Figure 4 showed the change points of the annual rainfall and runoff time series for Pan-
jiakou reservoir watershed and the 8 sub-watersheds using Pettitt test. At 0.90 confidence
level, we can’t find any statistically significant change point for the annual rainfall time
series. However, the highest points greater than 0.90 for annual runoff time series occurred
Nat Hazards
123
0.0
200.0
400.0
600.0
800.0
1000.0
1200.0
1400.0
1956 1966 1976 1986 1996 2006
Year
Ann
ual r
ainf
all(
mm
)
0.0
2.0
4.0
6.0
8.0
10.0
Ann
ual r
unof
f(10
8 m3 )
Annual rainfall time seriesAnnual runoff time series
0.0
200.0
400.0
600.0
800.0
1000.0
1200.0
1400.0
1956 1966 1976 1986 1996 2006
Year
Ann
ual r
ainf
all(
mm
)
0.0
1.0
2.0
3.0
4.0
5.0
Ann
ual r
unof
f(10
8 m3 )
Annual rainfall time seriesAnnual runoff time series
(a) Liuhe (b) Baohe
0.0
200.0
400.0
600.0
800.0
1000.0
1956 1966 1976 1986 1996 2006
Year
Ann
ual r
ainf
all(
mm
)
0.0
5.0
10.0
15.0
20.0
Ann
ual r
unof
f(10
8 m3 )
Annual rainfall time seriesAnnual runoff time series
0.0
200.0
400.0
600.0
800.0
1000.0
1956 1966 1976 1986 1996 2006
Year
Ann
ual r
ainf
all(
mm
)
0.0
10.0
20.0
30.0
40.0
50.0
Ann
ual r
unof
f(10
8 m3 )
Annual rainfall time seriesAnnual runoff time series
(c) Wuliehe (d) Luanhe
0.0
200.0
400.0
600.0
800.0
1000.0
1956 1966 1976 1986 1996 2006
Year
Ann
ual r
ainf
all(
mm
)
0.0
10.0
20.0
30.0
40.0
Ann
ual r
unof
f(10
8 m3 )
Annual rainfall time seriesAnnual runoff time series
0.0
200.0
400.0
600.0
800.0
1000.0
1956 1966 1976 1986 1996 2006
Year
Ann
ual r
ainf
all(
mm
)
0.0
2.0
4.0
6.0
8.0
10.0
Ann
ual r
unof
f(10
8 m3 )
Annual rainfall time seriesAnnual runoff time series
(e) Yixunhe (f) Laoniuhe
0.0
200.0
400.0
600.0
800.0
1000.0
1956 1966 1976 1986 1996 2006
Year
Ann
ual r
ainf
all(
mm
)
0.0
2.0
4.0
6.0
Ann
ual r
unof
f(10
8 m3 )
Annual rainfall time seriesAnnual runoff time series
0.0
200.0
400.0
600.0
800.0
1000.0
1956 1966 1976 1986 1996 2006
Year
Ann
ual r
ainf
all(
mm
)
0.0
2.0
4.0
6.0
8.0
10.0
Ann
ual r
unof
f(10
8 m3 )
Annual rainfall time seriesAnnual runoff time series
(g) Xingzhouhe (h) Yimatuhe
0
200
400
600
800
1956 1966 1976 1986 1996 2006
Year
Ann
ual r
ainf
all(
mm
)
0.0
20.0
40.0
60.0
80.0
100.0
Ann
ual r
unof
f(10
8 m3 )
Annual rainfall time seriesAnnual runoff time series
(i) Panjiakou reservoir
Fig. 3 Annual rainfall and runoff time series of the selected sub-watersheds
Nat Hazards
123
in 1979 for Luanhe, Yixunhe, and Panjiakou reservoir, which indicates that the annual
runoff time series have a change point in 1979 in these three study area. But in other sub-
watersheds no change points were found for annual runoff time series at 0.90 confidence
level. The sub-watersheds which had change point in annual runoff conformed to those
which had significant trend.
Based on Pettitt test, the annual runoff time series could be divided into contrast period
from 1956 to 1979, with no significant change, and treated period from 1980 to 2002, with
significant change for Luanhe, Yixunhe and Panjiakou reservoir watersheds. Data from the
contrast period were used as the basis for comparison with the treated period. Compared
with the contrast period, the average annual runoff was reduced by 35.8, 41.3 and 40.0 %
in Luanhe, Yixunhe and Panjiakou reservoir watersheds, respectively. In other sub-
watersheds where no significant change point was detected, the reduction of annual runoff
was relatively large too, for example, 31.0 % in Liuhe and 33.5 % in Wuliehe sub-
watershed. Therefore, the whole time period was divided into two periods before and after
1979, and it was used in the following sections.
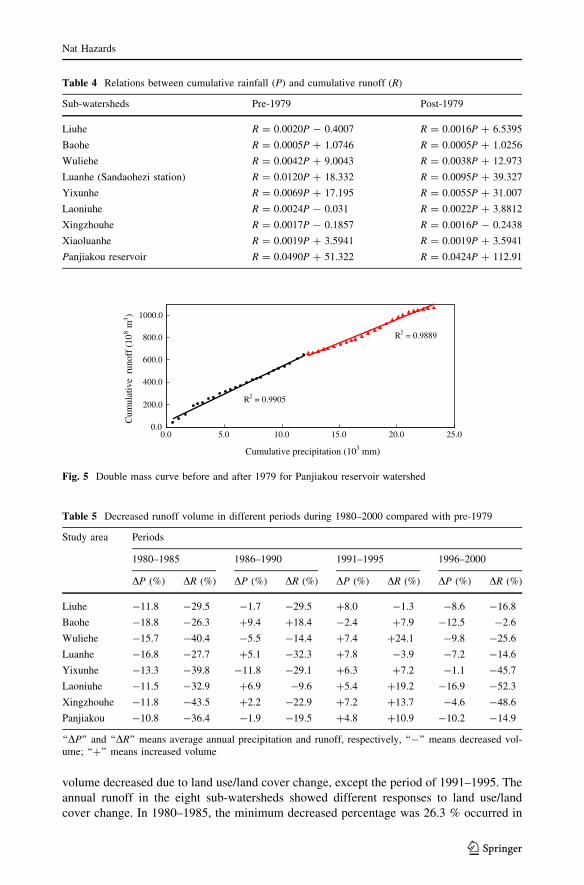
4.3 Quantification of water resources variations
Double mass curve of annual rainfall and runoff was adopted to quantify runoff variations
in Panjiakou reservoir watershed and the eight sub-watersheds. Since the change point of
annual runoff was 1979, the cumulative rainfall and cumulative runoff relations are
developed pre- and post-1979, respectively, as shown in Table 4. All the correlation
coefficients R2 of the relations are more than 0.98, and the fitted line for Panjiakou
reservoir is selected as an example shown in Fig. 5. The slope of the cumulative rainfall
and cumulative runoff line was smaller after 1979, which indicated that less runoff was
generated. However, in Yimatuhe, the same double mass curves were found before and
after 1979, indicating that there were no changes in runoff volumes under the same rainfall.
We considered the period before 1979 as the reference period. On the basis of the pre-
1979 functions listed in Table 4, theoretical runoff volumes after 1979 can be calculated
using observed post-1979 rainfall data. And compared with the observed runoff data,
runoff decreased volume in different periods due to land use/land cover change is obtained
in the sub-watersheds, shown in Table 5. In most of the years after 1979, annual runoff
Table 3 S values of Mann–Kendall test for rainfall and runoff trend in annual time series
Sub-watersheds Annual rainfall Annual runoff
Liuhe -0.31 -0.93
Baohe -0.07 -0.86
Wuliehe -0.42 -1.49
Luanhe (Sandaohezi station) -0.56 -2.51**
Yixunhe -0.13 -2.06**
Laoniuhe -0.93 -1.56*
Xingzhouhe -1.28 -1.66*
Yimatuhe -0.23 -0.71
Panjiakou Reservoir -1.00 -2.36**
** Trends statistically significant at the 5 % significance level
* Trends statistically significant at the 10 % significance level
Nat Hazards
123
0.0
0.2
0.4
0.6
0.8
1.0
1956 1966 1976 1986 1996 2006
Year
Prob
abili
ty
Annual rainfall
Annual runoff
0.0
0.2
0.4
0.6
0.8
1.0
1956 1966 1976 1986 1996 2006
Year
Prob
abili
ty
Annual rainfall
Annual runoff
(a) Liuhe (b) Baohe
0.0
0.2
0.4
0.6
0.8
1.0
1956 1966 1976 1986 1996 2006
Year
Prob
abili
ty
Annual rainfall
Annual runoff
0.0
0.2
0.4
0.6
0.8
1.0
1956 1966 1976 1986 1996 2006
Year
Prob
abili
ty
Annual rainfall
Annual runoff
(c) Wuliehe (d) Luanhe
0.0
0.2
0.4
0.6
0.8
1.0
1956 1966 1976 1986 1996 2006
Year
Prob
abili
ty
Annual rainfall
Annual runoff
0.0
0.2
0.4
0.6
0.8
1.0
1956 1966 1976 1986 1996 2006
Year
Prob
abili
ty
Annual rainfall
Annual runoff
(e) Yixunhe (f) Laoniuhe
0.0
0.2
0.4
0.6
0.8
1.0
1956 1966 1976 1986 1996 2006
Year
Prob
abili
ty
Annual rainfall
Annual runoff
0.0
0.2
0.4
0.6
0.8
1.0
1956 1966 1976 1986 1996 2006
Year
Prob
abili
ty
Annual rainfall
Annual runoff
(g) Xingzhouhe (h) Yimatuhe
0.0
0.2
0.4
0.6
0.8
1.0
1.2
1956 1966 1976 1986 1996 2006
Year
Pro
babi
lity
Annual rainfall
Annual runoff
(i) Panjiakou reservoir
Fig. 4 Pettitt test results of the selected sub-watersheds
Nat Hazards
123
volume decreased due to land use/land cover change, except the period of 1991–1995. The
annual runoff in the eight sub-watersheds showed different responses to land use/land
cover change. In 1980–1985, the minimum decreased percentage was 26.3 % occurred in
Table 4 Relations between cumulative rainfall (P) and cumulative runoff (R)
Sub-watersheds Pre-1979 Post-1979
Liuhe R = 0.0020P - 0.4007 R = 0.0016P ? 6.5395
Baohe R = 0.0005P ? 1.0746 R = 0.0005P ? 1.0256
Wuliehe R = 0.0042P ? 9.0043 R = 0.0038P ? 12.973
Luanhe (Sandaohezi station) R = 0.0120P ? 18.332 R = 0.0095P ? 39.327
Yixunhe R = 0.0069P ? 17.195 R = 0.0055P ? 31.007
Laoniuhe R = 0.0024P - 0.031 R = 0.0022P ? 3.8812
Xingzhouhe R = 0.0017P - 0.1857 R = 0.0016P - 0.2438
Xiaoluanhe R = 0.0019P ? 3.5941 R = 0.0019P ? 3.5941
Panjiakou reservoir R = 0.0490P ? 51.322 R = 0.0424P ? 112.91
R2 = 0.9905
R2 = 0.9889
0.0
200.0
400.0
600.0
800.0
1000.0
0.0 5.0 10.0 15.0 20.0 25.0
Cumulative precipitation (103 mm)
Cum
ulat
ive
run
off
(108 m
3 )
Fig. 5 Double mass curve before and after 1979 for Panjiakou reservoir watershed
Table 5 Decreased runoff volume in different periods during 1980–2000 compared with pre-1979
Study area Periods
1980–1985 1986–1990 1991–1995 1996–2000
DP (%) DR (%) DP (%) DR (%) DP (%) DR (%) DP (%) DR (%)
Liuhe -11.8 -29.5 -1.7 -29.5 ?8.0 -1.3 -8.6 -16.8
Baohe -18.8 -26.3 ?9.4 ?18.4 -2.4 ?7.9 -12.5 -2.6
Wuliehe -15.7 -40.4 -5.5 -14.4 ?7.4 ?24.1 -9.8 -25.6
Luanhe -16.8 -27.7 ?5.1 -32.3 ?7.8 -3.9 -7.2 -14.6
Yixunhe -13.3 -39.8 -11.8 -29.1 ?6.3 ?7.2 -1.1 -45.7
Laoniuhe -11.5 -32.9 ?6.9 -9.6 ?5.4 ?19.2 -16.9 -52.3
Xingzhouhe -11.8 -43.5 ?2.2 -22.9 ?7.2 ?13.7 -4.6 -48.6
Panjiakou -10.8 -36.4 -1.9 -19.5 ?4.8 ?10.9 -10.2 -14.9
‘‘DP’’ and ‘‘DR’’ means average annual precipitation and runoff, respectively, ‘‘-’’ means decreased vol-ume; ‘‘?’’ means increased volume
Nat Hazards
123
Baohe, and the maximum was 43.5 % in Xingzhouhe. In 1986–1990, the decreased per-
centages ranged from 9.6 % in Laoniuhe to 29.5 % in Liuhe, but Baohe was an anomaly in
which the runoff increased 18.4 %. However, in 1991–1995, annual runoff in most of the
sub-watersheds increased from 7.2 % in Yixunhe to 19.2 % in Laoniuhe, except Liuhe and
Luanhe sub-watersheds in which annual runoff decreased. During 1996–2000, annual
runoff in all of the study sites decreased from 2.6 % in Baohe to 52.3 % in Laoniuhe.
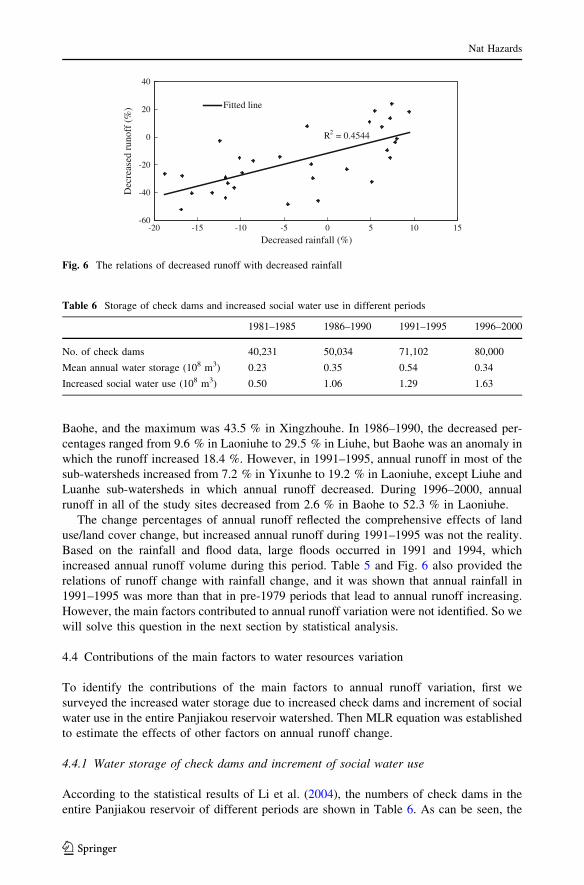
The change percentages of annual runoff reflected the comprehensive effects of land
use/land cover change, but increased annual runoff during 1991–1995 was not the reality.
Based on the rainfall and flood data, large floods occurred in 1991 and 1994, which
increased annual runoff volume during this period. Table 5 and Fig. 6 also provided the
relations of runoff change with rainfall change, and it was shown that annual rainfall in
1991–1995 was more than that in pre-1979 periods that lead to annual runoff increasing.
However, the main factors contributed to annual runoff variation were not identified. So we
will solve this question in the next section by statistical analysis.
4.4 Contributions of the main factors to water resources variation
To identify the contributions of the main factors to annual runoff variation, first we
surveyed the increased water storage due to increased check dams and increment of social
water use in the entire Panjiakou reservoir watershed. Then MLR equation was established
to estimate the effects of other factors on annual runoff change.
4.4.1 Water storage of check dams and increment of social water use
According to the statistical results of Li et al. (2004), the numbers of check dams in the
entire Panjiakou reservoir of different periods are shown in Table 6. As can be seen, the
R2 = 0.4544
-60
-40
-20
0
20
40
-20 -15 -10 -5 0 5 10 15
Decreased rainfall (%)
Dec
reas
ed r
unof
f (%
) Fitted line
Fig. 6 The relations of decreased runoff with decreased rainfall
Table 6 Storage of check dams and increased social water use in different periods
1981–1985 1986–1990 1991–1995 1996–2000
No. of check dams 40,231 50,034 71,102 80,000
Mean annual water storage (108 m3) 0.23 0.35 0.54 0.34
Increased social water use (108 m3) 0.50 1.06 1.29 1.63
Nat Hazards
123

numbers of check dams was increased with time. But the actual water stored in the check
dams annually was not a monotonic trend with increasing numbers of check dams. In fact,
the actual volume of stored water was impacted by the annual rainfall amount. For
example, in 1991–1995, the mean annual rainfall was 521.0 mm which was the largest
among all the periods, and the water stored in the check dams was the maximum. Although
the numbers of check dams in 1996–2000 was the largest, the actual stored water in check
dams was smaller than that in 1991–1995 due to less annual rainfall. Take pre-1979 as
reference period, the increased social water use is also shown in Table 6. The social water
use increased with time, and social water use was greater than the volume of water stored
in check dams.
4.4.2 Land use change contribution to annual runoff variation
Before we established MLR equation, the volume of water stored by check dams and social
water use were added to the observed annual runoff. Since we just collected the total
volume of water stored by check dams in the entire basin, we distributed the total amount
into each sub-watershed according to their area proportion of the sub-watersheds. Annual
runoff was set as dependent variable, and annual precipitation, watershed area, mean
watershed slope, and each land use type were set as independent variables. The relationship
between annual runoff and the driven factors were as Eq. (7).
R ¼ 0:388Pþ 981:66 URBNþ 876:50 WAT� 643:26 UNSE� 105:85AGR� 63:47
ð7Þ
where R is annual runoff (mm), P is annual precipitation (mm), URBN, WAT, UNSE, and
AGR are urban area percentage, water area percentage, unused area percentage, and
agricultural area percentage, respectively. Urban area and water area have a positive effect
on annual runoff, and agricultural land and unused land have a negative effect. Grassland
and forest were not included in the equation, but it doesn’t mean they don’t influence
runoff generation. It was interpreted as: grassland and forest have the same effect on
annual runoff, when they converted to urban area, water, or agricultural land, we could
estimate runoff change by Eq. (7) through increasing the area of urban, water and agri-
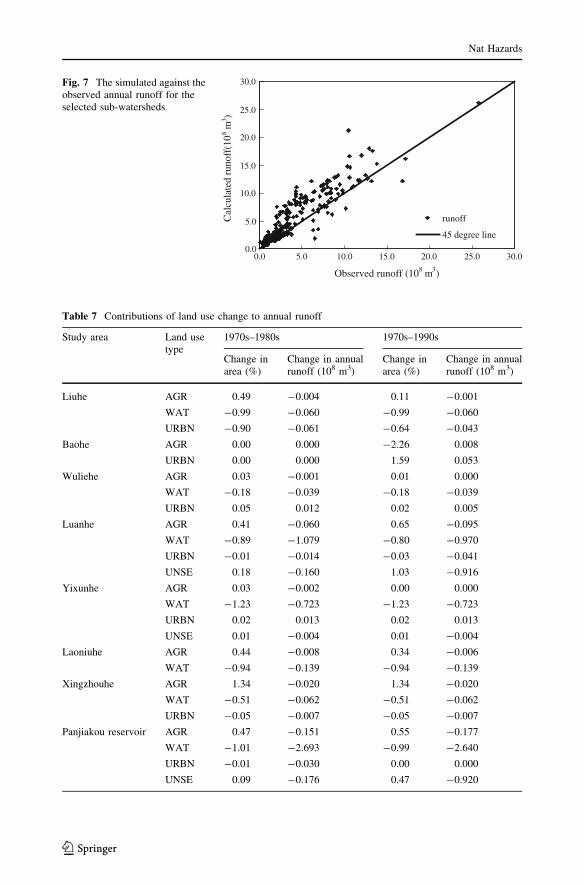
culture. The annual runoff for each selected sub-watershed was simulated by Eq. (7) using
the original data of independent variables, and the simulated results against the observed
annual runoff are plotted in Fig. 7. We could see the data distributed along the 45 degree
line symmetrically, and it was concluded that Eq. (7) indeed had a good performance.
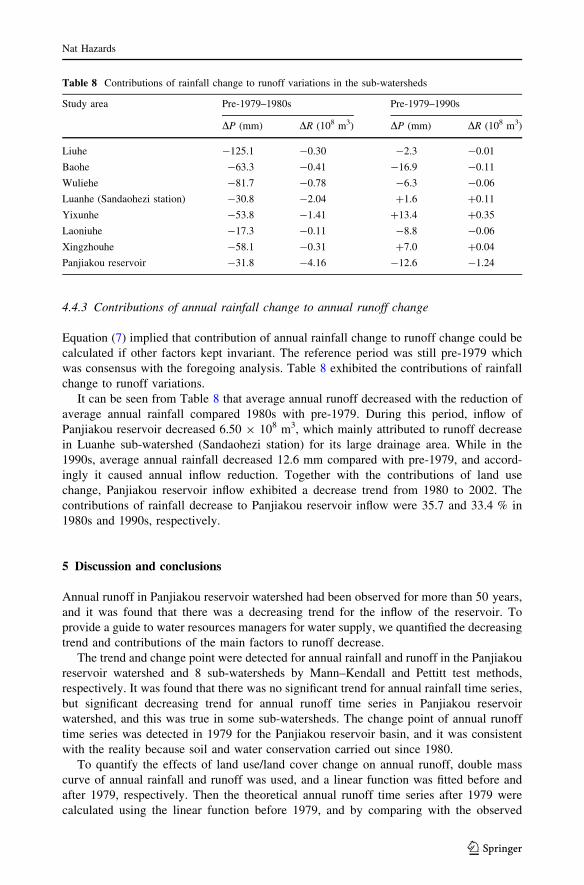
Based on remotely sensed land use data of 1970, 1980, and 2000, the contributions of land
use change to annual runoff were calculated and shown in Table 7.
In each of the sub-watersheds and the entire Panjiakou reservoir basin, decreased water
area was the main factor to lead to annual runoff decrease. Compared with 1970s, annual
runoff decreased 3.051 9 108 m3 in 1980s in the entire Panjiakou reservoir basin, and
decrease in water area reduced 2.693 9 108 m3, which occupied 88.3 % of the decreased
runoff. In 2000s, the average annual runoff was 3.737 9 108 m3 less than that in 1980s,
and decrease in water area was also the main factor. It was due to that the elevations of the
water area were lower than other places, and much more water could store in those areas
during rainfall with the water area decrease. And compared with runoff decrease con-
tributed by check dams and social water use in the entire basin, runoff decrease caused by
land use change was as twice as that caused by check dams and social water use.
Nat Hazards
123
0.0
5.0
10.0
15.0
20.0
25.0
30.0
0.0 5.0 10.0 15.0 20.0 25.0 30.0
Observed runoff (108 m3)
Cal
cula
ted
runo
ff(1
08m
3 )runoff
45 degree line
Fig. 7 The simulated against theobserved annual runoff for theselected sub-watersheds
Table 7 Contributions of land use change to annual runoff
Study area Land usetype
1970s–1980s 1970s–1990s
Change inarea (%)
Change in annualrunoff (108 m3)
Change inarea (%)
Change in annualrunoff (108 m3)
Liuhe AGR 0.49 -0.004 0.11 -0.001
WAT -0.99 -0.060 -0.99 -0.060
URBN -0.90 -0.061 -0.64 -0.043
Baohe AGR 0.00 0.000 -2.26 0.008
URBN 0.00 0.000 1.59 0.053
Wuliehe AGR 0.03 -0.001 0.01 0.000
WAT -0.18 -0.039 -0.18 -0.039
URBN 0.05 0.012 0.02 0.005
Luanhe AGR 0.41 -0.060 0.65 -0.095
WAT -0.89 -1.079 -0.80 -0.970
URBN -0.01 -0.014 -0.03 -0.041
UNSE 0.18 -0.160 1.03 -0.916
Yixunhe AGR 0.03 -0.002 0.00 0.000
WAT -1.23 -0.723 -1.23 -0.723
URBN 0.02 0.013 0.02 0.013
UNSE 0.01 -0.004 0.01 -0.004
Laoniuhe AGR 0.44 -0.008 0.34 -0.006
WAT -0.94 -0.139 -0.94 -0.139
Xingzhouhe AGR 1.34 -0.020 1.34 -0.020
WAT -0.51 -0.062 -0.51 -0.062
URBN -0.05 -0.007 -0.05 -0.007
Panjiakou reservoir AGR 0.47 -0.151 0.55 -0.177
WAT -1.01 -2.693 -0.99 -2.640
URBN -0.01 -0.030 0.00 0.000
UNSE 0.09 -0.176 0.47 -0.920
Nat Hazards
123
4.4.3 Contributions of annual rainfall change to annual runoff change
Equation (7) implied that contribution of annual rainfall change to runoff change could be
calculated if other factors kept invariant. The reference period was still pre-1979 which
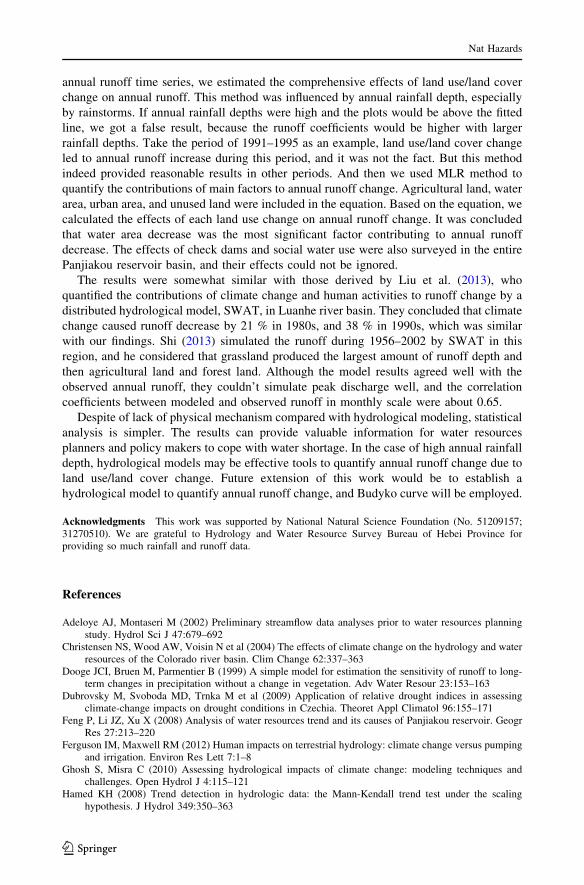
was consensus with the foregoing analysis. Table 8 exhibited the contributions of rainfall
change to runoff variations.
It can be seen from Table 8 that average annual runoff decreased with the reduction of
average annual rainfall compared 1980s with pre-1979. During this period, inflow of
Panjiakou reservoir decreased 6.50 9 108 m3, which mainly attributed to runoff decrease
in Luanhe sub-watershed (Sandaohezi station) for its large drainage area. While in the
1990s, average annual rainfall decreased 12.6 mm compared with pre-1979, and accord-
ingly it caused annual inflow reduction. Together with the contributions of land use
change, Panjiakou reservoir inflow exhibited a decrease trend from 1980 to 2002. The
contributions of rainfall decrease to Panjiakou reservoir inflow were 35.7 and 33.4 % in
1980s and 1990s, respectively.
5 Discussion and conclusions
Annual runoff in Panjiakou reservoir watershed had been observed for more than 50 years,
and it was found that there was a decreasing trend for the inflow of the reservoir. To
provide a guide to water resources managers for water supply, we quantified the decreasing
trend and contributions of the main factors to runoff decrease.
The trend and change point were detected for annual rainfall and runoff in the Panjiakou
reservoir watershed and 8 sub-watersheds by Mann–Kendall and Pettitt test methods,
respectively. It was found that there was no significant trend for annual rainfall time series,
but significant decreasing trend for annual runoff time series in Panjiakou reservoir
watershed, and this was true in some sub-watersheds. The change point of annual runoff
time series was detected in 1979 for the Panjiakou reservoir basin, and it was consistent
with the reality because soil and water conservation carried out since 1980.
To quantify the effects of land use/land cover change on annual runoff, double mass
curve of annual rainfall and runoff was used, and a linear function was fitted before and
after 1979, respectively. Then the theoretical annual runoff time series after 1979 were
calculated using the linear function before 1979, and by comparing with the observed
Table 8 Contributions of rainfall change to runoff variations in the sub-watersheds
Study area Pre-1979–1980s Pre-1979–1990s
DP (mm) DR (108 m3) DP (mm) DR (108 m3)
Liuhe -125.1 -0.30 -2.3 -0.01
Baohe -63.3 -0.41 -16.9 -0.11
Wuliehe -81.7 -0.78 -6.3 -0.06
Luanhe (Sandaohezi station) -30.8 -2.04 ?1.6 ?0.11
Yixunhe -53.8 -1.41 ?13.4 ?0.35
Laoniuhe -17.3 -0.11 -8.8 -0.06
Xingzhouhe -58.1 -0.31 ?7.0 ?0.04
Panjiakou reservoir -31.8 -4.16 -12.6 -1.24
Nat Hazards
123
annual runoff time series, we estimated the comprehensive effects of land use/land cover
change on annual runoff. This method was influenced by annual rainfall depth, especially
by rainstorms. If annual rainfall depths were high and the plots would be above the fitted
line, we got a false result, because the runoff coefficients would be higher with larger
rainfall depths. Take the period of 1991–1995 as an example, land use/land cover change
led to annual runoff increase during this period, and it was not the fact. But this method
indeed provided reasonable results in other periods. And then we used MLR method to
quantify the contributions of main factors to annual runoff change. Agricultural land, water
area, urban area, and unused land were included in the equation. Based on the equation, we
calculated the effects of each land use change on annual runoff change. It was concluded
that water area decrease was the most significant factor contributing to annual runoff
decrease. The effects of check dams and social water use were also surveyed in the entire
Panjiakou reservoir basin, and their effects could not be ignored.
The results were somewhat similar with those derived by Liu et al. (2013), who
quantified the contributions of climate change and human activities to runoff change by a
distributed hydrological model, SWAT, in Luanhe river basin. They concluded that climate
change caused runoff decrease by 21 % in 1980s, and 38 % in 1990s, which was similar
with our findings. Shi (2013) simulated the runoff during 1956–2002 by SWAT in this
region, and he considered that grassland produced the largest amount of runoff depth and
then agricultural land and forest land. Although the model results agreed well with the
observed annual runoff, they couldn’t simulate peak discharge well, and the correlation
coefficients between modeled and observed runoff in monthly scale were about 0.65.
Despite of lack of physical mechanism compared with hydrological modeling, statistical
analysis is simpler. The results can provide valuable information for water resources
planners and policy makers to cope with water shortage. In the case of high annual rainfall
depth, hydrological models may be effective tools to quantify annual runoff change due to
land use/land cover change. Future extension of this work would be to establish a
hydrological model to quantify annual runoff change, and Budyko curve will be employed.
Acknowledgments This work was supported by National Natural Science Foundation (No. 51209157;31270510). We are grateful to Hydrology and Water Resource Survey Bureau of Hebei Province forproviding so much rainfall and runoff data.
References
Adeloye AJ, Montaseri M (2002) Preliminary streamflow data analyses prior to water resources planningstudy. Hydrol Sci J 47:679–692
Christensen NS, Wood AW, Voisin N et al (2004) The effects of climate change on the hydrology and waterresources of the Colorado river basin. Clim Change 62:337–363
Dooge JCI, Bruen M, Parmentier B (1999) A simple model for estimation the sensitivity of runoff to long-term changes in precipitation without a change in vegetation. Adv Water Resour 23:153–163
Dubrovsky M, Svoboda MD, Trnka M et al (2009) Application of relative drought indices in assessingclimate-change impacts on drought conditions in Czechia. Theoret Appl Climatol 96:155–171
Feng P, Li JZ, Xu X (2008) Analysis of water resources trend and its causes of Panjiakou reservoir. GeogrRes 27:213–220
Ferguson IM, Maxwell RM (2012) Human impacts on terrestrial hydrology: climate change versus pumpingand irrigation. Environ Res Lett 7:1–8
Ghosh S, Misra C (2010) Assessing hydrological impacts of climate change: modeling techniques andchallenges. Open Hydrol J 4:115–121
Hamed KH (2008) Trend detection in hydrologic data: the Mann-Kendall trend test under the scalinghypothesis. J Hydrol 349:350–363
Nat Hazards
123
Kendall MG (1975) Rank correlation methods. Griffin, LondonKhan AR (2001) Analysis of hydro-meteorological time series in the upper indus basin: searching evidence
for climatic change. International Water Management Institute, Working Paper, pp 23, 31Kim U, Kaluarachchi JJ (2009) Climate change impacts on water resources in the upper Blue Nile river
basin, Ethiopia. J Am Water Resour Assoc 45:1361–1378Li JZ, Feng P (2007) Runoff variations in the Luanhe river basin during 1956–2002. J Geogrl Sci 17:
339–350Li HD, Song XQ, Zhou YQ (2004) The impact research of water and soil conservation measures on runoff
and sedimentation in Luanhe river basin (1). Haihe Water Resour 23:18–20Liu YB, Smedt FD, Hoffmann L et al (2004) Assessing land use impacts on flood processes in complex
terrain by using GIS and modeling approach. Environ Model Assess 9:227–235Liu C, Dong ZC, Fang Q et al (2013) Runoff changes in response to climate change and human activities
scenarios of Luanhe river basin. Water Resour Power 31:12–15Ma H, Yang DW, Tan SK et al (2010) Impact of climate variability and human activity on streamflow
decrease in the Miyun reservoir catchment. J Hydrol 389:317–324Mann HB (1945) Nonparametric tests against trend. Econometrica 13:245–259Milly PCD, Dunne KA (2002) Macro scale water fluxes 2, water and energy supply control of their enter-
annual variability. Water Resour Res 38:241–249Pettitt AN (1979) A non-parametric approach to the change point problem. Appl Stat 28:126–135Ranger N, Hallegatte S, Bhattacharya S et al (2011) An assessment of the potential impact of climate change
on flood risk in Mumbai. Clim Change 104:139–167Ren LL, Wang MR, Li CH et al (2002) Impacts of human activity on river runoff in the northern area of
China. J Hydrol 261:204–217Saghafian B, Farazjoo H, Bozorgy B et al (2008) Flood intensification due to changes in land use. Water
Resour Manag 22:1051–1067Schulze RE (2000) Modelling hydrological responses to land use and climate change: a Southern African
perspective. Ambio 29:12–22Shahin M, van Oorschot HJL, de Lange SJ (1993) Statistical analysis in water resources engineering. A. A.
Balkema, Rotterdam, p 394Shi XL (2013) Study on distributed hydrological simulation and drought evaluation method in Luanhe river
basin based on SWAT model. PH.D. thesis, University of Chinese Academy of Sciences, pp 73
Nat Hazards
123