quantitative in vivo microscopy: the return from the ‘omics’
TRANSCRIPT
Quantitative in vivo microscopy: the return from the ‘omics’Rodrigo Fernandez-Gonzalez1,2, Arrate Munoz–Barrutia3,Mary Helen Barcellos-Hoff1 and Carlos Ortiz-de-Solorzano3
The confluence of recent advances in microscopy
instrumentation and image analysis, coupled with the
widespread use of GFP-like proteins as reporters of gene
expression, has opened the door to high-throughput in vivo
studies that can provide the morphological and temporal
context to the biochemical pathways regulating cell function.
We are now able to quantify the concentration and three-
dimensional distribution of multiple spectrally resolved GFP-
tagged proteins. Using automatic segmentation and tracking
we can then measure the dynamics of the processes in which
these elements are involved. In this way, parallel studies are
feasible where multiple cell colonies treated with drugs or gene
expression repressors can be monitored and analyzed to study
the dynamics of relevant biological processes.
Addresses1 Lawrence Berkeley National Laboratory, 1 Cyclotron Road, Berkeley,
California 94720, USA2 UC Berkeley/UC San Francisco Joint Graduate Group in
Bioengineering, Berkeley, California 94720, USA3 Center for Applied Medical Research (CIMA), University of Navarra,
Pıo XII 55, 31008 Pamplona, Spain
Corresponding author: Ortiz-de-Solorzano, Carlos
Current Opinion in Biotechnology 2006, 17:501–510
This review comes from a themed issue on
Tissue and cell engineering
Edited by James L Sherley
Available online 8th August 2006
0958-1669/$ – see front matter
# 2006 Elsevier Ltd. All rights reserved.
DOI 10.1016/j.copbio.2006.07.005
IntroductionThe end of the 20th century left us with the daunting task
of processing and analyzing the monumental amount of
information compiled by the human genome sequencing
initiatives [1,2]. This fabulous effort, the first of a kind of
what has been termed ‘big biology’, was closely followed
by other large-scale projects aimed at complementing the
‘static’ genomic picture with dynamic clues as to which
genes are expressed in specific cell types (transcrip-
tomics) [3,4] or how different forms of splicing and
post-translational modification give rise to the set of
proteins that determine cell and tissue phenotypes (pro-
teomics) [5,6]. Bionformatic tools are being developed
that use statistical approaches to dig into the genome,
transcriptome and proteome to find patterns of activity
www.sciencedirect.com
and to infer functional networks of interest involved in
both normal and pathological processes. Informative as
they are, these networks are just static pictures of com-
plex dynamic processes, obtained from disaggregated
cellular material. The challenge now is to provide the
morphological and temporal context of the processes that
have been described by the ‘omics’. In summary, a need
exists for a return to the native environment where these
processes occur (i.e. to the living cell). Furthermore, a
correct description of these processes must necessarily be
quantitative, as cell function derives from a delicate
homeostatic balance between all the elements involved
in each specific network.
A proper understanding of dynamic events might be best
achieved by observing them as they occur in vivo. Several
whole animal, non-invasive, low-resolution image mod-
alities exist (e.g. positron emission tomography, com-
puted tomography and magnetic resonance imaging)
that give live valuable information about organs or tissues,
but they lack enough resolving power to image the
intricacies of cellular machineries. Intravital microscopy
(IM) [7,8] is a promising modality that nears cellular
resolution within living animals. However, high cellular
resolution can only be obtained near the skin or the
surface of the organs. Moreover, IM poses important
technical challenges and is constrained by the difficulty
of tagging cellular elements or proteins in living animals.
Therefore, optical fluorescence microscopy of live cell
colonies remains the most informative tool for capturing
at high resolution the interactions between multiple
elements in intact cells. In this review, we will discuss
some recent developments that are pushing microscopy
beyond its traditional applications, by increasing its dis-
criminative capacity and quantitative nature. We will
concentrate on how these methods apply to live cell
imaging of in vitro cultured cells. Figure 1 schematically
describes most of the methods that will be discussed in
the following sections.
Seeing life in colourTo detect in vivo the existence or the activity of proteins or
nucleic acids, to measure the concentration of ions or to
define the extent of compartments within the cell, these
elements must be labelled with fluorescent reporters.
Except for easily accessible cell-surface proteins and lipids,
this calls for the internalization of a fluorescent tagging
molecule in the cells, which can be done through micro-
injection [9–11], viral or chemically mediated transfection
[12,13] or by spontaneous endocytosis [14,15]. Labour-
intensive and hazardous viral transfection is still the most
Current Opinion in Biotechnology 2006, 17:501–510
502 Tissue and cell engineering
Figure 1
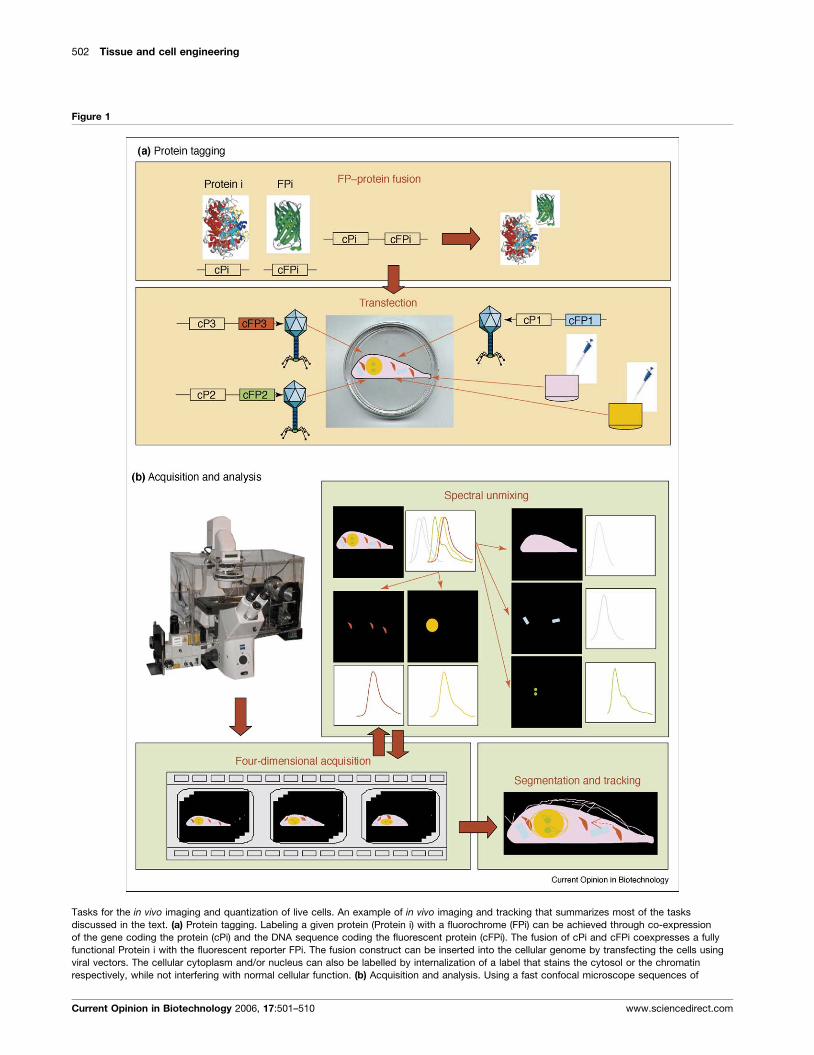
Tasks for the in vivo imaging and quantization of live cells. An example of in vivo imaging and tracking that summarizes most of the tasks
discussed in the text. (a) Protein tagging. Labeling a given protein (Protein i) with a fluorochrome (FPi) can be achieved through co-expression
of the gene coding the protein (cPi) and the DNA sequence coding the fluorescent protein (cFPi). The fusion of cPi and cFPi coexpresses a fully
functional Protein i with the fluorescent reporter FPi. The fusion construct can be inserted into the cellular genome by transfecting the cells using
viral vectors. The cellular cytoplasm and/or nucleus can also be labelled by internalization of a label that stains the cytosol or the chromatin
respectively, while not interfering with normal cellular function. (b) Acquisition and analysis. Using a fast confocal microscope sequences of
Current Opinion in Biotechnology 2006, 17:501–510 www.sciencedirect.com
Quantitative in vivo microscopy Fernandez-Gonzalez et al. 503
commonly used labelling method because of its high
efficiency and specificity. However, a great deal of research
is being carried out to develop polymeric substrates coated
with active biological surfaces that could improve the
efficiency and specificity of the internalization of carrier
vehicle particles in the cell or nucleus [16,17].
The direct labelling of proteins with fluorescent dyes has
important drawbacks: dilution of the dye upon cell divi-
sion, uneven cellular delivery and, more importantly,
interference of the dye with the activity of the protein.
Thus, labelling is today being replaced by co-expression
of the protein of interest with a tagging fluorescent
molecule, mediated by the endogenous promoter or by
an exogenous viral promoter. This is done by transfecting
cells with a DNA sequence coding the fluorescent mole-
cule fused to the coding sequence of the protein of
interest. The early sixties discovery of the green fluores-
cence protein (GFP) as the causing principle for the green
bioluminescence of the jellyfish Aequorea victoria [18], its
molecular cloning [19] and, more importantly, the demon-
stration of its in vivo functional expression in bacteria and
nematodes [20], opened the door to a generalized use of
GFP as a powerful fluorescent reporter in mammalian
cellular biology.
Because of the low brightness of the native GFP, and the
need for additional reporter colours in multiple labelling
experiments, new fluorescent variants have been purified
from other species or produced by directed evolution [21–
27]. A recent review [28��] provides assistance on how to
choose among the rainbow of available fluorescent proteins
(FPs). Five qualities are discussed that one should look for
when choosing a FP: brightness, photostability, robustness
against oligomerization, stability versus environmental
changes, and minimum crosstalk between fluorochrome
emissions. The authors offer their recommendations for
each spectral range and discuss in detail the benefits and
problems of the most common variants.
The possibility of combining different fluorescent repor-
ters is one of the strengths of fluorescence microscopy that
is now being applied to live-cell imaging. However,
spectral overlap between fluorochrome emissions limits
the number of molecules that can be simultaneously
detected. To overcome this, new algorithmic methods
can be used to reduce the crosstalk between fluorescent
emissions [29��]. The state-of-the-art approach combines
the acquisition of spectral scans with analysis methods
inherited from satellite imaging and remote sensing. To
obtain spectral scans one can use Fourier spectroscopy.
Namely, interferometric measurements of the samples
(Figure 1 Legend Continued) three-dimensional image stacks are acquired
elements being tracked. Spectal unmixing is then used to discriminate the e
labelled cellular structures. Finally, each spectral channel of the four-dimens
of each cellular element being tracked.
www.sciencedirect.com
are obtained to generate an interferogram, from which the
spectral distribution of the image can be recovered using
the Fourier transform. The first interferometric device —
a combination of spectroscopy, CCD (charge-coupled
device) imaging and conventional microscopy — was
extensively used for chromosome karyotyping [30,31]
and, more recently, for multicolour analysis of immuno-
fluorescence-stained tissue samples [32]. Alternatively,
continuous narrow-band sequential spectral scans can be
obtained using computer programmed liquid crystal tun-
able filters (LCTF) or acousto-optic tunable filters
(AOTF) inserted at a barrier filter position in the micro-
scope [33,34]. These sequential spectral imagers are not
appropriate for four-dimensional analysis of fast cellular
processes, because sequential acquisition is slow and
causes high fluorophore bleaching rates. To address these
issues, Dickinson et al. [35] developed a spectral imager
based on a special grating as a dispersive spectral element,
coupled to a 32-channel photon-multiplier tube (PMT)
array. This allows fast parallel acquisition of up to 32
spectral channels, thus reducing acquisition time and
photobleaching [34,35].
Once the spectral scan is obtained, the common approach
for true-colour separation is to use a constrained least-
squares algorithm to estimate the proportion of each pure
fluorochrome in every pixel of the image [29��,36,37].
This is the method of choice in time-lapse imaging (for
co-localization studies and to resolve fast processes
[29��,38,39]) and in FRET microscopy (to separate fluor-
escence of FRET pairs [40�,41,42,43�]). More general,
blind linear unmixing methods can be very helpful when
resolving individual components of unknown fluorescent
signals or when the mixed fluorochrome spectra, or the
levels of cross-talk between them, are expected to change
during the acquisition. As an example, Chorvat et al. [44]
successfully applied principal component analysis to
identify major spectral components in images of highly
autofluorescent cardiomyocytes. Other methods based on
independent component analysis have also been pro-
posed for blind spectral unmixing in other imaging areas
that could also benefit the spectral separation of fluor-
escent emissions [45,46].
Counting, not just seeingMeasuring absolute protein concentrations of FP–protein
fusions in vivo is challenging even in delicately controlled
experiments, as the actual number of fluorescent mole-
cules per protein molecule, as well as their photon flux
and extinction coefficients, vary with changes in the
chemical environment. External calibration strategies
have been proposed; for example, by comparing the
at predefined time points to create four-dimensional movies of the
missions of the different fluorochromes used as reporters for the
ional sequence is segmented separately to detect the dynamics
Current Opinion in Biotechnology 2006, 17:501–510
504 Tissue and cell engineering
intensity of the fluorescence captured from the cells with
standard fluorescence curves generated using dilution
series of recombinant versions of the same FP–protein
fusion [47]. When counting the number of cell-surface
proteins, a similar strategy would be to compare the
fluorescence intensities measured on the cell surface with
those measured on transparent beads coated with known
surface densities of the fusion protein being quantified
[48]. Both these methods use the unstable underlying
condition that the properties of the fluorophores are
insensitive to conformational differences between the
native and recombinant protein or to changes in the
environmental conditions. This concern can be addressed
using internal controls. For example, Dundr et al. [49]
used medium-seeded GFP-tagged rotavirus-derived
virus-like particles (VLP) to calibrate other GFP-tagged
proteins. As a proof-of-principle, they added GFP–VLPs
to culture medium of cells expressing a GFP–fusion
construct of pol I. From the known number of molecules
per GFP–VLP and their measured average fluorescence
intensity, the authors estimated the number of molecules
of the target protein imaged in a different part of the
sample. This approach is hampered by the different
chemical environments inside and outside the cells that
could affect the levels of autofluorescence, the folding
properties of the fluorochromes, and so on. It could also be
argued that the excitation and emission properties of the
fluorochromes might be different when fused to VLP
than when fused to other proteins. To address this issue,
Wu et al. [50��] used an external calibration approach,
which cleverly demonstrated its accuracy and general-
ization. The authors inserted the coding sequence for
monomeric yellow fluorescent protein (mYFP) into the
yeast genome, at the N or C termini of 27 proteins. They
then calculated the fluorescence per fusion protein in
their samples as the per-cell ratio between the average
fluorescence intensity measured by microscopy and the
average number of mYFP fusion proteins calculated by
quantitative immunoblotting, normalized using known
loading sequences of a control protein–mYFP fusion.
The ratios for all 27 fusion proteins aligned (r = 0.99),
showing a linear relationship between fluorescence inten-
sity and average fusion protein concentration. This linear
calibration table was then used to estimate concentrations
of other mYFP-tagged proteins.
Seeing in three and four dimensionsLife happens in four dimensions. Therefore, interpreting a
dynamic process is greatly facilitated by capturing all four
dimensions. Confocal microscopy [51] revolutionized ima-
ging by increasing the limited depth of focus inherent to
conventional optical systems. By using pinhole restriction,
light is limited to that coming from the focal plane, allowing
the acquisition of sharp in-focus images at sequential
depths that can be combined in three-dimensional image
stacks. Traditional confocal systems rely on slow sequen-
tial (pixel by pixel) laser scanning of the sample in three
Current Opinion in Biotechnology 2006, 17:501–510
dimensions. This compromises their ability to image fast
cellular processes. Furthermore, these systems cause high
photobleaching and phototoxicity because they illuminate
the cells with a focalized laser beam. A multiphoton
microscope produces pinhole-less confocality using addi-
tive confluence of photons at the focal plane of the micro-
scope. This eliminates bleaching of out of focus planes,
increasing detection sensitivity. However, the multipho-
ton microscope is still a sequential scanning device that can
only be used to image slow processes.
New, faster hardware variants have been developed that
parallelize pinhole-based confocal image acquisition by
either using line detectors or a spinning (Nipkow) disk
[52] with a spiral pattern of pinholes that collect and
project light onto a rectangular CCD. These systems
sacrifice axial resolution because of cross-talk between
neighbouring pinholes, but are swift enough to image
very fast cellular processes. A parallelized multiphoton
microscope has also been proposed [53] that breaks the
traditional trade-off between axial sectioning and paral-
lelization by using time-multiplexing, thus avoiding
simultaneous illumination of — and therefore cross-talk
between — neighbouring pinholes. The result is better
axial resolution and less phototoxicity than Nipkow disk
based systems. Their high cost is a clear disadvantage, as
they use expensive pulsed (Ti:sapphire) lasers compared
with the more affordable continuous wave Argon-Krypton
lasers used in Nipkow-based systems.
Volumetric renderings of four-dimensional stacks can
produce impressive visual reconstructions of live cellular
structures. These can be used for the qualitative assess-
ment of cellular processes. However, being quantitative
calls for the segmentation of nuclei or cells from a nuclear
or cell membrane marker to delineate their surfaces
before quantification and tracking of other elements
within them. A great deal of research is being carried
out on three-dimensional cellular segmentation [54–59],
although most existing methods are computationally
expensive, rendering them appropriate only for slow invivo processes or for off-line analysis. Faster, fully auto-
mated algorithms are required for real-time quantification
of four-dimensional cellular events in vivo.
Once the cells and/or elements of interest have been
correctly segmented, cell or organelle dynamics can be
measured using algorithmic tracking. Several commonly
used tracking algorithms are described and compared by
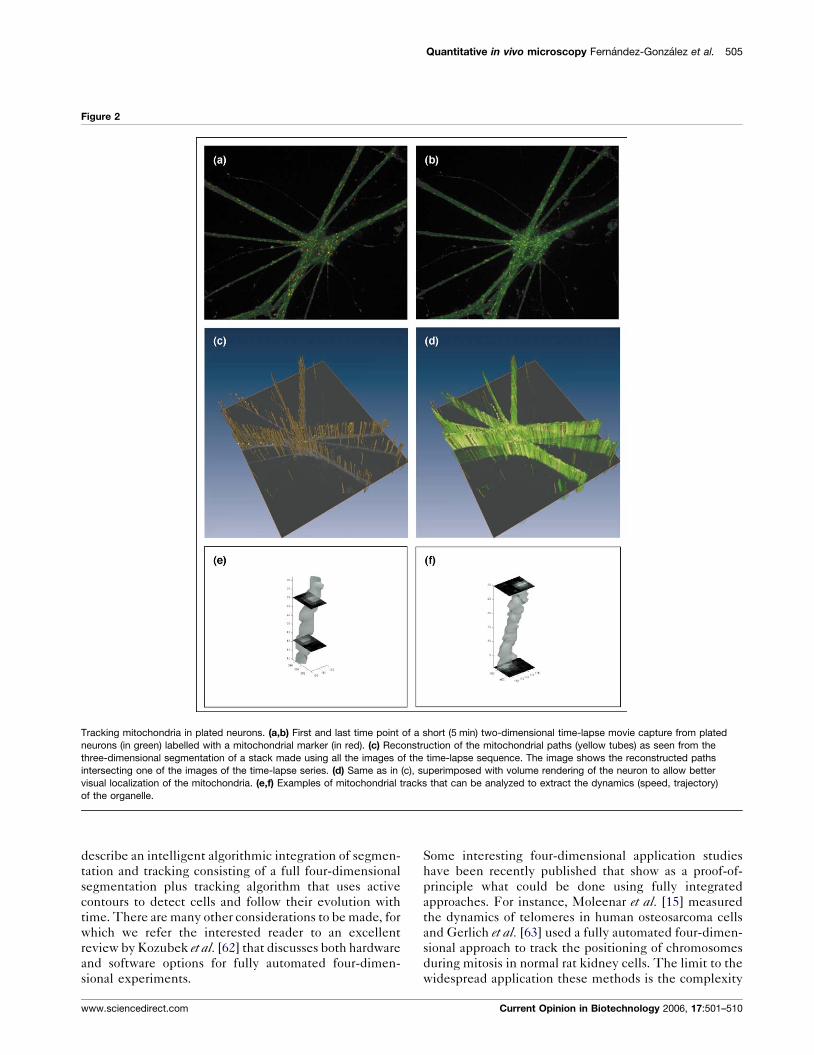
Cheezum an colleagues [60]. Figure 2 illustrates a simple
example of tracking of mitochondria in neuronal cells.
Most of these methods use either local spatial, static or
temporal information. More sophisticated schemes that
use both space and time, and which integrate high-level
knowledge of the dynamics of the populations being
studied, might produce more relevant results that those
currently obtained. Along these lines, Dufour et al. [61��]
www.sciencedirect.com
Quantitative in vivo microscopy Fernandez-Gonzalez et al. 505
Figure 2
Tracking mitochondria in plated neurons. (a,b) First and last time point of a short (5 min) two-dimensional time-lapse movie capture from plated
neurons (in green) labelled with a mitochondrial marker (in red). (c) Reconstruction of the mitochondrial paths (yellow tubes) as seen from the
three-dimensional segmentation of a stack made using all the images of the time-lapse sequence. The image shows the reconstructed paths
intersecting one of the images of the time-lapse series. (d) Same as in (c), superimposed with volume rendering of the neuron to allow better
visual localization of the mitochondria. (e,f) Examples of mitochondrial tracks that can be analyzed to extract the dynamics (speed, trajectory)
of the organelle.
describe an intelligent algorithmic integration of segmen-
tation and tracking consisting of a full four-dimensional
segmentation plus tracking algorithm that uses active
contours to detect cells and follow their evolution with
time. There are many other considerations to be made, for
which we refer the interested reader to an excellent
review by Kozubek et al. [62] that discusses both hardware
and software options for fully automated four-dimen-
sional experiments.
www.sciencedirect.com
Some interesting four-dimensional application studies
have been recently published that show as a proof-of-
principle what could be done using fully integrated
approaches. For instance, Moleenar et al. [15] measured
the dynamics of telomeres in human osteosarcoma cells
and Gerlich et al. [63] used a fully automated four-dimen-
sional approach to track the positioning of chromosomes
during mitosis in normal rat kidney cells. The limit to the
widespread application these methods is the complexity
Current Opinion in Biotechnology 2006, 17:501–510
506 Tissue and cell engineering
of acquiring and handling vast amounts of image data, as
discussed below.
Making sense of what you seeSingle quantitative cell measurements, either static
(three-dimensional) or dynamic (four-dimensional) are
not very informative. To produce more general informa-
tion, patterns of spatial or temporal data must be extracted
from multiple cells that can, in turn, be used to identify
subsets of proteins or cells in heterogeneous populations.
The goal is to incorporate the behavior of a single element
or of several measured elements into that of complex,
heterogeneous populations of cells as they occur in living
organisms.
Protein location patterns have been classified on the basis
of their association with an organelle, such as mitochon-
dria or Golgi, or on the basis of their subcellular
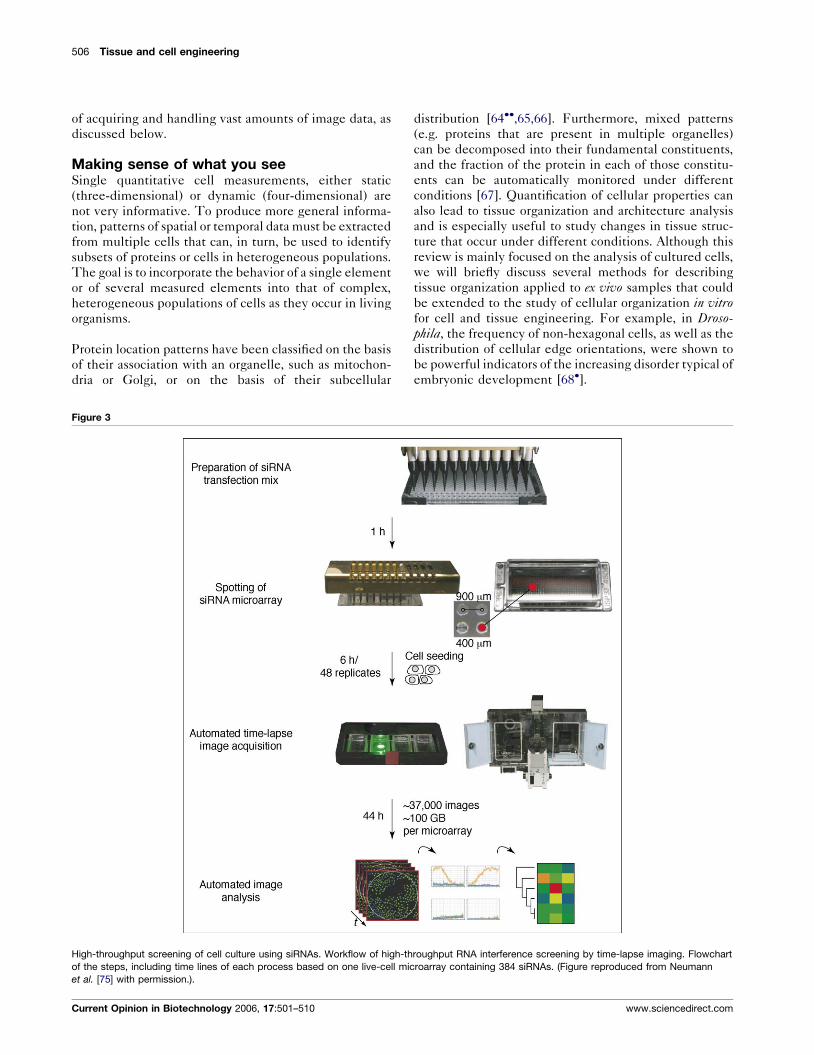
Figure 3
High-throughput screening of cell culture using siRNAs. Workflow of high-th
of the steps, including time lines of each process based on one live-cell mic
et al. [75] with permission.).
Current Opinion in Biotechnology 2006, 17:501–510
distribution [64��,65,66]. Furthermore, mixed patterns
(e.g. proteins that are present in multiple organelles)
can be decomposed into their fundamental constituents,
and the fraction of the protein in each of those constitu-
ents can be automatically monitored under different
conditions [67]. Quantification of cellular properties can
also lead to tissue organization and architecture analysis
and is especially useful to study changes in tissue struc-
ture that occur under different conditions. Although this
review is mainly focused on the analysis of cultured cells,
we will briefly discuss several methods for describing
tissue organization applied to ex vivo samples that could
be extended to the study of cellular organization in vitrofor cell and tissue engineering. For example, in Droso-phila, the frequency of non-hexagonal cells, as well as the
distribution of cellular edge orientations, were shown to
be powerful indicators of the increasing disorder typical of
embryonic development [68�].
roughput RNA interference screening by time-lapse imaging. Flowchart
roarray containing 384 siRNAs. (Figure reproduced from Neumann
www.sciencedirect.com
Quantitative in vivo microscopy Fernandez-Gonzalez et al. 507
Tissue or colony structure can also be analyzed on the
basis of the spatial distribution of their constituent popu-
lations. This can be done by studying the density of cell
populations, as defined by areas of a Voronoi diagram.
(A Voronoi diagram is a decomposition of a metric space,
based on distances between points or particles that belong
to the space. Namely, the lines (in a two-dimensional
space) formed by points equidistant to each pair of
neighbouring points define a polygonal tessellation of
the entire space known as Voronoi diagram or Voronoi
tessellation.) This quantitative method has been used to
demonstrate differences in the distribution of certain
neuronal populations in the brains of wild-type and
mutant mice [69]. In the rat retina [70��], the distribution
of Voronoi areas was compared at local and global levels,
to demonstrate a regular distribution of certain cells
during retinal development. Autocorrelation and cross-
correlation of nearest neighbor distances or distance-to-
neighbor profiles have also been used to investigate the
organization of cell populations in the zebrafish retina
[71,72]. Unfortunately, this approach is not directly
applicable to tissues with more complex topology, as it
assumes a homogeneous cell density in each of the images
under study. To overcome this limitation, we have devel-
oped a method to study the spatial distribution of several
cell populations based on a graph model that embeds
tissue topology [73��]. Using this graph model, a multi-
scale density function is evaluated and the statistical
significance of patterns within a tissue is assessed, locally
and globally. Graphs have also been used to measure the
amount of tissue disorganization in different neoplastic
lesions [74]. Cell centroids (i.e. the cell centre of mass)
were used to build four different types of graphs. Multiple
properties were then measured on these graphs
(edge length, number of edges) and shown to present
statistically significant differences between normal and
malignant samples.
Any of the above-mentioned methods can be used to
characterize global changes in colonies and tissues in
response to different treatments. Such changes might
otherwise be missed using local measurements or global
methods based on averaging of local measurements across
the samples.
Handling the dataAll the tasks described so far can be integrated under
unified automated platforms, allowing high-throughput
studies where hundreds to thousands of differently trea-
ted colonies are periodically imaged and comparatively
analyzed. For instance, this approach is being used by a
European Union funded consortium [75��] to look at
changes in the dynamics of cell division using small
interfering RNAs (siRNAs) that block the transcription
of 49 different genes (see Figure 3 for a brief graphical
explanation of the protocol). These robotic-driven
experiments — the dynamic equivalent of large-scale
www.sciencedirect.com
microarray-based genome or gene expression studies —
generate an overwhelming amount of image data (tens to
hundreds of Gigabytes) per experiment. This poses
important requirements for data storage and processing
that may be better achieved using distributed databases
and computing across high-speed networks than in single
laboratory settings.
Finally, sharing and validation of the data by the scientific
community necessitates the development of standardized
control and normalization strategies and the integration of
the results in existing distributed protein databases. In
turn, this can only be achieved with proper tools for
navigating and visualizing the data and with tools for
automatically extracting and linking relevant information.
All these areas are still underdeveloped.
ConclusionsImaging and quantifying location, functional status and
abundance in living cells is the key to unravelling the
complex qualitative descriptions of biological processes
provided by large-scale genomic and proteomic
approaches. This puts forth several challenges that are
being addressed by many groups. We have discussed here
some of those challenges, namely: the spectral resolution
of fluorochrome tags that increase the number of ele-
ments being monitored; calibration and normalization
strategies that help absolute protein concentrations to
be estimated from fluorescence measurements; hardware
and software approaches suitable for in vivo tracking of
three-dimensional spaces; and statistical methods for the
characterization of heterogeneous events.
The combination of imaging with the other ‘omics’ can
help interpretation and prediction of the behaviour of
proteins, organelles and cells that will then need to be
confirmed in living tissues and animals. Important work
must be done to integrate all these elements under
unified microscopy platforms and to streamline and
homogenize sample preparation, data acquisition and
data handling to permit high-throughput analysis.
AcknowledgementsRFG is being supported by a predoctoral fellowship from the Departmentof Defense Breast Cancer Research Program (DAMD 17–03–1–0594) and agrant from the National Institute of Environmental Health Sciences(U01ES012801). COS is currently supported by the Spanish Ministry ofScience and Education (MCYT TEC2005–04732), the EU Marie CurieProgram (MIRG–CT–2005–028342) and a Ramon y Cajal Fellowship.
References and recommended readingPapers of particular interest, published within the annual period ofreview, have been highlighted as:
� of special interest
�� of outstanding interest
1. Venter JC, Adams MD, Myers EW, Li PW, Mural RJ, Sutton GG,Smith HO, Yandell M, Evans CA, Holt RA et al.: The sequence ofthe human genome. Science 2001, 291:1304-1351.
Current Opinion in Biotechnology 2006, 17:501–510
508 Tissue and cell engineering
2. McPherson JD, Marra M, Hillier L, Waterston RH, Chinwalla A,Wallis J, Sekhon M, Wylie K, Mardis ER, Wilson RK et al.:A physical map of the human genome. Nature 2001,409:934-941.
3. Caron H, van Schaik B, van der Mee M, Baas F, Riggins G,van Sluis P, Hermus MC, van Asperen R, Boon K, Voute PA et al.:The human transcriptome map: clustering of highly expressedgenes in chromosomal domains. Science 2001, 291:1289-1292.
4. Strausberg RL, Riggins GJ: Navigating the humantranscriptome. Proc Natl Acad Sci USA 2001, 98:11837-11838.
5. Walter G, Bussow K, Lueking A, Glokler J: High-throughputprotein arrays: prospects for molecular diagnostics.Trends Mol Med 2002, 8:250-253.
6. Figeys D: Functional proteomics: mapping protein-proteininteractions and pathways. Curr Opin Mol Ther 2002, 4:210-215.
7. Cahalan MD, Parker I, Wei SH, Miller MJ: Two-photon tissueimaging: seeing the immune system in a fresh light.Nat Rev Immunol 2002, 2:872-880.
8. Mempel TR, Scimone ML, Mora JR, von Andrian UH: In vivoimaging of leukocyte trafficking in blood vessels and tissues.Curr Opin Immunol 2004, 16:406-417.
9. Shimizu N, Kamezaki F, Shigematsu S: Tracking of microinjectedDNA in live cells reveals the intracellular behavior andelimination of extrachromosomal genetic material. NucleicAcids Res 2005, 33:6296-6307.
10. Glotzer JB, Saffrich R, Glotzer M, Ephrussi A: Cytoplasmic flowslocalize injected oskar RNA in Drosophila oocytes. Curr Biol1997, 7:326-337.
11. Shan J, Munro TP, Barbarese E, Carson JH, Smith R: A molecularmechanism for mRNA trafficking in neuronal dendrites.J Neurosci 2003, 23:8859-8866.
12. Dickinson ME, Murray BA, Haynes SM, Waters CW, Longmuir KJ:Using electroporation and lipid-mediated transfection ofGFP-expressing plasmids to label embryonic avian cells forvital confocal and two-photon microscopy. Differentiation 2002,70:172-180.
13. Maletic-Savatic M, Malinow R, Svoboda K: Rapid dendriticmorphogenesis in CA1 hippocampal dendrites induced bysynaptic activity. Science 1999, 283:1923-1927.
14. Lorenz MR, Holzapfel V, Musyanovych A, Nothelfer K,Walther P, Frank H, Landfester K, Schrezenmeier H, Mailander V:Uptake of functionalized, fluorescent-labeled polymericparticles in different cell lines and stem cells. Biomaterials2006, 27:2820-2828.
15. Molenaar C, Wiesmeijer K, Verwoerd NP, Khazen S, Eils R,Tanke HJ, Dirks RW: Visualizing telomere dynamics inliving mammalian cells using PNA probes. EMBO J 2003,22:6631-6641.
16. Win KY, Feng SS: Effects of particle size and surface coating oncellular uptake of polymeric nanoparticles for oral delivery ofanticancer drugs. Biomaterials 2005, 26:2713-2722.
17. Lin R, Shi Ng L, Wang CH: In vitro study of anticancer drugdoxorubicin in PLGA-based microparticles. Biomaterials 2005,26:4476-4485.
18. Shimomura O, Johnson FH, Saiga Y: Extraction, purification andproperties of aequorin, a bioluminescent protein from theluminous hydromedusan, Aequorea. J Cell Comp Physiol 1962,59:223-239.
19. Prasher DC, Eckenrode VK, Ward WW, Prendergast FG,Cormier MJ: Primary structure of the Aequorea victoria greenfluorescent protein. Gene 1992, 111:229-233.
20. Chalfie M, Tu Y, Euskirchen G, Ward WW, Prasher DC:Green fluorescent protein as a marker for gene expression.Science 1994, 263:802-805.
21. Shaner NC, Campbell RE, Steinbach PA, Giepmans BN,Palmer AE, Tsien RY: Improved monomeric red, orange andyellow fluorescent proteins derived from Discosoma sp. redfluorescent protein. Nat Biotechnol 2004, 22:1567-1572.
Current Opinion in Biotechnology 2006, 17:501–510
22. Karasawa S, Araki T, Nagai T, Mizuno H, Miyawaki A:Cyan-emitting and orange-emitting fluorescent proteinsas a donor/acceptor pair for fluorescence resonance energytransfer. Biochem J 2004, 381:307-312.
23. Rekas A, Alattia JR, Nagai T, Miyawaki A, Ikura M: Crystalstructure of venus, a yellow fluorescent protein with improvedmaturation and reduced environmental sensitivity. J Biol Chem2002, 277:50573-50578.
24. Nagai T, Ibata K, Park ES, Kubota M, Mikoshiba K, Miyawaki A:A variant of yellow fluorescent protein with fast and efficientmaturation for cell-biological applications. Nat Biotechnol2002, 20:87-90.
25. Wiedenmann J, Ivanchenko S, Oswald F, Schmitt F,Rocker C, Salih A, Spindler KD, Nienhaus GU: EosFP, afluorescent marker protein with UV-inducible green-to-redfluorescence conversion. Proc Natl Acad Sci USA 2004,101:15905-15910.
26. Wiedenmann J, Vallone B, Renzi F, Nienhaus K, Ivanchenko S,Rocker C, Nienhaus GU: Red fluorescent protein eqFP611 andits genetically engineered dimeric variants. J Biomed Opt 2005,10:14003.
27. Zapata-Hommer O, Griesbeck O: Efficiently folding andcircularly permuted variants of the Sapphire mutant of GFP.BMC Biotechnol 2003, 3:5.
28.��
Shaner NC, Steinbach PA, Tsien RY: A guide to choosingfluorescent proteins. Nat Methods 2005, 2:905-909.
Essential and exhaustive review of the biochemical and optical propertiesof most available GFP-like fluorescent proteins. The authors advancetheir recommendations on the appropriate fluorescent protein per spec-tral class as well as the optimum filter sets for both single and multiplelabeling experiments.
29.��
Zimmermann T: Spectral imaging and linear unmixingin light microscopy. Adv Biochem Eng Biotechnol 2005,95:245-265.
A useful review of the microscope techniques available for spectralimaging and the theory of linear unmixing. Possible limitations andapproaches for image optimization are discussed to help realize the fullpotential of this novel method. Biological applications that can beimproved by spectral imaging and linear unmixing are presented.
30. Liyanage M, Coleman A, du Manoir S, Veldman T, McCormack S,Dickson RB, Barlow C, Wynshaw–Boris A, Janz S, Wienberg Jet al.: Multicolour spectral karyotyping of mousechromosomes. Nat Genet 1996, 14:312-315.
31. Schrock E, du Manoir S, Veldman T, Schoell B, Wienberg J,Ferguson-Smith MA, Ning Y, Ledbetter DH, Bar-Am I, Soenksen Det al.: Multicolor spectral karyotyping of human chromosomes.Science 1996, 273:494-497.
32. Tsurui H, Nishimura H, Hattori S, Hirose S, Okumura K,Shirai T: Seven-color fluorescence imaging of tissuesamples based on Fourier spectroscopy and singularvalue decomposition. J Histochem Cytochem 2000,48:653-662.
33. Wachman ES, Niu W, Farkas DL: AOTF microscope for imagingwith increased speed and spectral versatility. Biophys J 1997,73:1215-1222.
34. Lansford R, Bearman G, Fraser SE: Resolution of multiple greenfluorescent protein color variants and dyes using two-photonmicroscopy and imaging spectroscopy. J Biomed Opt 2001,6:311-318.
35. Dickinson ME, Bearman G, Tille S, Lansford R, Fraser SE:Multi-spectral imaging and linear unmixing add a wholenew dimension to laser scanning fluorescence microscopy.Biotechniques 2001, 31:1272-1278.
36. Keshava N, Mustard JF: Spectral unmixing. IEEE Signal Proc Mag2002, 19:44-56.
37. Zimmermann T, Rietdorf J, Pepperkok R: Spectral imagingand its applications in live cell microscopy. FEBS Lett 2003,546:87-92.
38. Hutter H: Five-colour in vivo imaging of neurons inCaenorhabditis elegans. J Microsc 2004, 215:213-218.
www.sciencedirect.com
Quantitative in vivo microscopy Fernandez-Gonzalez et al. 509
39. Teddy JM, Lansford R, Kulesa PM: Four-color, 4-D time-lapseconfocal imaging of chick embryos. Biotechniques 2005,39:703-710.
40.�
Van Munster EB, Kremers GJ, Adjobo-Hermans MJ, Gadella TWJr: Fluorescence resonance energy transfer (FRET)measurement by gradual acceptor photobleaching. J Microsc2005, 218:253-262.
Reports the delivery of multiple (up to four), multicolour fluorescentprotein constructs and uses four-dimensional, multispectral time-lapseconfocal imaging of cell movements in living chick embryos.
41. Zimmermann T, Rietdorf J, Girod A, Georget V, Pepperkok R:Spectral imaging and linear un-mixing enables improved FRETefficiency with a novel GFP2-YFP FRET pair. FEBS Lett 2002,531:245-249.
42. Hiraoka Y, Shimi T, Haraguchi T: Multispectral imagingfluorescence microscopy for living cells. Cell Struct Funct 2002,27:367-374.
43.�
Neher R, Neher E: Optimizing imaging parameters for theseparation of multiple labels in a fluorescence image.J Microsc 2004, 213:46-62.
The authors provide a theoretical analysis on how spectral fingerprintingcan be used to separate the fluorescence of FRET pairs from thatoriginating from unpaired donors and acceptors and how to selectimaging parameters to optimize the signal-to-noise ratio of the estimates.
44. Chorvat D Jr, Kirchnerova J, Cagalinec M, Smolka J, Mateasik A,Chorvatova A: Spectral unmixing of flavin autofluorescencecomponents in cardiac myocytes. Biophys J 2005, 89:L55-L57.
45. Cardoso JF: Blind signal separation: statistical principles.Proc IEEE 1998, 9:2009-2025.
46. Kisilev P, Zibulevsky M, Zeevi YY: A multiscale framework forblind separation of linearly mixed signals. J Mach Learn Res2003, 4:1334-1364.
47. Hirschberg K, Miller CM, Ellenberg J, Presley JF, Siggia ED,Phair RD, Lippincott-Schwartz J: Kinetic analysis of secretoryprotein traffic and characterization of golgi to plasmamembrane transport intermediates in living cells. J Cell Biol1998, 143:1485-1503.
48. Chiu CS, Kartalov E, Unger M, Quake S, Lester HA: Single-molecule measurements calibrate green fluorescent proteinsurface densities on transparent beads for use with ‘knock-in’animals and other expression systems. J Neurosci Methods2001, 105:55-63.
49. Dundr M, McNally JG, Cohen J, Misteli T: Quantitation ofGFP–fusion proteins in single living cells. J Struct Biol 2002,140:92-99.
50.��
Wu JQ, Pollard TD: Counting cytokinesis proteins globally andlocally in fission yeast. Science 2005, 310:310-314.
A comprehensive attempt to calculate absolute protein concentrations inlive cells using external controls. The authors showed consistent linearrelationships between the intensity of 27 fluorescent protein fusionsmeasured using microscopy and the intensity measured using quantita-tive immunoblotting. From the corresponding known immunoblottingconcentrations, they created a calibration table than can be used tocalculate concentration of other fused proteins.
51. Wilson T: Three-dimensional imaging in confocal systems.J Microsc 1989, 153:161-169.
52. Ichihara A, Tanaami T, Isozaki K, Sugiyama Y, Kosugi Y,Mikuriya K, Abe M, Uemura I: High-speed confocal fluorescencemicroscopy using a Nipkow scanner with microlenses fro3D-imaging of single fluorescent molecule in real time.Bioimages 1996, 4:52-62.
53. Hell SW, Andresen V: Space-multiplexed multifocal nonlinearmicroscopy. J Microsc 2001, 202:457-463.
54. Adiga PS, Chaudhuri BB: Efficient cell segmentation toolfor confocal microscopy tissue images and quantitativeevaluation of FISH signals. Microsc Res Tech 1999, 44:49-68.
55. Lockett SJ, Sudar D, Thompson CT, Pinkel D, Gray JW:Efficient, interactive, and three-dimensional segmentationof cell nuclei in thick tissue sections. Cytometry 1998,31:275-286.
www.sciencedirect.com
56. Ortiz de Solorzano C, Garcia Rodriguez E, Jones A, Pinkel D,Gray JW, Sudar D, Lockett SJ: Segmentation of confocalmicroscope images of cell nuclei in thick tissue sections.J Microsc 1999, 193:212-226.
57. De Solorzano CO, Malladi R, Lelievre SA, Lockett SJ:Segmentation of nuclei and cells using membrane relatedprotein markers. J Microsc 2001, 201:404-415.
58. Lin G, Adiga U, Olson K, Guzowski JF, Barnes CA, Roysam B:A hybrid 3D watershed algorithm incorporating gradientcues and object models for automatic segmentation ofnuclei in confocal image stacks. Cytometry A 2003,56:23-36.
59. Lin G, Chawla MK, Olson K, Guzowski JF, Barnes CA, Roysam B:Hierarchical, model-based merging of multiple fragments forimproved three-dimensional segmentation of nuclei.Cytometry A 2005, 63:20-33.
60. Cheezum MK, Walker WF, Guilford WH: Quantitativecomparison of algorithms for tracking single fluorescentparticles. Biophys J 2001, 81:2378-2388.
61.��
Dufour A, Shinin V, Tajbakhsh S, Guillen-Aghion N, Olivo-Marin JC,Zimmer C: Segmenting and tracking fluorescent cells indynamic 3-D microscopy with coupled active surfaces.IEEE Trans Image Process 2005, 14:1396-1410.
First integrated solution for segmenting and tracking cells in three dimen-sions. The authors of this elegant study use multiple implicit activesurfaces to segment and track cells separately, and impose a constraintto avoid merging of neighboring cells.
62. Kozubek M, Matula P, Matula P, Kozubek S: Automatedacquisition and processing of multidimensional imagedata in confocal in vivo microscopy. Microsc Res Tech 2004,64:164-175.
63. Gerlich D, Beaudouin J, Kalbfuss B, Daigle N, Eils R,Ellenberg J: Global chromosome positions are transmittedthrough mitosis in mammalian cells. Cell 2003,112:751-764.
64.��
Chen X, Murphy RF: Objective clustering of proteins basedon subcellular location patterns. J Biomed Biotechnol 2005,2005:87–95.
The authors classified protein location patterns using morphological,intensity and texture measurements of GFP-fused protein expressionin fluorescence images.
65. Knowles DW, Sudar D, Bator-Kelly C, Bissell MJ, Lelievre SA:Automated local bright feature image analysis of nuclearprotein distribution identifies changes in tissue phenotype.Proc Natl Acad Sci USA 2006, 103:4445-4450.
66. Huang K, Murphy RF: Boosting accuracy of automatedclassification of fluorescence microscope images for locationproteomics. BMC Bioinformatics 2004, 5:78.
67. Zhao T, Velliste M, Boland MV, Murphy RF: Object typerecognition for automated analysis of proteinsubcellular location. IEEE Trans Image Process 2005,14:1351-1359.
68.�
Zallen JA, Zallen R: Cell-pattern disordering during convergentextension in Drosophila. J Phys Condens Matter 2004,16:S5073-S5080.
Tissue disorder was quantified in Drosophila embryos at different stagesof development using 2D-confocal microscopy images. The cell classi-fication method (automatic or manual) was not mentioned, although theimages shown are amenable to automatic watershed segmentation andclassification based on the number of neighbors.
69. Carretta D, Santarelli M, Sbriccoli A, Pinto F, Catini C,Minciacchi B: Spatial analysis reveals alterations ofparvalbumin- and calbindin-positive local circuit neurons inthe cerebral cortex of mutant mdx mice. Brain Res 2004,1016:1-11.
70.��
Palanza L, Jhaveri S, Donati S, Nuzzi R, Vercelli A: Quantitativespatial analysis of the distribution of NADPH-diaphorase-positive neurons in the developing and mature rat retina.Brain Res Bull 2005, 65:349-360.
This very quantitative approach was also used to validate a computa-tional model of the retina that allowed the authors to gain further insightinto the patterning mechanism.
Current Opinion in Biotechnology 2006, 17:501–510
510 Tissue and cell engineering
71. Cameron DA, Carney LH: Cellular patterns in the innerretina of adult zebrafish: quantitative analyses and acomputational model of their formation. J Comp Neurol 2004,471:11-25.
72. Tyler MJ, Carney LH, Cameron DA: Control of cellularpattern formation in the vertebrate inner retina byhomotypic regulation of cell-fate decisions. J Neurosci 2005,25:4565-4576.
73.��
Fernandez-Gonzalez R, Barcellos-Hoff MH, Ortiz de Solorzano C:A tool for the quantitative spatial analysis of complex cellularsystems. IEEE Trans Image Process 2005, 14:1300-1313.
The graph used here (a refined relative neighborhood graph) has the cellnuclei as nodes. The nodes corresponding to neighbor nuclei are auto-matically detected and linked by edges. This graph is then used todetermine the neighborhood between cells and to measure distancesbetween them with a normalized distance unit: the graph edge. Statistical
Current Opinion in Biotechnology 2006, 17:501–510
significance is assessed by comparison to Monte Carlo simulations ofrandom (in the single population case) or independent (for multiplepopulations) distributions.
74. Landini G, Othman IE: Architectural analysis of oral cancer,dysplastic, and normal epithelia. Cytometry A 2004, 61:45-55.
75.��
Neumann B, Held M, Liebel U, Erfle H, Rogers P, Pepperkok R,Ellenberg J: High-throughput RNAi screening by time-lapseimaging of live human cells. Nat Methods 2006, 3:385-390.
A beautiful example of integration of automated acquisition and trackingfor high-throughput parallel in vivo genomic analysis. The authors spotted49 different siRNAs in live-cell chambers and periodically capturedimages of each of the cell cultures. They then used image analysis toolsto segment and classify nuclei in each of the sequences and quantifiedthe rate of nuclear division and apoptosis. In this way they could com-paratively assess the role of those 49 genes in the completion anddynamics of cell mitosis.
www.sciencedirect.com