quantitative determination of blood glucose using enzyme induced chemiluminescence of luminol
TRANSCRIPT

(10) R. J. Decker and D. J. Eve, Spectrochim. Acta, Part 6, 25, 479 (1970). (1 1) C. E. Harvey, "Spectrochernical Procedures." Applied Research Labo-
(12) J. R. Churchill. lnd. Eng. Chem., Anal. Ed., 16, 653 (1944). (13) "Methods For Emission Spectrochemical Analysis," 3rd ed., American
Society for Testing Materials, Philadelphia, Pa., 1960. (14) R . Gerbatsch and H. Scholze, Spectrochim. Acta, Part E, 25, 101
(1970). Science Foundation Grant, GP-37026X.
(15) C. E. Harvey, Spectrochim. Acta, Part B, 25, 73 (1970). (16) H. Kaiser, Spectrochim. Acta, 2, 1 (1941).
RECEIVED for review August 2, 1974. Accepted November 11, 1974* This work was supported in part by
ratories, Glendale, Calif., 1950.
Quantitative Determination of Blood Glucose Using Enzyme induced Chemiluminescence of Luminsl
Debra T. Bostick and David M. Hercules
Department of Chemistry, University of Georgia, Athens, Ga. 30602
Blood glucose is measured using enzymatic conversion of P-D-glucose to D-gluconic acid and hydrogen peroxide in an immobilized glucose oxidase (EC 1.1.3.4) column. The per- oxide subsequently reacts with a mixed luminol-ferricya- nide reagent to produce chemiluminescene, proportional to P-D-glucose concentration. The method is linear between lo-' and 10-4M glucose, and correlates well with standard methods for glucose determination. With prior adsorption of uric acid, the chemiluminescent technique may be used for urine glucose analysis. The system may also be applied to the analysis of hydrogen peroxide in the lo-* to lO+M range.
Estimation of true blood glucose has been hampered by the relative nonspecificity of most analytical techniques. Glucose analysis based on the inherent specifity of an enzy- matic reaction has provided the most accurate means for obtaining blood glucose concentration. The glucose oxidase method, originally described by Keston ( I ) , is the most commoniy employed enzymatic t,echnique for routine blood glucose analysis. The method i s based on the following reaction sequence:
g lucose oxidase
[3-o-glucose + O2 -__f o-gluconic acid + H,O,
H,02 +- chromogenic oxygen acceptor - chromogen
in which the chromogen most frequently is 0- dianisidine or 0- toluidine. The first reaction is highly specific for glucose (2 ); however, the second reaction is subject to several inter- ferences. These include reducing substances, such as biliru- bin, ascorbic acid, uric acid, and drug metabolites, which may depress results by either competing with the chromo- gen for peroxide or by reducing the chromogen ( 3 ) . Nega- tive error may also be observed if the pH is too acidic for the enzymatic reactions. Under these conditions, peroxi- dase is inhibited by fluoride and chloride ions which may be present in the reaction media as serum preservatives ( 4 1. Glucose estimation may he pH dependent if the pH of the final solution remains above four, since the absorption maximum of the oxidized chromogen is pH dependent above this value ( 5 ) .
To circumvent many of the interferences associated with the peroxidase-coupled glucose oxidase method, the pres- ent technique monitors hydrogen peroxide concentration using the chemiluminescence of luminol (5-amino-2,3-dihy-
peroxidase
drophthalazine-1,4-dione). In the presence of certain met- als, peroxide reacts with luminol in basic media to form an excited aminophthalate anion, which returns to ground state by the emission of a photon (6, 7). In the glucose oxi- dase-luminol coupled reaction sequence, the amount of light emitted is proportional to @-D-glucose concentration.
Generally, metal ions possessing oxidation states requir- ing a one-electron transfer are capable of promoting the chemiluminescent reaction between peroxide and luminol in water (8). These have included Fe(I1)-containing com- pounds, such as hemin (9, 10) and hematogen ( I 1 ). Cop- per(I1) (12-16), as well as mixed Cu(I1)-persulfate ( 1 7 ) and Cu(T1)-hemin (18) solutions, have also been employed in the luminol reaction. Cobalt(I1) (19). Fe(II1) ( 2 0 ) , Fe(CN)e3- (21, 2 2 ) and SbC16- ( 2 3 ) have been cited as re- agents capable of producing chemiluminescence in the presence of luminol and hydrogen peroxide.
The present paper summarizes the chemiluminescent re- sponse promoted by several of the above metals, observed during attempts to establish a procedure for peroxide anal- ysis based on the luminol reaction. I t further describes the adaptation and development of this analysis for the deter- mination of blood glucose. A preliminary communication of this work has appeared ( 2 4 ) . Other workers have indepen- dently reported a similar method (25 ).
EXPERIMENTAL Apparatus. The chemiluminescence produced by the oxidation
of luminol is followed in a continuous flow system using the appa- ratus shown in Figure 1. The system uses three 50-ml plastic sy- ringes, containing luminol dissolved. in 0.1M H3B03-KOH buffer. KaFeiCN)e, or another metal, and an aqueous background of 0.004M acetate buffer. The syringes are driven by a Harvard Model 600-2-200 infusion pump, .capable of maintaining uniform flow against back pressures greater than 250 psi produced by the enzyme column. Solutions from the ferricyanide and luminol sy- ringes are joined by a glass Y-tube containing a platinum coil to enhance mixing. A platinum gauze plug is located father down the flow line for the same purpose.
Samples are introduced into the acetate flow line by a Chroma- tronix SV-8031 sample injection valve. Either the acetate back- ground or the same slug flows into the glucose oxidase column. The column itself is a 16-cm Pyrex tube with an i.d. of 4 mm; 2 cm from each end of the column, the i.d. is decreased to 3 mm to accommo- date Chromatronix column fittings. As the glucose sample enters the column, hydrogen peroxide generated and carried in the col- umn effluent to the cell where it reacts with the luminol-ferricya- nide reagent. Nitrogen gas is bubbled through the cell to ensure uniform mixing.
The chemiluminescence produced by the luminol-peroxide-fer- ricyanide reaction is detected by an RCA 1P21 photomultiplier
ANALYTICAL CHEMISTRY, VOL. 47, NO. 3, MARCH 1975 447

9ACL(GROUND
S A M P L E
L NITROGEN
K 3 Fe(CNj6
Figure 1. Diagram of the flow system for the chemiluminescent de- termination of blood glucose
tube attached to the face of the cell. The signal is amplified by a Princeton Applied Research (PAR) Model 270 D.C. photometer- preamplifier in conjunction with. a PAR Model 280 power supply. The response is recorded on a Hewlett-Packard Model 7101B po- tentiometric recorder.
The effect of column temperature on chemiluminescent re- sponse was determined by submerging the enzyme column, sample loop, samples and 2-meter X '&inch background equilibration coil in a ten-gallon water bath. The water temperature was controlled to within 40.1 "C by a Yellow Springs Instrument Co., YSI-B3RC, temperature regulator and a 150-watt light bulb.
Chemicals. Luminol (Eastman Kodak) was converted to the so- dium salt with reagent grade sodium hydroxide. The salt was twice purified by double recrystallization from basic aqueous solution at 0 O C (26). A 4 X M luminol stock solution was prepared by dissolving 0.8 g luminol salt, 73 g potassium hydroxide, and 61.8 g boric acid in one liter of water. The luminol stock solution was al- lowed to stand for three days to stabilize before use.
Metal solutions were prepared from reagent grade salts. Hydro- gen peroxide standards were prepared by diluting a 3% H202 stock solution (Baker) which was previously standardized against stan- dard permanganate; sodium oxalate (Mallinckrodt) was the pri- mary standard (27). The diluted peroxide standards were main- tained at pH 4.5 to minimize decomposition (28). The peroxide standards were prepared daily since dilute solutions are stable for only 24 hours at room temperature (14) .
Sigma Chemical Company standard glucose solutions, 10 mg/ml . and 1 mg/ml, were diluted to prepare glucose standards.
Glucose oxidase immobilized on Sepharose beads was purchased from Worthington Biochemical Corporation. The immobilized en- zyme contains approximately 50 mg of active enzyme, correspond- ing to about 103 units. Soluble glucose oxidase has a broad pH pro- file with a reported optimum at pH 5.6 (29). Therefore, the 0.004M acet,ate background was prepared to maintain the enzyme column at pH 5.6 (30 ).
Blind stahlized control sera were obtajned from the Center for Disease Control (CDC), Atlantq, Ga. for the correlation study. The samples are pooled calves sera which have been preserved by milli- pore filtration to remove bacteria and by addition of NaF to pre- vent glycolysis. The samples are reported to be stable for years when stored at room temperature. The control sera had previously been characterized by the glucose oxidase, Somogi-Nelson, o- tolu- idine, and ferricyanide methods for glucose analysis. Sigma Glu- cose Kits and Worthington Glucostat Kits were purchased from Sigma Chemical Co. and Worthingtoq Biochemicals, respectively.
The effect of uric acid (2,6,8-trioxypurine) on the chemilumines- cent reaction was observed by adding weighed quantities of potas- sium urate (Sigma) to glucose standards.
Al l of the above reager:ts were prepared using water from a Con- tinential Water Conditioning Company deionization system. The effect, of reaction pH on chemiluminescent response was stud- ied by adjusting the pH of 2 X 10⁻⁴M luminol, dissolved in the H:$O:{-KOH buffer, with either 4M HCI or 1M NaOH before ad- justing the working luminol reagent to its final volume. Luminol and metal concentration profiles were' accomplished by loading the respective syringes with the desired concent,ration of the reagents. Peak height was then observed with a fixed H202 concentration.
The CUC' serum samples were prepared for the correlation study by measuring 100 pl of either serum or standard by an automatic pipet into 1.9 ml of water. Two ml of the Somogi filtrate, contain- ing 1 ml of 1.8% Ra(OHI2 and 1 ml of 2% %So4 (31 ), were added
to the diluted serum and vortexed. The mixture was allowed t o stand for 10 minutes before being centrifuged. Two ml of the cen- trifugate were diluted to 100 ml wit,h 0.004M acetate buffer. The prepared samples were then introduced into the flow system and the chemiluminescent response recorded.
RESULTS AND DISCUSSION The development of the chemiluminescent glucose tech-
nique was divided into two stages. The goal of the first stage was to establish and optimize the quantitative as- pects of the peroxide-luminol reaction. For this study, the enzyme column was absent from the flow line and hydro- gen peroxide standards were introduced into the flow sys- tem.
Selection of the Chemiluminescent System. The reac- tion of luminol in the presence of Cu(II), Co(II), Ni(II), and SzOs2- was investigated. Initial studies with Cu(I1) were done in the presence of 0.1M ammonia since previous liter- ature reported that copper required NH3 for linearity (8). A t a reaction p H of 10.5 and 4 X 10⁻⁴M luminol, the chem- iluminescent response (peak height) was observed in the range 10-6-10-2M Cu(I1). The response was that of mixed kinetic order with peroxide concentration. Armstrong and Humphrey (14 ) suggested that linearity could be achieved by equating peak area rather than peak height with perox- ide concentration. However, our results did not support this conclusion. Because the highest sensitivity, without precipitate formation, occurred at 10-3M Cu(II), this con- centration was used for the remaining studies involving copper.
Attempts were made to determine the parameters gov- erning the kinetics of the luminol-peroxide-Cu(I1) re- sponse. Flow rate and the presence of NH? had no effect on reaction kinetics; however, the reaction pH decidedly con- trolled the first-order kinetics of the chemiluminescent reaction. Between p H 7.5 and 12.3, the reaction became in- creasingly linear with peroxide concentration as the p H was increased. At pH 12, a linear least squares analysis of the H202 calibration curve gave a sinusoidal change in the sign of the Y-residuals; however, their absolute magnitude was less than the error incurred in measuring peak height. Therefore, peroxide analysis based on a luminol- CutII) reaction may be performed on samples over a small concen- tration range. However, analysis of peroxide samples with concentrations varying 6ver several orders of magnitude could produce significant error due to the slight curvature in the standard curve. 'In addition, a more suitable luminol- metal reaction was desirable since the high pH, required for linearity, causes the formation of Cu(OH)> precipitates which give spurious fluctuations of chemiluminescent in- tensity.
The luminol-peroxide reaction in the presence of Co(1I) was observed to be twenty times more sensitive to peroxide than with Cu(I1) at pH 10.5. However, the maximum con- centration of Co(I1) that could be used was below 10-4M because of precipitate formation. The chemiluminescent response was characterized by extraneous side peaks just following the major peak. The peaks were not reproducible between runs and had significant noise at the tops of the peaks.
The luminol-Ni(I1) reaction gave a response that resem- bled a step function. With increasing peroxide concentra- tion, chemiluminescene intensity assumed one value before shifting to a second value with more concentrated peroxide samples. The peroxide concentration at which the shift in response occurred was not reproducible. Neither flow rate nor p H affected this behavior. Nickel(I1) also could not be used in concentrations greater than 10-4M because of pre- cipitate formation.
448 ANALYTICAL CHEMISTRY, VOL. 47, NO. 3, MARCH 1975
l a
P
I
P d
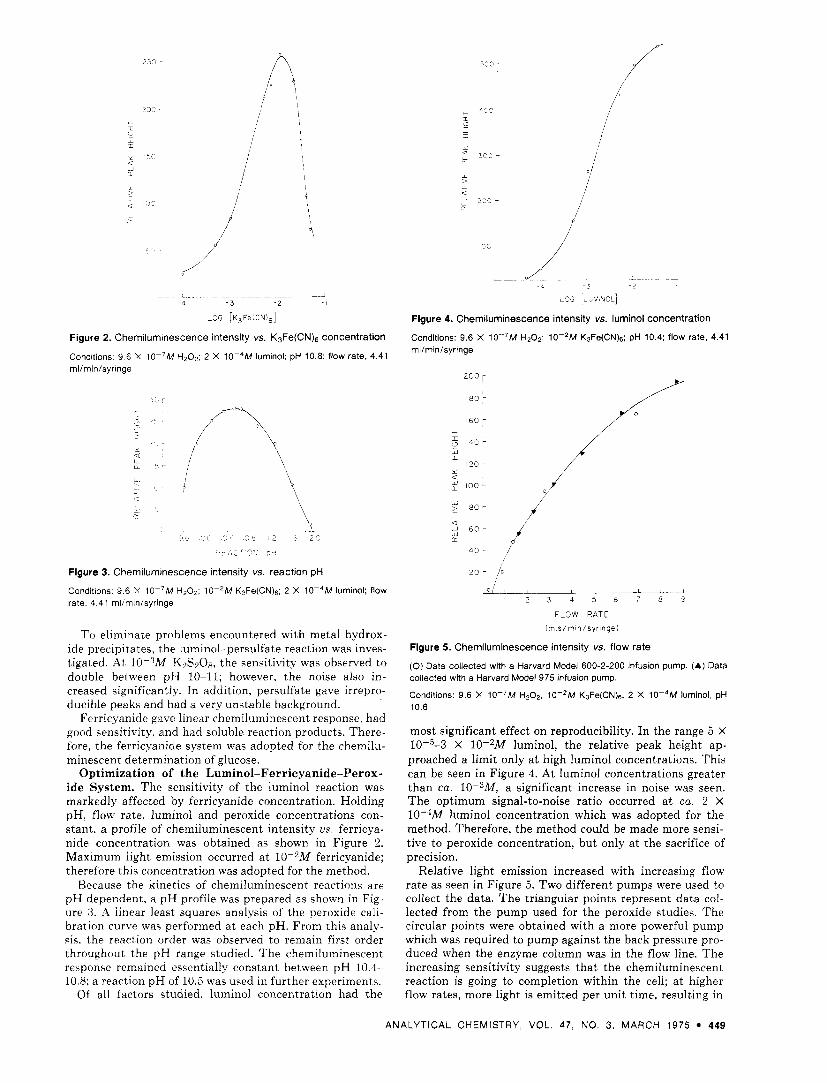
Figure 2. chemiluminescence intensity vs. K3Fe(CN),j concentration
Conditions: 9.6 X lO-'M H 2 0 p ; 2 X 10⁻⁴M luminol; pH 10.8; flow rate. 4.41 ml/min/syringe
Figure 4. Chemiluminescence intensity vs. luminol concentration Conditions: 9.6 X lO-'M H202; 10-'M K3Fe(CN)& pH 10.4; flow rate, 4.41 ml/rnin/syringe
160
3 - r L * i C ' d
r ^.. ^ j I_
Figure 3. Chemiluminescence intensity vs reaction pH
Conditions 9 6 X lO-'M H 2 0 2 , 10-*M K?F~S(CN)~, 2 X 10⁻⁴M luminol, flow rate 4 41 ml/min/syringe
To eliminate problems encountered with metal hydrox- ide precipitates. the luminol-persulfate reaction was inves- tigated. A t 10-:IM K:&O8, the sensitivity was observed to double between pH 10-11; however, the noise also in- creased significantly. In addition, persulfate gave irrepro- ducible peaks and had a very unstable background.
Ferricyanide gave linear chemiluminescent response, had good sensitivity. and had soluble reaction products. There- fore, the ferricyanide svstem was adopted for the chemilu- minescent determination of glucose.
Optimization of the Luminol-Ferricyanide-Perox- ide System. The sensitivity of the luminol reaction was markedly affected by ferricyanide concentration. Holding pH, flow rate, luminol and peroxide concentrations con- stant, a profile of chemiluminescent intensity us. ferricya- nide concentration was obtained as shown in Figure 2 . Maximum light, emission occurred a t 10-2M ferricyanide; therefore this concentration was adopted for the method.
Because the kinetics of chemiluminescent reactions are pH dependent, a pH profile was prepared as shown in Fig- ure 3 . A h e a r least squares analysis of the peroxide cali- bratinn curve was performed a t each pH. From this analy- sis, the reaction order was observed to remain first order throughout the pH range studied. The chemiluminescent response remained essentially constant between pH 10.4- 10.8; a reaction pH of 10.5 was used in further experiments.
Of all factors studied, luminol concentration had the
oi-_Ip,-L. . L A - 1 2 3 4 5 6 7 8 9
F L O W R A T E
~ m l s / m i n / s y r i n g e I
Figure 5. Chemiluminescence intensity vs. flow rate (0) Data collected with a Harvard Model 600-2-200 infusion pump. (A) Data collected with a Harvard Model 975 infusion pump.
Conditions: 9.6 X lO-'M H202, 10-*M K$Fe(CN)e. 2 X 10⁻⁴M lurninol, pH 10.6
most significant effect on reproducibility. In the range 5 X 10-"-3 X 10⁻²M luminol, the relative peak height ap- proached a limit only a t high luminol concentrations. This can be seen in Figure 4. At luminol concentrations greater than ca. lOP3M, a significant increase in noise was seen. The optimum signal-to-noise ratio occurred a t ca. 2 X 10⁻⁴M luminol concentration which was adopted for the method. Therefore, the method could be made more sensi- tive to peroxide concentration, but only a t the sacrifice of precision.
Relative light emission increased with increasing flow rate as seen in Figure 5 . Two different pumps were used to collect the data. The triangular points represent data col- lected from the pump used for the peroxide studies. The circular points were obtained with a more powerful pump which was required to pump against the back pressure pro- duced when the enzyme column was in the flow line. The increasing sensitivity suggests that the chemiluminescent reaction is going to completion within the cell; a t higher flow rates, more light is emitted per unit time, resulting in
ANALYTICAL C H E M I S T R Y , VOL. 47, NO. 3, M A R C H 1975 449
-7 -6 - 5 - 4
LOG [GLUCOSE]
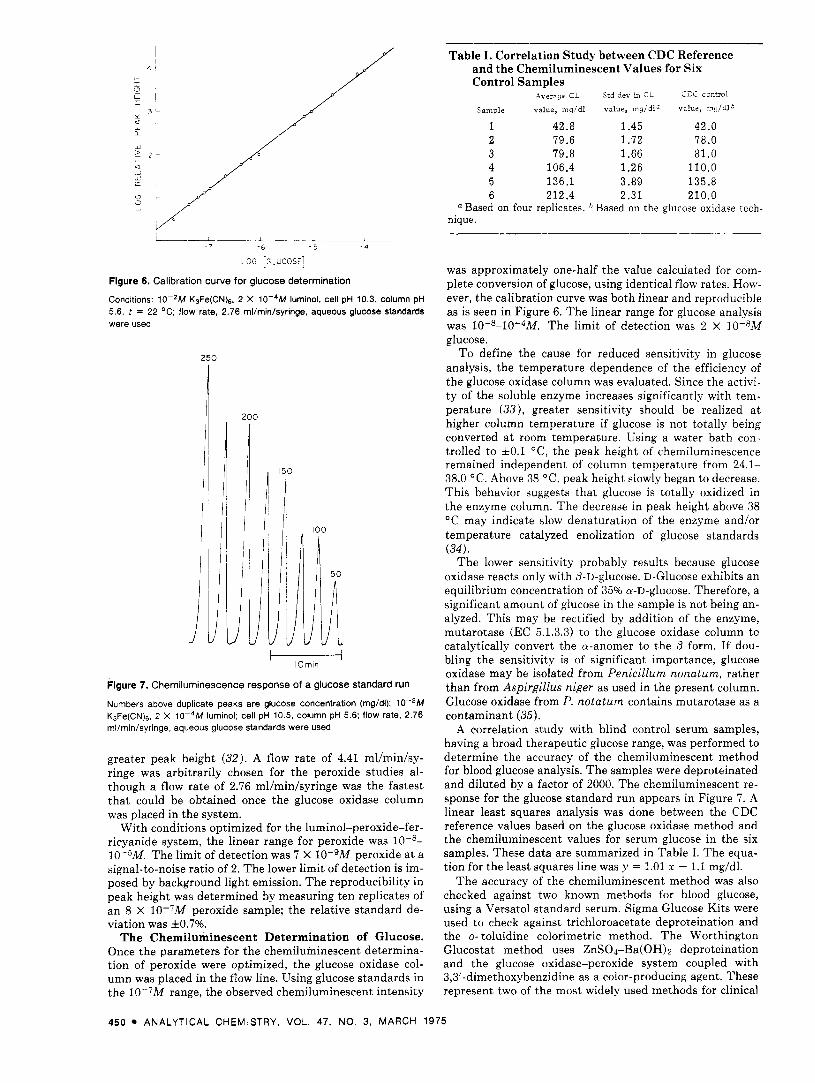
Figure 6. Calibration curve for glucose determination
Conditions: 10-*M K3Fe(CN)6, 2 X 10⁻⁴M luminol, cell pH 10.3, column pH 5.6, t = 22 OC; flow rate, 2.76 ml/min/syringe. aqueous glucose standards were used
250
200
, 150
I I IOmin
Figure 7. Chemiluminescence response of a glucose standard run
Numbers above duplicate peaks are glucose concentration (mg/dl); 10-*M K3Fe(CN)6, 2 X 10⁻⁴M luminol: cell pH 10.5, column pH 5.6; flow rate, 2.76 ml/min/syringe, aqueous glucose standards were used
greater peak height (32 ) . A flow rate of 4.41 ml/min/sy- ringe was arbitrarily chosen for the peroxide studies al- though a flow rate of 2.76 ml/min/syringe was the fastest that could be obtained once the glucose oxidase column was placed in the system.
With conditions optimized for the luminol-peroxide-fer- ricyanide system, the linear range for peroxide was 10-5M. The limit of detection was 7 X 10⁻⁹M peroxide a t a signal-to-noise ratio of 2. The lower limit of detection is im- posed by background light emission. The reproducibility in peak height was determined by measuring ten replicates of an 8 X lO-7M peroxide sample; the relative standard de- viation was f0.7%.
The Chemiluminescent Determination of Glucose. Once the parameters for the chemiluminescent determina- tion of peroxide were optimized, the glucose oxidase col- umn was placed in the flow line. Using glucose standards in the 10-7M range, the observed chemiluminescent intensity
Table I. Correlation Study between CDC Reference and the Chemiluminescent Values for Six Control Samples
Average CL Std dev in CL CDC control
Sample value, m q / d l value, mgid lQ value, m d d h
1 42.8 1.45 42.0 2 79.6 1.72 78.0 3 79.8 1.66 81.0 4 106.4 1.26 110.0 5 136.1 3.89 135.8 6 212.4 2.31 210.0
a Based on four replicates. * Based on the glucose oxidase tech- nique.
was approximately one-half the value calculated for com- plete conversion of glucose, using identical flow rates. How- ever, the calibration curve was both linear and reproducible as is seen in Figure 6. The linear range for glucose analysis was 10-s-10-4M. The limit of detection was 2 x 10⁻⁸M glucose.
To define the cause for reduced sensitivity in glucose analysis, the temperature dependence of the efficiency of the glucose oxidase column was evaluated. Since the activi- ty of the soluble enzyme increases significantly with tem- perature (33), greater sensitivity should be realized a t higher column temperature if glucose is not totally being converted a t room temperature. Using a water bath con- trolled to hO.1 "C, the peak height of chemiluminescence remained independent of column temperature from 24.1- 38.0 "C. Above 38 "C, peak height slowly began to decrease. This behavior suggests that glucose is totally oxidized in the enzyme column. The decrease in peak height above 38 "C may indicate slow denaturation of the enzyme and/or temperature catalyzed enolization of glucose standards (34) .
The lower sensitivity probably results because glucose oxidase reacts only with 6-n-glucose. D-Glucose exhibits an equilibrium concentration of 35% a-D-glucose. Therefore, a significant amount of glucose in the sample is not being an- alyzed. This may be rectified by addition of the enzyme, mutarotase (EC 5.1.3.3) to the glucose oxidase column to catalytically convert the a-anomer to the f l form. If dou- bling the sensitivity is of significant importance, glucose oxidase may be isolated from Penicillum nonatum, rather than from Aspirgillus niger as used in the present column. Glucose oxidase from P. notatum contains mutarotase as a contaminant (35).
A correlation study with blind control serum samples, having a broad therapeutic glucose range, was performed to determine the accuracy of the chemiluminescent method for blood glucose analysis. The samples were deproteinated and diluted by a factor of 2000. The chemiluminescent re- sponse for the glucose standard run appears in Figure 7 . A linear least squares analysis was done between the CDC reference values based on the glucose oxidase method and the chemiluminescent values for serum glucose in the six samples. These data are summarized in Table I. The equa- tion for the least squares line was y = 1.01 x - 1.1 mg/dl.
The accuracy of the chemiluminescent method was also checked against two known methods for blood glucose, using a Versatol standard serum. Sigma Glucose Kits were used to check against trichloroacetate deproteination and the 0- toluidine colorimetric method. The Worthington Glucostat method uses ZnS04-Ba(OH)z deproteination and the glucose oxidase-peroxide system coupled with 3,3'-dimethoxybenzidine as a color-producing agent. These represent two of the most widely used methods for clinical
450 ANALYTICAL CHEMISTRY, VOL. 47, NO. 3, M A R C H 1975
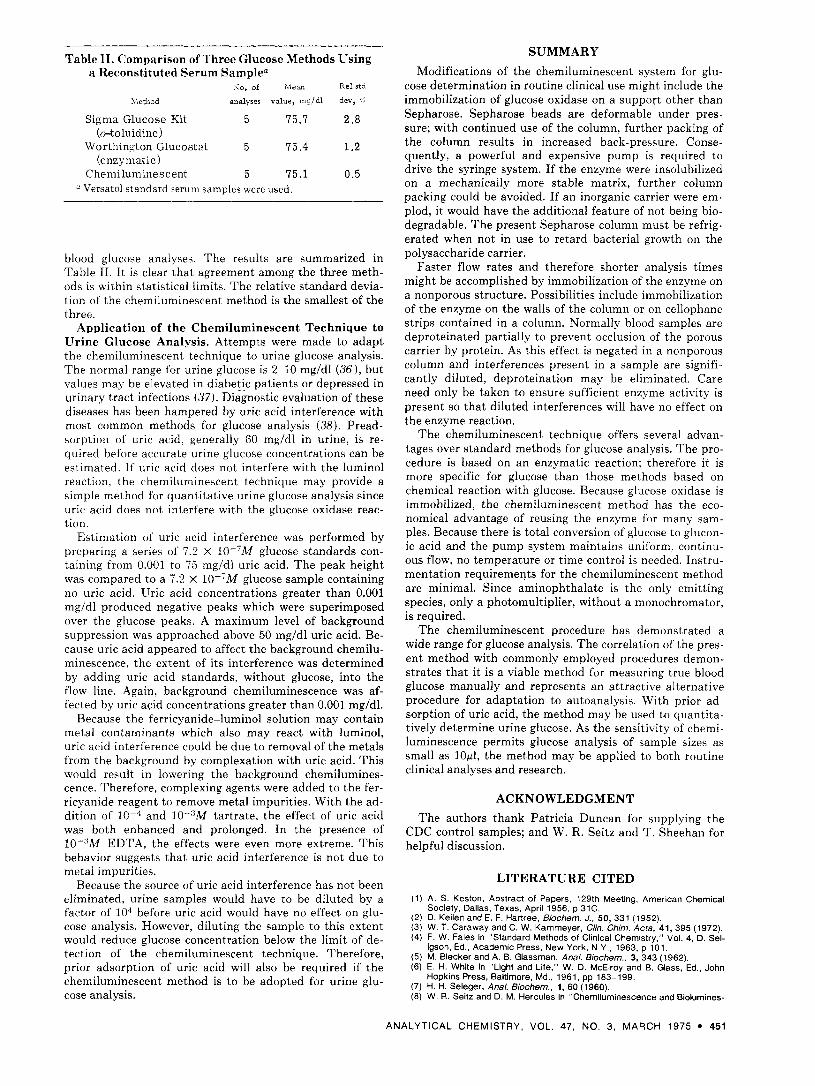
Table 11. Comparison of Three Glucose Methods Using a Reconstituted Serum Samplea
So. of Mean Re1 std
Xlethod analyses value, mg/dl dev, e<
Sigma Glucose Kit 5 75.7 2.8
Worthington Glucostat 5 75.4 1 .2
Chemiluminescent 5 75.1 0.5
(dolu id ine)
(enzymatic)
L1 Versatol standard 'ieruiii samples were used.
blood glucose analyses. The results are summarized in Table 11. I t is clear tha t agreement among the three meth- ods is within statistical limits. The relative standard devia- tion of the chemiluminescent method is the smallest of the three.
Application of t h e Chemiluminescent Technique to Urine Glucose Analysis. Attempts were made to adapt the chemiluminescent technique to urine glucose analysis. The normal range for urine glucose is 2-10 mg/dl (36), but values may be elevated in diabetic patients or depressed in urinary tract infections (37). Diagnostic evaluation of these diseases has been hampered by uric acid interference with most common methods for glucose analysis (38). Pread- sorption of uric acid, generally 60 mg/dl in urine, is re- quired before accurate urine glucose concentrations can be estimated. If uric acid does not interfere with the luminol reaction, the chemiluminescent technique may provide a simple method for quantitative urine glucose analysis since uric acid does not interfere with the glucose oxidase reac- tion.
Estimation of uric acid interference was performed by preparing a series of 7.2 x 1W'M glucose standards con- taining from 0.001 to 75 mg/dl uric acid. The peak height was compared to a 7.2 x 10-'M glucose sample containing no uric acid. LJric acid concentrations greater than 0.001 mg/dl produced negative peaks which were superimposed over the glucose peaks. A maximum level of background suppression was approached above 50 mg/dl uric acid. Be- cause uric acid appeared to affect the background chemilu- minescence, the extent of its interference was determined by adding uric acid standards, without glucose, into the flow line. Again, background chemiluminescence was af- fected by uric acid concentrations greater than 0.001 mg/dl.
Because the ferr icyanide-luminol solution may contain metal contaminants which also may react with luminol, uric acid interference could be due to removal of the metals from the background by complexation with uric acid. This would result in lowering the background chemilumines- cence. Therefore, complexing agents were added to the fer- ricyanide reagent to remove metal impurities. With the ad- dition of lW4 and 10-3M tartrate, the effect of uric acid was both enhanced and prolonged. In the presence of 10-:<M EDTA, the effects were even more extreme. This behavior suggests that uric acid interference is not due to metal impurities.
Because the source of uric acid interference has not been eliminated, urine samples would have to be diluted by a factor of IO4 before uric acid would have no effect on glu- cose analysis. However, diluting the sample to this extent would reduce glucose concentration below the limit of de- tection of the chemiluminescent technique. Therefore, prior adsorption of uric acid will also be required if the chemiluminescent method is to be adopted for urine glu- cose analysis.
SUMMARY
Modifications of the chemiluminescent system for glu- cose determination in routine clinical use might include the immobilization of glucose oxidase on a support other than Sepharose. Sepharose beads are deformable under pres- sure; with continued use of the column, further packing of the column results in increased back-pressure. Conse- quently, a powerful and expensive pump is required to drive the syringe system. If the enzyme were insolubilized on a mechanically more stable matrix, further column packing could be avoided. If an inorganic carrier were em- plod, it would have the additional feature of not being bio- degradable. The present Sepharose column must be refrig- erated when not in use to retard bacterial growth on the polysaccharide carrier.
Faster flow rates and therefore shorter analysis times might be accomplished by immobilization of the enzyme on a nonporous structure. Possibilities include immobilization of the enzyme on the walls of the column or on cellophane strips contained in a column. Normally blood samples are deproteinated partially to prevent occlusion of the porous carrier by protein. As this effect is negated in a nonporous column and interferences present in a sample are signifi- cantly diluted, deproteination may be eliminated. Care need only be taken to ensure sufficient enzyme activity is present so that diluted interferences will have no effect on the enzyme reaction.
The chemiluminescent technique offers several advan- tages over standard methods for glucose analysis. The pro- cedure is based on an enzymatic reaction; therefore it is more specific for glucose than those methods based on chemical reaction with glucose. Because glucose oxidase is immobilized, the chemiluminescent method has the eco- nomical advantage of reusing the enzyme for many sam- ples. Because there is total conversion of glucose to glucon- ic acid and the pump system maintains uniform, continu- ous flow, no temperature or time control is needed. Instru- mentation requirements for the chemiluminescent method are minimal. Since aminophthalate is the only emitting species, only a photomultiplier, without a monochromator, is required.
The chemiluminescent procedure has demonstrated a wide range for glucose analysis. The correlation of the pres- ent method with commonly employed procedures demon- strates that it is a viable method for measuring true blood glucose manually and represents an attractive alternative procedure for adaptation to autoanalysis. With prior ad- sorption of uric acid, the method may be used to quantita- tively determine urine glucose. As the sensitivity of chemi- luminescence permits glucose analysis of sample sizes as small as 10~1, the method may be applied to both routine clinical analyses and research.
ACKNOWLEDGMENT
The authors thank Patricia Duncan for supplying the CDC control samples; and W. R. Seitz and T. Sheehan for helpful discussion.
LITERATURE CITED
(1) A. S. Keston, Abstract of Papers, 129th Meeting, American Chemical
(2) D. Keilen and E. F . Hartree, Biochem. J., 50, 331 (1952). (3) W. T. Caraway and C. W. Kammeyer, Clin. Chim. Acta, 41, 395 (1972). (4) F. W. Fales in "Standard Methods of Clinical Chemistry," Vol. 4, D. Sel-
igson, Ed., Academic Press, New York. N.Y., 1963, p 101. ( 5 ) M. Blecker and A. B. Glassman, Anal. Biochem., 3, 343 (1962). (6) E. H. White in "Light and Life," W. D. McElroy and B. Glass, Ed., John
Hopkins Press, Baltimore, Md., 1961. pp 183-199. (7) H. H. Seleger, Anal. Biochem., 1, 60 (1960). ( 8 ) W. I?. Seitz and D. M. Hercules in "Chemiluminescence and Biolumines-
Society, Dallas, Texas, April 1956, p 31C.
ANALYTICAL CHEMISTRY, VOL. 47, NO. 3, MARCH 1975 451
cence." M. J. Cormier, D. M. Hercules, and J. Lee, Ed., Plenum, New York, N.Y., 1973, pp 427-449.
(9) K. Gleu and K. Pfannsteil, J. Pract. Chem., 146, 137 (1936). (10) W. Langenbeck and U. Ruge, 5erDeut. Chem. Ges. 5, 70,367 (1937). (11) L. I. Dubovenko. M. S. Rigun, and V. 0. Bilochenko, Vim. Kiiv. Univ.,
(12) A. K. Babko and N. M. Lukovskaya, Ukr., Khem. Zhr.. 27, 519 (1961). (13) A. K. Babko and N. M. Lukovskaya, Zh. Anal. Khim., 17, 50 (1962). (14) W. A. Armstrong and W. G. Humphreys, Can. J. Chem., 43, 2576
(15) A. A. Ponomarenko. Tr. Mask. Obshchest. lspyt. Prir., Otd. Biol., 21,
(16) N. M. Lukovskaya, A. V. Terletskaya, and N. I. Isaenko, Zavod. Lab.,
(17) A. Steigmann, J. SOC. Chem. lnd., 61, 36 (1942). (18) J. Kubal, Chem. Listy, 62, 1478 (1968). (19) H. Ojima and R. Iwaki, NipponKagakuZasshi, 78, 1632 (1957). (20) A. K. Babko and I. E. Kalinichenko, Ukr. Chem. Zh., 31, 1092 (1957). (21) A. Dorabialska and A. Kalinowska, Rocz. Chem., 42, 1905 (1965). (22) A. G. Stepanova and E. A. Bozhevol'nov, Tr. Vses. Nauch.-lssled, lnst.
Khim. Reactiv. Osobo, Chist. Khim. Veshchestv, 32, 384 (1970). (23) V. K. Zinchuk and A. I. Komlev, Zh. Anal. Khim., 28,616(1973). (24) D. T. Bostick and D. M. Hercules, Anal. Letts., 7, 347 (1974). (25) J. P. Auses and J. T. Maloy, Paper No. 89, presented at the Pittsburgh
Conference on Analytical Chemistry and Applied Spectroscopy, Cleve- land, Ohio, March 4, 1974.
(26) E. H. Huntress, L. N. Stanley, and A. S. Parker, J. Chem. Educ., 11, 142 (1934).
Ser. Khim., 13, 25 (1972).
(1965).
165 (1965).
37, 897 (1971).
(27) G. H. Ayers, "Quantitative Chemical Analysis," 2nd ed., Harper and
(28) W. L. Schumb, C. N. Satterfield, and R. L. Wentworth, "Hydrogen Per-
(29) H. J. Bright and M. Appleby, J. Bid. Chem., 244, 3625 (1969). (30) H. A. Sober, Ed., "CRC Handbook of Biochemistry," 2nd ed., Chemical
(31) S. A. Levinson and R. P. MacFate, "Clinical Diagnosis," 7th ed., Lea
(32) W. R. Seitz. W. W. Suydam, and D. M. Hercules, Anal. Chem., 44, 957
(33) D. Keilen and E . F. Hartree, Biochem. J., 42, 221 (1948). (34) J. A. Johnson and R. M. Fusaro, Anal. Biochem., 13, 412 (1965). (35) E. C. Adams. Jr., R. L. Mast, and A. H. Free, Arch. Biochem. Biophys.,
(36) K. Diem and C. Lenter, Ed., "Scientific Tables,: CIBA-Geigy Ltd., Basle,
(37) N. Matsaniotis, C. Daneltou-Athanassiadou. C. Katerlos, P. Hartokalis,
(38) W. T. Carraway and C. W. Kammeyer, Clin. Chem. Acta, 41, 395
Row, New York, N.Y.. 1968, p. 621.
oxide." Reinhold, New York, MY.. 1955.
Rubber Co., Cleveland, Ohio, 1970, pp J195-197.
and Fibiger, Philadelphia, Pa., 1969, pp 4-7.
(1972).
91, 230 (1969).
Switzerland, 1973, p 673.
and E. Apostolopouiou, J. Pediat., 78, 85 (1971).
(1972).
RECEIVED for review August 26,1974. Accepted November 4, 1974. This work was supported by the National Insti- tutes of General Medical Sciences under grant GM-17913.
Comparative Study of Colorimetric and Fluorometric Determination of Thiamine (Vitamin B,) by an Automated Discrete-Sampling Technique
John Y. Park
Beckman Instruments, Iflc., P.O. Box 0-W, Irvifle, Calif. 92664
Thiamine content In vitamin Preparations has been analyzed by employing a newly developed automated materials ana- lyzer. In this study, two analytical methods were used in de- termining thiamine content under controlled condltions: the fluorometric method and the colorimetric method. Based on experimental results of the above two methods, discussions and comparative recommendations are given for rapid qual- ity control work and general laboratory practlces. The fluo- rometric method is preferred in a case of low thiamine con- tent and the acid-dye method preferred when there is high thiamine content. This is due, mainly, to the limitations of their inherent specificity and errors introduced by dilution to their analytical concentrations.
Because of the ever increasing number of analyses for drugs, vitamins, and nutritional products ( I ) , rapid and re- liable analytical methods are becoming more essential in pharmaceutical, biological, and food industries.
The assay procedure for thiamine determination de- scribed in the U S . Pharmacopeia XVIII (1970) (2) , and the National Formulary XI11 (3) requires a great deal of analy- sis time for manual operation because of the chemical na- ture of the analysis involved. This makes tablet-by-tablet analysis a difficult task for chemical analysts, especially in cases of rapid control work. With a highly mechanized au- tomatic instrument, coupled with various detection sys- tems, the standard operations of analytical chemistry can be facilitated with precision and accuracy. Such an instru- ment has been developed ( 4 , 5 ) .
The assay method of thiamine recommended by the committees of the U S . Pharmacopeia and National For- mulary is based on the thiochrome reaction-the so-called fluorometric method. This method is most widely used for thiamine determination in pharmaceutical quality control laboratories (6). Although the fluorometric method is the most specific of all the methods in general use for thiamine determination, the need to give close attention to the de- tails of the procedure detracts from its use for rapid control work (7). On the other hand, while colorimetric inethods receive very little attention, a promising colorimetric meth- od utilizing the basicity of thiamine has been reported re- cently by Das Gupta and Cadwallader ( 7 ) .
The nature of the colorimetric method-namely, acid- dye method, appears to be based on a simple acid-base reaction between the thiamine and bromothymol blue in a pH 6.6 buffer medium. When considering the most basic property of thiamine among the vitamins, the reaction could be ideally used for a determination of thiamine in vi- tamin preparations. Furthermore, the method seems to be convenient and simple to adapt for rapid analysis, especial- ly for an automatic operation; as it gains merit from the simple acid-base reaction which produces the stable col- ored salt (the acid-dye salt). These two analytical schemes are shown on page 453.
Therefore, the present study was carried out with the au- tomatic instrumentation to develop automated procedures for both the fluorometric and the colorimetric methods, and to test their applicabilities to the thiamine assay in vi- tamin preparations especially intended for general prac- tices. Included are discussions on the limitations of both
452 ANALYTICAL CHEMISTRY, VOL. 47, NO. 3, MARCH 1975