quantifying the driving factors for language shift in a … the driving factors for language shift...
TRANSCRIPT
Quantifying the driving factors for language shift in abilingual regionKatharina Prochazkaa,1 and Gero Vogla
aDynamics of Condensed Systems, Faculty of Physics, University of Vienna, 1090 Vienna, Austria
Edited by Barbara H. Partee, University of Massachusetts at Amherst, Amherst, MA, and approved February 13, 2017 (received for review November 2, 2016)
Many of the world’s around 6,000 languages are in danger ofdisappearing as people give up use of a minority language in favorof the majority language in a process called language shift. Lan-guage shift can be monitored on a large scale through the use ofmathematical models by way of differential equations, for exam-ple, reaction–diffusion equations. Here, we use a different ap-proach: we propose a model for language dynamics based onthe principles of cellular automata/agent-based modeling andcombine it with very detailed empirical data. Our model makesit possible to follow language dynamics over space and time,whereas existing models based on differential equations averageover space and consequently provide no information on localchanges in language use. Additionally, cellular automata modelscan be used even in cases where models based on differentialequations are not applicable, for example, in situations whereone language has become dispersed and retreated to languageislands. Using data from a bilingual region in Austria, we showthat the most important factor in determining the spread and re-treat of a language is the interaction with speakers of the samelanguage. External factors like bilingual schools or parish languagehave only a minor influence.
language shift | diffusion | language dynamics | quantitative linguistics |cellular automata
It is estimated that around 90% of the world’s 6,000 languageswill be replaced by a few dominant languages by the end of the
21st century (1). This replacement, which is called “languageshift” (2), leads to a loss of cultural diversity. To prevent this lossand preserve endangered languages, researchers have been try-ing to find and quantify the factors behind language shift. Lan-guage shift (speakers giving up use of one language in favor ofanother) is driven by a variety of influences, for instance, de-mographic and social factors (3–5). To quantify the influence ofeach of these factors and to study language shift on a large scale,mathematical models and computer simulations have been pro-posed (6, 7). These models generally fall into two categories:(i) macroscopic reaction–diffusion equations that describe the con-centration (fraction) of speakers in the population; (ii) microscopicagent-based models that simulate the actions of individual speakers(“agents”) changing their language with a certain probability at eachinteraction. For evaluating both types of model, parameters arerequired that can be empirically measured so that they can be fittedto data (8). This means that data covering language use over timeand space are needed, but such data are often not available insufficient resolution. Therefore, mathematical models have so faronly rarely been checked against data on actual language use.In this work, we combine mathematical modeling with very de-
tailed empirical data. Applying diffusion theory from physics, wepropose a simple model to describe the dynamics of language shift ona microscopic scale based on the principles of cellular automata/agent-based modeling (9, 10). The historical data come fromsouthern Carinthia, Austria, which provides an extremely well-documented linguistic ecosystem with the interaction of two lan-guages on one and the same territory. Carinthia was a federal state ofthe Austro-Hungarian Empire until 1918 and of the Federal Re-public of Austria afterward. It is geographically separated by a high
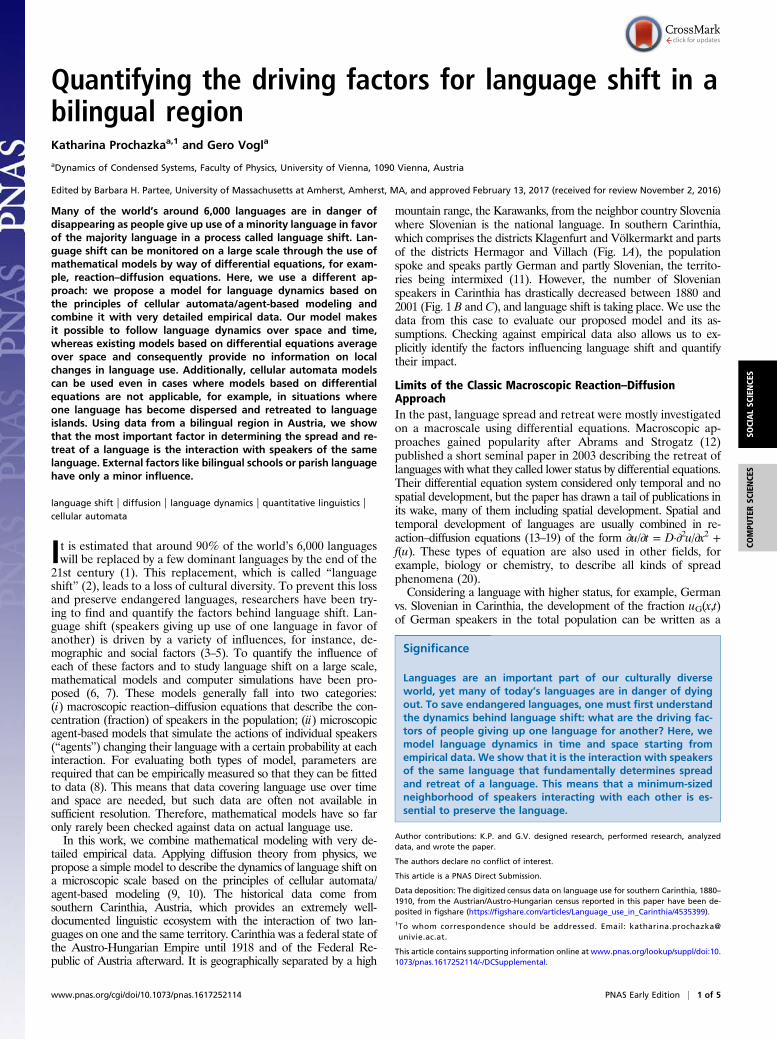
mountain range, the Karawanks, from the neighbor country Sloveniawhere Slovenian is the national language. In southern Carinthia,which comprises the districts Klagenfurt and Völkermarkt and partsof the districts Hermagor and Villach (Fig. 1A), the populationspoke and speaks partly German and partly Slovenian, the territo-ries being intermixed (11). However, the number of Slovenianspeakers in Carinthia has drastically decreased between 1880 and2001 (Fig. 1 B and C), and language shift is taking place. We use thedata from this case to evaluate our proposed model and its as-sumptions. Checking against empirical data also allows us to ex-plicitly identify the factors influencing language shift and quantifytheir impact.
Limits of the Classic Macroscopic Reaction–DiffusionApproachIn the past, language spread and retreat were mostly investigatedon a macroscale using differential equations. Macroscopic ap-proaches gained popularity after Abrams and Strogatz (12)published a short seminal paper in 2003 describing the retreat oflanguages with what they called lower status by differential equations.Their differential equation system considered only temporal and nospatial development, but the paper has drawn a tail of publications inits wake, many of them including spatial development. Spatial andtemporal development of languages are usually combined in re-action–diffusion equations (13–19) of the form ∂u/∂t = D·∂2u/∂x2 +f(u). These types of equation are also used in other fields, forexample, biology or chemistry, to describe all kinds of spreadphenomena (20).Considering a language with higher status, for example, German
vs. Slovenian in Carinthia, the development of the fraction uG(x,t)of German speakers in the total population can be written as a
Significance
Languages are an important part of our culturally diverseworld, yet many of today’s languages are in danger of dyingout. To save endangered languages, one must first understandthe dynamics behind language shift: what are the driving fac-tors of people giving up one language for another? Here, wemodel language dynamics in time and space starting fromempirical data. We show that it is the interaction with speakersof the same language that fundamentally determines spreadand retreat of a language. This means that a minimum-sizedneighborhood of speakers interacting with each other is es-sential to preserve the language.
Author contributions: K.P. and G.V. designed research, performed research, analyzeddata, and wrote the paper.
The authors declare no conflict of interest.
This article is a PNAS Direct Submission.
Data deposition: The digitized census data on language use for southern Carinthia, 1880–1910, from the Austrian/Austro-Hungarian census reported in this paper have been de-posited in figshare (https://figshare.com/articles/Language_use_in_Carinthia/4535399).1To whom correspondence should be addressed. Email: [email protected].
This article contains supporting information online at www.pnas.org/lookup/suppl/doi:10.1073/pnas.1617252114/-/DCSupplemental.
www.pnas.org/cgi/doi/10.1073/pnas.1617252114 PNAS Early Edition | 1 of 5
SOCIALSC
IENCE
SCO
MPU
TERSC
IENCE
S
reaction–diffusion equation following Fisher’s equation foradvantageous genes (21):
∂uG=∂t=DG · ∂2uG�∂x2 + k · uG · ð1− uGÞ. [1]
Here, DG is the diffusivity of German language and k is the con-version rate from Slovenian to German. The fraction of Slovenianspeakers is given by uS = 1 − uG.In Carinthia, the language front between German and Slovenian
essentially advances only southward motivating a one-dimensionaltreatment. Eq. 1 then results in a traveling front of the higher statuslanguage (in this case German) with velocity v:
v= 2ffiffiffiffiffiffiffiffiffiffiffiffiDG · k
p. [2]
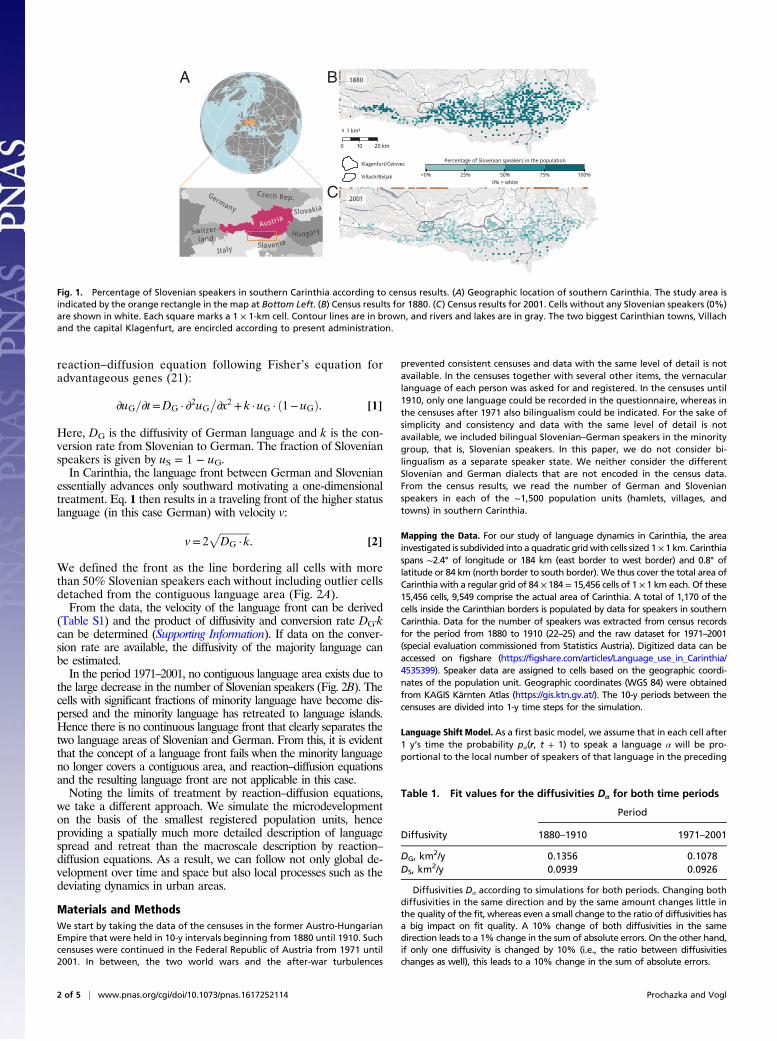
We defined the front as the line bordering all cells with morethan 50% Slovenian speakers each without including outlier cellsdetached from the contiguous language area (Fig. 2A).From the data, the velocity of the language front can be derived
(Table S1) and the product of diffusivity and conversion rate DG·kcan be determined (Supporting Information). If data on the conver-sion rate are available, the diffusivity of the majority language canbe estimated.In the period 1971–2001, no contiguous language area exists due to
the large decrease in the number of Slovenian speakers (Fig. 2B). Thecells with significant fractions of minority language have become dis-persed and the minority language has retreated to language islands.Hence there is no continuous language front that clearly separates thetwo language areas of Slovenian and German. From this, it is evidentthat the concept of a language front fails when the minority languageno longer covers a contiguous area, and reaction–diffusion equationsand the resulting language front are not applicable in this case.Noting the limits of treatment by reaction–diffusion equations,
we take a different approach. We simulate the microdevelopmenton the basis of the smallest registered population units, henceproviding a spatially much more detailed description of languagespread and retreat than the macroscale description by reaction–diffusion equations. As a result, we can follow not only global de-velopment over time and space but also local processes such as thedeviating dynamics in urban areas.
Materials and MethodsWe start by taking the data of the censuses in the former Austro-HungarianEmpire that were held in 10-y intervals beginning from 1880 until 1910. Suchcensuses were continued in the Federal Republic of Austria from 1971 until2001. In between, the two world wars and the after-war turbulences
prevented consistent censuses and data with the same level of detail is notavailable. In the censuses together with several other items, the vernacularlanguage of each person was asked for and registered. In the censuses until1910, only one language could be recorded in the questionnaire, whereas inthe censuses after 1971 also bilingualism could be indicated. For the sake ofsimplicity and consistency and data with the same level of detail is notavailable, we included bilingual Slovenian–German speakers in the minoritygroup, that is, Slovenian speakers. In this paper, we do not consider bi-lingualism as a separate speaker state. We neither consider the differentSlovenian and German dialects that are not encoded in the census data.From the census results, we read the number of German and Slovenianspeakers in each of the ∼1,500 population units (hamlets, villages, andtowns) in southern Carinthia.
Mapping the Data. For our study of language dynamics in Carinthia, the areainvestigated is subdivided into a quadratic grid with cells sized 1 × 1 km. Carinthiaspans ∼2.4° of longitude or 184 km (east border to west border) and 0.8° oflatitude or 84 km (north border to south border). We thus cover the total area ofCarinthia with a regular grid of 84 × 184 = 15,456 cells of 1 × 1 km each. Of these15,456 cells, 9,549 comprise the actual area of Carinthia. A total of 1,170 of thecells inside the Carinthian borders is populated by data for speakers in southernCarinthia. Data for the number of speakers was extracted from census recordsfor the period from 1880 to 1910 (22–25) and the raw dataset for 1971–2001(special evaluation commissioned from Statistics Austria). Digitized data can beaccessed on figshare (https://figshare.com/articles/Language_use_in_Carinthia/4535399). Speaker data are assigned to cells based on the geographic coordi-nates of the population unit. Geographic coordinates (WGS 84) were obtainedfrom KAGIS Kärnten Atlas (https://gis.ktn.gv.at/). The 10-y periods between thecensuses are divided into 1-y time steps for the simulation.
Language Shift Model. As a first basic model, we assume that in each cell after1 y’s time the probability pα(r, t + 1) to speak a language α will be pro-portional to the local number of speakers of that language in the preceding
A B
C
Fig. 1. Percentage of Slovenian speakers in southern Carinthia according to census results. (A) Geographic location of southern Carinthia. The study area isindicated by the orange rectangle in the map at Bottom Left. (B) Census results for 1880. (C) Census results for 2001. Cells without any Slovenian speakers (0%)are shown in white. Each square marks a 1 × 1-km cell. Contour lines are in brown, and rivers and lakes are in gray. The two biggest Carinthian towns, Villachand the capital Klagenfurt, are encircled according to present administration.
Table 1. Fit values for the diffusivities Dα for both time periods
Period
Diffusivity 1880–1910 1971–2001
DG, km2/y 0.1356 0.1078
DS, km2/y 0.0939 0.0926
Diffusivities Dα according to simulations for both periods. Changing bothdiffusivities in the same direction and by the same amount changes little inthe quality of the fit, whereas even a small change to the ratio of diffusivities hasa big impact on fit quality. A 10% change of both diffusivities in the samedirection leads to a 1% change in the sum of absolute errors. On the other hand,if only one diffusivity is changed by 10% (i.e., the ratio between diffusivitieschanges as well), this leads to a 10% change in the sum of absolute errors.
2 of 5 | www.pnas.org/cgi/doi/10.1073/pnas.1617252114 Prochazka and Vogl
year nα(r, t) plus an increase through interaction Fα(r, t) with speakers of thesame language in the neighborhood cells. pα(r, t + 1) is normalized to thetotal number of speakers and the total interaction in that cell. We obtainEq. 3 for the probability pα(r, t + 1) to speak language α (where α = G or S,German or Slovenian) in the cell located at position r at time t + 1
pαðr, t + 1Þ= nαðr, tÞ+ Fαðr, tÞnSðr, tÞ+ FSðr, tÞ+nGðr, tÞ+ FGðr, tÞ. [3]
To calculate pα for the first year of the simulation, Fα and nα are calculatedfrom the initial census data. Afterward, Fα and nα are calculated for eachyear from the result of the preceding year as follows.
The number of speakers of a language α at position r at time t, nα(r, t), isgiven by Eq. 4: the probability pα(r, t) to speak the language α at time tmultiplied by the total number of people in the cell ntotal(r, t), which for eachtime step and cell is given by linear interpolation between censuses:
nαðr, tÞ=ntotalðr, tÞ ·pαðr, tÞ. [4]
Each interaction term Fα(r, t) is a sum over the contributions of all other cellssurrounding the initial cell at position r. The interaction Fα with speakers ofthe same language α in the neighboring cells at rj is as follows:
Fαðr, tÞ := Fαðr,nα, tÞ=Xrj≠r
cα�r, r j ,nα, t
�. [5]
The contributions cα(r, rj, nα, t) of all other cells positioned at rj surroundingthe initial cell at position r are modeled by Gaussian functions identical todistributions describing the diffusion of particles in physics or chemistry:
cα�r, r j ,nα, t
�=
nα
�rj , t
�4πDα ·Δt
·exp
−��r − r j
��24Dα ·Δt
!, [6]
where Dα are the diffusivities of each language, that is, measures for theirspread. The diffusivities can also be seen as a measure for the region ofinfluence of a language. We set Δt = 1 y because cα is calculated individuallyfor each year from the result of the preceding year.
The Gaussian function is a simple choice to model the interaction withneighboring cells and provides a good fit with the census data. In an ex-tension of our model, this interaction could be modeled by other functionssuch as leptokurtic (long-tail) distributions or combinations of functions todescribe more complex interaction patterns, for example, both long-rangeand short-range interaction.
Evaluation Procedure. Simulations were performed using GNU Octave 4.0.0. Thedata from the first census in each period (1880 and 1971) were set as the initialstate fromwhich the number of speakers in each cell changes according to Eqs. 3
and 4, assuming a linear population development between censuses. To evalu-ate the goodness of fit between simulated data and census data, we use ordi-nary least squares (OLS) to minimize the squared sum of errors:
OLS=Xm−1
t=1
Xni=1
ðOi − EiÞ2, [7]
where Oi is an observed data point (census data) and Ei is an estimated datapoint (simulated data). t is the number of times the observed data can becompared with the estimated data. t runs from 1 to m − 1, where m is thenumber of censuses within the period. The data from the first census in eachperiod are excluded as they are equivalent to the initial state of the system;hence there is no error for the initial state and we sum only over theremaining censuses. Optimization was done using the Nelder–Mead method(26). Additionally, we used least absolute errors (LAE) as follows:
LAE=Xm−1
t=1
Xni=1
jOi − Ei j, [8]
that is, minimizing the sum of the absolute errors to check the reliability ofthe fit. General model performance is evaluated by comparison with abaseline. Comparison values can be found in Table S2.
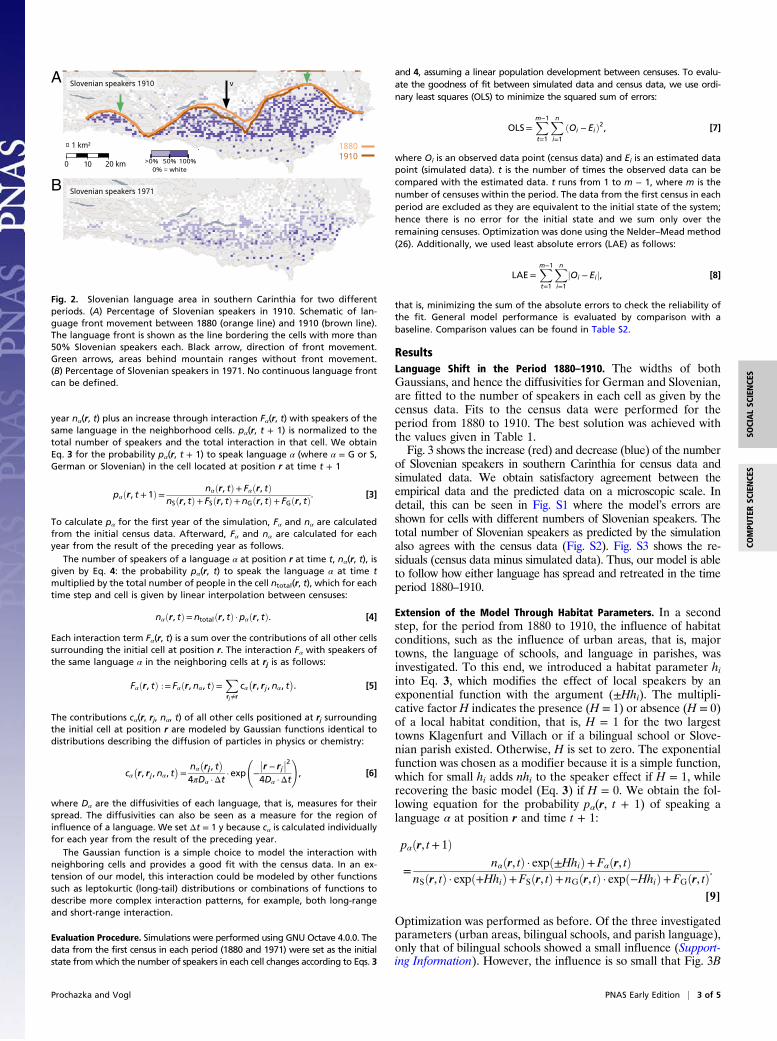
ResultsLanguage Shift in the Period 1880–1910. The widths of bothGaussians, and hence the diffusivities for German and Slovenian,are fitted to the number of speakers in each cell as given by thecensus data. Fits to the census data were performed for theperiod from 1880 to 1910. The best solution was achieved withthe values given in Table 1.Fig. 3 shows the increase (red) and decrease (blue) of the number
of Slovenian speakers in southern Carinthia for census data andsimulated data. We obtain satisfactory agreement between theempirical data and the predicted data on a microscopic scale. Indetail, this can be seen in Fig. S1 where the model’s errors areshown for cells with different numbers of Slovenian speakers. Thetotal number of Slovenian speakers as predicted by the simulationalso agrees with the census data (Fig. S2). Fig. S3 shows the re-siduals (census data minus simulated data). Thus, our model is ableto follow how either language has spread and retreated in the timeperiod 1880–1910.
Extension of the Model Through Habitat Parameters. In a secondstep, for the period from 1880 to 1910, the influence of habitatconditions, such as the influence of urban areas, that is, majortowns, the language of schools, and language in parishes, wasinvestigated. To this end, we introduced a habitat parameter hiinto Eq. 3, which modifies the effect of local speakers by anexponential function with the argument (±Hhi). The multipli-cative factor H indicates the presence (H = 1) or absence (H = 0)of a local habitat condition, that is, H = 1 for the two largesttowns Klagenfurt and Villach or if a bilingual school or Slove-nian parish existed. Otherwise, H is set to zero. The exponentialfunction was chosen as a modifier because it is a simple function,which for small hi adds nhi to the speaker effect if H = 1, whilerecovering the basic model (Eq. 3) if H = 0. We obtain the fol-lowing equation for the probability pα(r, t + 1) of speaking alanguage α at position r and time t + 1:
pαðr, t+ 1Þ
=nαðr, tÞ · expð±HhiÞ+Fαðr, tÞ
nSðr, tÞ · expð+HhiÞ+FSðr, tÞ+ nGðr, tÞ · expð−HhiÞ+FGðr, tÞ.[9]
Optimization was performed as before. Of the three investigatedparameters (urban areas, bilingual schools, and parish language),only that of bilingual schools showed a small influence (Support-ing Information). However, the influence is so small that Fig. 3B
A
B
Fig. 2. Slovenian language area in southern Carinthia for two differentperiods. (A) Percentage of Slovenian speakers in 1910. Schematic of lan-guage front movement between 1880 (orange line) and 1910 (brown line).The language front is shown as the line bordering the cells with more than50% Slovenian speakers each. Black arrow, direction of front movement.Green arrows, areas behind mountain ranges without front movement.(B) Percentage of Slovenian speakers in 1971. No continuous language frontcan be defined.
Prochazka and Vogl PNAS Early Edition | 3 of 5
SOCIALSC
IENCE
SCO
MPU
TERSC
IENCE
S
does not visibly change with the introduction of the bilingual-schools habitat parameter.
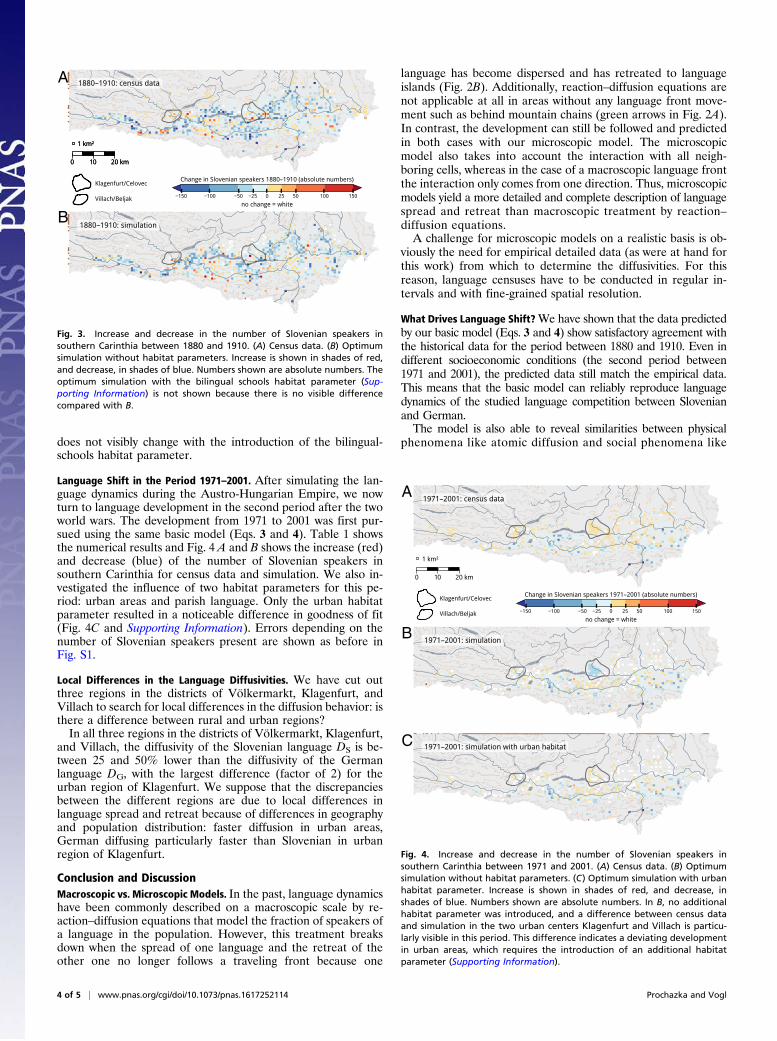
Language Shift in the Period 1971–2001. After simulating the lan-guage dynamics during the Austro-Hungarian Empire, we nowturn to language development in the second period after the twoworld wars. The development from 1971 to 2001 was first pur-sued using the same basic model (Eqs. 3 and 4). Table 1 showsthe numerical results and Fig. 4 A and B shows the increase (red)and decrease (blue) of the number of Slovenian speakers insouthern Carinthia for census data and simulation. We also in-vestigated the influence of two habitat parameters for this pe-riod: urban areas and parish language. Only the urban habitatparameter resulted in a noticeable difference in goodness of fit(Fig. 4C and Supporting Information). Errors depending on thenumber of Slovenian speakers present are shown as before inFig. S1.
Local Differences in the Language Diffusivities. We have cut outthree regions in the districts of Völkermarkt, Klagenfurt, andVillach to search for local differences in the diffusion behavior: isthere a difference between rural and urban regions?In all three regions in the districts of Völkermarkt, Klagenfurt,
and Villach, the diffusivity of the Slovenian language DS is be-tween 25 and 50% lower than the diffusivity of the Germanlanguage DG, with the largest difference (factor of 2) for theurban region of Klagenfurt. We suppose that the discrepanciesbetween the different regions are due to local differences inlanguage spread and retreat because of differences in geographyand population distribution: faster diffusion in urban areas,German diffusing particularly faster than Slovenian in urbanregion of Klagenfurt.
Conclusion and DiscussionMacroscopic vs. Microscopic Models. In the past, language dynamicshave been commonly described on a macroscopic scale by re-action–diffusion equations that model the fraction of speakers ofa language in the population. However, this treatment breaksdown when the spread of one language and the retreat of theother one no longer follows a traveling front because one
language has become dispersed and has retreated to languageislands (Fig. 2B). Additionally, reaction–diffusion equations arenot applicable at all in areas without any language front move-ment such as behind mountain chains (green arrows in Fig. 2A).In contrast, the development can still be followed and predictedin both cases with our microscopic model. The microscopicmodel also takes into account the interaction with all neigh-boring cells, whereas in the case of a macroscopic language frontthe interaction only comes from one direction. Thus, microscopicmodels yield a more detailed and complete description of languagespread and retreat than macroscopic treatment by reaction–diffusion equations.A challenge for microscopic models on a realistic basis is ob-
viously the need for empirical detailed data (as were at hand forthis work) from which to determine the diffusivities. For thisreason, language censuses have to be conducted in regular in-tervals and with fine-grained spatial resolution.
What Drives Language Shift?We have shown that the data predictedby our basic model (Eqs. 3 and 4) show satisfactory agreement withthe historical data for the period between 1880 and 1910. Even indifferent socioeconomic conditions (the second period between1971 and 2001), the predicted data still match the empirical data.This means that the basic model can reliably reproduce languagedynamics of the studied language competition between Slovenianand German.The model is also able to reveal similarities between physical
phenomena like atomic diffusion and social phenomena like
A
B
C
Fig. 4. Increase and decrease in the number of Slovenian speakers insouthern Carinthia between 1971 and 2001. (A) Census data. (B) Optimumsimulation without habitat parameters. (C) Optimum simulation with urbanhabitat parameter. Increase is shown in shades of red, and decrease, inshades of blue. Numbers shown are absolute numbers. In B, no additionalhabitat parameter was introduced, and a difference between census dataand simulation in the two urban centers Klagenfurt and Villach is particu-larly visible in this period. This difference indicates a deviating developmentin urban areas, which requires the introduction of an additional habitatparameter (Supporting Information).
A
B
Fig. 3. Increase and decrease in the number of Slovenian speakers insouthern Carinthia between 1880 and 1910. (A) Census data. (B) Optimumsimulation without habitat parameters. Increase is shown in shades of red,and decrease, in shades of blue. Numbers shown are absolute numbers. Theoptimum simulation with the bilingual schools habitat parameter (Sup-porting Information) is not shown because there is no visible differencecompared with B.
4 of 5 | www.pnas.org/cgi/doi/10.1073/pnas.1617252114 Prochazka and Vogl
language shift: by modeling linguistic interaction as a Gaussianfunction as in models of physical diffusion, we obtain goodagreement between the predicted and the empirical data. Thus,we have illustrated that it is possible to use physical models tosimulate social dynamics on a large scale over time and space.The basic model uses only two parameters to calculate the
probability of speaking a language: the number of speakers in thepreceding year and interaction between speakers. Both of thesecan be directly calculated from census data, ensuring our modelis applicable even in situations where data on other factorsinfluencing language use (e.g., perceived status of a language) isnot available or even possible to obtain. Without interaction (i.e.,using only the number of speakers), the probability of speaking alanguage (Eq. 3) remains constant. Consequently, interactionwith other speakers is an essential drive for the linguistic changein each cell. This point has been argued by linguists (27) and isvalidated by our simulation. The number of speakers of a lan-guage in the population units (hamlets, villages, towns) neigh-boring the given cell is therefore an important influence onlanguage dynamics. This means that a minimum-sized neigh-borhood of speakers of the minority language interacting witheach other is necessary to preserve the language.In addition, the simulation shows that other habitat conditions
(the language of schools, and in parishes) are of minor influence.There is, however, a noticeable effect of urban areas, which havetheir own dynamics: between 1880 and 1910, Slovenian decaysslightly faster in the larger towns than predicted by the basicmodel; between 1971 and 2001, the development is reversed,that is, the number of Slovenian speakers increases at a higherrate in large towns than predicted by the basic model (Supporting
Information). This reverse in development might be attributed tolanguage playing a larger role in people’s identity in an in-creasingly mobile society (after 1971) compared with a largelyrural society (as between 1880 and 1910). When language makesup a larger part of one’s identity, there might be a higher ten-dency to preserve or revive it. This preservation happens, forexample, through language associations and cultural clubs, whichcommonly originate in large towns and consequently have theirlargest impact there (3). With our model, it is possible to followthese different local developments and quantify the strength oftheir influence.As interaction is the driving force for linguistic change in our
model, it also offers a tool for possible future work on how in-teraction shapes language use: what happens when the interactionwith speakers of the same language is considerably higher than theinteraction with speakers of a different language? How much in-teraction with the same language (vs. interaction with a differentlanguage) is needed for the preservation of the minority language?
ACKNOWLEDGMENTS. We thank A. Gehart and W. Zöllner as well asA. Bauer (Statistics Austria) and P. Ibounig (Department of Statistics, Govern-ment of the State of Carinthia) for providing census data. We also thank theKlagenfurt University Library and the Archive of the Roman Catholic Dioceseof Gurk-Klagenfurt for access to data about bilingual schools and parishlanguage. Discussions with M. Glauninger (Department of German Studies,University of Vienna/Austrian Centre for Digital Humanities, Austrian Acad-emy of Sciences) are gratefully acknowledged. We thank C. Dellago forcritical comments on the manuscript. The geographical data (shapefiles)used for the figure backgrounds and contour lines are provided by LandKärnten (https://www.data.gv.at/auftritte/?organisation=land-kaernten) un-der a CC-BY-3.0 license. Diverging color scale is based on www.ColorBrewer.org.K.P. is supported by a uni:docs fellowship from the University of Vienna.
1. UNESCO Ad Hoc Expert Group on Endangered Languages (2003) Language Vitalityand Endangerment. Available at unesdoc.unesco.org/images/0018/001836/183699E.pdf. Accessed January 16, 2017.
2. Weinreich U (1953) Languages in Contact (Linguistic Circle of New York, New York).3. Tsunoda T (2005) Language Endangerment and Language Revitalization. An
Introduction (Mouton, Berlin).4. Amano T, et al. (2014) Global distribution and drivers of language extinction risk. Proc
Biol Sci 281(1793):20141574.5. Nettle D (1998) Explaining global patterns of language diversity. J Anthropol Archaeol 17:
354–374.6. Schulze C, Stauffer D, Wichmann S (2008) Birth, survival and death of languages by
Monte Carlo simulation. Commun Comput Phys 3:271–294.7. Kandler A (2009) Demography and language competition. Hum Biol 81(2-3):181–210.8. Zhang M, Gong T (2013) Principles of parametric estimation in modeling language
competition. Proc Natl Acad Sci USA 110(24):9698–9703.9. Hegselmann R (1996) Understanding social dynamics: The cellular automata ap-
proach. Social Science Microsimulation, eds Troitzsch KG, Mueller U, Gilbert N,Doran JE (Springer, New York), pp 282–306.
10. Gilbert N (2008) Agent-Based Models (Sage, Los Angeles).11. Busch B (2001) Slovenian in Carinthia—a sociolinguistic survey. The Other Languages
of Europe: Demographic, Sociolinguistic and Educational Perspectives, eds Extra G,Gorter D (Multilingual Matters, Clevedon, UK), pp 119–137.
12. Abrams DM, Strogatz SH (2003) Linguistics: Modelling the dynamics of languagedeath. Nature 424(6951):900.
13. Patriarca M, Leppänen T (2004) Modeling language competition. Physica A 338:296–299.
14. Patriarca M, Heinsalu E (2009) Influence of geography on language competition.Physica A 388:174–186.
15. Kandler A, Steele J (2008) Ecological models of language competition. Biol Theory3:164–173.
16. Kandler A, Unger R, Steele J (2010) Language shift, bilingualism and the future ofBritain’s Celtic languages. Philos Trans R Soc Lond B Biol Sci 365(1559):3855–3864.
17. Walters CE (2014) A reaction–diffusion model for competing languages. Meccanica49:2189–2206.
18. Fort J, Pérez-Losada J (2012) Front speed of language replacement. Hum Biol 84(6):755–772.
19. Isern N, Fort J (2014) Language extinction and linguistic fronts. J R Soc Interface11(94):20140028.
20. Murray JD (1996) Mathematical Biology I: An Introduction (Springer, New York).21. Fisher RA (1937) The wave of advance of advantageous genes. Ann Eugen 7:353–369.
22. Imperial-Royal Central Statistical Commission (1883) Special Orts-Repertorien der imÖsterreichischen Reichsrathe Vertretenen Königreiche und Länder. V. Kärnten [SpecialVillage Registers of the Kingdoms and Lands Represented in the Austrian ImperialCouncil. V. Carinthia] (k.k. Staatsdruckerei, Vienna). German.
23. Imperial-Royal Central Statistical Commission (1894) Special Orts-Repertorien der imÖsterreichischen Reichsrathe Vertretenen Königreiche und Länder. Neubearbeitungauf Grund der Ergebnisse der Volkszählung vom 31. December 1890. V. Kärnten[Special Village Registers of the Kingdoms and Lands Represented in the AustrianImperial Council. Revised Edition According to the Results of the Census of December31, 1890. V. Carinthia] (k.k. Staatsdruckerei, Vienna). German.
24. Imperial-Royal Central Statistical Commission (1905) Gemeindelexikon der im Reichsratevertretenen Königreiche und Länder, Bearbeitet auf Grund der Ergebnisse der Volks-zählung vom 31. Dezember 1900. V. Kärnten [Municipality Reference Book of theKingdoms and Lands Represented in the Imperial Council, Revised According to theResults of the Census of December 31, 1900. V. Carinthia] (k.k. Staatsdruckerei, Vienna).German.
25. Central Statistical Commission (1918) Spezialortsrepertorium der ÖsterreichischenLänder. Bearbeitet auf Grund der Ergebnisse der Volkszählung vom 31. Dezember1910. V. Kärnten [Special Village Register of the Austrian Lands. Revised According tothe Results of the Census of December 31, 1910. V. Carinthia] (Verlag der Staats-druckerei, Vienna). German.
26. Nelder J, Mead R (1965) A simplex-method for function minimization. ComputJ 7:308–313.
27. Lieberson S (1982) Forces affecting language spread: Some basic propositions.Language Spread: Studies in Diffusion and Social Change, ed Cooper RL (Indiana UnivPress, Bloomington, IN), pp 37–62.
28. Fishman J (1972) The Sociology of Language (Newbury House, Rowley, MA).29. Kurz M (1990) Zur Lage der Slowenen in Kärnten. Der Streit um die Volksschule in
Kärnten (1867–1914) [Concerning the Situation of Slovenes in Carinthia. The DisputeAbout Elementary Schools in Carinthia (1867–1914)] (Kärntner Landesarchiv, Kla-genfurt, Austria). German.
30. Anonymous (1881) Lehrer-Kalender und Schematismus des Sämmtlichen Lehrperso-nales der Volksschulen in Kärnten 1881 [Teachers’ Calendar and Schematism of theComplete Teaching Staff in Elementary Schools in Carinthia in 1881] (Bertschinger,Klagenfurt, Austria). German.
31. Veiter T (1936) Die Slowenische Volksgruppe in Kärnten. Geschichte, Rechtslage,Problemstellung [The Slovenian Ethnic Group in Carinthia. History, Legal Status,Problems] (Reinhold-Verlag, Vienna). German.
32. Catholic Church Diocese Gurk (1880) Geistlicher Personalstand der Diözese Gurk imJahre 1880 [List of Clerical Personnel in the Diocese Gurk in the Year 1880] (Verlag derSt. Gurker Ordinariatskanzlei, Klagenfurt, Austria). German.
Prochazka and Vogl PNAS Early Edition | 5 of 5
SOCIALSC
IENCE
SCO
MPU
TERSC
IENCE
S
Supporting InformationProchazka and Vogl 10.1073/pnas.1617252114Language Front VelocityTo measure front velocity per year for the period 1880 (t1) to1910 (t2) directly from the census data (Fig. 2A), we horizontallydivide the language front into n points. For each point Pi of thelanguage front, we then determine the north–south differencebetween its two positions Pi(t1) and Pi(t2). The difference be-tween points is divided by the number of years between 1880 and1910:
v=Xni=1
Piðt2Þ−Piðt1Þ30n
. [S1]
This measured velocity can then be compared with the velocityof the traveling front (Eq. 2) resulting from the reaction–dif-fusion equation (Eq. 1). For calculating the velocity from Eq.2, we use the diffusivity DG deduced from the fits (Table 1)and the language conversion rate k derived from the originalcensus data.To obtain the language conversion rate k, we use census data
from 1880 (t1) and 1910 (t2) and calculate the fraction uG ofGerman speakers in the population. For pure growth (diffusionterm in Eq. 1 neglected) and dividing by the number of yearsbetween 1880 and 1910, k becomes the following:
k=uGðt2Þ− uGðt1ÞuG ·
�1− uG
��30, [S2]
where uG is the average between uG(t1) and uG(t2). In 1880, therewere 102,314 German and 85,369 Slovenian speakers in southernCarinthia. In 1910, there were 154,361 German and 65,352 Slo-venian speakers in southern Carinthia. Assuming the error incensus data to be 10%, we obtain k = 0.0224 ± 0.0065/y.Results are given in Table S1. We see that the velocity cal-
culated from the reaction–diffusion equation (Eq. 2) is con-siderably higher than the velocity derived from the census data.This is due to the fact that the velocity derived from census dataaverages over the whole area. However, there is no movementof the language front where the minority region bordersunpopulated areas as is the case in large parts of the minorityregion (Fig. 2A), whereas reaction–diffusion equations assumethat there is a moving language front everywhere. This showsan important limitation of treatment by reaction–diffusionequations: reaction–diffusion equations are not applicablein the absence of “pressure” from a region consisting mainlyof speakers of the majority language, which leads to frontmovement.
Extension of the Model Through Habitat ParametersTo describe external influences such as larger towns, schools, orparishes, we introduced a habitat parameter hi into Eq. 3 (see Eq.9), which modifies the effect of local speakers as follows:
nαðr, tÞ↦nαðr, tÞ · expð±HhiÞ. [S3]
We assume that the effect is symmetrical, that is, if the effect onSlovenian speakers is given by nS · expð+HhiÞ, then the effect onGerman speakers is given by nG · expð−HhiÞ. In the presence ofan external influence i, H is set to 1 and the coefficient hi givesthe strength of influence. In cells without an external influence,H = 0 and Eq. 3 is recovered. The exponential function was
chosen as a modifier because it is a simple function that for smallhi adds nhi to the speaker effect if H = 1, while recovering thebasic model (Eq. 3) if H = 0.
Urban CentersLanguage change patterns differ depending on whether the en-vironment is rural or urban. Fishman (28) argues that speakers inan urban area are typically more likely to shift from the minorityto the majority language, whereas the inhabitants of isolated ruralareas resist language shift. Movement to larger urban agglom-erations therefore increases the risk of giving up the minoritylanguage in favor of the majority language.This development is marginally noticeable in the period from
1880 to 1910 for the two largest towns Klagenfurt and Villach. Inthese two towns, the number of Slovenian speakers decreasesslightly faster than the basic model (Eqs. 3 and 4) predicts. Aninteresting phenomenon appears between 1971 and 2001 whenloss of minority language by moving to urban centers is reversed:the number of Slovenian speakers now definitely increases fasterin urban centers than predicted by the basic model. These lo-calized developments can be captured by our model by in-troducing a parameter h1 and setting H = 1 in the largest townsfor each period (Klagenfurt and Villach).Best fit for the period from 1971 to 2001 is provided by h1 =
0.025 ± 0.005. h1 is positive for this period, which means thatSlovenian speakers have more impact (Eq. S3). The model withthis urban habitat parameter better describes the actual data inthese urban centers in the sense that it better reproduces thedirection of change, that is, decrease or increase.The difference in Fig. 4C between the outskirts and inner cells
of the city of Klagenfurt is a result of the model dynamics: Theouter cells have populated neighbor cells only on one sidewhereas the inner cells are completely surrounded by populatedcells. Introducing a habitat condition h increases the probabilityof speaking Slovenian in the outer cells compared to the modelwithout habitat. On the contrary, in the inner cells the effect ofh is compensated by interaction (F) with German speakers inthe neighboring cells and the increase in Slovenian speakers isnot as strong. This color difference would vanish for largervalues of h.
Bilingual SchoolsBetween 1880 and 1910, so-called utraquistic elementary schoolswere meant to teach pupils in both languages (29). In 1880, theseschools existed in 83 population units (villages and towns) in thebilingual region of southern Carinthia (30). We examinedwhether in these villages and towns (H = 1) the Slovenian lan-guage was preferentially preserved compared with localitieswhere no such school existed.Best fit for the period between 1880 and 1910 was achieved with
h2 = −0.0224 ± 0.0050. From Eq. S3, it follows that the presenceof an utraquistic school decreases the impact of existing Slove-nian speakers.After World War II the bilingual instruction system in the
elementary schools was repeatedly changed and unfortunately nodetailed data are available on howmany pupils attended classes inSlovenian language.
ParishesIn villages with a Slovenian majority from 1880 to 1910, mostlySlovenian native-language speakers were hired as priests (31).They read the mass in Slovenian language. Altogether, there
Prochazka and Vogl www.pnas.org/cgi/content/short/1617252114 1 of 4
were 98 Slovenian-language parishes in the bilingual region insouthern Carinthia in 1880 (32). We examined the influence ofthese parishes on the development of Slovenian by applying thesame procedure as for the schools: H = 1 in villages or townswith masses in Slovenian, else H = 0. Neither in the first nor inthe second period we could find a substantial influence ofSlovenian-language parishes on the probability of speakingSlovenian.
Evaluating Model PerformanceTo evaluate model performance, a baseline for comparison ishelpful. As a baseline, we use an interaction free model (Fα = 0),which means that the fraction of speakers of either languageremains constant, speakers being lost or gained only throughchanging population size. To check if our model is better thanthe baseline, we use three metrics:
i) The total number of Slovenian speakers in the last year ofeach period as calculated by the model, which should beclose to the real number.
ii) Root-mean-square error (RMSE), which is related to OLS(Eq. 7). The RMSE gives the mean error per cell per 30 y inspeakers, which should be low:
RMSE=
ffiffiffiffiffiffiffiffiffiffiffiffiffiffiffiffiffiffiffiffiffiffiffiffiffiffiffiffiffiffiffiffi1n
Xni=1
ðOi −EiÞ2s
, [S4]
where Oi is an observed data point (census data), Ei is anestimated data point (simulated data), and n is the numberof populated cells.
iii) Mean absolute error (MAE), which is related to LAE (Eq.8). The MAE is the sum of absolute errors divided by thenumber of cells n, which should also be low:
MAE=1n
Xni=1
jOi −Eij. [S5]
For both errors, the result of the simulation after 30 y is comparedwith the census data at the end of each 30-y period. Results aregiven in Table S2, indicating that the model with interaction (andoptionally with habitat parameters) consistently leads to a betterfit than the baseline. Note that RMSE and MAE average over allcells. A more detailed look into the model’s error per category/number of speakers in a cell is given below.
Reliability of the Model per CategoryFig. S1 shows two measures of the model’s reliability: the MAE(Eq. S5) per category and grid cell and the relative error percategory. To gain insight into where the model works best, weshow the error per category to differentiate between cells withdifferent numbers of Slovenian speakers. Both errors are givenper 30 y, that is, the error in the result of the simulation after 30 ycompared with the census data at the end of each 30-y period.The relative error is given by the sum of absolute errors divided
by the sum of the number of Slovenian speakers in this category:
relative error=Xni=1
jOi −Eij,Xn
i=1
Si, [S6]
where Si is the number of Slovenian speakers per grid cell,summed over the n grid cells in this category.
Total Sum of Slovenian SpeakersFig. S2 shows the total sum of speakers of either languageaccording to all eight censuses in both periods (1880, 1890, 1900,1910, and 1971, 1981, 1991, 2001) in comparison with the sim-ulated data. The agreement is satisfactory.
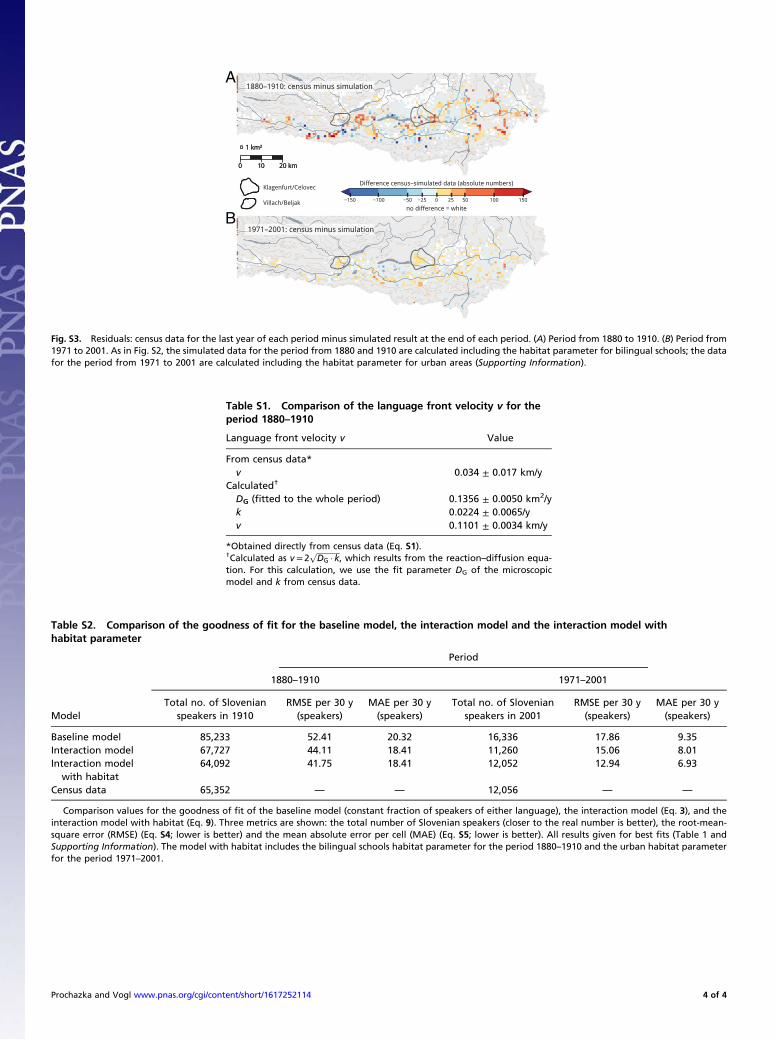
Deviation of Simulated Data from Census Data over SpaceFig. S3 shows the residuals for the two periods (census dataminus simulated data). Evident deviations in period 1 find theirexplanation in extraordinary outliers in the census data: somevillages switched from a strong German-speaking majority to astrong Slovenian-speaking majority. The same also happened inthe opposite direction. Both of these developments are verydifferent from the average trend in southern Carinthia, whichwas a moderate transformation from Slovenian speaking toGerman speaking. In addition, several villages “flip-flopped”from one census to the next, changing from a German-speakingmajority to a Slovenian-speaking majority and then back to aGerman-speaking majority and back again to a Slovenian-speaking majority in the last census of the period. This be-havior, which seemed to be influenced by local politics ratherthan actual language use changes, cannot be captured by ourmodel. The residuals thus show where language spread andretreat deviates from “average” development and open uppossibilities for further research: what were the reasons forthese deviations? Can these reasons—which might be identifiedonly by sociologically focused research—be integrated into themodel as a habitat factor?
Prochazka and Vogl www.pnas.org/cgi/content/short/1617252114 2 of 4
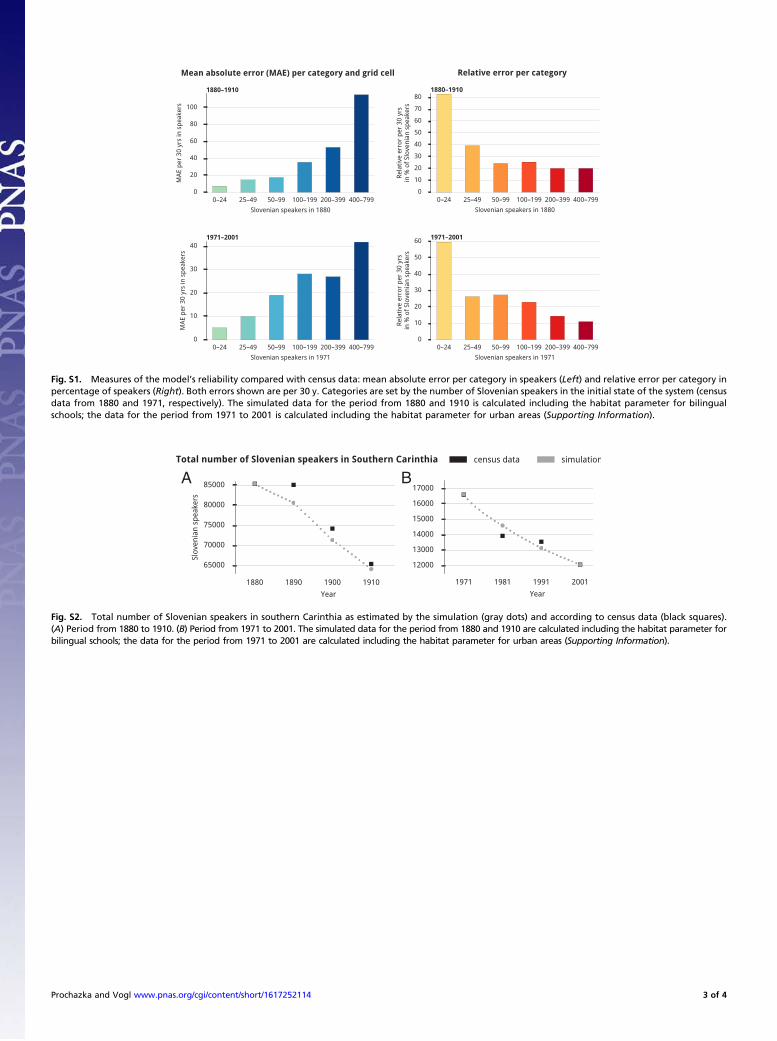
Fig. S1. Measures of the model’s reliability compared with census data: mean absolute error per category in speakers (Left) and relative error per category inpercentage of speakers (Right). Both errors shown are per 30 y. Categories are set by the number of Slovenian speakers in the initial state of the system (censusdata from 1880 and 1971, respectively). The simulated data for the period from 1880 and 1910 is calculated including the habitat parameter for bilingualschools; the data for the period from 1971 to 2001 is calculated including the habitat parameter for urban areas (Supporting Information).
BA
Fig. S2. Total number of Slovenian speakers in southern Carinthia as estimated by the simulation (gray dots) and according to census data (black squares).(A) Period from 1880 to 1910. (B) Period from 1971 to 2001. The simulated data for the period from 1880 and 1910 are calculated including the habitat parameter forbilingual schools; the data for the period from 1971 to 2001 are calculated including the habitat parameter for urban areas (Supporting Information).
Prochazka and Vogl www.pnas.org/cgi/content/short/1617252114 3 of 4
A
B
Fig. S3. Residuals: census data for the last year of each period minus simulated result at the end of each period. (A) Period from 1880 to 1910. (B) Period from1971 to 2001. As in Fig. S2, the simulated data for the period from 1880 and 1910 are calculated including the habitat parameter for bilingual schools; the datafor the period from 1971 to 2001 are calculated including the habitat parameter for urban areas (Supporting Information).
Table S1. Comparison of the language front velocity v for theperiod 1880–1910
Language front velocity v Value
From census data*v 0.034 ± 0.017 km/y
Calculated†
DG (fitted to the whole period) 0.1356 ± 0.0050 km2/yk 0.0224 ± 0.0065/yv 0.1101 ± 0.0034 km/y
*Obtained directly from census data (Eq. S1).†Calculated as v = 2
ffiffiffiffiffiffiffiffiffiffiffiffiDG ·k
p, which results from the reaction–diffusion equa-
tion. For this calculation, we use the fit parameter DG of the microscopicmodel and k from census data.
Table S2. Comparison of the goodness of fit for the baseline model, the interaction model and the interaction model withhabitat parameter
Period
1880–1910 1971–2001
ModelTotal no. of Slovenian
speakers in 1910RMSE per 30 y
(speakers)MAE per 30 y(speakers)
Total no. of Slovenianspeakers in 2001
RMSE per 30 y(speakers)
MAE per 30 y(speakers)
Baseline model 85,233 52.41 20.32 16,336 17.86 9.35Interaction model 67,727 44.11 18.41 11,260 15.06 8.01Interaction model
with habitat64,092 41.75 18.41 12,052 12.94 6.93
Census data 65,352 — — 12,056 — —
Comparison values for the goodness of fit of the baseline model (constant fraction of speakers of either language), the interaction model (Eq. 3), and theinteraction model with habitat (Eq. 9). Three metrics are shown: the total number of Slovenian speakers (closer to the real number is better), the root-mean-square error (RMSE) (Eq. S4; lower is better) and the mean absolute error per cell (MAE) (Eq. S5; lower is better). All results given for best fits (Table 1 andSupporting Information). The model with habitat includes the bilingual schools habitat parameter for the period 1880–1910 and the urban habitat parameterfor the period 1971–2001.
Prochazka and Vogl www.pnas.org/cgi/content/short/1617252114 4 of 4