quality counts - education week
TRANSCRIPT
State Highlights 2013
Arizona
State Highlights 2014
A Special Supplement to Education Week’s
QUALITY COUNTS 2014
District Disruption & Revival
School Systems Reshape to
Compete and Improve
Arizona – State Highlights 2014
Education Week Research Center ▪ www.edweek.org/rc
Arizona—State Highlights 2014 A special supplement to Education Week’s Quality Counts 2014 District Disruption and Revival: School Systems Reshape to Compete and Improve Copyright © 2014 by Editorial Projects in Education Inc. All rights reserved. No part of this publication shall be reproduced, stored in a retrieval system, or transmitted by any means, electronic or otherwise, without the written permission of the copyright holder. Readers may make up to 5 print copies of this publication at no cost for personal noncommercial use, provided that each copy includes a full citation of the source. Visit www.edweek.org/go/copies for information about additional print photocopies. Published by: Editorial Projects in Education Inc. 6935 Arlington Road, Suite 100 Bethesda, MD 20814 Phone: (301) 280-3100 www.edweek.org
Arizona – State Highlights 2014
Education Week Research Center ▪ www.edweek.org/rc 1
About this Report
The 18th annual edition of Education Week’s Quality Counts continues the tradition of tracking key education indicators and grading the states on their performance and outcomes. This year’s report also focuses on school district governance and operations as its special theme, examining the impact of the increasingly complex fiscal, political, and technological forces that are challenging school districts and prompting efforts to cope with new pressures. Education Week journalists take an in-depth look at the prominent developments—including school choice initiatives, district mergers, and federal policy shifts—transforming the traditional environment for education governance. To complement the report’s journalism, the Education Week Research Center conducted an original survey of school district administrators, who shared their insights and opinions on factors influencing governance and operations in their systems, high-profile reform options, and non-traditional schooling models. Highlights of the study are featured in the report.
This year’s report also features newly updated 50-state information on results in three of the areas monitored by the report on an ongoing basis as part of Quality Counts’ State of the States framework: the Chance for Success Index; the K-12 Achievement Index; and school finance. To provide a comprehensive perspective on state policy and performance, the 2014 State Highlights Reports integrate updated findings for 2014 with policy data from previous editions of Quality Counts. Those policy categories include data for: standards, assessments, and accountability; the teaching profession; and transitions and alignment. Most of the indicators that appear in Quality Counts are based on original analyses and state-survey data from the Education Week Research Center, supplemented by information published by other organizations. Overall findings from Quality Counts show that some states perform consistently well or poorly across the full range of graded categories. However, a closer examination of the results reveals that most states post a strong showing in at least one area. This suggests that while broad evaluations of state rankings and performance can be useful, a deeper reading of the results presented in this State Highlights Report will provide a more nuanced perspective on the educational condition of the nation and the states.
Education Week Research Center January 2014
About Editorial Projects in Education
Editorial Projects in Education (EPE) is a nonprofit, tax-exempt organization based in Bethesda, Md. Its primary mission is
to help raise the level of awareness and understanding among professionals and the public of important issues in American education. EPE covers local, state, national, and international news and issues from preschool through the 12th grade. Editorial Projects in Education publishes Education Week, America’s newspaper of record for precollegiate education, the online Teacher, Digital Directions, and Industry & Innovation channels, and the TopSchoolJobs employment resource. It also produces periodic special reports on issues ranging from technology to textbooks, as well as books of special interest to educators.
The Education Week Research Center conducts policy surveys, collects data, and performs analyses that appear in
Education Week and its special reports—Quality Counts, Technology Counts, and Diplomas Count. The center also conducts independent research studies and maintains the Education Counts and EdWeek Maps online data resources.
Arizona – State Highlights 2014
Education Week Research Center ▪ www.edweek.org/rc 2
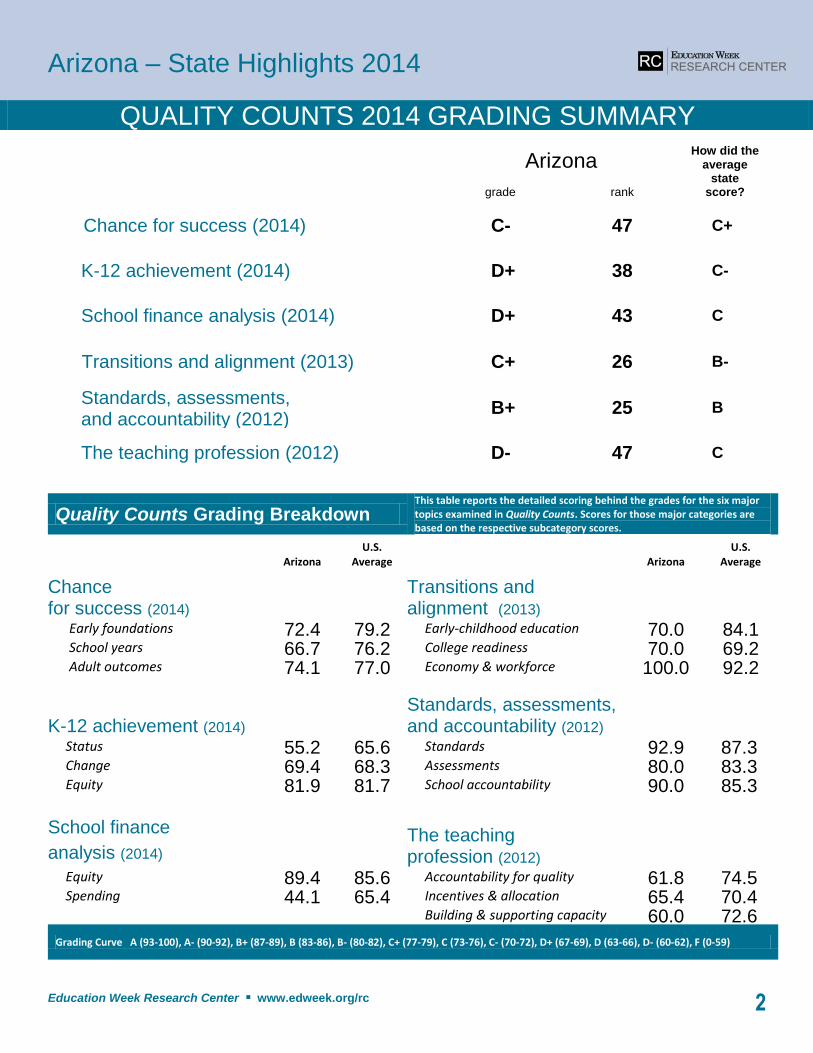
Quality Counts Grading Breakdown This table reports the detailed scoring behind the grades for the six major topics examined in Quality Counts. Scores for those major categories are based on the respective subcategory scores.
Arizona U.S.
Average
Arizona U.S.
Average
Chance for success (2014)
Transitions and alignment (2013)
Early foundations 72.4 79.2 Early-childhood education 70.0 84.1 School years 66.7 76.2 College readiness 70.0 69.2 Adult outcomes 74.1 77.0 Economy & workforce 100.0 92.2
K-12 achievement (2014) Standards, assessments,
and accountability (2012)
Status 55.2 65.6 Standards 92.9 87.3 Change 69.4 68.3 Assessments 80.0 83.3 Equity 81.9 81.7 School accountability 90.0 85.3
School finance
analysis (2014) The teaching
profession (2012)
Equity 89.4 85.6 Accountability for quality 61.8 74.5 Spending 44.1 65.4 Incentives & allocation 65.4 70.4
Building & supporting capacity 60.0 72.6
Grading Curve A (93-100), A- (90-92), B+ (87-89), B (83-86), B- (80-82), C+ (77-79), C (73-76), C- (70-72), D+ (67-69), D (63-66), D- (60-62), F (0-59)
QUALITY COUNTS 2014 GRADING SUMMARY
Arizona
How did the average
state score? grade rank
Chance for success (2014) C- 47 C+
K-12 achievement (2014) D+ 38 C-
School finance analysis (2014) D+ 43 C
Transitions and alignment (2013) C+ 26 B-
Standards, assessments, and accountability (2012)
B+ 25 B
The teaching profession (2012) D- 47 C
Arizona – State Highlights 2014
Education Week Research Center ▪ www.edweek.org/rc 3
Perspectives on a Changing Landscape
A range of powerful factors—including economic, political, and technological forces—are prompting changes in school system operations and in traditional models of education governance across the nation. District administrators are often charged with navigating this evolving environment. To gauge attitudes toward prominent management challenges and reform options, the Education Week Research Center conducted an online survey of more than 450 district administrators who are registered users of edweek.org, the Education Week website. The results provide a window into education leaders’ perspectives on important developments in district governance and operations.
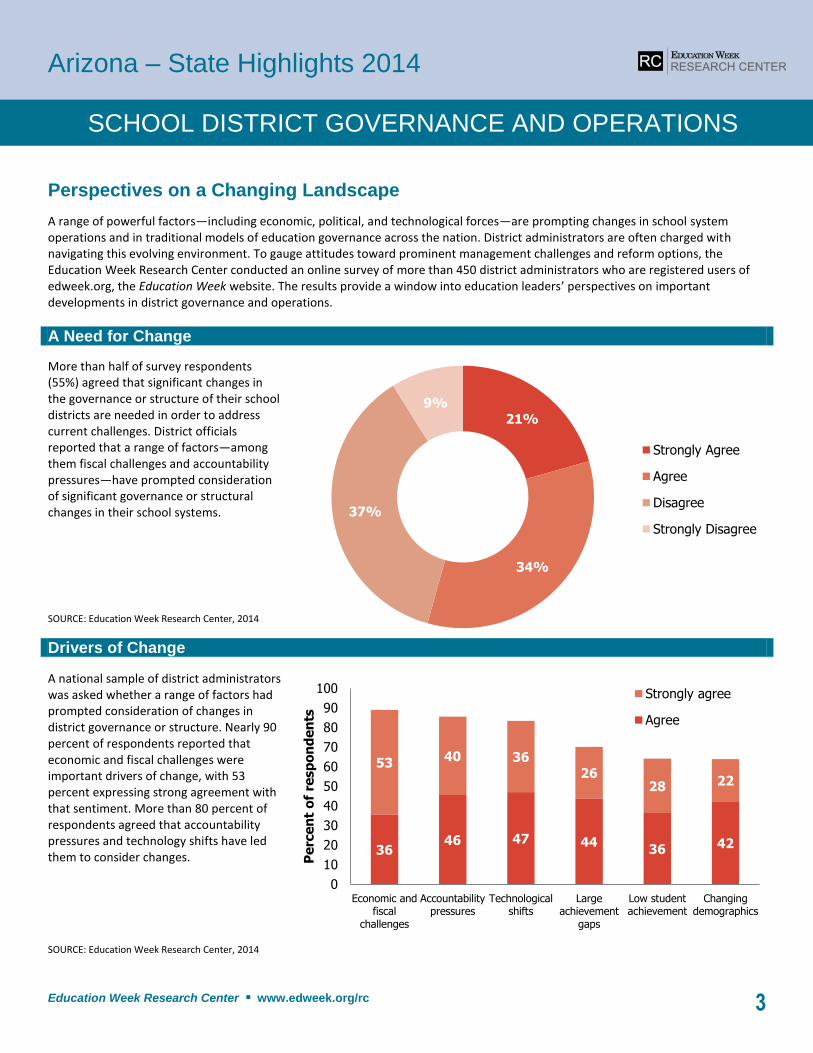
A Need for Change
More than half of survey respondents (55%) agreed that significant changes in the governance or structure of their school districts are needed in order to address current challenges. District officials reported that a range of factors—among them fiscal challenges and accountability pressures—have prompted consideration of significant governance or structural changes in their school systems. SOURCE: Education Week Research Center, 2014
Drivers of Change
A national sample of district administrators was asked whether a range of factors had prompted consideration of changes in district governance or structure. Nearly 90 percent of respondents reported that economic and fiscal challenges were important drivers of change, with 53 percent expressing strong agreement with that sentiment. More than 80 percent of respondents agreed that accountability pressures and technology shifts have led them to consider changes. SOURCE: Education Week Research Center, 2014
SCHOOL DISTRICT GOVERNANCE AND OPERATIONS
21%
34%
37%
9%
Strongly Agree
Agree
Disagree
Strongly Disagree
3646 47 44
36 42
53 40 36
2628 22
0
10
20
30
40
50
60
70
80
90
100
Economic andfiscal
challenges
Accountabilitypressures
Technologicalshifts
Largeachievement
gaps
Low studentachievement
Changingdemographics
Pe
rce
nt
of
resp
on
de
nts
Strongly agree
Agree
Arizona – State Highlights 2014
Education Week Research Center ▪ www.edweek.org/rc 4
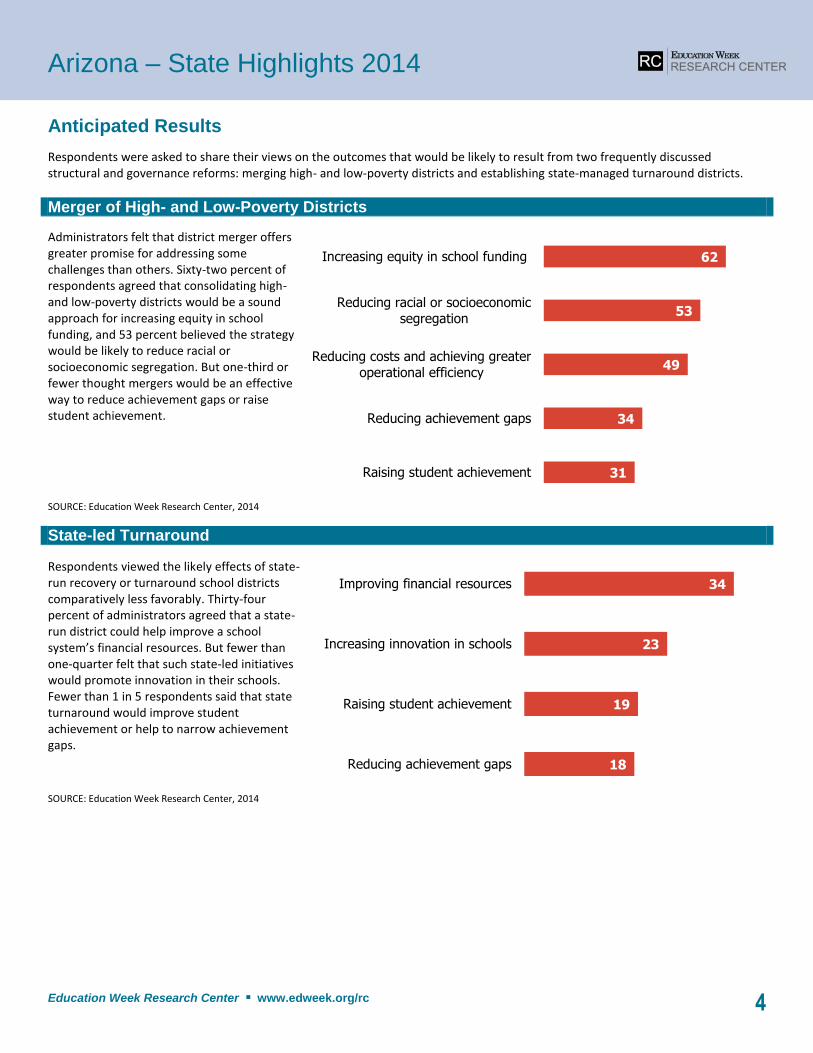
Anticipated Results
Respondents were asked to share their views on the outcomes that would be likely to result from two frequently discussed structural and governance reforms: merging high- and low-poverty districts and establishing state-managed turnaround districts.
Merger of High- and Low-Poverty Districts
Administrators felt that district merger offers greater promise for addressing some challenges than others. Sixty-two percent of respondents agreed that consolidating high- and low-poverty districts would be a sound approach for increasing equity in school funding, and 53 percent believed the strategy would be likely to reduce racial or socioeconomic segregation. But one-third or fewer thought mergers would be an effective way to reduce achievement gaps or raise student achievement. SOURCE: Education Week Research Center, 2014
State-led Turnaround
Respondents viewed the likely effects of state-run recovery or turnaround school districts comparatively less favorably. Thirty-four percent of administrators agreed that a state-run district could help improve a school system’s financial resources. But fewer than one-quarter felt that such state-led initiatives would promote innovation in their schools. Fewer than 1 in 5 respondents said that state turnaround would improve student achievement or help to narrow achievement gaps. SOURCE: Education Week Research Center, 2014
31
34
49
53
62
Raising student achievement
Reducing achievement gaps
Reducing costs and achieving greater
operational efficiency
Reducing racial or socioeconomic
segregation
Increasing equity in school funding
18
19
23
34
Reducing achievement gaps
Raising student achievement
Increasing innovation in schools
Improving financial resources
Arizona – State Highlights 2014
Education Week Research Center ▪ www.edweek.org/rc 5
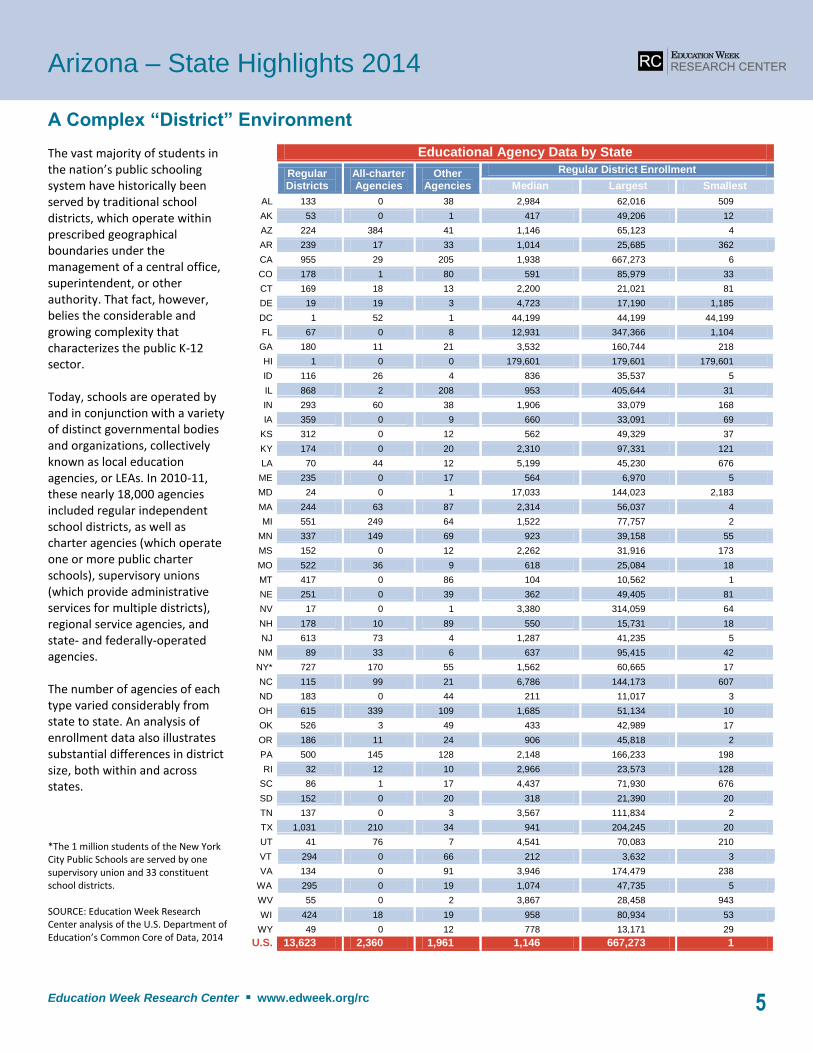
A Complex “District” Environment
The vast majority of students in the nation’s public schooling system have historically been served by traditional school districts, which operate within prescribed geographical boundaries under the management of a central office, superintendent, or other authority. That fact, however, belies the considerable and growing complexity that characterizes the public K-12 sector. Today, schools are operated by and in conjunction with a variety of distinct governmental bodies and organizations, collectively known as local education agencies, or LEAs. In 2010-11, these nearly 18,000 agencies included regular independent school districts, as well as charter agencies (which operate one or more public charter schools), supervisory unions (which provide administrative services for multiple districts), regional service agencies, and state- and federally-operated agencies. The number of agencies of each type varied considerably from state to state. An analysis of enrollment data also illustrates substantial differences in district size, both within and across states.
*The 1 million students of the New York City Public Schools are served by one supervisory union and 33 constituent school districts. SOURCE: Education Week Research Center analysis of the U.S. Department of Education’s Common Core of Data, 2014
Educational Agency Data by State
Regular Districts
All-charter Agencies
Other Agencies
Regular District Enrollment
Median Largest Smallest
AL 133 0 38 2,984 62,016 509
AK 53 0 1 417 49,206 12
AZ 224 384 41 1,146 65,123 4
AR 239 17 33 1,014 25,685 362
CA 955 29 205 1,938 667,273 6
CO 178 1 80 591 85,979 33
CT 169 18 13 2,200 21,021 81
DE 19 19 3 4,723 17,190 1,185
DC 1 52 1 44,199 44,199 44,199
FL 67 0 8 12,931 347,366 1,104
GA 180 11 21 3,532 160,744 218
HI 1 0 0 179,601 179,601 179,601
ID 116 26 4 836 35,537 5
IL 868 2 208 953 405,644 31
IN 293 60 38 1,906 33,079 168
IA 359 0 9 660 33,091 69
KS 312 0 12 562 49,329 37
KY 174 0 20 2,310 97,331 121
LA 70 44 12 5,199 45,230 676
ME 235 0 17 564 6,970 5
MD 24 0 1 17,033 144,023 2,183
MA 244 63 87 2,314 56,037 4
MI 551 249 64 1,522 77,757 2
MN 337 149 69 923 39,158 55
MS 152 0 12 2,262 31,916 173
MO 522 36 9 618 25,084 18
MT 417 0 86 104 10,562 1
NE 251 0 39 362 49,405 81
NV 17 0 1 3,380 314,059 64
NH 178 10 89 550 15,731 18
NJ 613 73 4 1,287 41,235 5
NM 89 33 6 637 95,415 42
NY* 727 170 55 1,562 60,665 17
NC 115 99 21 6,786 144,173 607
ND 183 0 44 211 11,017 3
OH 615 339 109 1,685 51,134 10
OK 526 3 49 433 42,989 17
OR 186 11 24 906 45,818 2
PA 500 145 128 2,148 166,233 198
RI 32 12 10 2,966 23,573 128
SC 86 1 17 4,437 71,930 676
SD 152 0 20 318 21,390 20
TN 137 0 3 3,567 111,834 2
TX 1,031 210 34 941 204,245 20
UT 41 76 7 4,541 70,083 210
VT 294 0 66 212 3,632 3
VA 134 0 91 3,946 174,479 238
WA 295 0 19 1,074 47,735 5
WV 55 0 2 3,867 28,458 943
WI 424 18 19 958 80,934 53
WY 49 0 12 778 13,171 29
U.S. 13,623 2,360 1,961 1,146 667,273 1
Arizona – State Highlights 2014
Education Week Research Center ▪ www.edweek.org/rc 6
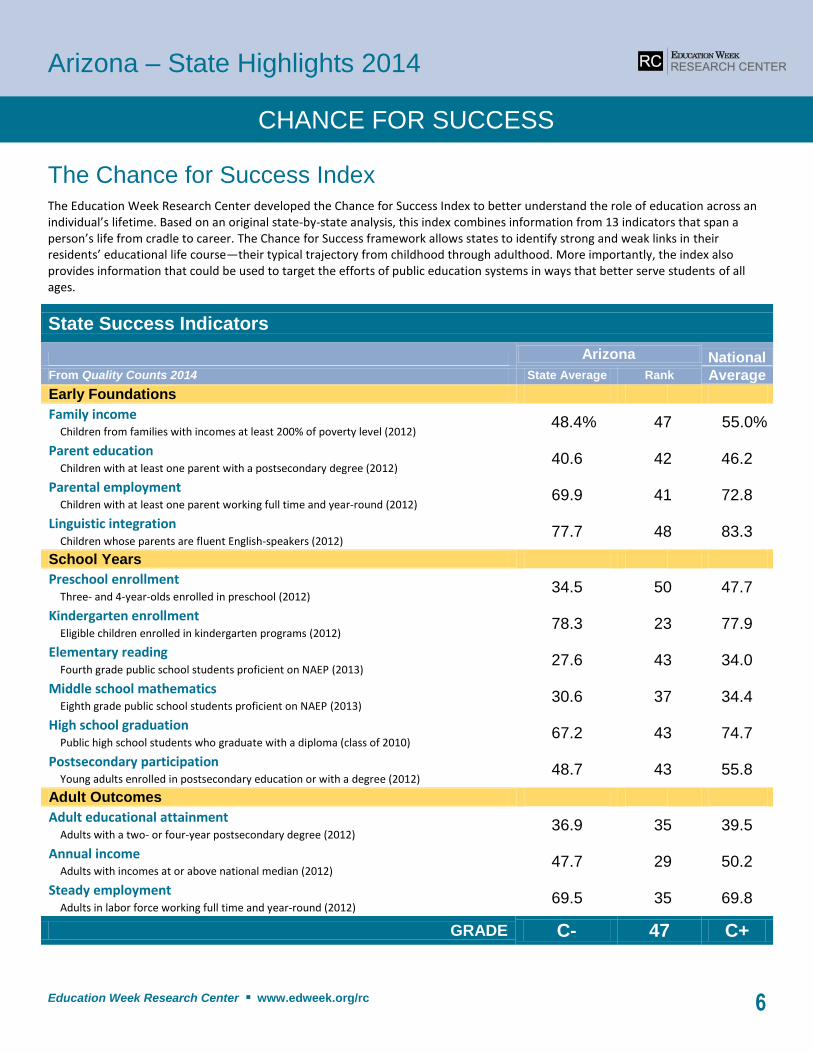
The Chance for Success Index
The Education Week Research Center developed the Chance for Success Index to better understand the role of education across an individual’s lifetime. Based on an original state-by-state analysis, this index combines information from 13 indicators that span a person’s life from cradle to career. The Chance for Success framework allows states to identify strong and weak links in their residents’ educational life course―their typical trajectory from childhood through adulthood. More importantly, the index also provides information that could be used to target the efforts of public education systems in ways that better serve students of all ages.
State Success Indicators
Arizona National From Quality Counts 2014 State Average Rank Average
Early Foundations
Family income Children from families with incomes at least 200% of poverty level (2012)
48.4% 47 55.0%
Parent education Children with at least one parent with a postsecondary degree (2012)
40.6 42 46.2
Parental employment Children with at least one parent working full time and year-round (2012)
69.9 41 72.8
Linguistic integration Children whose parents are fluent English-speakers (2012)
77.7 48 83.3
School Years
Preschool enrollment
Three- and 4-year-olds enrolled in preschool (2012) 34.5 50 47.7
Kindergarten enrollment Eligible children enrolled in kindergarten programs (2012)
78.3 23 77.9
Elementary reading Fourth grade public school students proficient on NAEP (2013)
27.6 43 34.0
Middle school mathematics Eighth grade public school students proficient on NAEP (2013)
30.6 37 34.4
High school graduation Public high school students who graduate with a diploma (class of 2010)
67.2 43 74.7
Postsecondary participation Young adults enrolled in postsecondary education or with a degree (2012)
48.7 43 55.8
Adult Outcomes
Adult educational attainment Adults with a two- or four-year postsecondary degree (2012)
36.9 35 39.5
Annual income Adults with incomes at or above national median (2012)
47.7 29 50.2
Steady employment Adults in labor force working full time and year-round (2012)
69.5 35 69.8
GRADE C- 47 C+
CHANCE FOR SUCCESS
Arizona – State Highlights 2014
Education Week Research Center ▪ www.edweek.org/rc 7
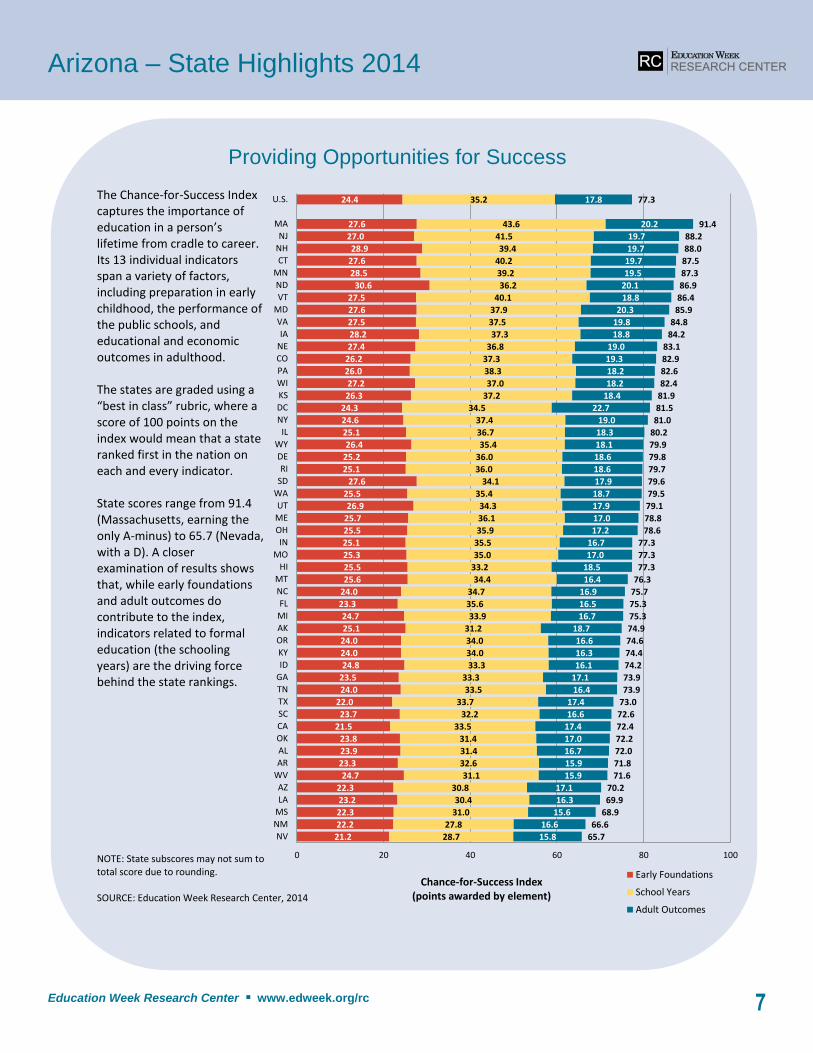
The Chance-for-Success Index captures the importance of education in a person’s lifetime from cradle to career. Its 13 individual indicators span a variety of factors, including preparation in early childhood, the performance of the public schools, and educational and economic outcomes in adulthood. The states are graded using a “best in class” rubric, where a score of 100 points on the index would mean that a state ranked first in the nation on each and every indicator. State scores range from 91.4 (Massachusetts, earning the only A-minus) to 65.7 (Nevada, with a D). A closer examination of results shows that, while early foundations and adult outcomes do contribute to the index, indicators related to formal education (the schooling years) are the driving force behind the state rankings. NOTE: State subscores may not sum to total score due to rounding. SOURCE: Education Week Research Center, 2014
21.2
22.2
22.3
23.2
22.3
24.7
23.3
23.9
23.8
21.5
23.7
22.0
24.0
23.5
24.8
24.0
24.0
25.1
24.7
23.3
24.0
25.6
25.5
25.3
25.1
25.5
25.7
26.9
25.5
27.6
25.1
25.2
26.4
25.1
24.6
24.3
26.3
27.2
26.0
26.2
27.4
28.2
27.5
27.6
27.5
30.6
28.5
27.6
28.9
27.0
27.6
24.4
28.7
27.8
31.0
30.4
30.8
31.1
32.6
31.4
31.4
33.5
32.2
33.7
33.5
33.3
33.3
34.0
34.0
31.2
33.9
35.6
34.7
34.4
33.2
35.0
35.5
35.9
36.1
34.3
35.4
34.1
36.0
36.0
35.4
36.7
37.4
34.5
37.2
37.0
38.3
37.3
36.8
37.3
37.5
37.9
40.1
36.2
39.2
40.2
39.4
41.5
43.6
35.2
15.8
16.6
15.6
16.3
17.1
15.9
15.9
16.7
17.0
17.4
16.6
17.4
16.4
17.1
16.1
16.3
16.6
18.7
16.7
16.5
16.9
16.4
18.5
17.0
16.7
17.2
17.0
17.9
18.7
17.9
18.6
18.6
18.1
18.3
19.0
22.7
18.4
18.2
18.2
19.3
19.0
18.8
19.8
20.3
18.8
20.1
19.5
19.7
19.7
19.7
20.2
17.8
65.7
66.6
68.9
69.9
70.2
71.6
71.8
72.0
72.2
72.4
72.6
73.0
73.9
73.9
74.2
74.4
74.6
74.9
75.3
75.3
75.7
76.3
77.3
77.3
77.3
78.6
78.8
79.1
79.5
79.6
79.7
79.8
79.9
80.2
81.0
81.5
81.9
82.4
82.6
82.9
83.1
84.2
84.8
85.9
86.4
86.9
87.3
87.5
88.0
88.2
91.4
77.3
0 20 40 60 80 100
NV
NM
MS
LA
AZ
WV
AR
AL
OK
CA
SC
TX
TN
GA
ID
KY
OR
AK
MI
FL
NC
MT
HI
MO
IN
OH
ME
UT
WA
SD
RI
DE
WY
IL
NY
DC
KS
WI
PA
CO
NE
IA
VA
MD
VT
ND
MN
CT
NH
NJ
MA
U.S.
Chance-for-Success Index(points awarded by element)
Early Foundations
School Years
Adult Outcomes
Providing Opportunities for Success
Arizona – State Highlights 2014
Education Week Research Center ▪ www.edweek.org/rc 8
The K-12 Achievement Index
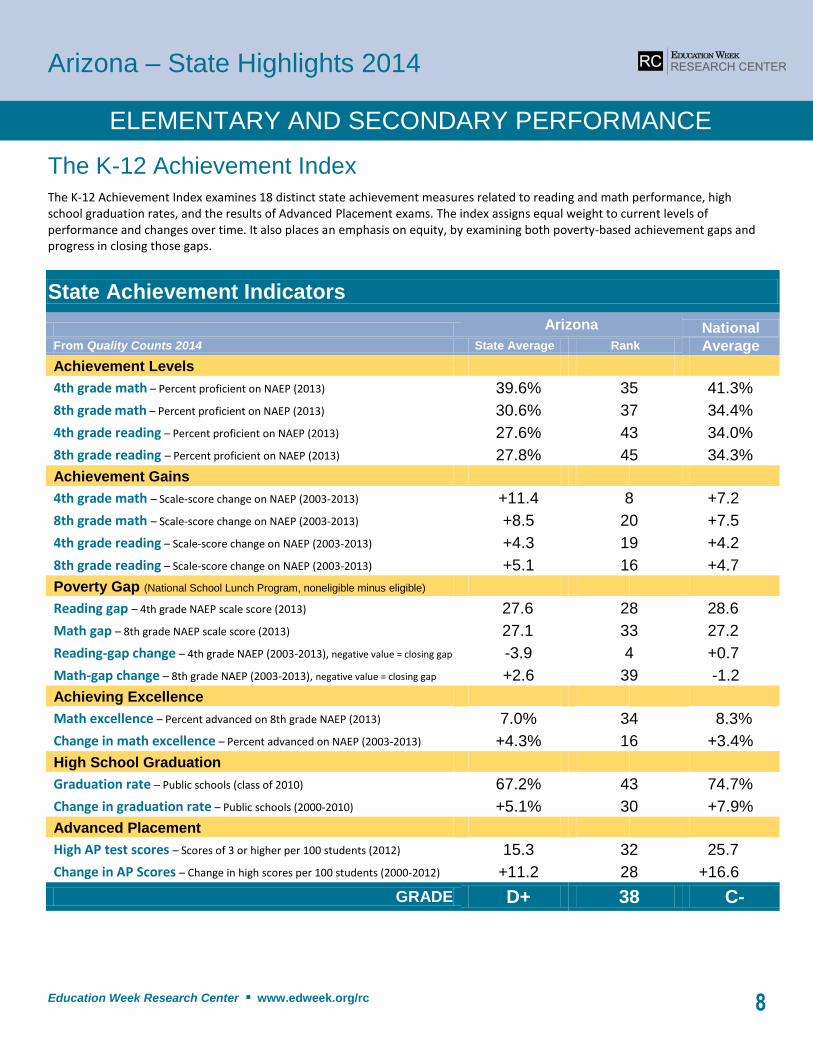
The K-12 Achievement Index examines 18 distinct state achievement measures related to reading and math performance, high school graduation rates, and the results of Advanced Placement exams. The index assigns equal weight to current levels of performance and changes over time. It also places an emphasis on equity, by examining both poverty-based achievement gaps and progress in closing those gaps.
State Achievement Indicators
Arizona National From Quality Counts 2014 State Average Rank Average
Achievement Levels
4th grade math – Percent proficient on NAEP (2013) 39.6% 35 41.3%
8th grade math – Percent proficient on NAEP (2013) 30.6% 37 34.4%
4th grade reading – Percent proficient on NAEP (2013) 27.6% 43 34.0%
8th grade reading – Percent proficient on NAEP (2013) 27.8% 45 34.3%
Achievement Gains
4th grade math – Scale-score change on NAEP (2003-2013) +11.4 8 +7.2
8th grade math – Scale-score change on NAEP (2003-2013) +8.5 20 +7.5
4th grade reading – Scale-score change on NAEP (2003-2013) +4.3 19 +4.2
8th grade reading – Scale-score change on NAEP (2003-2013) +5.1 16 +4.7
Poverty Gap (National School Lunch Program, noneligible minus eligible)
Reading gap – 4th grade NAEP scale score (2013) 27.6 28 28.6
Math gap – 8th grade NAEP scale score (2013) 27.1 33 27.2
Reading-gap change – 4th grade NAEP (2003-2013), negative value = closing gap -3.9 4 +0.7
Math-gap change – 8th grade NAEP (2003-2013), negative value = closing gap +2.6 39 -1.2
Achieving Excellence
Math excellence – Percent advanced on 8th grade NAEP (2013) 7.0% 34 8.3%
Change in math excellence – Percent advanced on NAEP (2003-2013) +4.3% 16 +3.4%
High School Graduation
Graduation rate – Public schools (class of 2010) 67.2% 43 74.7%
Change in graduation rate – Public schools (2000-2010) +5.1% 30 +7.9%
Advanced Placement
High AP test scores – Scores of 3 or higher per 100 students (2012) 15.3 32 25.7
Change in AP Scores – Change in high scores per 100 students (2000-2012) +11.2 28 +16.6
GRADE D+ 38 C-
ELEMENTARY AND SECONDARY PERFORMANCE
Arizona – State Highlights 2014
Education Week Research Center ▪ www.edweek.org/rc 9
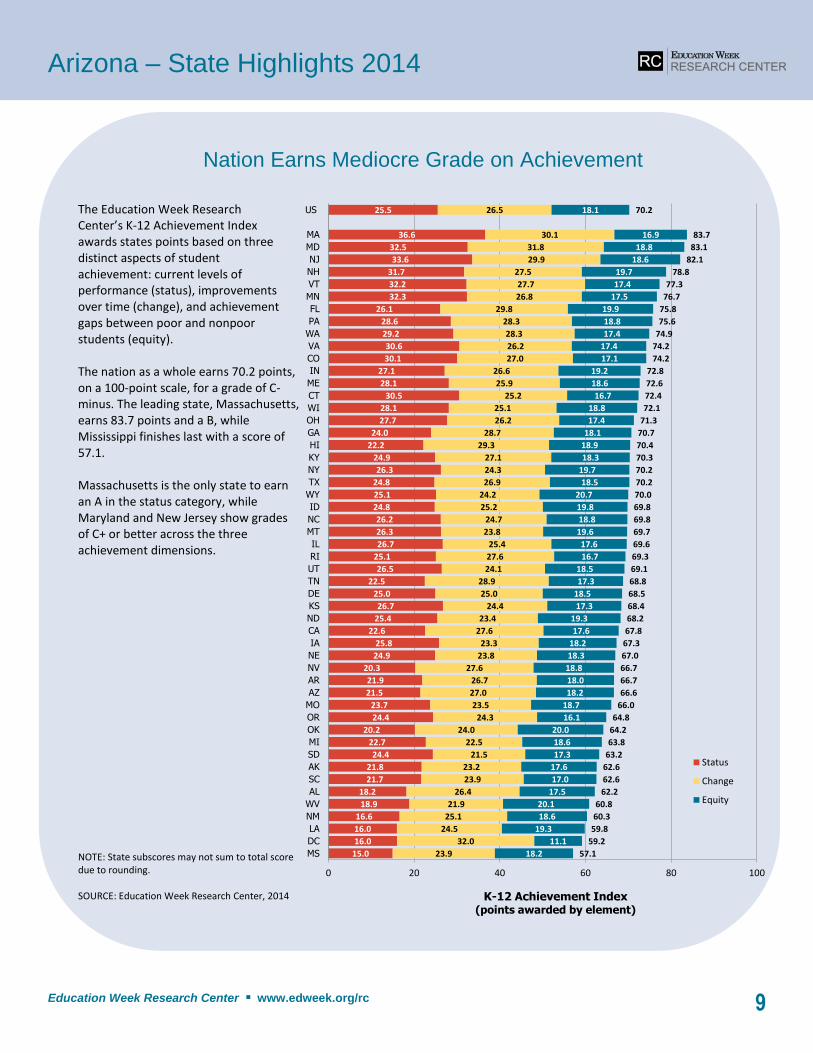
The Education Week Research Center’s K-12 Achievement Index awards states points based on three distinct aspects of student achievement: current levels of performance (status), improvements over time (change), and achievement gaps between poor and nonpoor students (equity). The nation as a whole earns 70.2 points, on a 100-point scale, for a grade of C-minus. The leading state, Massachusetts, earns 83.7 points and a B, while Mississippi finishes last with a score of 57.1. Massachusetts is the only state to earn an A in the status category, while Maryland and New Jersey show grades of C+ or better across the three achievement dimensions. NOTE: State subscores may not sum to total score due to rounding. SOURCE: Education Week Research Center, 2014
15.0
16.0
16.0
16.6
18.9
18.2
21.7
21.8
24.4
22.7
20.2
24.4
23.7
21.5
21.9
20.3
24.9
25.8
22.6
25.4
26.7
25.0
22.5
26.5
25.1
26.7
26.3
26.2
24.8
25.1
24.8
26.3
24.9
22.2
24.0
27.7
28.1
30.5
28.1
27.1
30.1
30.6
29.2
28.6
26.1
32.3
32.2
31.7
33.6
32.5
36.6
25.5
23.9
32.0
24.5
25.1
21.9
26.4
23.9
23.2
21.5
22.5
24.0
24.3
23.5
27.0
26.7
27.6
23.8
23.3
27.6
23.4
24.4
25.0
28.9
24.1
27.6
25.4
23.8
24.7
25.2
24.2
26.9
24.3
27.1
29.3
28.7
26.2
25.1
25.2
25.9
26.6
27.0
26.2
28.3
28.3
29.8
26.8
27.7
27.5
29.9
31.8
30.1
26.5
18.2
11.1
19.3
18.6
20.1
17.5
17.0
17.6
17.3
18.6
20.0
16.1
18.7
18.2
18.0
18.8
18.3
18.2
17.6
19.3
17.3
18.5
17.3
18.5
16.7
17.6
19.6
18.8
19.8
20.7
18.5
19.7
18.3
18.9
18.1
17.4
18.8
16.7
18.6
19.2
17.1
17.4
17.4
18.8
19.9
17.5
17.4
19.7
18.6
18.8
16.9
18.1
57.1
59.2
59.8
60.3
60.8
62.2
62.6
62.6
63.2
63.8
64.2
64.8
66.0
66.6
66.7
66.7
67.0
67.3
67.8
68.2
68.4
68.5
68.8
69.1
69.3
69.6
69.7
69.8
69.8
70.0
70.2
70.2
70.3
70.4
70.7
71.3
72.1
72.4
72.6
72.8
74.2
74.2
74.9
75.6
75.8
76.7
77.3
78.8
82.1
83.1
83.7
70.2
0 20 40 60 80 100
MS
DC
LA
NM
WV
AL
SC
AK
SD
MI
OK
OR
MO
AZ
AR
NV
NE
IA
CA
ND
KS
DE
TN
UT
RI
IL
MT
NC
ID
WY
TX
NY
KY
HI
GA
OH
WI
CT
ME
IN
CO
VA
WA
PA
FL
MN
VT
NH
NJ
MD
MA
US
Status
Change
Equity
K-12 Achievement Index (points awarded by element)
Nation Earns Mediocre Grade on Achievement
Arizona – State Highlights 2014
Education Week Research Center ▪ www.edweek.org/rc 10
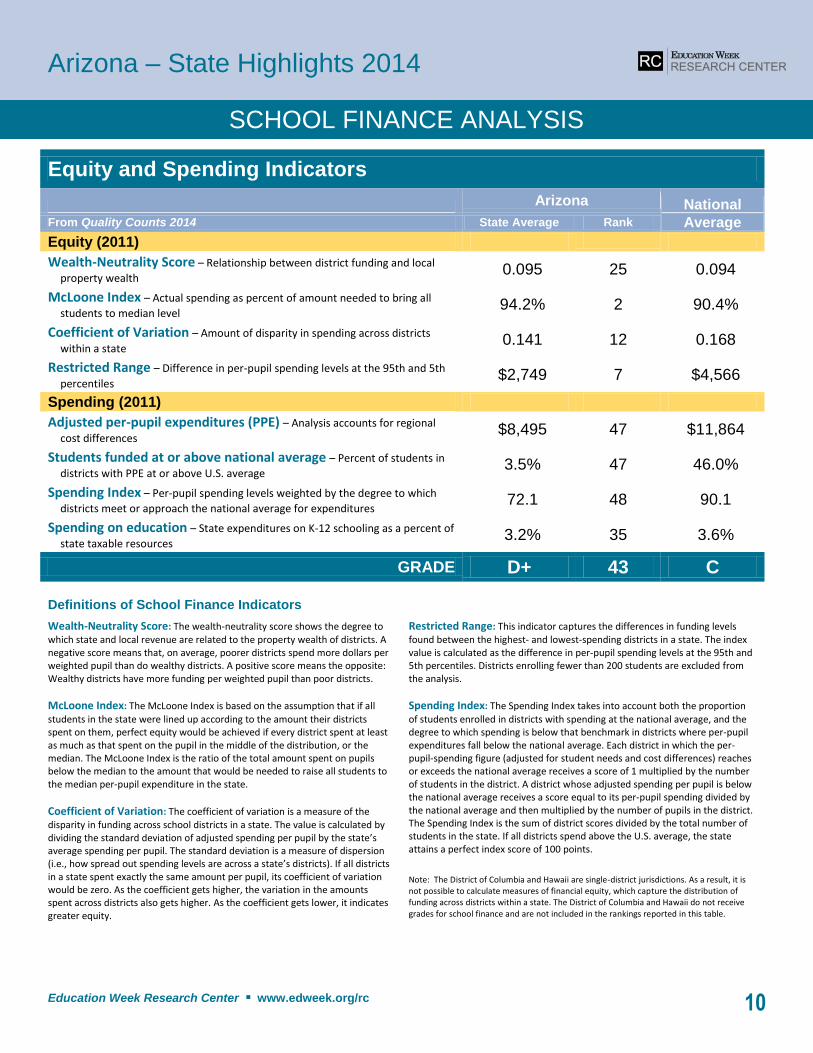
Equity and Spending Indicators
Arizona National From Quality Counts 2014 State Average Rank Average
Equity (2011)
Wealth-Neutrality Score – Relationship between district funding and local
property wealth 0.095 25 0.094
McLoone Index – Actual spending as percent of amount needed to bring all
students to median level 94.2% 2 90.4%
Coefficient of Variation – Amount of disparity in spending across districts
within a state 0.141 12 0.168
Restricted Range – Difference in per-pupil spending levels at the 95th and 5th
percentiles $2,749 7 $4,566
Spending (2011)
Adjusted per-pupil expenditures (PPE) – Analysis accounts for regional
cost differences $8,495 47 $11,864
Students funded at or above national average – Percent of students in
districts with PPE at or above U.S. average 3.5% 47 46.0%
Spending Index – Per-pupil spending levels weighted by the degree to which
districts meet or approach the national average for expenditures 72.1 48 90.1
Spending on education – State expenditures on K-12 schooling as a percent of
state taxable resources 3.2% 35 3.6%
GRADE D+ 43 C Definitions of School Finance Indicators
Wealth-Neutrality Score: The wealth-neutrality score shows the degree to which state and local revenue are related to the property wealth of districts. A negative score means that, on average, poorer districts spend more dollars per weighted pupil than do wealthy districts. A positive score means the opposite: Wealthy districts have more funding per weighted pupil than poor districts.
McLoone Index: The McLoone Index is based on the assumption that if all
students in the state were lined up according to the amount their districts spent on them, perfect equity would be achieved if every district spent at least as much as that spent on the pupil in the middle of the distribution, or the median. The McLoone Index is the ratio of the total amount spent on pupils below the median to the amount that would be needed to raise all students to the median per-pupil expenditure in the state.
Coefficient of Variation: The coefficient of variation is a measure of the disparity in funding across school districts in a state. The value is calculated by dividing the standard deviation of adjusted spending per pupil by the state’s average spending per pupil. The standard deviation is a measure of dispersion (i.e., how spread out spending levels are across a state’s districts). If all districts in a state spent exactly the same amount per pupil, its coefficient of variation would be zero. As the coefficient gets higher, the variation in the amounts spent across districts also gets higher. As the coefficient gets lower, it indicates greater equity.
Restricted Range: This indicator captures the differences in funding levels found between the highest- and lowest-spending districts in a state. The index value is calculated as the difference in per-pupil spending levels at the 95th and 5th percentiles. Districts enrolling fewer than 200 students are excluded from the analysis.
Spending Index: The Spending Index takes into account both the proportion
of students enrolled in districts with spending at the national average, and the degree to which spending is below that benchmark in districts where per-pupil expenditures fall below the national average. Each district in which the per-pupil-spending figure (adjusted for student needs and cost differences) reaches or exceeds the national average receives a score of 1 multiplied by the number of students in the district. A district whose adjusted spending per pupil is below the national average receives a score equal to its per-pupil spending divided by the national average and then multiplied by the number of pupils in the district. The Spending Index is the sum of district scores divided by the total number of students in the state. If all districts spend above the U.S. average, the state attains a perfect index score of 100 points.
Note: The District of Columbia and Hawaii are single-district jurisdictions. As a result, it is not possible to calculate measures of financial equity, which capture the distribution of funding across districts within a state. The District of Columbia and Hawaii do not receive grades for school finance and are not included in the rankings reported in this table.
SCHOOL FINANCE ANALYSIS
Arizona – State Highlights 2014
Education Week Research Center ▪ www.edweek.org/rc 11
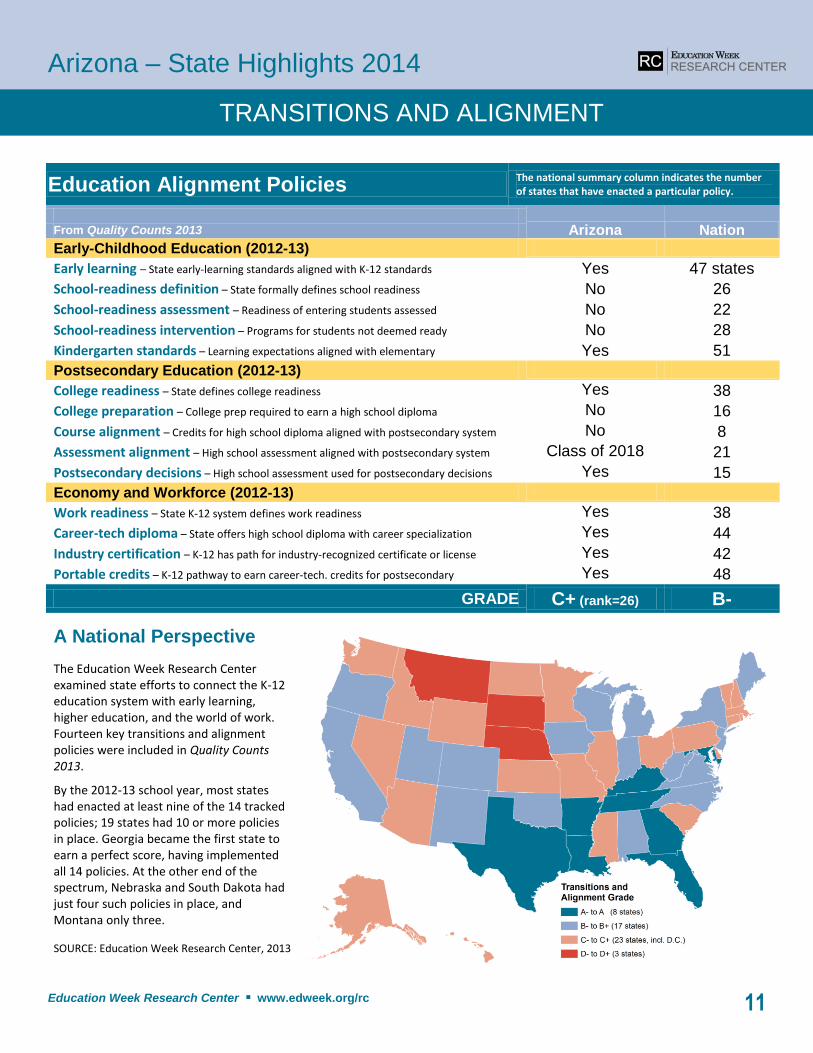
Education Alignment Policies The national summary column indicates the number of states that have enacted a particular policy.
Arizona Nation From Quality Counts 2013
Early-Childhood Education (2012-13)
Early learning – State early-learning standards aligned with K-12 standards Yes 47 states
School-readiness definition – State formally defines school readiness No 26
School-readiness assessment – Readiness of entering students assessed No 22
School-readiness intervention – Programs for students not deemed ready No 28
Kindergarten standards – Learning expectations aligned with elementary Yes 51
Postsecondary Education (2012-13)
College readiness – State defines college readiness Yes 38
College preparation – College prep required to earn a high school diploma No 16
Course alignment – Credits for high school diploma aligned with postsecondary system No 8
Assessment alignment – High school assessment aligned with postsecondary system Class of 2018 21
Postsecondary decisions – High school assessment used for postsecondary decisions Yes 15
Economy and Workforce (2012-13)
Work readiness – State K-12 system defines work readiness Yes 38
Career-tech diploma – State offers high school diploma with career specialization Yes 44
Industry certification – K-12 has path for industry-recognized certificate or license Yes 42
Portable credits – K-12 pathway to earn career-tech. credits for postsecondary Yes 48
GRADE C+ (rank=26) B-
A National Perspective
The Education Week Research Center examined state efforts to connect the K-12 education system with early learning, higher education, and the world of work. Fourteen key transitions and alignment policies were included in Quality Counts 2013.
By the 2012-13 school year, most states had enacted at least nine of the 14 tracked policies; 19 states had 10 or more policies in place. Georgia became the first state to earn a perfect score, having implemented all 14 policies. At the other end of the spectrum, Nebraska and South Dakota had just four such policies in place, and Montana only three.
SOURCE: Education Week Research Center, 2013
TRANSITIONS AND ALIGNMENT
Arizona – State Highlights 2014
Education Week Research Center ▪ www.edweek.org/rc 12
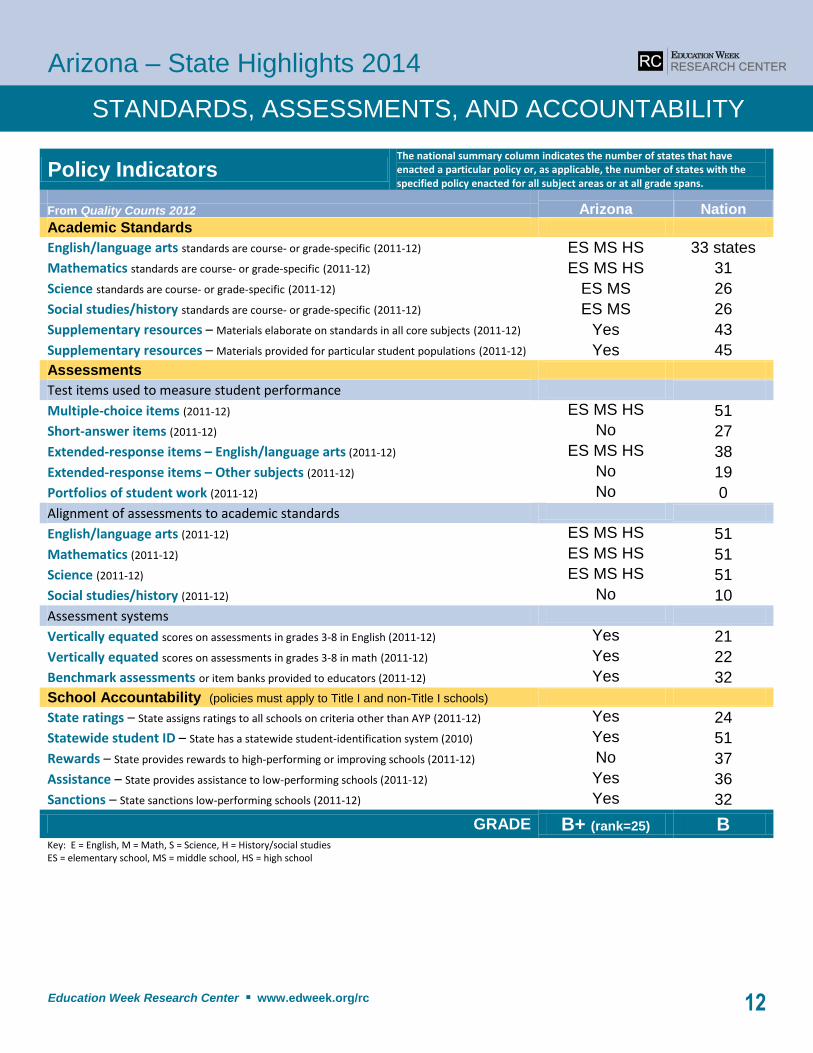
Policy Indicators
The national summary column indicates the number of states that have enacted a particular policy or, as applicable, the number of states with the specified policy enacted for all subject areas or at all grade spans.
Arizona Nation From Quality Counts 2012
Academic Standards
English/language arts standards are course- or grade-specific (2011-12) ES MS HS 33 states
Mathematics standards are course- or grade-specific (2011-12) ES MS HS 31
Science standards are course- or grade-specific (2011-12) ES MS 26
Social studies/history standards are course- or grade-specific (2011-12) ES MS 26
Supplementary resources – Materials elaborate on standards in all core subjects (2011-12) Yes 43
Supplementary resources – Materials provided for particular student populations (2011-12) Yes 45
Assessments
Test items used to measure student performance
Multiple-choice items (2011-12) ES MS HS 51
Short-answer items (2011-12) No 27
Extended-response items – English/language arts (2011-12) ES MS HS 38
Extended-response items – Other subjects (2011-12) No 19
Portfolios of student work (2011-12) No 0
Alignment of assessments to academic standards
English/language arts (2011-12) ES MS HS 51
Mathematics (2011-12) ES MS HS 51
Science (2011-12) ES MS HS 51
Social studies/history (2011-12) No 10
Assessment systems
Vertically equated scores on assessments in grades 3-8 in English (2011-12) Yes 21
Vertically equated scores on assessments in grades 3-8 in math (2011-12) Yes 22
Benchmark assessments or item banks provided to educators (2011-12) Yes 32
School Accountability (policies must apply to Title I and non-Title I schools)
State ratings – State assigns ratings to all schools on criteria other than AYP (2011-12) Yes 24
Statewide student ID – State has a statewide student-identification system (2010) Yes 51
Rewards – State provides rewards to high-performing or improving schools (2011-12) No 37
Assistance – State provides assistance to low-performing schools (2011-12) Yes 36
Sanctions – State sanctions low-performing schools (2011-12) Yes 32
GRADE B+ (rank=25) B Key: E = English, M = Math, S = Science, H = History/social studies ES = elementary school, MS = middle school, HS = high school
STANDARDS, ASSESSMENTS, AND ACCOUNTABILITY
Arizona – State Highlights 2014
Education Week Research Center ▪ www.edweek.org/rc 13
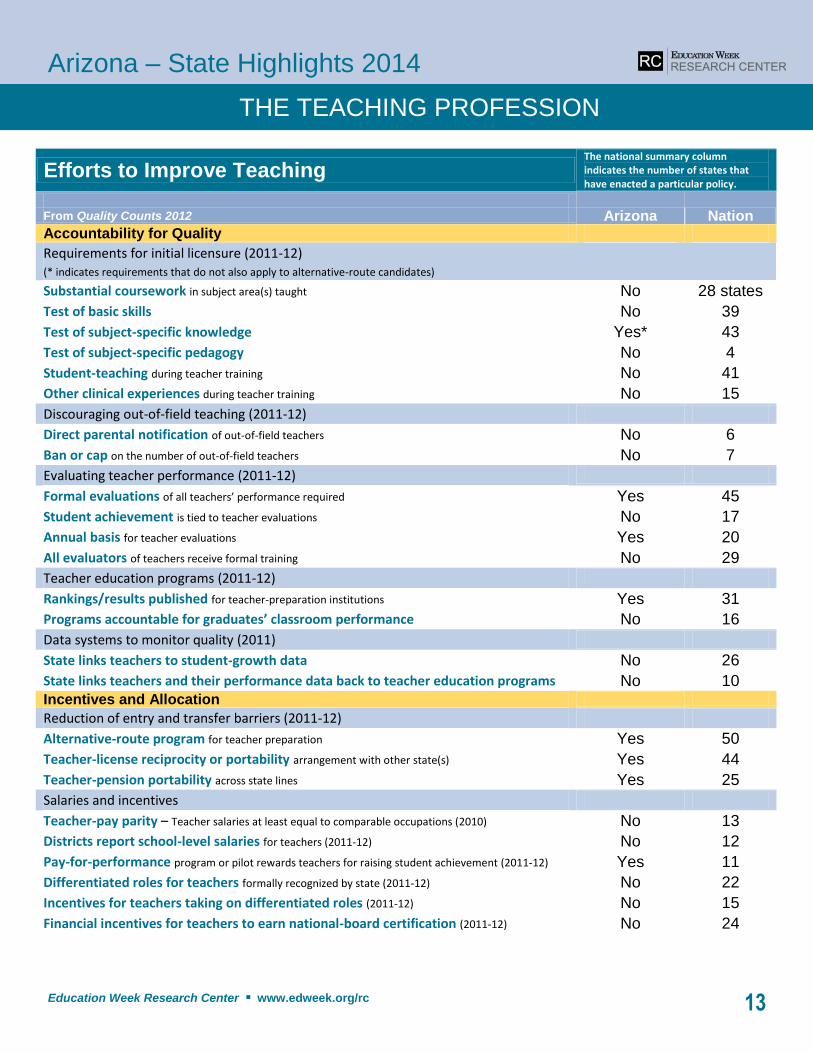
Efforts to Improve Teaching
The national summary column indicates the number of states that have enacted a particular policy.
Arizona Nation From Quality Counts 2012
Accountability for Quality
Requirements for initial licensure (2011-12) (* indicates requirements that do not also apply to alternative-route candidates)
Substantial coursework in subject area(s) taught No 28 states
Test of basic skills No 39
Test of subject-specific knowledge Yes* 43
Test of subject-specific pedagogy No 4
Student-teaching during teacher training No 41
Other clinical experiences during teacher training No 15
Discouraging out-of-field teaching (2011-12)
Direct parental notification of out-of-field teachers No 6
Ban or cap on the number of out-of-field teachers No 7
Evaluating teacher performance (2011-12)
Formal evaluations of all teachers’ performance required Yes 45
Student achievement is tied to teacher evaluations No 17
Annual basis for teacher evaluations Yes 20
All evaluators of teachers receive formal training No 29
Teacher education programs (2011-12)
Rankings/results published for teacher-preparation institutions Yes 31
Programs accountable for graduates’ classroom performance No 16
Data systems to monitor quality (2011)
State links teachers to student-growth data No 26
State links teachers and their performance data back to teacher education programs No 10 Incentives and Allocation
Reduction of entry and transfer barriers (2011-12)
Alternative-route program for teacher preparation Yes 50
Teacher-license reciprocity or portability arrangement with other state(s) Yes 44
Teacher-pension portability across state lines Yes 25
Salaries and incentives
Teacher-pay parity – Teacher salaries at least equal to comparable occupations (2010) No 13
Districts report school-level salaries for teachers (2011-12) No 12
Pay-for-performance program or pilot rewards teachers for raising student achievement (2011-12) Yes 11
Differentiated roles for teachers formally recognized by state (2011-12) No 22
Incentives for teachers taking on differentiated roles (2011-12) No 15
Financial incentives for teachers to earn national-board certification (2011-12) No 24
THE TEACHING PROFESSION
Arizona – State Highlights 2014
Education Week Research Center ▪ www.edweek.org/rc 14
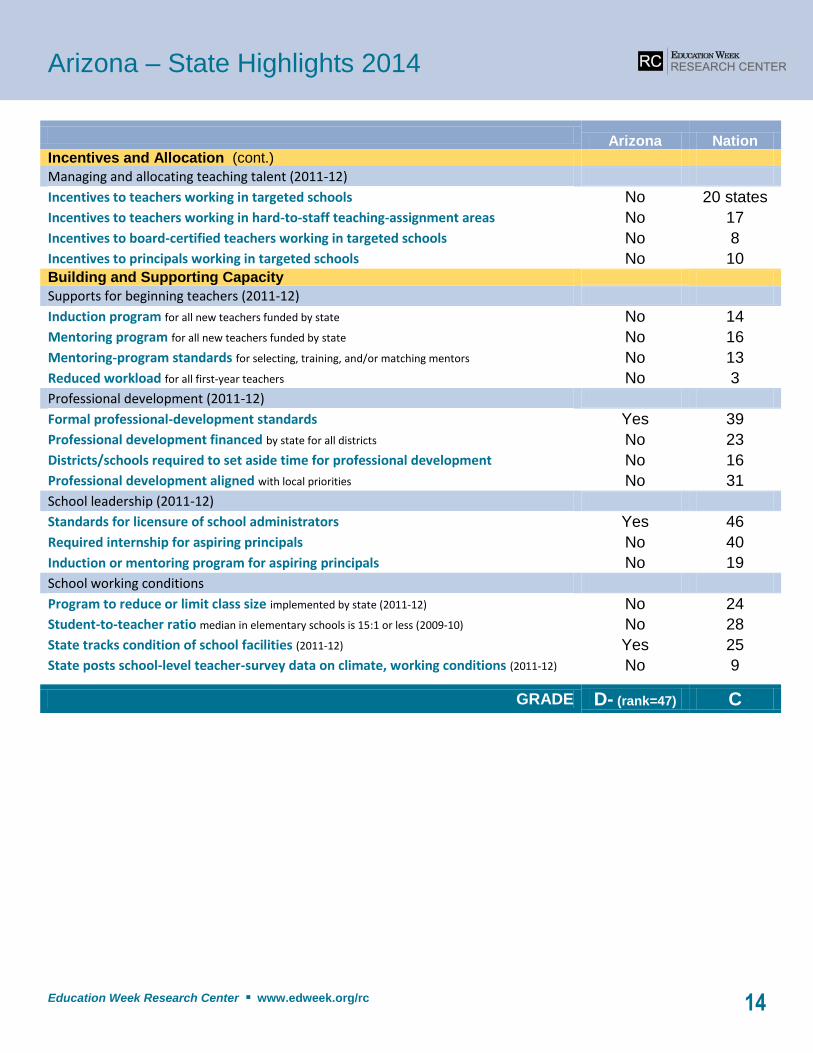
Arizona Nation Incentives and Allocation (cont.)
Managing and allocating teaching talent (2011-12)
Incentives to teachers working in targeted schools No 20 states
Incentives to teachers working in hard-to-staff teaching-assignment areas No 17
Incentives to board-certified teachers working in targeted schools No 8
Incentives to principals working in targeted schools No 10 Building and Supporting Capacity
Supports for beginning teachers (2011-12)
Induction program for all new teachers funded by state No 14
Mentoring program for all new teachers funded by state No 16
Mentoring-program standards for selecting, training, and/or matching mentors No 13
Reduced workload for all first-year teachers No 3
Professional development (2011-12)
Formal professional-development standards Yes 39
Professional development financed by state for all districts No 23
Districts/schools required to set aside time for professional development No 16
Professional development aligned with local priorities No 31
School leadership (2011-12)
Standards for licensure of school administrators Yes 46
Required internship for aspiring principals No 40
Induction or mentoring program for aspiring principals No 19
School working conditions
Program to reduce or limit class size implemented by state (2011-12) No 24
Student-to-teacher ratio median in elementary schools is 15:1 or less (2009-10) No 28
State tracks condition of school facilities (2011-12) Yes 25
State posts school-level teacher-survey data on climate, working conditions (2011-12) No 9
GRADE D- (rank=47) C

Arizona – State Highlights 2014
Education Week Research Center ▪ www.edweek.org/rc 15
Quality Counts 2014
This year’s 18th edition of Quality Counts examines the impact of the increasingly complex fiscal, political, and technological forces that are challenging school districts and spurring efforts to grapple with a range of factors transforming the environment for education governance. The print edition of Quality Counts 2014 provides a 50-state update on results in two distinct areas: K-12 achievement and school finance. The State Highlights Reports present state-specific summaries of key findings across all six areas of policy and performance that comprise the report’s state-grading rubric. Due to a delay in the release of U.S. Census Bureau data caused by the recent government shutdown, new results for the Chance for Success Index were not available for inclusion in the report’s print edition. Updated data for that category are only available online and in the State Highlights Reports. Information is drawn from the 2012, 2013, and 2014 editions of Quality Counts. Reports for the 50 states and the District of Columbia are available on the Web at www.edweek.org/go/qc14.
Quality Counts regularly tracks and grades state progress in six categories comprising more than 150 different state-by-state indicators. Most of these 50-state indicators are based on original analyses and state-survey data from the Education Week Research Center. The report also draws on published information from other organizations. The methodology section of Quality Counts provides detailed descriptions of our indicators and procedures for grading the states. That information can be accessed online at www.edweek.org/go/qc14 (2014), www.edweek.org/go/qc13 (2013) and www.edweek.org/go/qc12 (2012). Policy information for standards, assessments, and accountability; the teaching profession; and transitions and alignment is drawn from surveys of state education agencies
conducted for 2012 and 2013. Indicators derived from other sources are listed in the notes that follow.
Chance for Success (2014)
Elementary Reading and Middle School Mathematics: 2013 State NAEP assessment. U.S. Department of Education, 2013. High School Graduation: Cumulative Promotion Index, calculated using the U.S. Department of Education’s Common Core of Data, 2009-10. Education Week Research Center, 2013.
Other Indicators: Education Week Research Center analysis of data from the U.S. Census Bureau’s American Community Survey, 2012.
K-12 Achievement (2014)
Reading and Mathematics Achievement: 2013 State NAEP assessment. U.S. Department of Education, 2013.
High School Graduation: Cumulative Promotion Index, calculated using the U.S. Department of Education’s Common Core of Data, 2009-10. Education Week Research Center, 2013.
Advanced Placement: Education Week Research Center analysis of data from the College Board’s AP Summary Reports 2012, and the U.S. Department of Education’s Common Core of Data, 2011.
School Finance Analysis (2014)
Original Education Week Research Center Analysis of Equity and Spending: Data for these analyses were obtained from a variety of sources, including: U.S. Census Bureau’s Public Elementary-Secondary Education Finance Data for 2011; U.S. Department of Education’s Common Core of Data 2008-09 and 2010-11 (district-level data); NCES’ Comparable Wage Index 2005; U.S. Census Bureau’s Small-Area Income and Poverty Estimates 2011; U.S. Department of Education’s School District Demographics data, based on the 2000 U.S. Census; NCES, Revenues and Expenditures for Public Elementary and Secondary Education: School
Year 2010-11 (Fiscal Year 2011), July 2013; and 2011 gross-state-product data from the U.S. Department of Commerce’s Bureau of Economic Analysis.
Transitions and Alignment (2013)
All Indicators: Education Week Research Center annual state policy survey, 2012.
Standards, Assessments, and Accountability (2012)
Assessment item types and alignment to state standards: Education Week Research Center review of testing calendars and other materials from state education agency websites, as verified by states, 2011. State has a statewide student-identification system: Data Quality Campaign, 2010. Other Indicators: Education Week Research Center annual state policy survey, 2011.
The Teaching Profession (2012) Data Systems to Monitor Quality: Data Quality Campaign, 2011. Teacher-Pay Parity: Education Week Research Center analysis of data from the U.S. Census Bureau’s American Community Survey, 2009 and 2010. Student-to-Teacher Ratio: Education Week Research Center analysis of U.S. Department of Education’s Common Core of Data, 2009-10. Other Indicators: Education Week Research Center annual state policy survey, 2011.
District Governance and Operations
In October 2013, the Education Week Research Center conducted an online survey of school district administrators who are registered users of the Education Week website. Key findings, based on their responses, are presented in this report.
State Policy Indicators
NOTES AND SOURCES
Visit Quality Counts Online
www.edweek.org/go/qc14
> Purchase extra copies of Quality Counts by visiting www.edweek.org/go/buyQC.
> Continue getting access to edweek.org, Quality Counts, other annual reports, and the entire archives of Education Week. Subscribe today! www.edweek.org/go/subscribe
> To place orders by phone, call 1-800-445-8250.
Highlights from this year’s report
A comprehensive look at school district governance and operations, including timely journalistic coverage and original survey data and analyses Education Week Research Center’s K-12 Achievement Index, a multi-dimensional analysis of current performance, equity, and gains over time State of the States—Our comprehensive annual review of state performance, this year highlighting: K-12 achievement and school finance
Online Extras State Highlights Reports—Download individualized reports featuring state-specific findings from Quality Counts Education Counts—Access hundreds of education indicators from Quality Counts using our exclusive online database
Interactive tools—Readers can delve into state data and use an online calculator to recompute grades based on the indicators they feel are most important
District Disruption & Revival School Systems Reshape to Compete and Improve
The 18th edition of Quality Counts examines the impact of new pressures on school district governance and operations. The print edition of the report also provides a 50-state update of results in two of the areas monitored by the report on an ongoing basis: K-12 achievement and school finance.
QUALITY COUNTS 2014