quality control, total quality management, and quality standards prepared by: ralph dorsainvil
TRANSCRIPT
Quality Control, Total Quality Management, and Quality
Standards
Prepared by: Ralph Dorsainvil
Quality Control
• Statistical Process Control
• Control chart zone rules– 8 rules
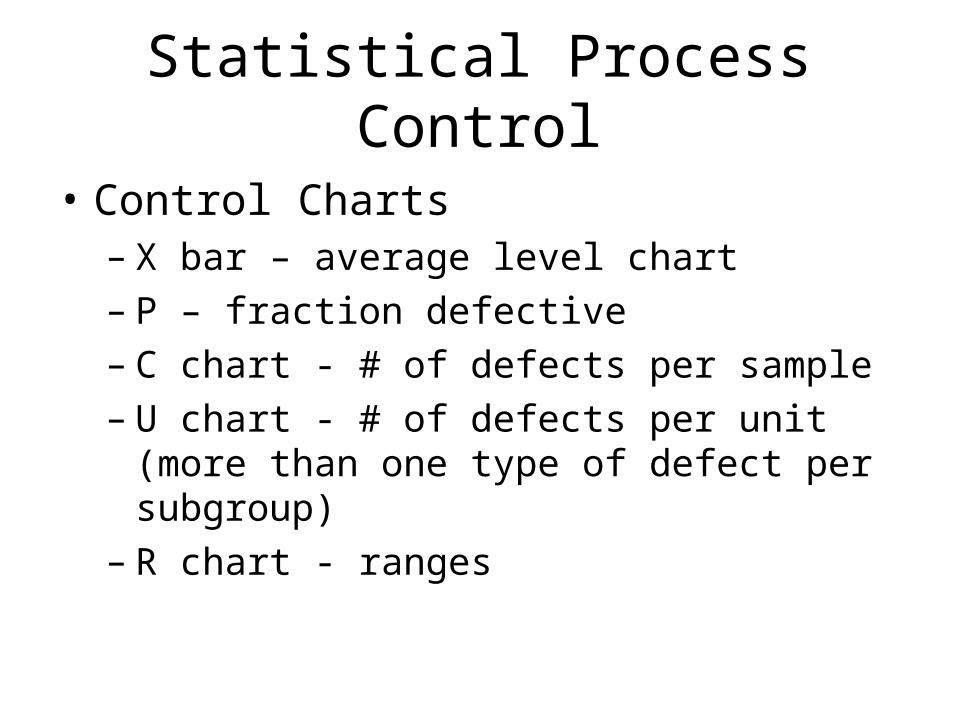
Statistical Process Control
• Control Charts – X bar – average level chart– P – fraction defective– C chart - # of defects per sample– U chart - # of defects per unit (more than one
type of defect per subgroup) – R chart - ranges
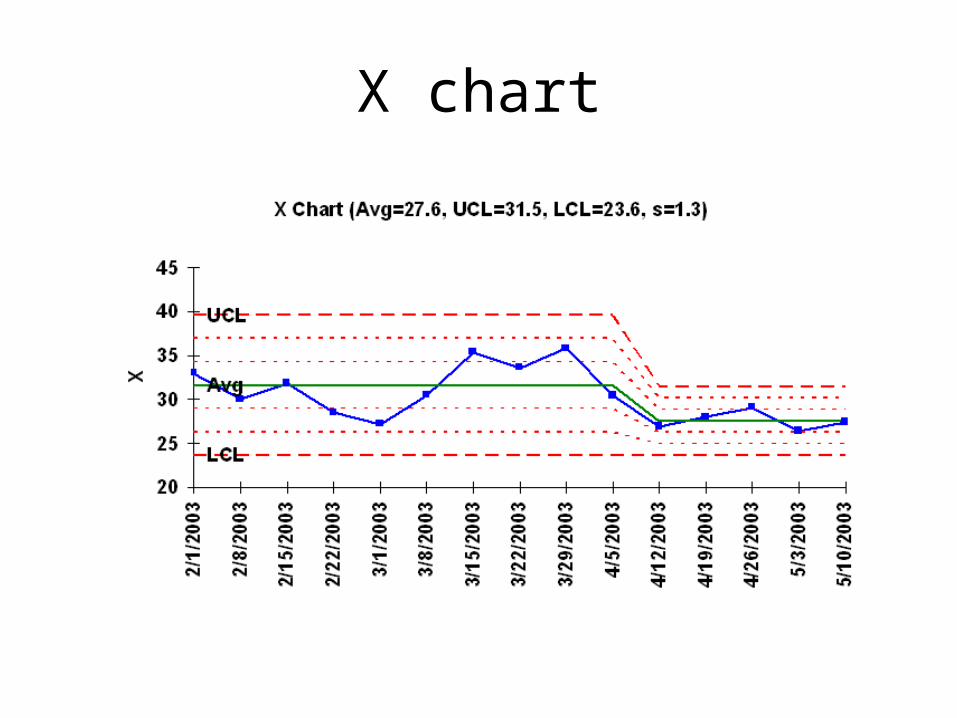
X chart
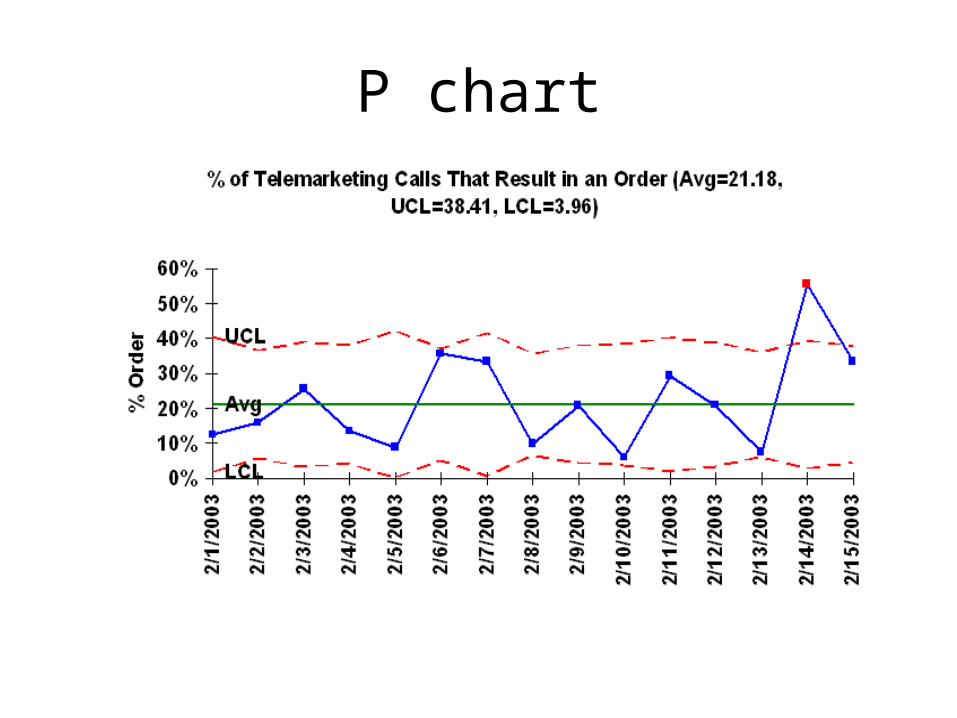
P chart
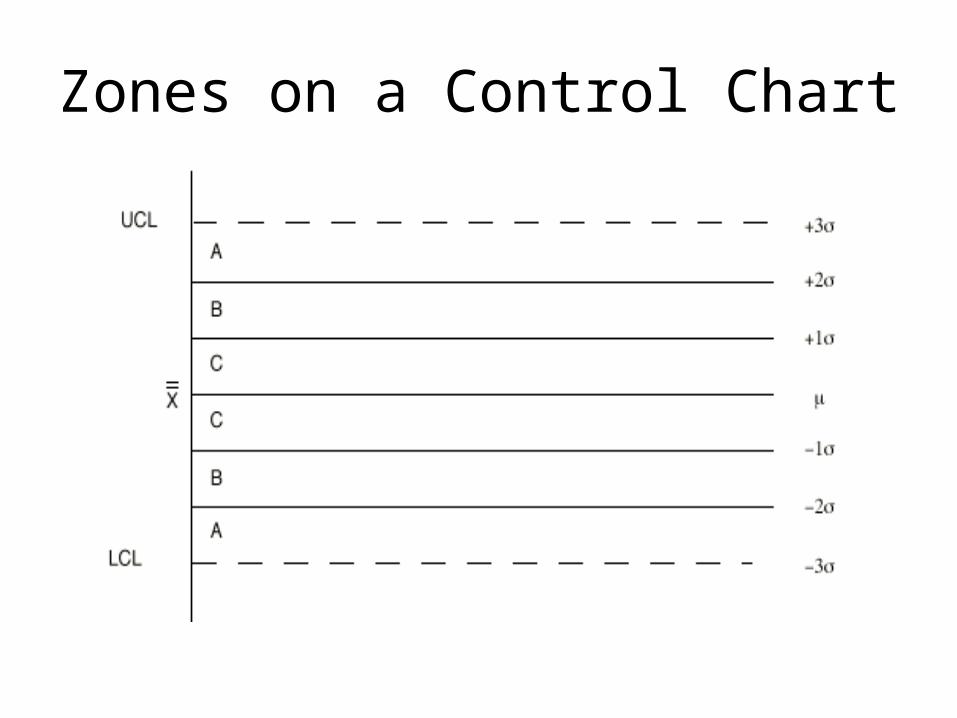
Zones on a Control Chart
Zone Rules
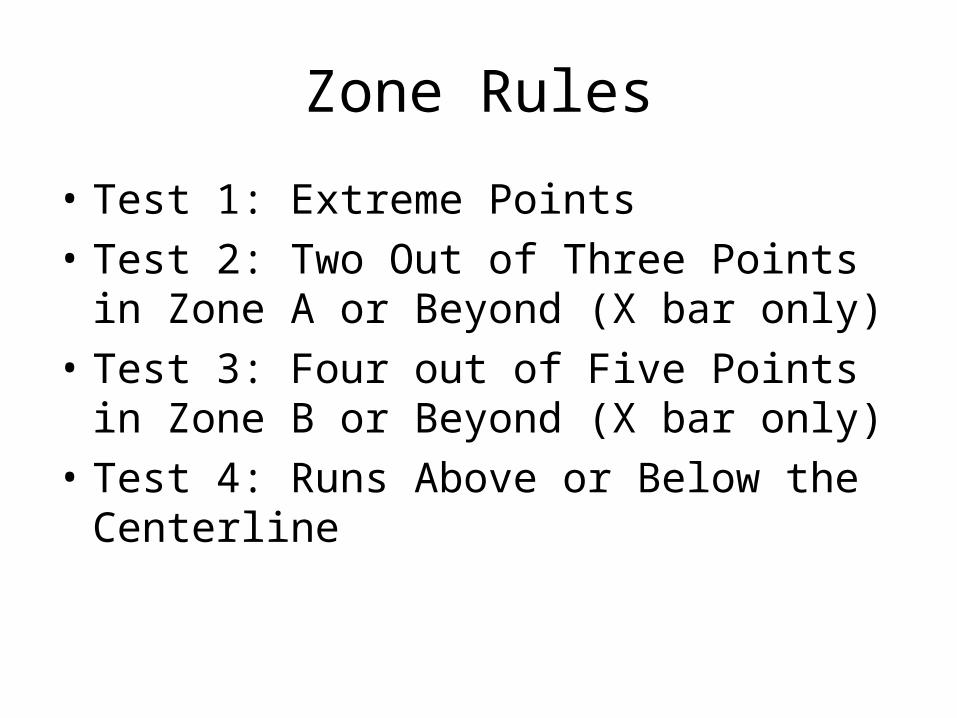
• Test 1: Extreme Points
• Test 2: Two Out of Three Points in Zone A or Beyond (X bar only)
• Test 3: Four out of Five Points in Zone B or Beyond (X bar only)
• Test 4: Runs Above or Below the Centerline
Zone Rules (cont’d)
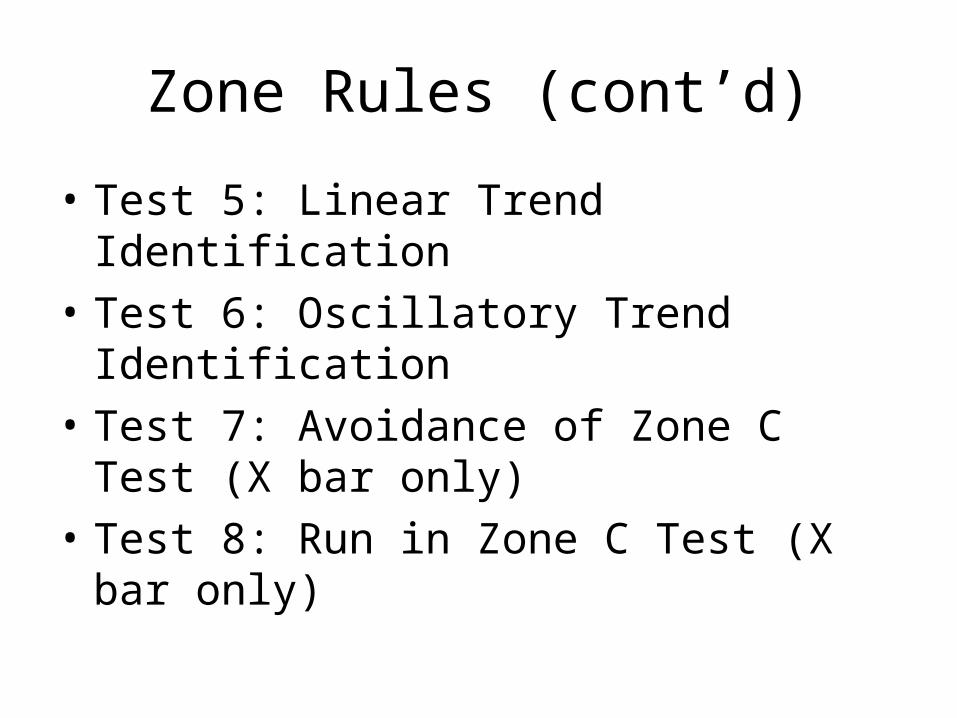
• Test 5: Linear Trend Identification
• Test 6: Oscillatory Trend Identification
• Test 7: Avoidance of Zone C Test (X bar only)
• Test 8: Run in Zone C Test (X bar only)
Examples
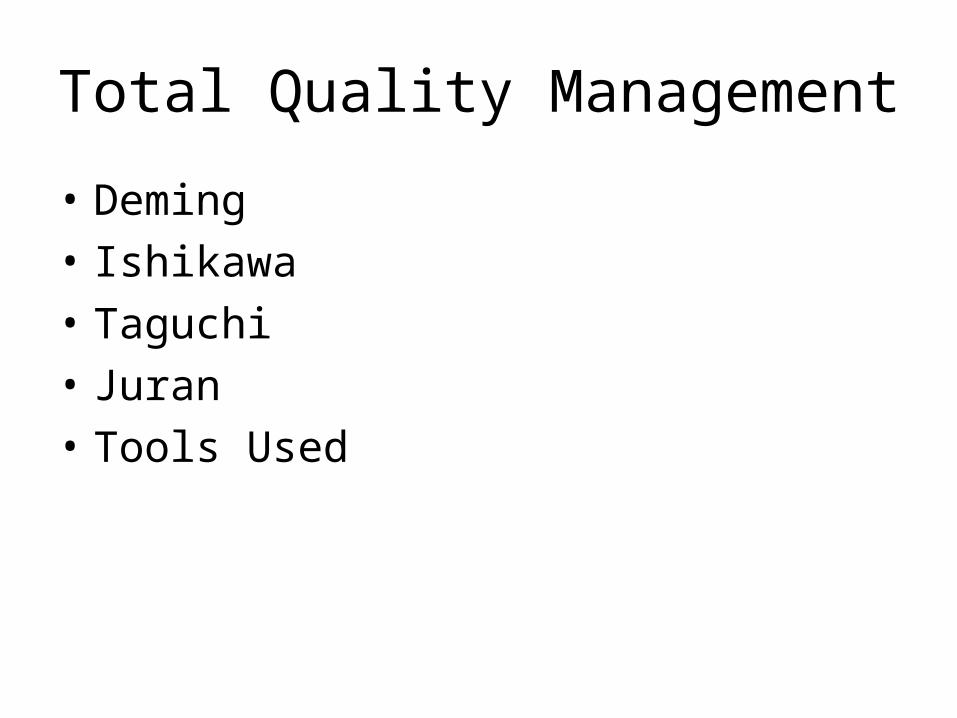
Total Quality Management
• Deming
• Ishikawa
• Taguchi
• Juran
• Tools Used
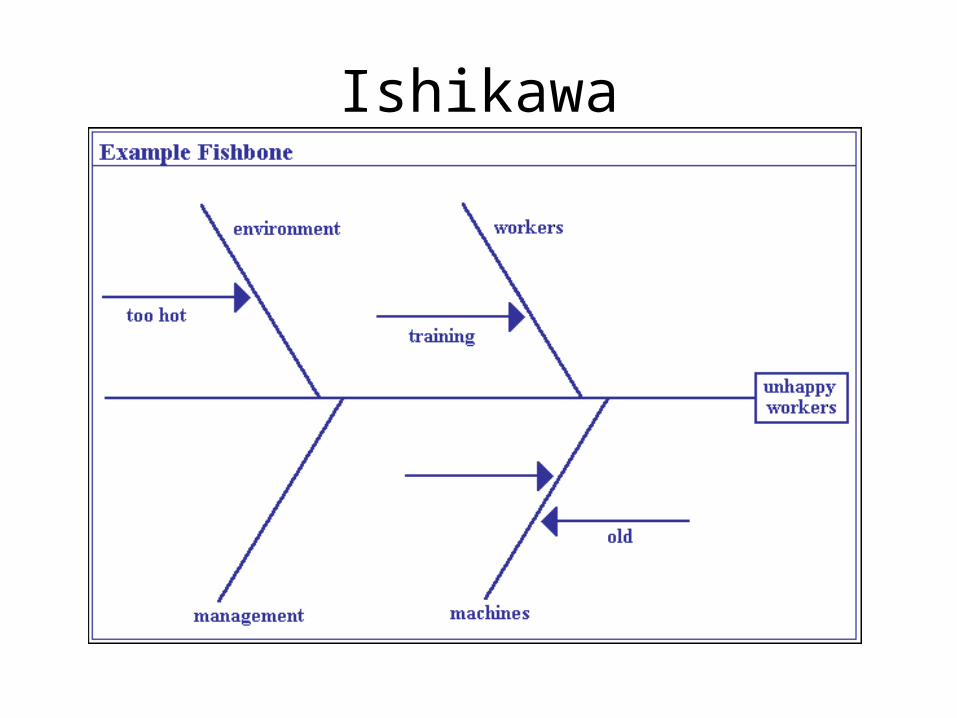
Ishikawa
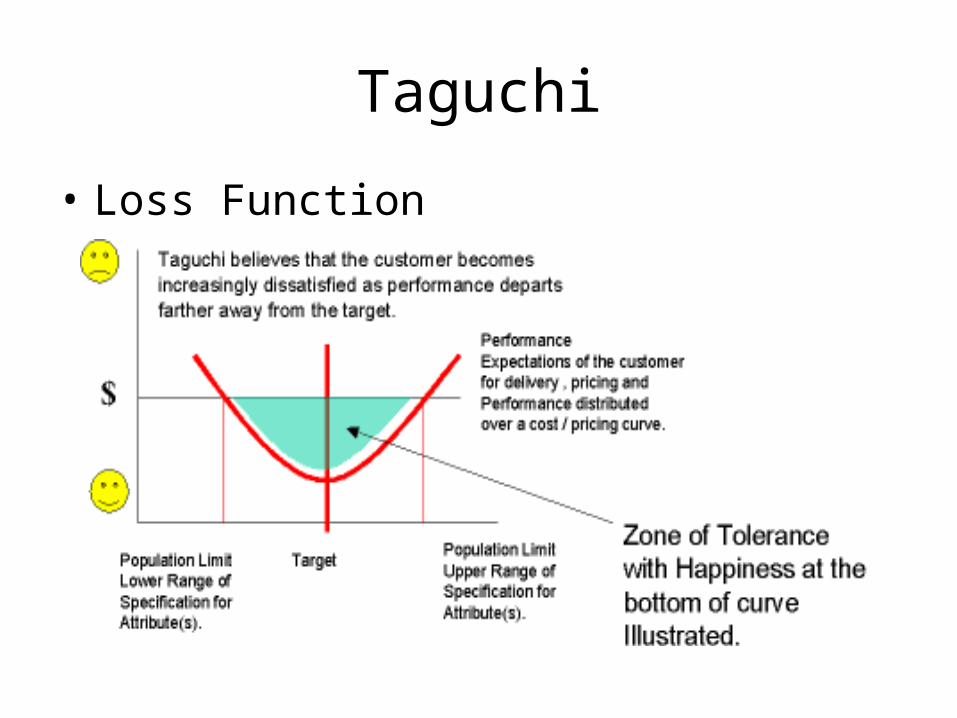
Taguchi
• Loss Function
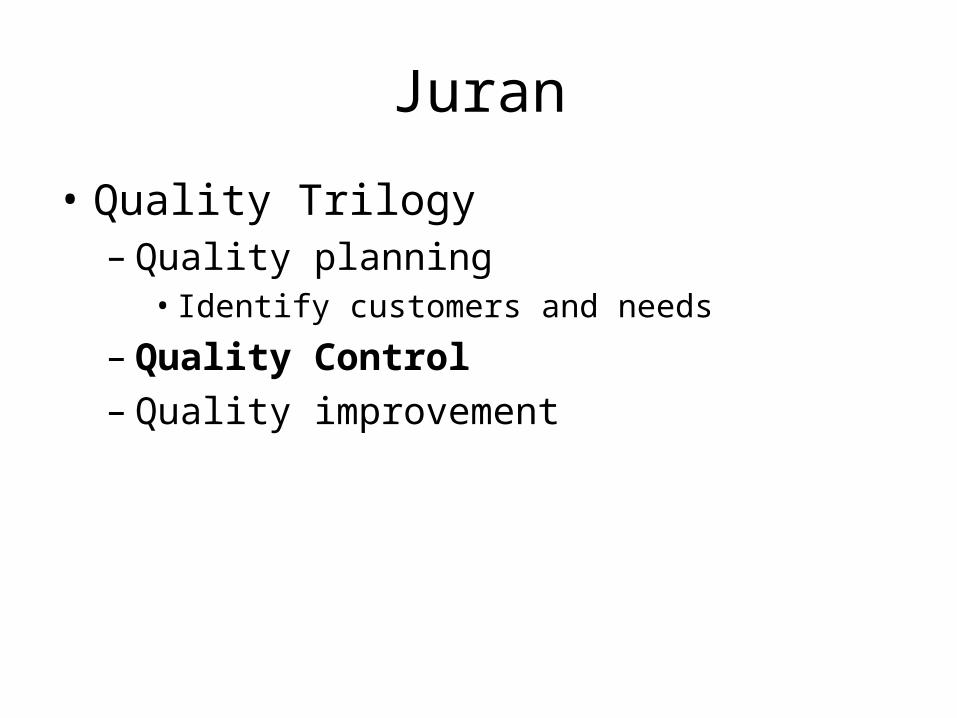
Juran
• Quality Trilogy– Quality planning
• Identify customers and needs
– Quality Control– Quality improvement
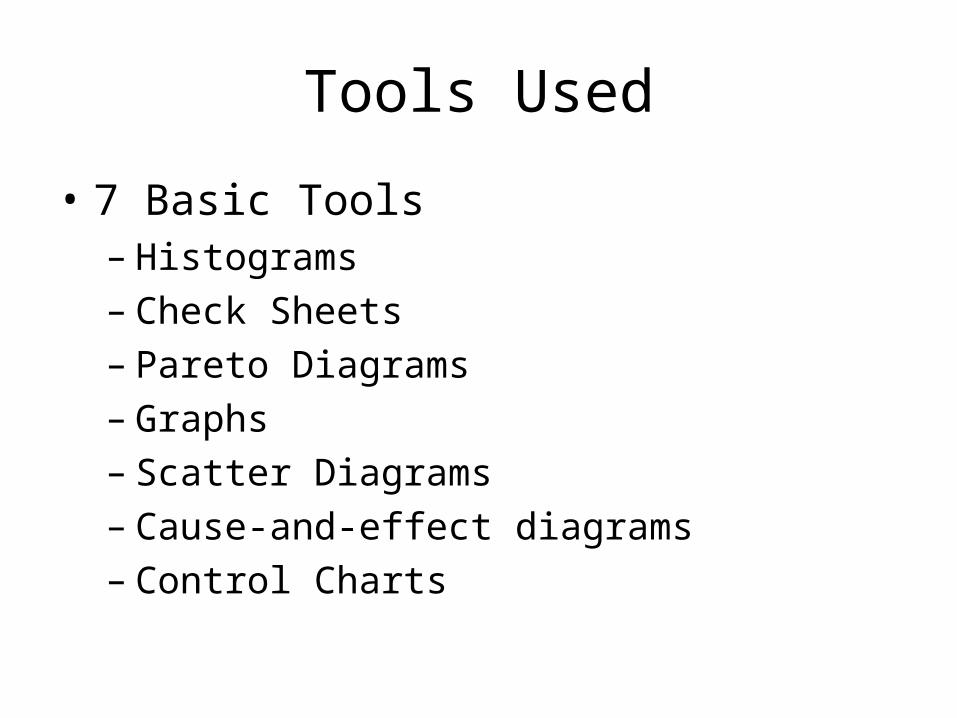
Tools Used
• 7 Basic Tools– Histograms – Check Sheets– Pareto Diagrams – Graphs– Scatter Diagrams– Cause-and-effect diagrams– Control Charts
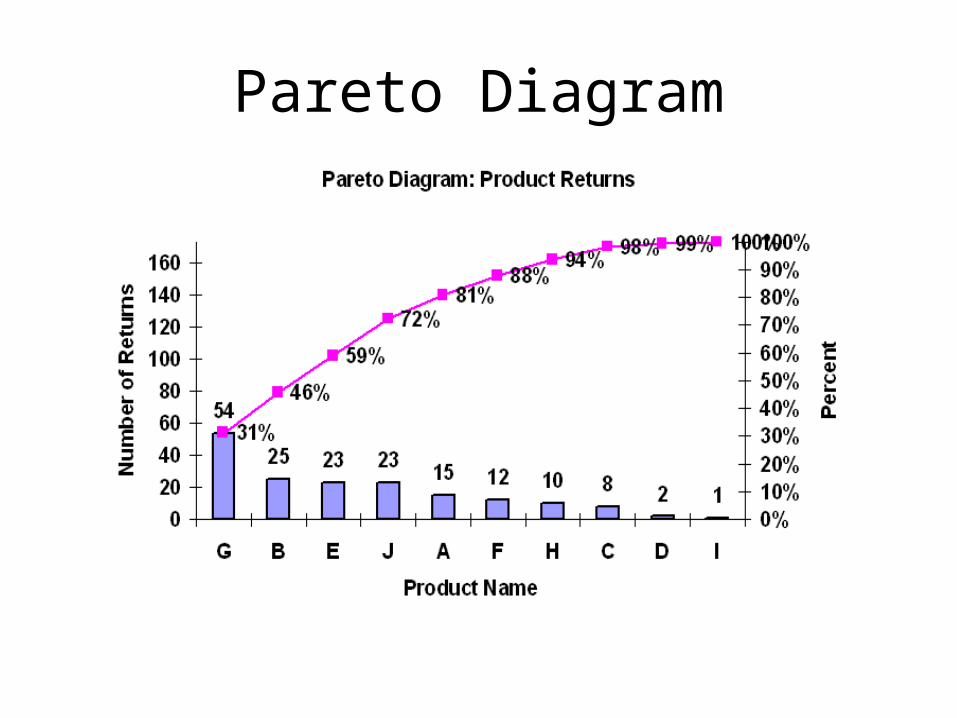
Pareto Diagram
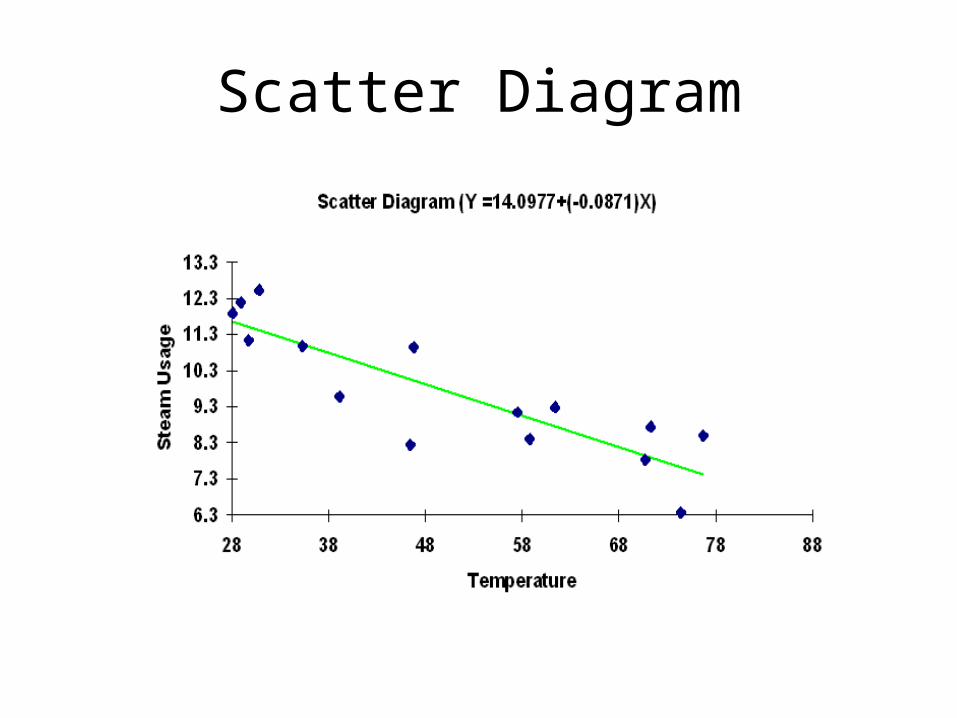
Scatter Diagram
Quality Standards
• ISO Standards
• Kano models
• Blue Bird examples (pg.85-103)
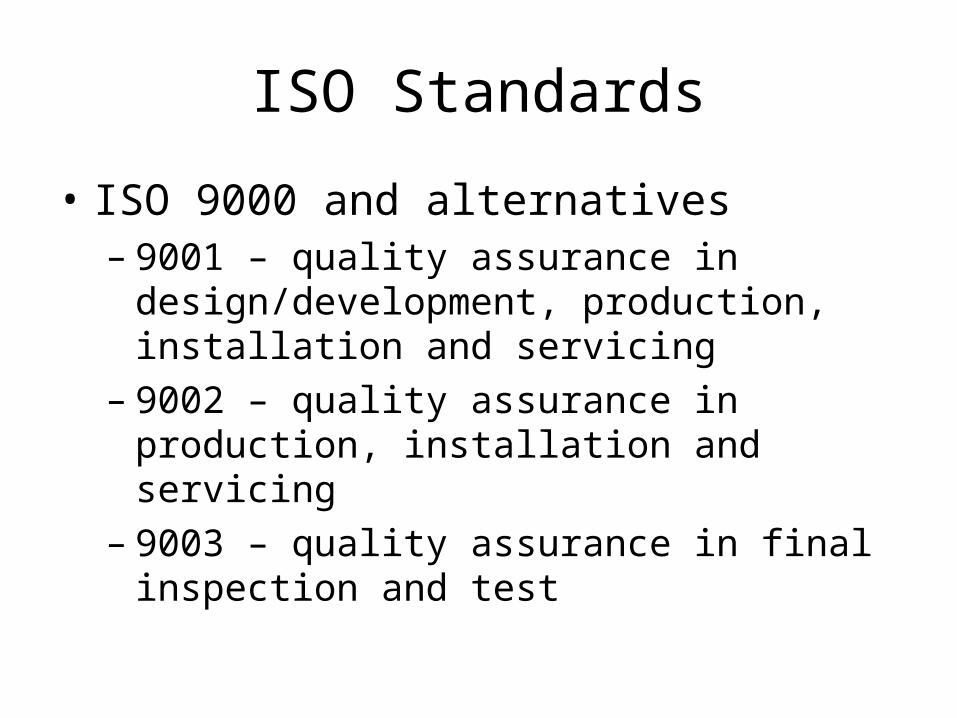
ISO Standards
• ISO 9000 and alternatives– 9001 – quality assurance in
design/development, production, installation and servicing
– 9002 – quality assurance in production, installation and servicing
– 9003 – quality assurance in final inspection and test
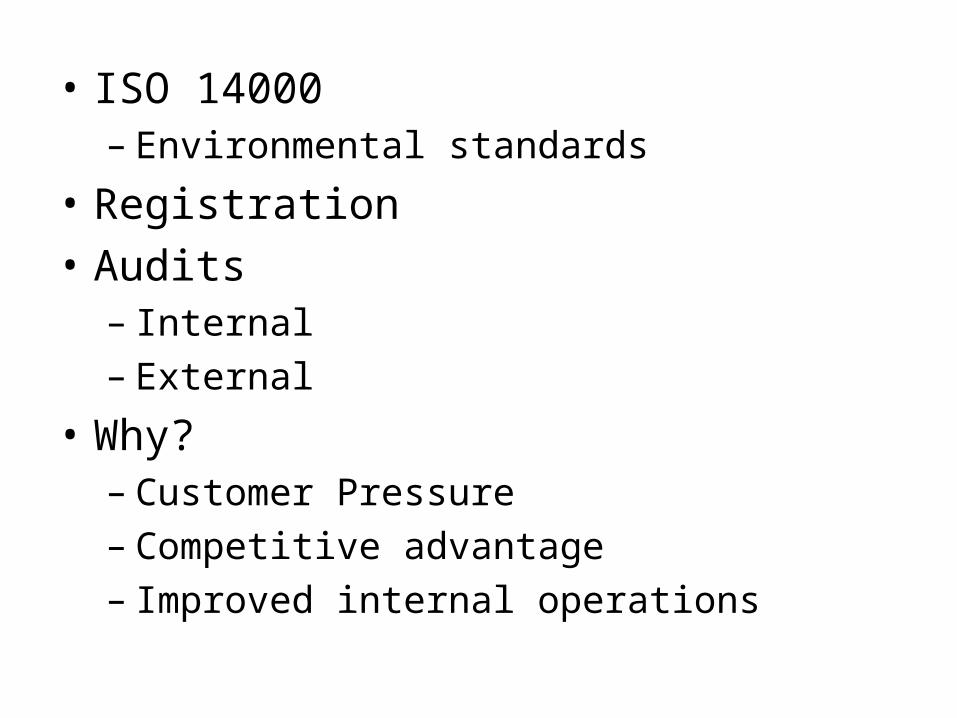
• ISO 14000– Environmental standards
• Registration
• Audits– Internal– External
• Why?– Customer Pressure– Competitive advantage– Improved internal operations
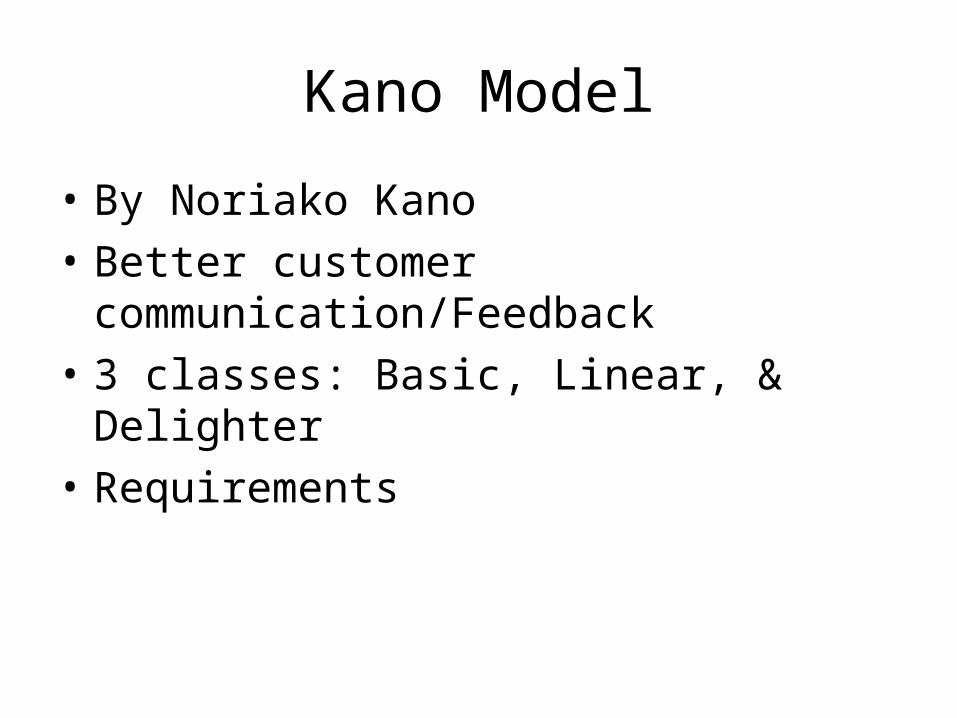
Kano Model
• By Noriako Kano
• Better customer communication/Feedback
• 3 classes: Basic, Linear, & Delighter
• Requirements
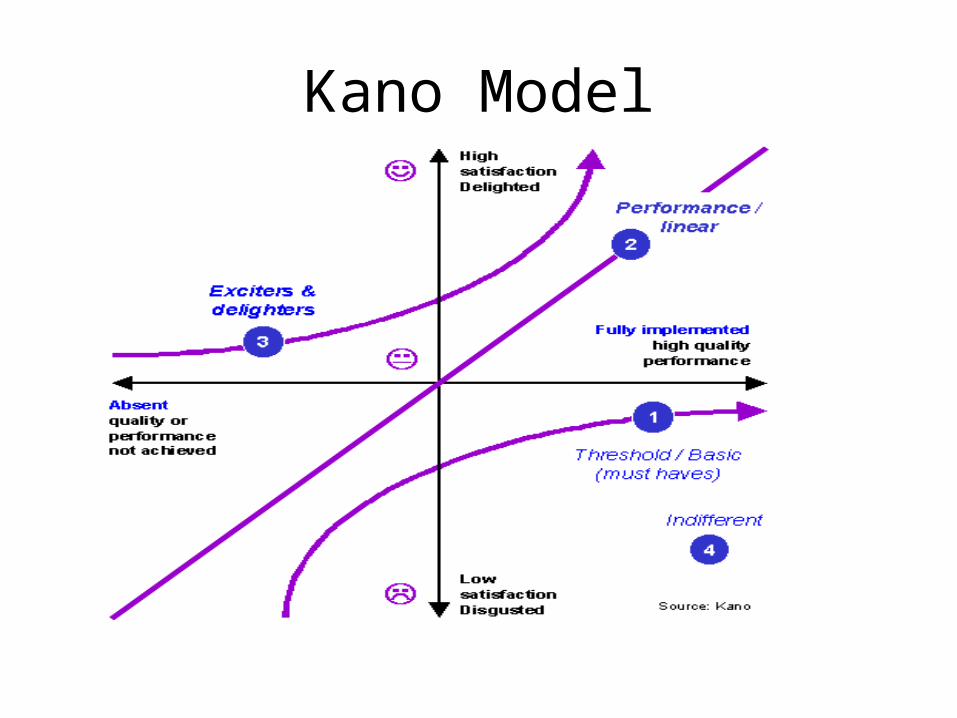
Kano Model
Conclusion
• Quality Control, Total Quality Management, and Quality Standards are related
• Many more tools are used
Acknowledgements
Berger, Roger W., The Certified quality engineer handbook
Besterfield, Dale H., Total quality management 2nd ed. Devor, Richard E., Statistical quality design and controlPeach, Robert W., The ISO 9000 handbook 3rd ed.Rao, Ashok., Total quality management: a cross
functional perspectivewww.ISO.orgwww.qualityamerica.comwww.spcforexcel.com

Questions?