qlik sense for beginners - osse · qlik sense is a next-generation self-service data visualization...
TRANSCRIPT

Qlik Sense for Beginners

Table of Contents
INTRODUCTION 3
WORKSHOP OBJECTIVES 3 WORKSHOP PRE-REQUISITES 3 SIGNING IN TO QLIK SENSE 3 SLED REPORTS WEBPAGE 4
APPLICATIONS 5
DATA FLOW 6 ACCESSING THE QLIK SENSE APPLICATION 6
EXERCISES 7
1. FILTER YOUR DATA 7 2. INTERACT WITH YOUR DATA 8 3. SEARCH FOR DATA 10 4. BOOKMARKING FILTERS 11
APPENDIX A: RESOURCES 14
APPENDIX B: DESCRIPTION OF CURRENT QLIK APPLICATIONS 15

QLIK SENSE FOR BEGINNERS 3
Introduction
Qlik® Sense – The Next Generation of Visual Analytics
Qlik Sense is a next-generation self-service data visualization application that empowers people to easily create a range of flexible, interactive visualizations that drive exploration and discovery using one’s intuition. With the proven QIX Associative Data Indexing engine at its core, Qlik Sense delivers:
• A cutting-edge self-service visualization and discovery experience • Associative exploration and smart search • Advanced data visualization • User-driven, drag-and-drop creation • Collaboration and storytelling • Unsurpassed mobility • Best-of-breed custom development • Powerful data integration • Governed enterprise capabilities and performance
Workshop Objectives This workshop is designed to introduce you to Qlik Sense. Qlik Sense will help you answer the following questions regarding your data. • How many total students do we have in various wards? • What do our students look like across all the races and ethnicity for a specific year or gender? • What does our proficiency look like over time by level? • What is our least proficient subject? • Which campus locations have the most number of below basic assessments?
Workshop Pre-Requisites In order to access Qlik, a user must complete two steps:
1. Obtain credentials to the Statewide Longitudinal Education Data (SLED) website.
• To receive SLED credentials, send an email to [email protected]
2. Receive a token from the Office of the State Superintendent of Education (OSSE).
• OSSE will automatically grant tokens to LEA Data Managers, Heads of Schools and LEA Special Education Points of Contacts if listed eSchoolPLUS. If an LEA would like to request additional staff members to receive tokens, send an email to [email protected].
• LEA Data Managers are responsible for updating the Points of Contact list in eSchoolPLUS.
Signing in to Qlik Sense SLED users with access to the Qlik Sense Hub can access through the following two (2) methods:

QLIK SENSE FOR BEGINNERS 4
SLED Reports Webpage 1. Navigate to the SLED Login page at: https://sled.osse.dc.gov 2. Click on the Reports dropdown and click on the OSSE Analysis Tool link:
Qlik Sense Hub Direct Link 1. Navigate to https://analysis.osse.dc.gov to access the Qlik Sense login screen. 2. Login to Qlik Sense with your SLED username and password.

QLIK SENSE FOR BEGINNERS 5
Upon successful authentication, the Qlik Sense Hub will display as shown below. There will be multiple streams based on permissions. By default, the LEA and OSSE streams will be listed.
• The LEA stream – contains applications applicable to the LEA and may contain Student Level Data. NOTE: All Student Level Data will only appear if the student is associated with the LEA.
• The OSSE stream – contains applications with general state level data applicable to all LEAs.
Applications The availability of applications within Qlik is determined based on your SLED credentials. Below is a list of the applications within Qlik:
1. 9th Grade Transition 2. PARCC and MSAA Results 3. SY15-16 Attendance Anomalies 4. SY15-16 Charter Sector Attendance 5. SY15-16 Related Service Management Report (RSMR) 6. SY15-16 SLED Roster and Assessments 7. SY16-17 Charter Sector Attendance 8. SY16-17 DCPS Attendance 9. SY16-17 Related Service Management Report (RSMR) 10. SY16-17 Unified Data Errors
QLIK SENSE FOR BEGINNERS 6
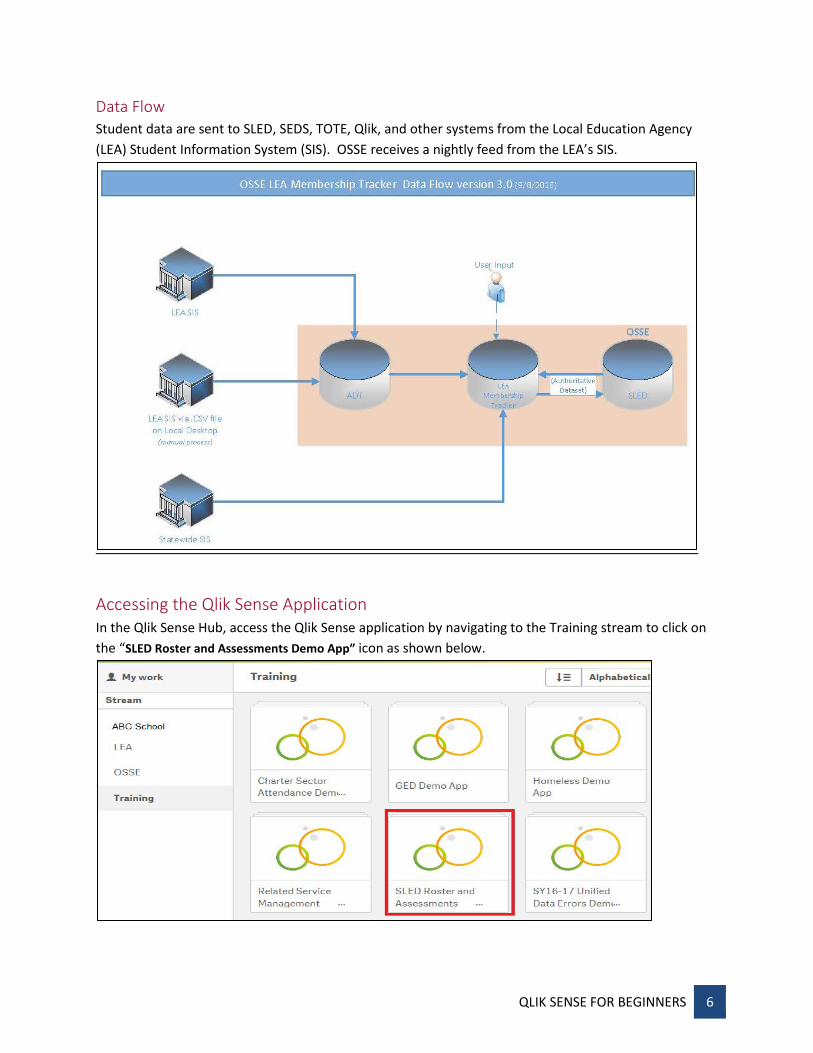
Data Flow Student data are sent to SLED, SEDS, TOTE, Qlik, and other systems from the Local Education Agency (LEA) Student Information System (SIS). OSSE receives a nightly feed from the LEA’s SIS.
Accessing the Qlik Sense Application In the Qlik Sense Hub, access the Qlik Sense application by navigating to the Training stream to click on the “SLED Roster and Assessments Demo App” icon as shown below.
QLIK SENSE FOR BEGINNERS 7
EXERCISES
In this first section, you will learn how to interact with the data in Qlik.
1. From the Qlik Sense Hub, confirm that the application titled SLED Roster and Assessments Demo App is open. If not, open the application, by clicking on it.
2. Click on the Student Assessments’ tab.
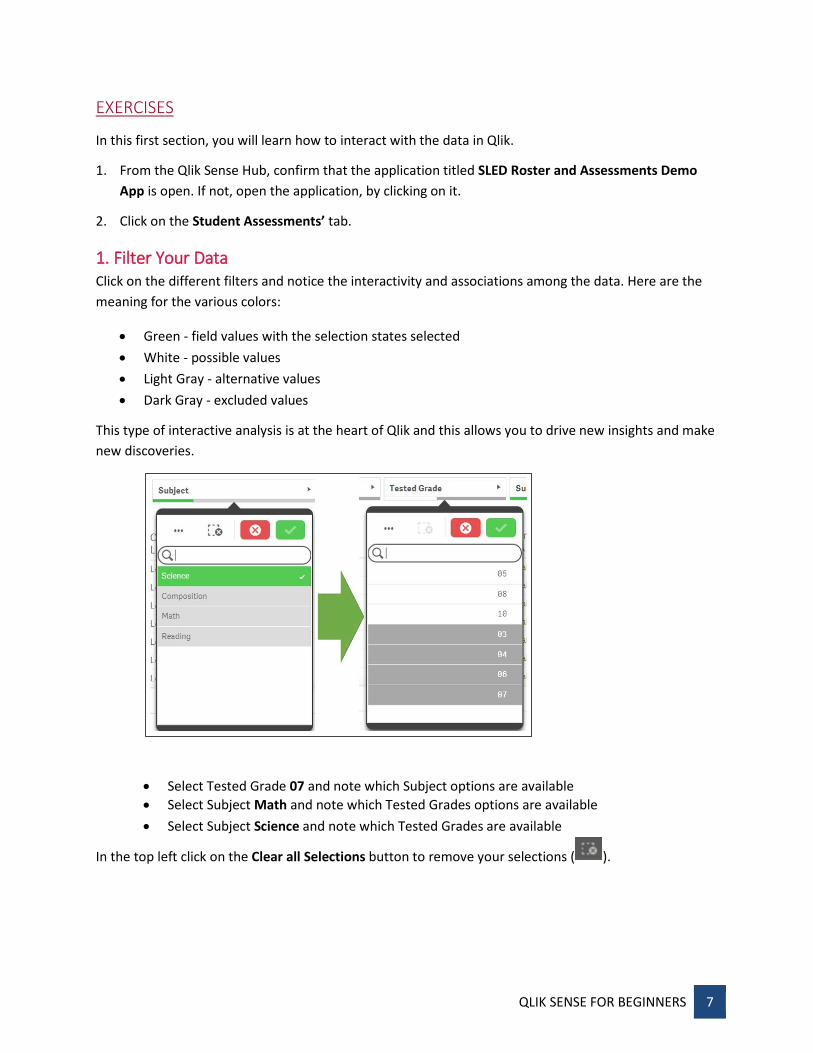
1. Filter Your Data Click on the different filters and notice the interactivity and associations among the data. Here are the meaning for the various colors:
• Green - field values with the selection states selected • White - possible values • Light Gray - alternative values • Dark Gray - excluded values
This type of interactive analysis is at the heart of Qlik and this allows you to drive new insights and make new discoveries.
• Select Tested Grade 07 and note which Subject options are available • Select Subject Math and note which Tested Grades options are available • Select Subject Science and note which Tested Grades are available
In the top left click on the Clear all Selections button to remove your selections ( ).

QLIK SENSE FOR BEGINNERS 8
2. Interact With Your Data
1. Click the top right hand drop-down that currently says Student Assessments’ Data
2. Click on the Overview (SY 15-16) Chart sheet 3. Click on the Clear all Selections button to remove your selections
4. In the chart entitled Ward of Residence, click on the horizontal bars with ward data to filter for that value. Notice how all of the other visuals on the sheet update.

QLIK SENSE FOR BEGINNERS 9
In addition to a single selection, multiple selections can be made by highlighting multiple values.
5. On the Grade Level chart, move the data view window to see more of the data.

QLIK SENSE FOR BEGINNERS 10
3. Search for Data
1. In the top right corner, click on the Search icon . 2. Type in ‘ward’. Notice all of the data fields that come up that meet that requirement.
3. Click one of these search results and notice the application update.
4. In the top right hand corner, click on the global selector icon . The global selector allows you to filter on any value that appears in your data set. Click on a few values. Click back on the global selector icon to see these filters applied.
5. Clear all selections.

QLIK SENSE FOR BEGINNERS 11
6. You can also do more complex searches, such as:
a. In the top right corner, click on the Search icon. b. Type in ‘advanced math ward 4’. Notice how Qlik makes several suggestions. This is part of
the Smart Search capabilities. Select the first suggestion in the list in the gray bar to see all data related to Ward 4 and Advanced Math.
7. Clear all selections and do not save the changes.
4. Bookmarking Filters
1. From the Qlik Sense Hub, confirm that the application titled Charter Sector Attendance Demo App is open. If not, open the application, by clicking on it.
2. Click on the Monthly Attendance sheet.
3. Click on Grade and select 07.

QLIK SENSE FOR BEGINNERS 12
4. On the pie chart, select NS and NA.
4. Click on the bookmark icon .
5. Click on Create new bookmark.

QLIK SENSE FOR BEGINNERS 13
6. Create a title for the bookmark.
7. Click off of the dialogue box and the bookmark will automatically save.
8. To retrieve the bookmark, go back to the Charter Sector Attendance Demo App sheet, click on Bookmarks.

QLIK SENSE FOR BEGINNERS 14
Appendix A: Resources Topic Location of Resource
SLED To receive access to SLED, send an email to [email protected]
Technical Assistance For technical assistance, send an email to [email protected] or submit a ticket in the OSSE Support Tool.
2016-17 School Year Unified Data Errors Guidance
http://osse.dc.gov/publication/2016-17-school-year-unified-data-errors
Entry and Exit Code Guidance http://osse.dc.gov/service/entry-codes-exit-codes-and-enrollment
eSchoolPLUS For assistance adding Points of Contact or updating calendars, go to http://osse.dc.gov/publication/eschoolplus-lea-calendars-and-lea-points-contact
LEA Data Mapping Application http://osse.dc.gov/publication/lea-data-mapping-application
Special Education Data System (SEDS)
https://osse.pcgeducation.com/ (Each LEA has a different SEDS site) SEDS Resource Site - https://sites.google.com/a/dc.gov/seds-help-resources/

QLIK SENSE FOR BEGINNERS 15
Appendix B: Description of Current Qlik Applications
Name of Application Description 9th Grade Transition To support high schools to smooth the transition
from eighth to ninth grade. PARCC and MSAA Results SY15-16 PARCC and MSAA results SY15-16 Attendance Anomalies It contains historical attendance anomalies.
SY15-16 Charter Sector Attendance It contains historical attendance data.
SY15-16 Related Service Management Report (RSMR)
The RSMR is a report that compares the amount of time a related service is prescribed on a student’s IEP to the amount of time the service is actually provided. The RSMR is based on data entered by the service provider via the Service Logging Wizard in SEDS.
SY15-16 SLED Roster and Assessments It contains historical enrollment and demographic data.
SY16-17 Charter Sector Attendance It contains attendance data. SY16-17 DCPS Attendance It contains attendance data. SY16-17 Related Service Management Report (RSMR)
The RSMR is a report that compares the amount of time a related service is prescribed on a student’s IEP to the amount of time the service is actually provided. The RSMR is based on data entered by the service provider via the Service Logging Wizard in SEDS.
SY16-17 Unified Data Errors OSSE has consolidated all demographic, enrollment, attendance and special education data errors and anomalies to provide LEAs with a comprehensive error report in the Statewide Longitudinal Education Data System (SLED) and Qlik.