qinetiq approach to performance based contracting (pbc ... performance... · 5. pbc training •...
TRANSCRIPT
© Copyright QinetiQ Limited 2012
[QinetiQ Proprietary]
QinetiQ approach to Performance Based Contracting (PBC)
SCAF WorkshopTuesday 7th February 2012The BAWA Centre, Filton, Bristol
Dale [email protected]
John [email protected]

[QinetiQ Proprietary]
© Copyright QinetiQ Limited 2012
Context
• NAO Major Projects Report 2011 – 11.4% project cost increases above the approval
• Projects need to be delivered to Time –Cost – Quality
• It’s time to change the culture and behaviour
• PBC is a different approach relating performance to payment with consequences.
NAO Report: Management of the Typhoon ProjectMarch 2011

[QinetiQ Proprietary]
© Copyright QinetiQ Limited 2012
Contents
1. What is a Performance Based Contract (PBC)?
2. Introduction to Performance Based Contracting (PBC)
3. Goals of a Performance Based Contract
4. Methodology for Developing an Effective PBC Framework
5. PBC Training
6. Conclusion
3

[QinetiQ Proprietary]
© Copyright QinetiQ Limited 2012
1. What is a Performance Based Contract (PBC)?
Simply put:
• Contractual Framework for the delivery of products or services where payment is directly related to performance
• When set fairly they can influence the Supplier’s behaviours and culture to create a ‘win-win’ situation
4

[QinetiQ Proprietary]
© Copyright QinetiQ Limited 2012
1. What is a Performance Based Contract (PBC)?• Performance related (‘At Risk’) margin
− The fee or profit margin that is ‘At Risk’against performance.
− KPI’s are used to model the percentage of fee to be paid regardless of costs
• Non-Performance related cost
− Operating and Support cost modelling is influenced by the system design reliability. Event based cost modelling is dependent upon the reliability and serviceability of the system that has been established early in the system lifecycle.
− Cost saving options are typically related to maintenance concepts, spares availability (ranging and scaling) and Mean Time to Repair (MTTR).
Cost
At RiskMargin
Contra
ct Price
Payment related to Achieved Performance
Cost relating to Reliability (MTBF) event based cost modelling
5
[QinetiQ Proprietary]
© Copyright QinetiQ Limited 2012
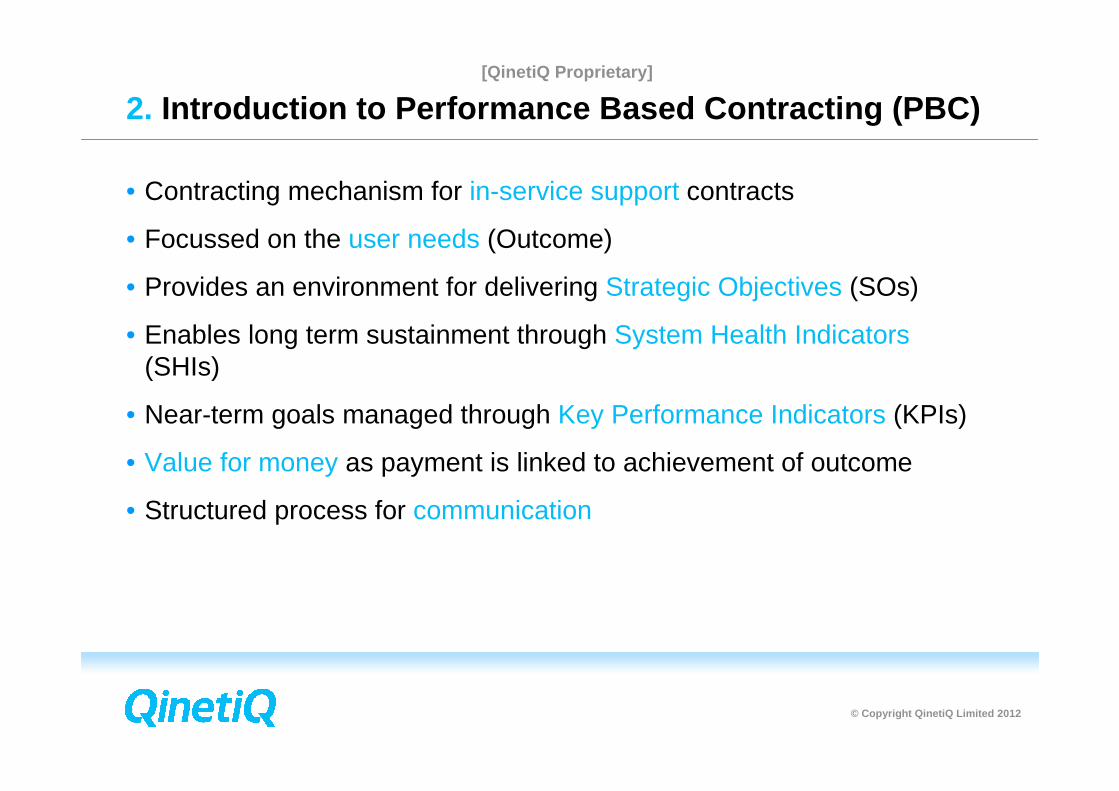
2. Introduction to Performance Based Contracting (PBC)
• Contracting mechanism for in-service support contracts
• Focussed on the user needs (Outcome)
• Provides an environment for delivering Strategic Objectives (SOs)
• Enables long term sustainment through System Health Indicators(SHIs)
• Near-term goals managed through Key Performance Indicators (KPIs)
• Value for money as payment is linked to achievement of outcome
• Structured process for communication
6

[QinetiQ Proprietary]
© Copyright QinetiQ Limited 2012
3. Goals of a Performance Based Contract
7
So what is fair?
Contracting AgencyPerspectiveAssure consistent performance of the product or service against Key Performance Indicators (KPIs) in a Value for Money (VfM) manner
Contractor PerspectiveAssure a stable, (growing)
minimum specified profit margin that is related to the
Contractor’s level of Responsibility
[QinetiQ Proprietary]
© Copyright QinetiQ Limited 2012
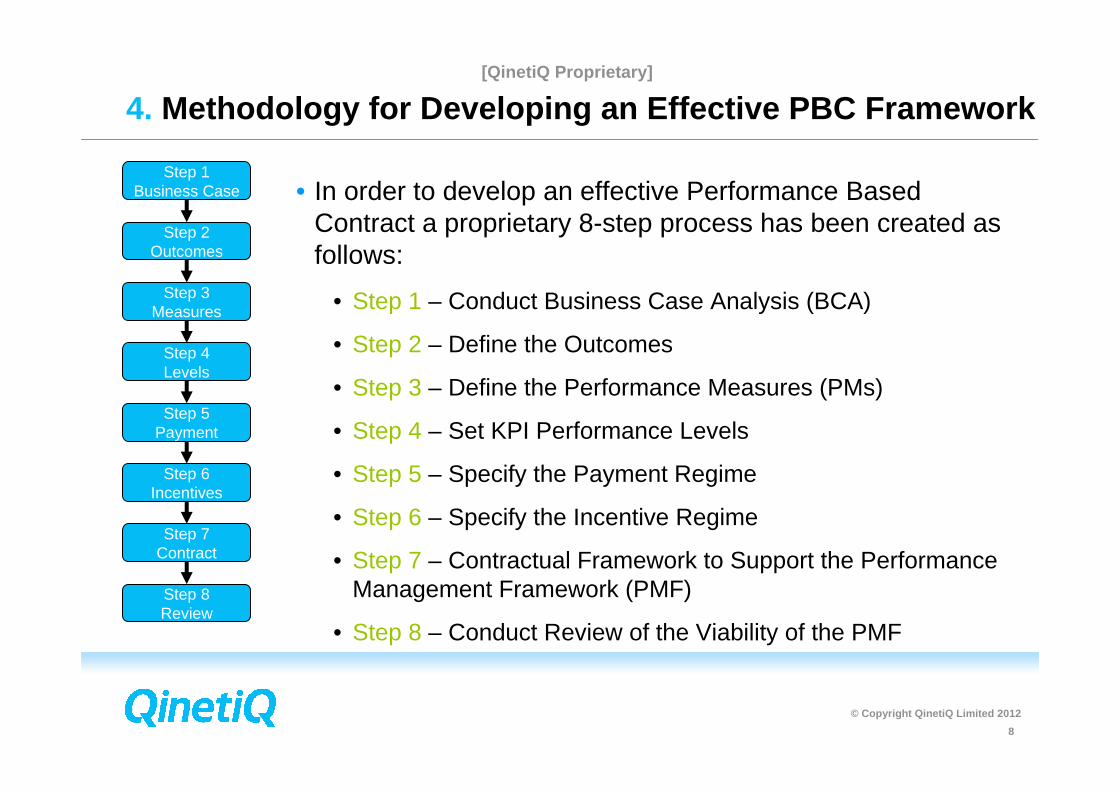
4. Methodology for Developing an Effective PBC Framewo rk
• In order to develop an effective Performance Based Contract a proprietary 8-step process has been created as follows:
• Step 1 – Conduct Business Case Analysis (BCA)
• Step 2 – Define the Outcomes
• Step 3 – Define the Performance Measures (PMs)
• Step 4 – Set KPI Performance Levels
• Step 5 – Specify the Payment Regime
• Step 6 – Specify the Incentive Regime
• Step 7 – Contractual Framework to Support the Performance Management Framework (PMF)
• Step 8 – Conduct Review of the Viability of the PMF
8
Step 1Business Case
Step 2Outcomes
Step 3Measures
Step 4Levels
Step 5Payment
Step 6Incentives
Step 7Contract
Step 8Review
[QinetiQ Proprietary]
© Copyright QinetiQ Limited 2012
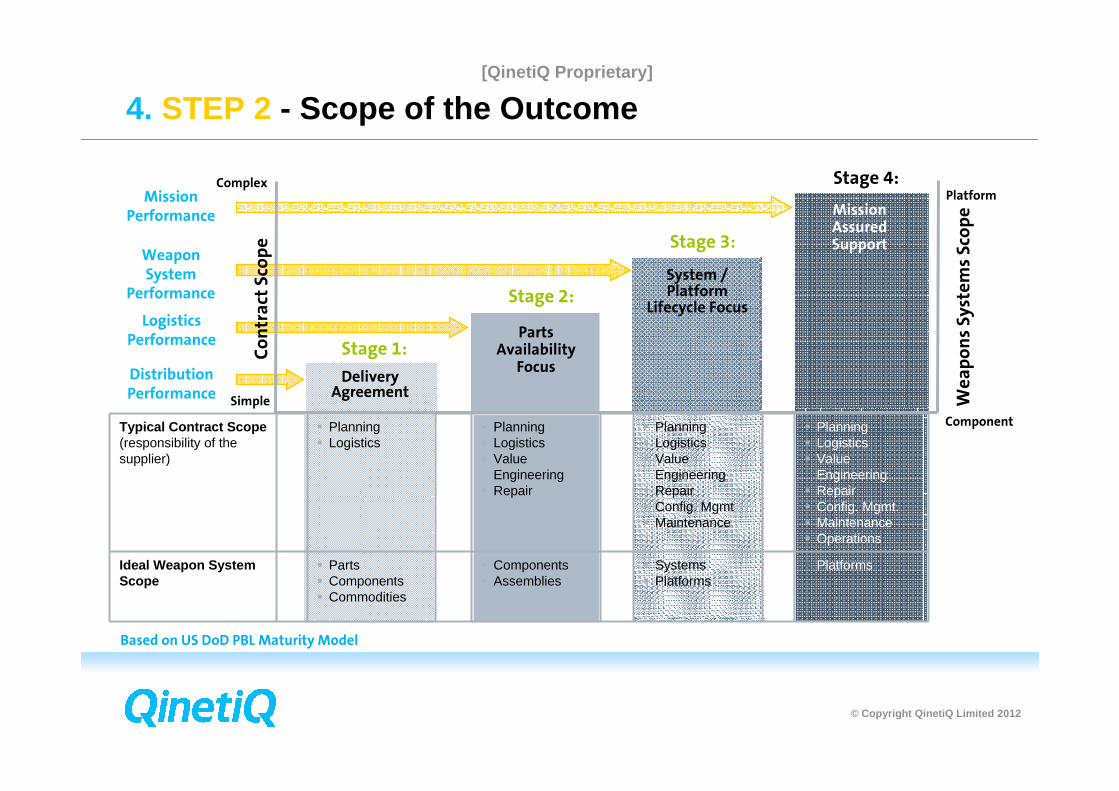
4. STEP 2 - Scope of the Outcome
Typical Contract Scope (responsibility of the supplier)
� Planning� Logistics
� Planning� Logistics� Value
Engineering� Repair
� Planning� Logistics� Value
Engineering� Repair� Config. Mgmt� Maintenance
� Planning� Logistics� Value
Engineering� Repair� Config. Mgmt.� Maintenance� Operations
Ideal Weapon System Scope
� Parts� Components� Commodities
� Components� Assemblies
� Systems� Platforms
� Platforms
Component
Platform
Weapons Systems Scope
Stage 2:
Stage 1:
Stage 3:
Stage 4:
Delivery Agreement
Parts Availability
Focus
System / Platform
Lifecycle Focus
Mission AssuredSupport
Contract Scope
DistributionPerformance
Weapon System
Performance
Mission Performance
Logistics Performance
Simple
Complex
Based on US DoD PBL Maturity Model
9

[QinetiQ Proprietary]
© Copyright QinetiQ Limited 2012
4. STEP 3 - Role of a Performance Measure (PM)
Question: What is the role of a PM?
10
CommunicationBuyer Seller
PMs communicatethe need
PMs communicate the performance delivered
Step 1Business Case
Step 2Outcomes
Step 3Measures
Step 4Levels
Step 5Payment
Step 6Incentives
Step 7Contract
Step 8Review

[QinetiQ Proprietary]
© Copyright QinetiQ Limited 2012
4. STEP 3 - Choosing the Right Performance Measure
Outcome

[QinetiQ Proprietary]
© Copyright QinetiQ Limited 2012
4. STEP 3 - Choosing the Right Performance Measure
How to choose the right one?
Be S.M.A.R.T.!
• S – Specific, but also systematic, synergistic, and significant
• M - Measurable, but also meaningful, memorable and motivating
• A – Achievable, but also accountability and agreed-upon
• R – Reliable, but also realistic, reasonable, resonating, results-oriented, rewarding, responsible, relevant and rooted in facts
• T – Timely and it also represents timely, tangible and thoughtful
12

[QinetiQ Proprietary]
© Copyright QinetiQ Limited 2012
4. STEP 3 - PMs for Complex Materiel
13
Availability
Reliability Sustainability Maintainability
How often breaks/needs maintenance
Time required to conduct maintenance
Time waiting for resources (e.g. spares)
Derived KPI of these sub-KPIs
Describes theCurrent Mission
Describes the support for the next mission
[QinetiQ Proprietary]
© Copyright QinetiQ Limited 2012
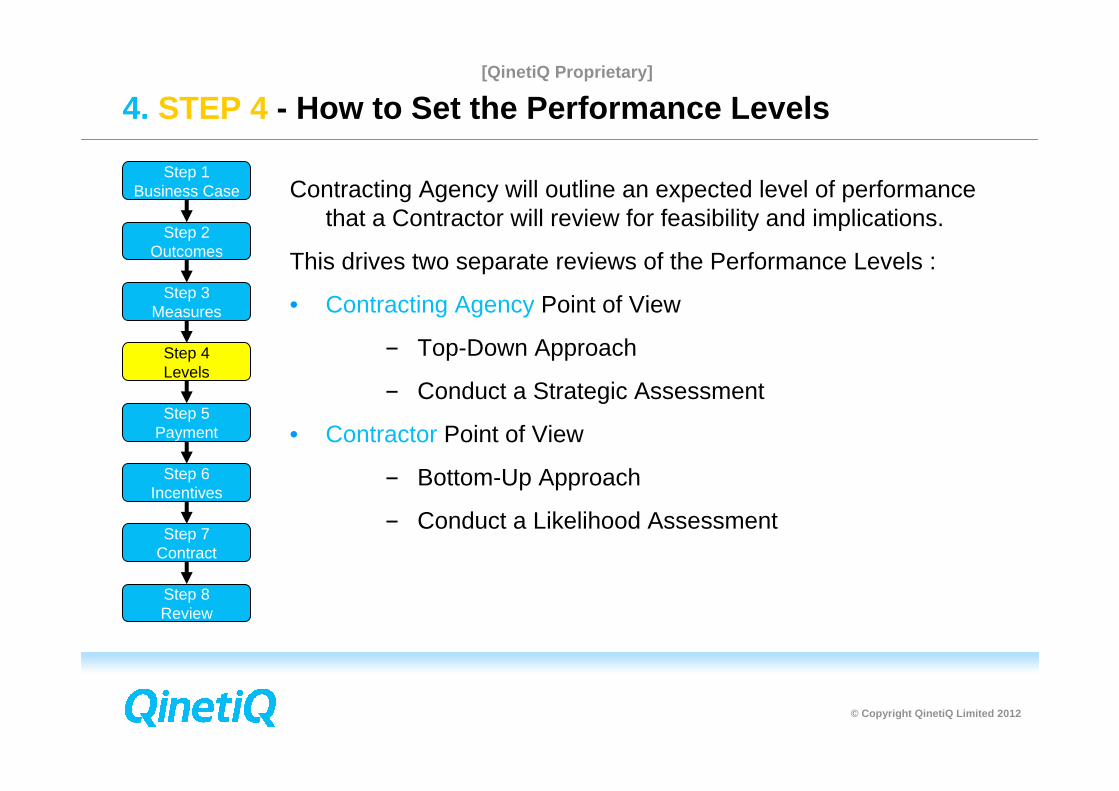
4. STEP 4 - How to Set the Performance Levels
Contracting Agency will outline an expected level of performancethat a Contractor will review for feasibility and implications.
This drives two separate reviews of the Performance Levels :
• Contracting Agency Point of View
− Top-Down Approach
− Conduct a Strategic Assessment
• Contractor Point of View
− Bottom-Up Approach
− Conduct a Likelihood Assessment
14
Step 1Business Case
Step 2Outcomes
Step 3Measures
Step 4Levels
Step 5Payment
Step 6Incentives
Step 7Contract
Step 8Review

[QinetiQ Proprietary]
© Copyright QinetiQ Limited 2012
15
Tools:•LITS•USAS•CRISP•FLIS
Historical Analysis
Raw DataRaw Data
Likelihood
e.g. Availability
Performance
Metrics and GR&AData Collection
Systems:Maintenance SystemWarehousing System
Metrics:Aircraft AvailabilityMission Success
Stock Effectiveness
Data Extraction Data Cleansing Likelihood Assessment
Tools:•OPUS10•OPSIM•AR&M Analysis•Excel•Professional Judgement
Predictive Data
4. STEP 4 - How to Set the Performance Levels

[QinetiQ
Proprietary]
©C
opyright QinetiQ
Limited 2012
4.ST
EP
4-
Historic data
Daily num
ber of serviceable aircraft
0 2 4 6 8 10 12 14
01/01/2010
15/01/2010
29/01/2010
12/02/2010
26/02/2010
12/03/2010
26/03/2010
09/04/2010
23/04/2010
07/05/2010
21/05/2010
04/06/2010
18/06/2010
02/07/2010
16/07/2010
30/07/2010
13/08/2010
27/08/2010
10/09/2010
24/09/2010
08/10/2010
22/10/2010
05/11/2010
19/11/2010
03/12/2010
17/12/2010
31/12/2010
Date
Number of serviceable aircraft
[QinetiQ Proprietary]
© Copyright QinetiQ Limited 2012
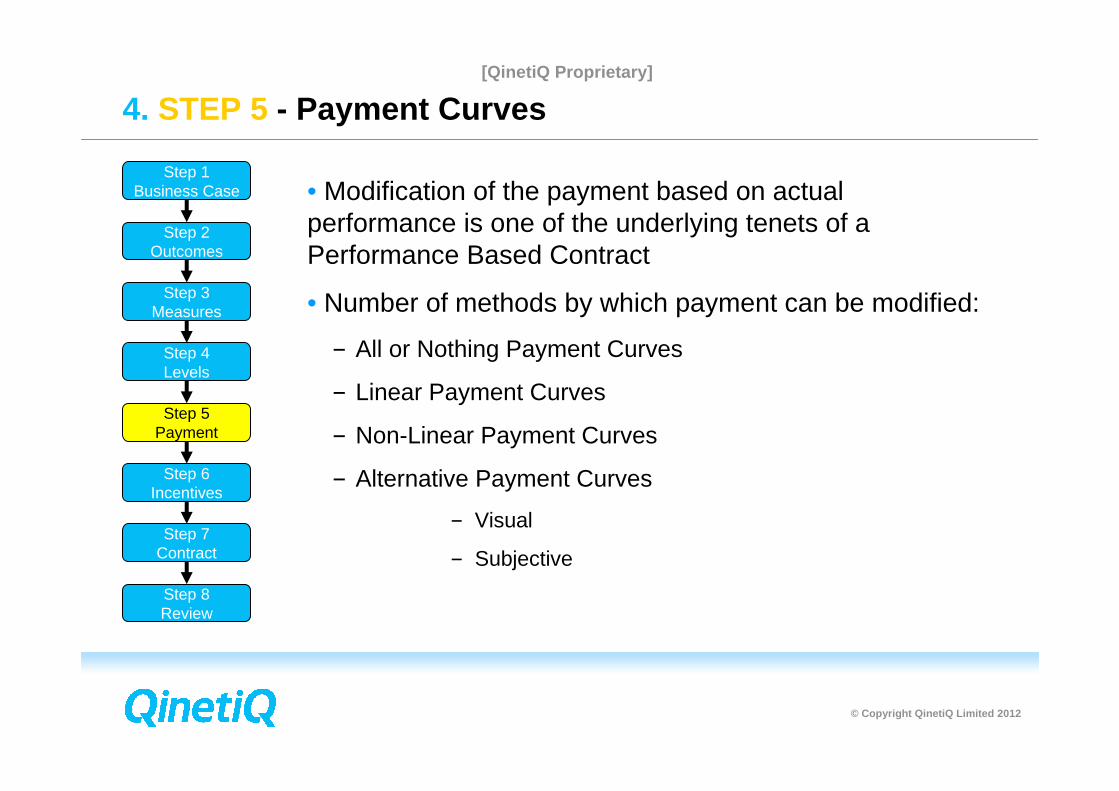
4. STEP 5 - Payment Curves
• Modification of the payment based on actual performance is one of the underlying tenets of a Performance Based Contract
• Number of methods by which payment can be modified:
− All or Nothing Payment Curves
− Linear Payment Curves
− Non-Linear Payment Curves
− Alternative Payment Curves
− Visual
− Subjective
17
Step 1Business Case
Step 2Outcomes
Step 3Measures
Step 4Levels
Step 5Payment
Step 6Incentives
Step 7Contract
Step 8Review
[QinetiQ Proprietary]
© Copyright QinetiQ Limited 2012
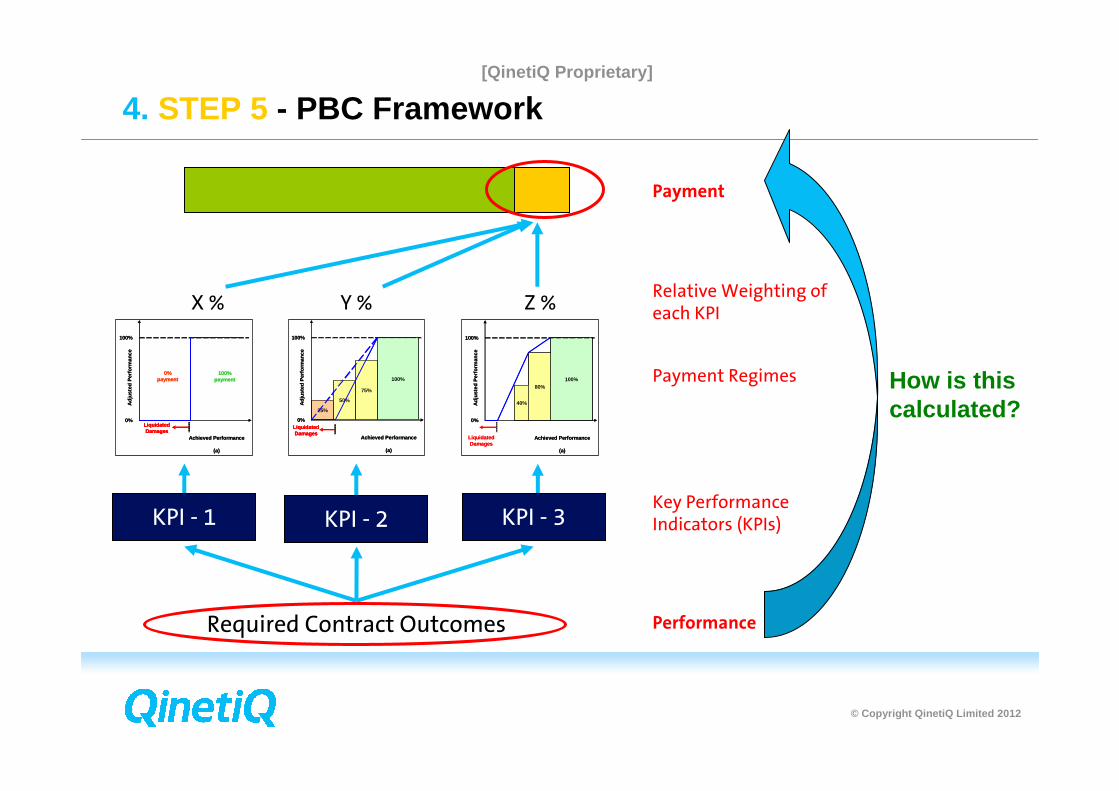
Relative Weighting of each KPIY % Z %X %
Payment Regimes
100%
0%
100%payment
0%payment
Adj
uste
d P
erfo
rman
ce
Achieved Performance
(a)
LiquidatedDamages
100%
0%
100%payment
0%payment
Adj
uste
d P
erfo
rman
ce
Achieved Performance
(a)
LiquidatedDamages
LiquidatedDamages
100%
75%
50%
25%
100%
0%
Adj
uste
d P
erfo
rman
ce
Achieved Performance
(a)
LiquidatedDamages
100%
75%
50%
25%
100%
0%
Adj
uste
d P
erfo
rman
ce
Achieved Performance
(a)
LiquidatedDamages
LiquidatedDamages
100%80%
40%
100%
0%
Adj
uste
d P
erfo
rman
ce
Achieved Performance
(a)
LiquidatedDamages
100%80%
40%
100%
0%
Adj
uste
d P
erfo
rman
ce
Achieved Performance
(a)
LiquidatedDamages
KPI - 2KPI - 2KPI - 2KPI - 2KPI - 2KPI - 2KPI - 2KPI - 2KPI - 2KPI - 2KPI - 2KPI - 2KPI - 2
Required Contract Outcomes
KPI - 2Key Performance Indicators (KPIs)
Required Contract Outcomes
KPI - 3KPI - 2KPI - 1
Payment
Performance
4. STEP 5 - PBC Framework
How is this calculated?
[QinetiQ Proprietary]
© Copyright QinetiQ Limited 2012
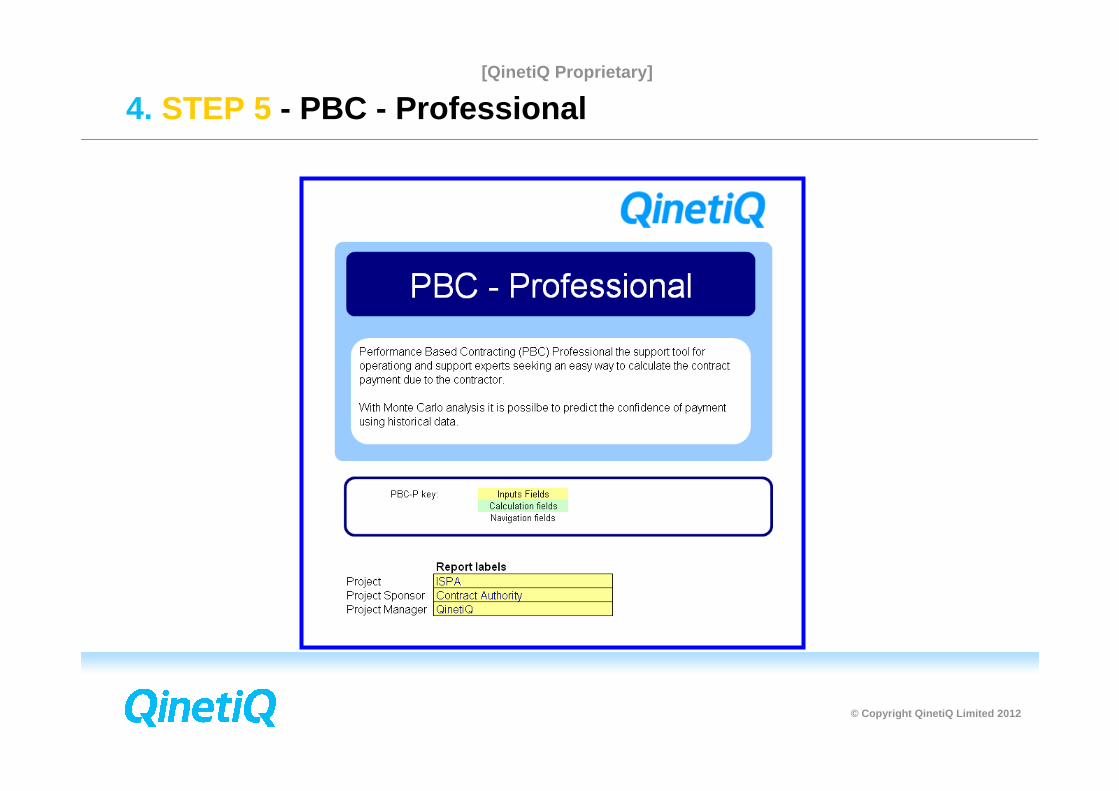
4. STEP 5 - PBC - Professional
[QinetiQ Proprietary]
© Copyright QinetiQ Limited 2012
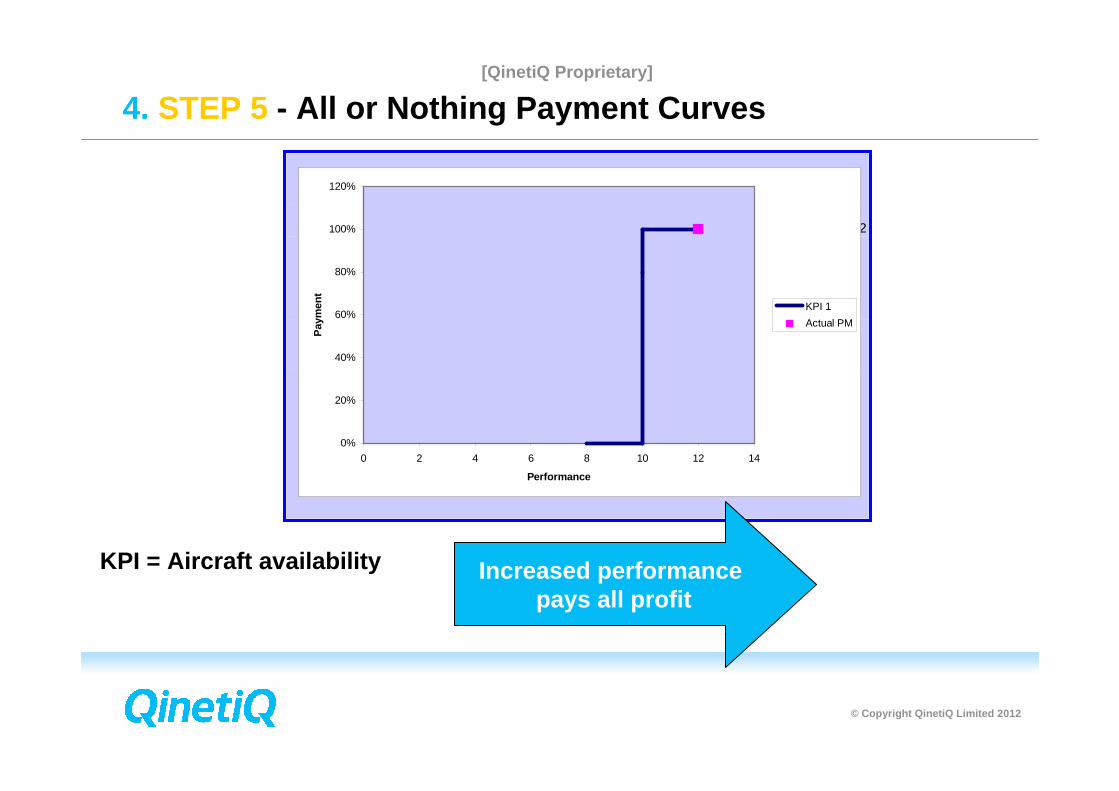
4. STEP 5 - All or Nothing Payment Curves
20
between 10 and 102 2
#DIV/0! #DIV/0!between 10 and 10
#DIV/0! #DIV/0!
100% #DIV/0! #DIV/0! #DIV/0! #DIV/0!0% 0% 0%
0%
20%
40%
60%
80%
100%
120%
0 2 4 6 8 10 12 14
Performance
Pay
men
tKPI 1
Actual PM
KPI = Aircraft availability Increased performance pays all profit
[QinetiQ Proprietary]
© Copyright QinetiQ Limited 2012
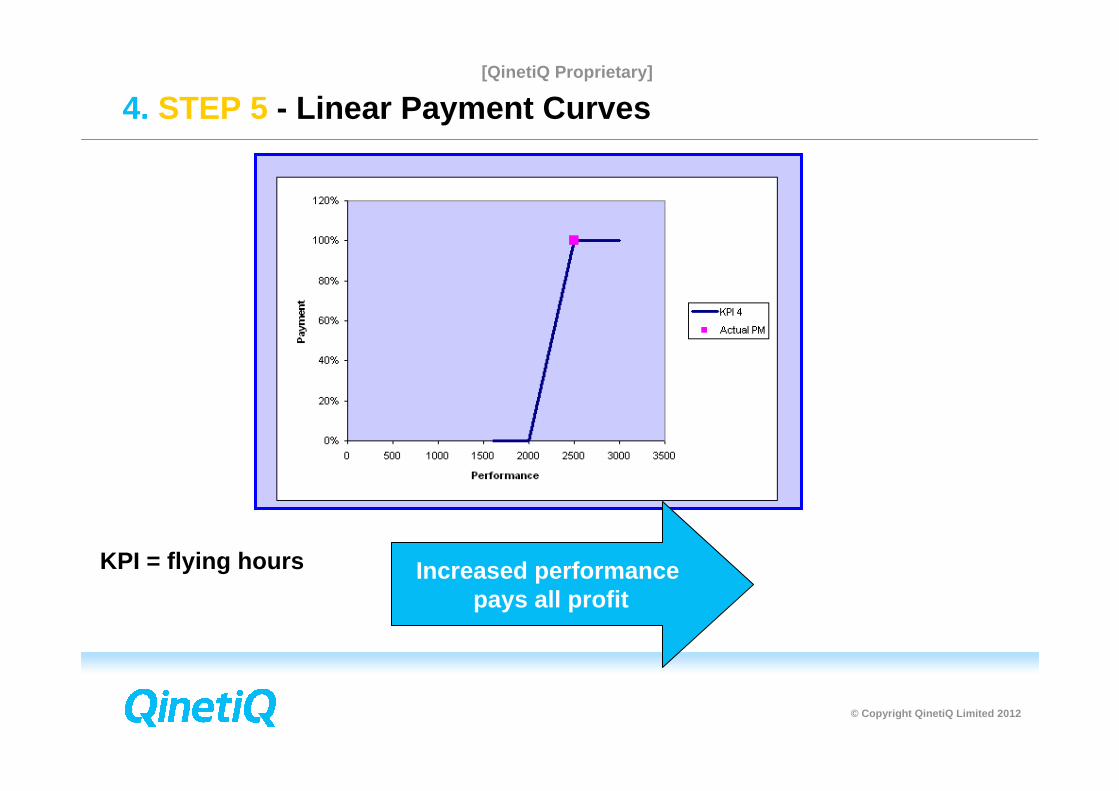
4. STEP 5 - Linear Payment Curves
21
KPI = flying hours Increased performance pays all profit

[QinetiQ Proprietary]
© Copyright QinetiQ Limited 2012
4. STEP 5 - Non-Linear Payment Curves
22
between 15 and 177 5
0.4 2.8between 17 and 200.066666667 0.333333333
100% 113% 280% 2.8 0.3333333330% 0% 0%
0%
20%
40%
60%
80%
100%
120%
0 5 10 15 20 25 30
Performance
Pay
men
tKPI 2
Actual PM
Increased performance pays all profit
KPI = minimum stock levels

[QinetiQ Proprietary]
© Copyright QinetiQ Limited 2012
4. STEP 5 - Non-Linear Payment Curves - reversed
between 15000 and 160000 0
-0.0002 0between 16000 and 17000
-0.0008 0
0% 0% 0% 0 0100% 100% 160%
0%
20%
40%
60%
80%
100%
120%
0 5000 10000 15000 20000 25000
Performance
Pay
men
t
KPI 3
Actual PM
Reduced performance pays all profit
KPI = Cost per flying hour

[QinetiQ Proprietary]
© Copyright QinetiQ Limited 2012
4. STEP 6 - Incentive Regime
4 key principles to any incentive regime:
1. Any incentive must be of benefit to the Customer
− e.g. little incentive to shorten delivery time to arrive on a Sunday when potentially no one is working
2. Does not have to be related to the Performance Measures
− e.g. greater than 100% performance
3. Can be more subjective than Performance Measures
4. Only offered when all Performance Measures are satisfactory
− Concentrate on delivery of 100% performance
24
Step 1Business Case
Step 2Outcomes
Step 3Measures
Step 4Levels
Step 5Payment
Step 6Incentives
Step 7Contract
Step 8Review

[QinetiQ Proprietary]
© Copyright QinetiQ Limited 2012
4. STEP 7 - Writing a PBC Contract
In drafting an effective and efficient Performance Based Contract the following parts of the contract must be considered:
• Glossary
• Terms and Conditions of Contract (T&Cs)
• Statement of Work (SOW) including:
− Contractor Performance Meetings
− Format of the Performance Report
• Function and Performance Statement (FPS)
• Price and Payment Schedule
• Liquidated Damages
• Performance Management Framework (PMF) / Performance Plan
25
Step 1Business Case
Step 2Outcomes
Step 3Measures
Step 4Levels
Step 5Payment
Step 6Incentives
Step 7Contract
Step 8Review
[QinetiQ Proprietary]
© Copyright QinetiQ Limited 2012
26
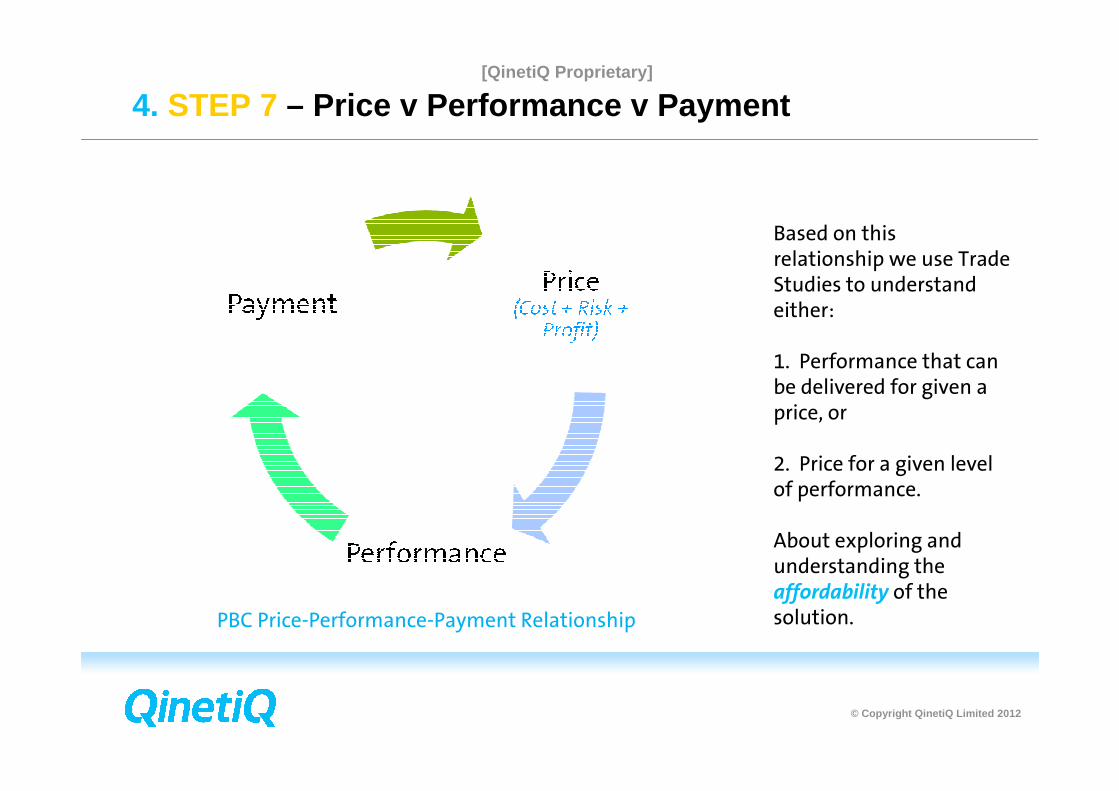
PBC Price-Performance-Payment Relationship
4. STEP 7 – Price v Performance v Payment
Based on this relationship we use Trade Studies to understand either:
1. Performance that can be delivered for given a price, or
2. Price for a given level of performance.
About exploring and understanding the affordability of the solution.
[QinetiQ Proprietary]
© Copyright QinetiQ Limited 2012
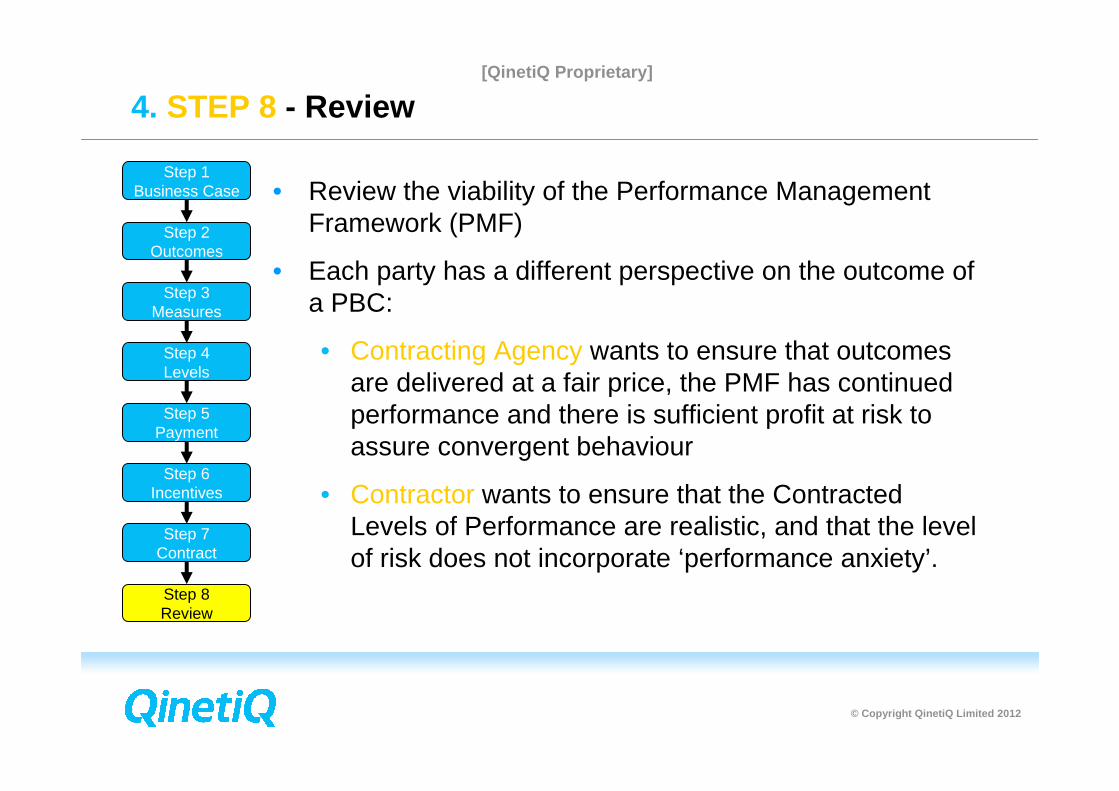
4. STEP 8 - Review
• Review the viability of the Performance Management Framework (PMF)
• Each party has a different perspective on the outcome of a PBC:
• Contracting Agency wants to ensure that outcomes are delivered at a fair price, the PMF has continued performance and there is sufficient profit at risk to assure convergent behaviour
• Contractor wants to ensure that the Contracted Levels of Performance are realistic, and that the level of risk does not incorporate ‘performance anxiety’.
27
Step 1Business Case
Step 2Outcomes
Step 3Measures
Step 4Levels
Step 5Payment
Step 6Incentives
Step 7Contract
Step 8Review

[QinetiQ
Proprietary]
©C
opyright QinetiQ
Limited 2012
4. ST
EP
8-
Historic data
Daily num
ber of serviceable aircraft
0 2 4 6 8 10 12 14
01/01/2010
15/01/2010
29/01/2010
12/02/2010
26/02/2010
12/03/2010
26/03/2010
09/04/2010
23/04/2010
07/05/2010
21/05/2010
04/06/2010
18/06/2010
02/07/2010
16/07/2010
30/07/2010
13/08/2010
27/08/2010
10/09/2010
24/09/2010
08/10/2010
22/10/2010
05/11/2010
19/11/2010
03/12/2010
17/12/2010
31/12/2010
Date
Number of serviceable aircraft
How
can this be represented as a distribution?
[QinetiQ Proprietary]
© Copyright QinetiQ Limited 2012
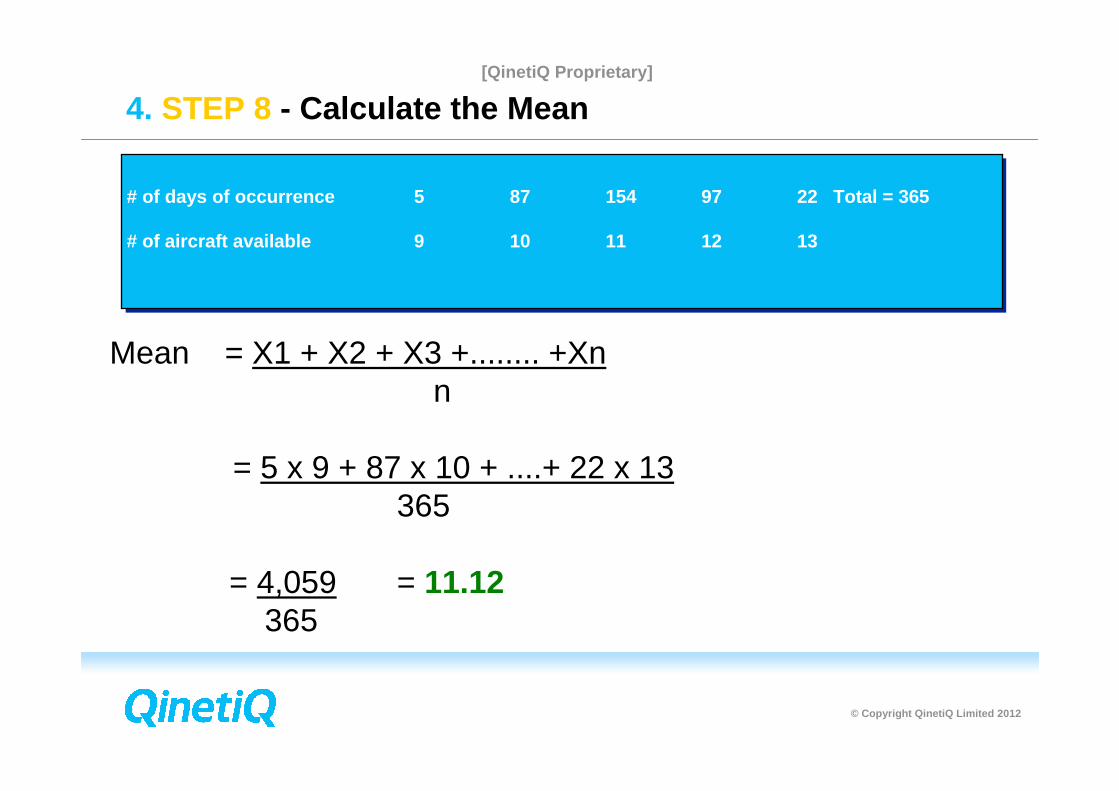
4. STEP 8 - Calculate the Mean
Mean = X1 + X2 + X3 +........ +Xnn
= 5 x 9 + 87 x 10 + ....+ 22 x 13 365
= 4,059 = 11.12365
# of days of occurrence 5 87 154 97 22 Total = 365
# of aircraft available 9 10 11 12 13

[QinetiQ Proprietary]
© Copyright QinetiQ Limited 2012
4. STEP 8 - Calculate the Standard Deviation
• Standard Deviation is a measurement of the data dispersion from the Mean
• Std. Dev. =
_2 _2 _2 _2• Std. Dev. = (X1-X) + (X2-X) + (X3-X) +......(Xn-X)
n-1
)1(
)( 2
−
−∑
n
xx

[QinetiQ Proprietary]
© Copyright QinetiQ Limited 2012
# of days of occurrence 5 87 154 97 22 Total = 365
# of aircraft available 9 10 11 12 13
= (9 – 11.12)2 + (9 – 11.12)2 + (9 - 11.12)2 + ...... + (13 – 11.12)2
Std. Dev. = 0.8874
365 - 1
4. STEP 8 - What is the Standard Deviation for available aircraft
= 286.69364
[QinetiQ Proprietary]
© Copyright QinetiQ Limited 2012
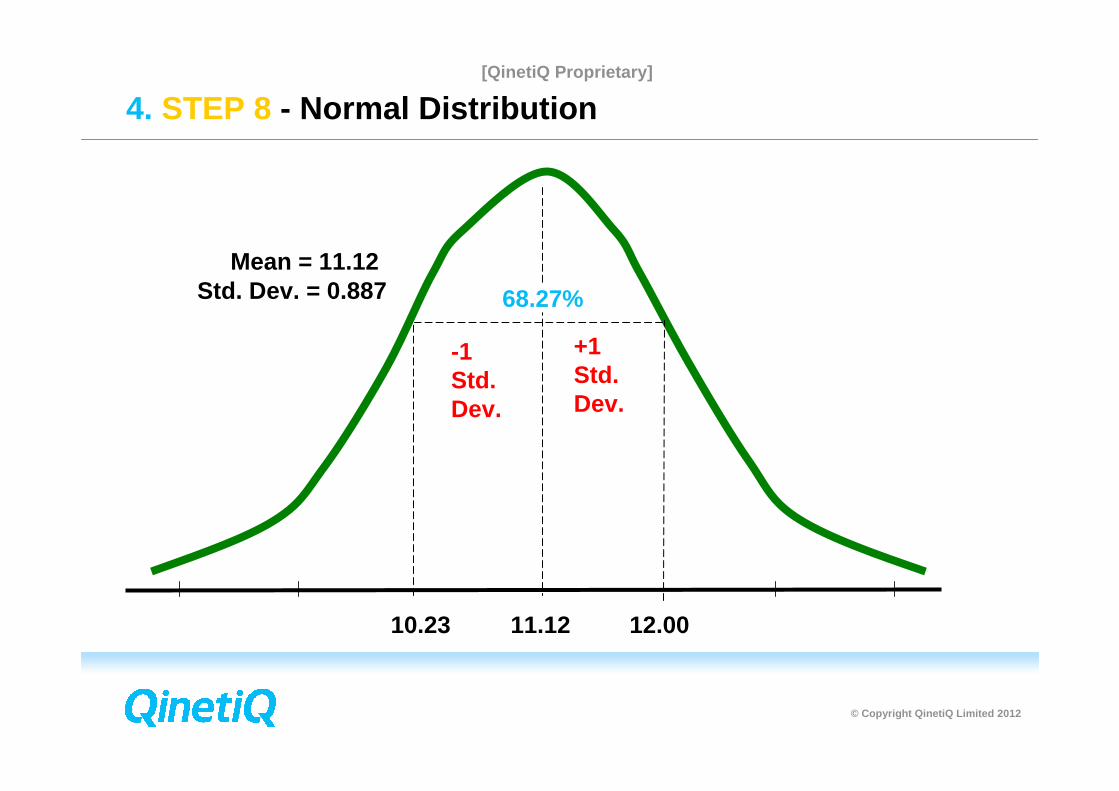
4. STEP 8 - Normal Distribution
10.23 11.12 12.00
Mean = 11.12Std. Dev. = 0.887
-1Std.Dev.
68.27%
+1Std.Dev.
[QinetiQ Proprietary]
© Copyright QinetiQ Limited 2012
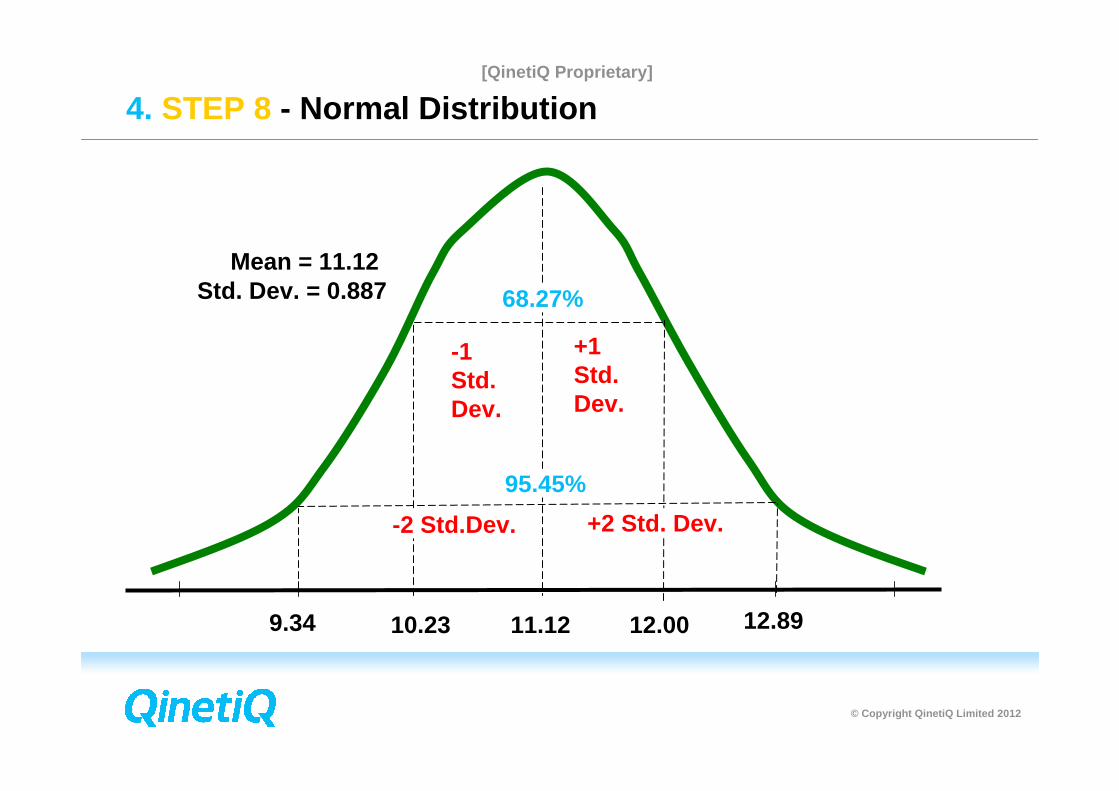
4. STEP 8 - Normal Distribution
10.23 11.12 12.00
Mean = 11.12Std. Dev. = 0.887
-1Std.Dev.
68.27%
95.45%
-2 Std.Dev. +2 Std. Dev.
9.34 12.89
+1Std.Dev.
[QinetiQ Proprietary]
© Copyright QinetiQ Limited 2012
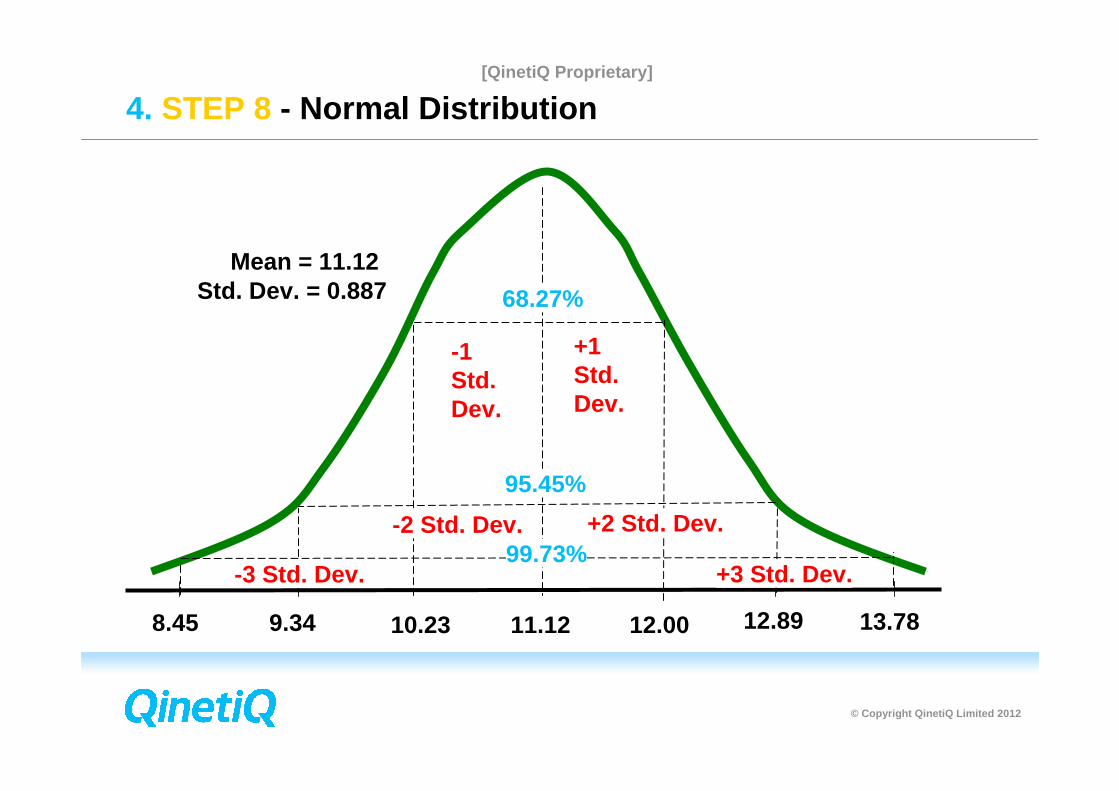
4. STEP 8 - Normal Distribution
10.23 11.12 12.00
Mean = 11.12Std. Dev. = 0.887
-1Std.Dev.
68.27%
95.45%
-2 Std. Dev. +2 Std. Dev.
9.34 12.89
+1Std.Dev.
+3 Std. Dev.-3 Std. Dev.99.73%
8.45 13.78

[QinetiQ Proprietary]
© Copyright QinetiQ Limited 2012
Distribution for Total Performance Measurement = / Weigh...
0.000
0.200
0.400
0.600
0.800
1.000
Mean=0.8846885
0.4 0.55 0.7 0.85 10.4 0.55 0.7 0.85 1
5% 90% .6914 1
Mean=0.8846885
4. STEP 8 - Consequences of a PBC?Confidence
[QinetiQ Proprietary]
© Copyright QinetiQ Limited 2012
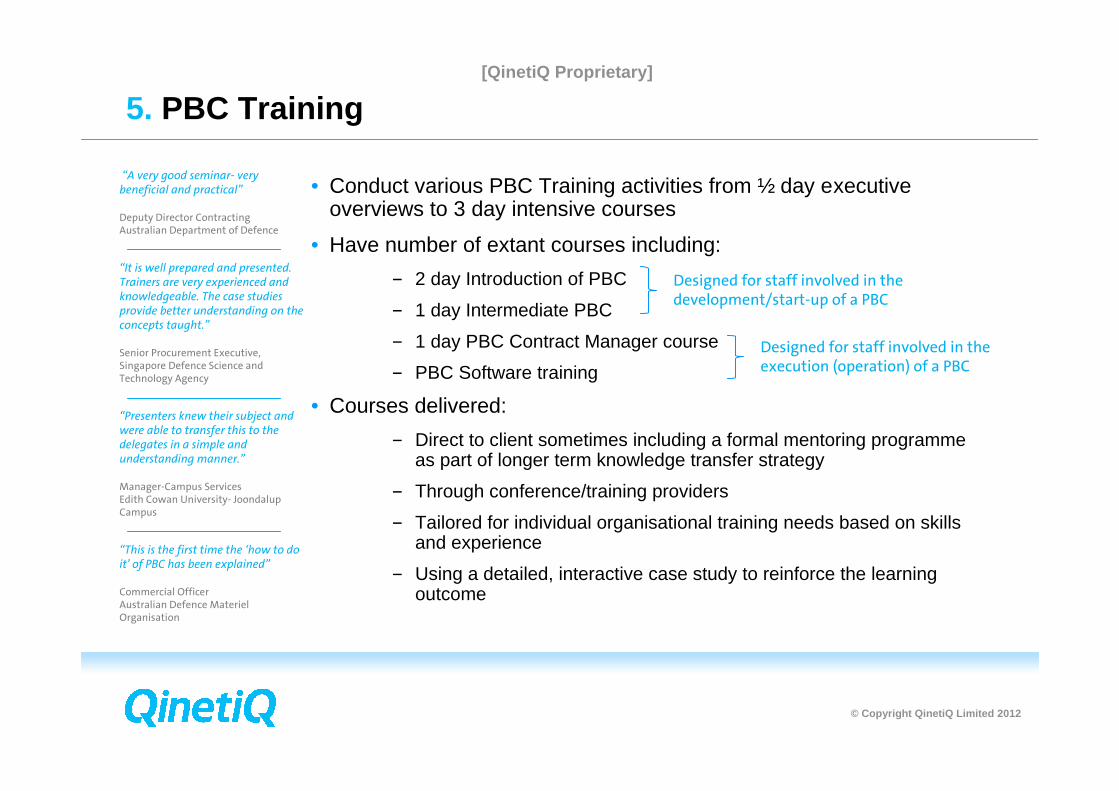
5. PBC Training
• Conduct various PBC Training activities from ½ day executive overviews to 3 day intensive courses
• Have number of extant courses including:
− 2 day Introduction of PBC
− 1 day Intermediate PBC
− 1 day PBC Contract Manager course
− PBC Software training
• Courses delivered:
− Direct to client sometimes including a formal mentoring programme as part of longer term knowledge transfer strategy
− Through conference/training providers
− Tailored for individual organisational training needs based on skills and experience
− Using a detailed, interactive case study to reinforce the learning outcome
36
Designed for staff involved in the development/start-up of a PBC
Designed for staff involved in the execution (operation) of a PBC
“A very good seminar- very beneficial and practical”
Deputy Director ContractingAustralian Department of Defence
“It is well prepared and presented. Trainers are very experienced and knowledgeable. The case studies provide better understanding on the concepts taught.”
Senior Procurement Executive, Singapore Defence Science and Technology Agency
“Presenters knew their subject and were able to transfer this to the delegates in a simple and understanding manner.”
Manager-Campus ServicesEdith Cowan University- Joondalup Campus
“This is the first time the ‘how to do it’ of PBC has been explained”
Commercial OfficerAustralian Defence Materiel Organisation

[QinetiQ Proprietary]
© Copyright QinetiQ Limited 2012
6. Conclusion
• PBC provides a structured means of communication of performance from Contract Authority to Supplier
• Fair outcome for Contracting Authority and Supplier as performance is linked to consequence
• Payment and non-payment indicators provide short term and long term information
• QinetiQ has a Whole of Contract approach to PBC
• Culture and behaviours can be influenced by performance measures used
• Long term contracting with visibility of performance and outcomes provides value for money (VfM)

© Copyright QinetiQ Limited 2012
[QinetiQ Proprietary]
QinetiQ approach to Performance Based Contracting (PBC)
SCAF WorkshopTuesday 7th February 2012The BAWA Centre, Filton, Bristol
Dale [email protected]
John [email protected]