q3 2017 irm supplemental final
TRANSCRIPT

www.ironmountain.com
Supplemental Financial Information Third Quarter 2017
Unaudited

www.ironmountain.com Selected metric definitions are available in the Appendix
Safe Harbor Statement
2
Safe Harbor Statement Under the Private Securities Litigation Reform Act of 1995: This presentation contains certain forward-looking statements within the meaning of the Private Securities Litigation Reform Act of 1995 and other securities laws and is subject to the safe-harbor created by such Act. Forward-looking statements include, but are not limited to, our financial performance outlook and statements concerning our operations, economic performance, financial condition, goals, beliefs, future growth strategies, investment objectives, plans and current expectations such as 2017, guidance, and statements about our investment goals. These forward-looking statements are subject to various known and unknown risks, uncertainties and other factors. When we use words such as "believes," "expects," "anticipates," "estimates" or similar expressions, we are making forward-looking statements. Although we believe that our forward-looking statements are based on reasonable assumptions, our expected results may not be achieved, and actual results may differ materially from our expectations. In addition, important factors that could cause actual results to differ from expectations include, among others: (i) our ability to remain qualified for taxation as a real estate investment trust for U.S. federal income tax purposes ("REIT"); (ii) the adoption of alternative technologies and shifts by our customers to storage of data through non-paper based technologies; (iii) changes in customer preferences and demand for our storage and information management services; (iv) the cost to comply with current and future laws, regulations and customer demands relating to data security and privacy issues, as well as fire and safety standards; (v) the impact of litigation or disputes that may arise in connection with incidents in which we fail to protect our customers' information; (vi) changes in the price for our storage and information management services relative to the cost of providing such storage and information management services; (vii) changes in the political and economic environments in the countries in which our international subsidiaries operate and changes in the global political climate; (viii) our ability or inability to complete acquisitions on satisfactory terms and to close pending acquisitions and to integrate acquired companies efficiently; (ix) changes in the amount of our capital expenditures and our ability to invest in accordance with plan; (x) changes in the cost of our debt; (xi) the impact of alternative, more attractive investments on dividends; (xii) the cost or potential liabilities associated with real estate necessary for our business; (xiii) the performance of business partners upon whom we depend for technical assistance or management expertise outside the United States; (xiv) other trends in competitive or economic conditions affecting our financial condition or results of operations not presently contemplated; and (xv) other risks described more fully in our filings with the Securities and Exchange Commission, including under the caption “Risk Factors” in our periodic reports, or incorporated therein. You should not rely upon forward-looking statements except as statements of our present intentions and of our present expectations, which may or may not occur. Except as required by law, we undertake no obligation to release publicly the result of any revision to these forward-looking statements that may be made to reflect events or circumstances after the date hereof or to reflect the occurrence of unanticipated events. Reconciliation of Non-GAAP Measures: Throughout this presentation, Iron Mountain will discuss (1) Adjusted EBITDA, (2) Adjusted Earnings per Share (“Adjusted EPS”), (3) Funds from Operations (“FFO NAREIT”), (4) FFO (Normalized) and (5) Adjusted Funds from Operations (“AFFO”). These measures do not conform to accounting principles generally accepted in the United States (“GAAP”). These non-GAAP measures are supplemental metrics designed to enhance our disclosure and to provide additional information that we believe to be important for investors to consider in addition to, but not as a substitute for, other measures of financial performance reported in accordance with GAAP, such as operating income, income (loss) from continuing operations, net income (loss) or cash flows from operating activities from continuing operations (as determined in accordance with GAAP). The reconciliation of these measures to the appropriate GAAP measure, as required by Regulation G under the Securities Exchange Act of 1934, as amended, and the definitions are included later in this document (see Table of Contents). Iron Mountain does not provide a reconciliation of non-GAAP measures that it discusses as part of its annual guidance or long term outlook because certain significant information required for such reconciliation is not available without unreasonable efforts or at all, including, most notably, the impact of exchange rates on Iron Mountain’s transactions, loss or gain related to the disposition property, plant and equipment (including of real estate) and other income or expense. Without this information, Iron Mountain does not believe that a reconciliation would be meaningful.

www.ironmountain.com Selected metric definitions are available in the Appendix
All figures except per share and facility counts in 000s unless noted All figures in reported dollars unless noted
Figures may not foot due to rounding
Table of Contents
3
Investor Relations Contacts: Faten Freiha, 617-535-8404
Director, Investor Relations [email protected]
Melissa Marsden, 617-535-8595 Senior Vice President, Investor Relations [email protected]
Section I - Company Profile 4
Section II - Financial Highlights and Guidance 5 - 6
Section III - Operating Metrics 7 - 11
Section IV - Balance Sheets, Statements of Operations and Reconciliations 12 - 19
Section V - Storage Net Operating Income and EBITDA, and Service Business EBITDA 20 - 22
Section VI - Real Estate Metrics 23 - 28
Section VII - Debt Schedule and Capitalization 29 - 30
Section VIII - Capital Expenditures and Investments 31 - 33
Section IX - Components of Value 34
Section X - Appendix and Definitions 35 - 44

www.ironmountain.com Selected metric definitions are available in the Appendix
Product
Company Profile
Iron Mountain is a global leader in enterprise storage with a high-return, real estate-based business model, yielding annualized revenue of approximately $3.9 billion. The company provides storage and information management services to a high-quality, diversified customer base across numerous industries and government organizations. As of 9/30/17, Iron Mountain served more than 230,000 customers, including approximately 95% of the Fortune 1000, and no single customer accounted for more than 1% of revenues, or 2% of volume. Iron Mountain provides storage and information management services in 53 countries on six continents, storing approximately 680 million cubic feet of records in a portfolio of more than 1,400 facilities totaling more than 85 million square feet of space. The company employs more than 24,000 people. Iron Mountain is organized as a REIT, and its financial model is based on the recurring nature of its storage rental revenues and resulting storage net operating income (NOI). Supported by consistent storage rental revenues, the company generates predictable, low-volatility growth in key metrics such as storage NOI and AFFO. This fundamental financial characteristic provides stability through economic cycles. Iron Mountain has the opportunity to invest capital at attractive returns both domestically and internationally. The company believes that there remains a large un-vended opportunity that can support sustained storage volumes in developed markets such as North America and high growth opportunities in emerging markets where customers are in early stages of outsourcing their storage of physical documents.
Diversification of Total Revenues (YTD 9/30/2017)
4
Countries Served
(1) Includes South Africa and United Arab Emirates. (2) Includes Fulfillment Services, Information Governance and Digital Solutions, Technology
Escrow Services, Data Center, Consulting, Entertainment Services, Fine Art Storage, Consumer Storage and other ancillary services.
18%
67% 7% 8%
11%
10% 14%
66%
Latin America
Europe
North America
Asia Other
Shredding
Data Protection
Records Mgmt
Strong Track Record of Storage Rental Revenue Growth $2,143
’16 ’15 ’14 ’13 ’12 ’11 ’10 ’09 ’08 ’07 ’06 ’05 ’04 ’03 ’02 ’01 ’00 ’99 ’98 ’97 ’96 ’95 ’94 ’93 ’92 ’91 ’90 ’89
(2)
Region
(1)
27-year Compound Annual Growth Rate
16.5%
62%
38%
Service
Storage
Mix
Sect
ion
VIII
Sect
ion
IX
Sect
ion
VII
Sect
ion
VI
Sect
ion
V Se
ctio
n IV
Se
ctio
n III
Se
ctio
n II
Sect
ion
I Se
ctio
n X
M

www.ironmountain.com Selected metric definitions are available in the Appendix
Financial Highlights
5
(1) Please see slide 21 for Storage Net Operating Income reconciliation. (2) Q3 2016 AFFO has been revised to reflect the new AFFO definition introduced in the Q4 2016 Supplemental Financial Information.
Sect
ion
VIII
Sect
ion
IX
Sect
ion
VII
Sect
ion
VI
Sect
ion
V Se
ctio
n IV
Se
ctio
n III
Se
ctio
n X
Sect
ion
II Se
ctio
n I
Q3 2016 Q3 2017 % Change YTD 2016 YTD 2017 % Change
Storage Rental $576,465 $601,091 4.3% $1,576,358 $1,763,609 11.9%Service 366,357 364,570 (0.5%) 1,000,902 1,090,734 9.0%
Total Revenues $942,822 $965,661 2.4% $2,577,260 $2,854,343 10.8%
Gross Profit $513,014 $547,334 6.7% $1,425,698 $1,595,025 11.9%Gross Margin 54.4% 56.7% 230 bps 55.3% 55.9% 60 bps
Gross Profit $513,014 $547,334 6.7% $1,425,698 $1,595,025 11.9%Less: Recall Costs included in Cost of Sales 4,457 3,059 (31.4%) 4,788 16,019 n/aAdjusted Gross Profit $517,471 $550,393 6.4% $1,430,486 $1,611,044 12.6%Adjusted Gross Profit Margin 54.9% 57.0% 210 bps 55.5% 56.4% 90 bps
Adjusted Storage and Service Profit and MarginAdjusted Storage Gross Profit $425,361 $448,254 5.4% $1,181,186 $1,319,973 11.7%Adjusted Storage Gross Margin 73.8% 74.6% 80 bps 74.9% 74.8% -10 bpsAdjsuted Service Gross Profit $92,110 $102,139 10.9% $249,300 $291,071 16.8%Adjusted Service Gross Margin 25.1% 28.0% 290 bps 24.9% 26.7% 180 bps
Storage Net Operating Income (NOI)(1) $470,476 $500,218 6.3% $1,290,931 $1,461,440 13.2%
SG&A Costs $252,944 $242,357 (4.2%) $737,787 $719,968 (2.4%)Less: Recall Costs Included in SG&A $29,676 $14,988 (49.5%) $98,084 $42,576 (56.6%)Adjusted SG&A Costs $223,268 $227,369 1.8% $639,703 $677,392 5.9%Adjusted SG&A as a % of Revenue 23.7% 23.5% -20 bps 24.8% 23.7% -110 bps
Income (Loss) from Continuing Operations $5,759 $25,382 n/a $54,080 $167,374 n/aAdjusted EBITDA $294,203 $323,024 9.8% $790,783 $933,652 18.1%Adjusted EBITDA Margin 31.2% 33.5% 230 bps 30.7% 32.7% 200 bps
Reported EPS - Fully Diluted from Continuing Operations $0.02 $0.10 n/a $0.22 $0.62 n/aAdjusted EPS $0.27 $0.31 14.8% $0.80 $0.85 6.3%
Net Income (Loss) $7,800 $24,324 n/a $57,708 $163,953 n/a
AFFO(2) $176,347 $210,108 19.1% $499,391 $598,126 19.8%
Ordinary Dividends per Share $0.485 $0.550 13.4% $1.455 $1.651 13.5%
Weighted Average Fully-diluted Shares Outstanding 264,502 266,139 0.6% 241,520 265,293 9.8%

www.ironmountain.com Selected metric definitions are available in the Appendix
2017 Guidance Summary(1)
6
(1) Iron Mountain does not provide a reconciliation of non-GAAP measures that it discusses as part of its annual guidance or long term outlook because certain significant information required for such reconciliation is not available without unreasonable efforts or at all, including, most notably, the impact of exchange rates on Iron Mountain’s transactions, loss or gain related to the disposition of real estate and other income or expense. Without this information, Iron Mountain does not believe that a reconciliation would be meaningful.
(2) R$ results expected to be consistent with C$ ranges. (3) AFFO 2017 Guidance excludes capital expenditures associated with the integration of Recall.
Financial Performance Outlook $MM (except per share items)
Sect
ion
VIII
Sect
ion
IX
Sect
ion
VII
Sect
ion
VI
Sect
ion
V Se
ctio
n IV
Se
ctio
n III
Se
ctio
n II
Sect
ion
I Se
ctio
n X
Note: 2017 Guidance assumes: • Maintenance CapEx and non-real estate investment of ~$150mm • Acquisition of FORTRUST datacenter of ~$130mm (~$55mm of cash consideration) • Business and acquisitions of customer relationships of ~$210mm • Assumes internal storage rental revenue growth of 3.0% to 3.5% • Assumes full year weighted average shares outstanding of 266mm
R$ 2017 Guidance(2) 2017 % Change YOY
Revenue $3,750 - $3,840 8% - 10%
Adjusted EBITDA $1,250 -$1,280 16% - 19%Adjusted EPS $1.15 - $1.25 8% - 18%
AFFO(3) $715 - $760 8% - 15%

www.ironmountain.com Selected metric definitions are available in the Appendix
Year-over-Year Revenue Growth
7
Service
Storage Rental
18.1%
81.9%
Service
Storage Rental
YTD 2017 Revenue YTD 2017 Gross Profit
Sect
ion
VIII
Sect
ion
IX
Sect
ion
VII
Sect
ion
VI
Sect
ion
V Se
ctio
n IV
Se
ctio
n X
Sect
ion
III
Sect
ion
II Se
ctio
n I
Revenue Growth Rates
Reported 4.3% (0.5)% 2.4% 11.9% 9.0% 10.8%
Less: Impact of FX Rate Changes and Adjustments 1.1% 1.1% 1.0% 0.0% 0.1% 0.0%
Constant Currency 3.2% (1.6)% 1.4% 11.9% 8.9% 10.8%
Less: Impact of Acquisitions and Dispositions (0.3)% (1.4)% (0.6)% 8.1% 9.2% 8.6%
Internal Revenue Growth Rate 3.5% (0.2)% 2.0% 3.8% (0.3)% 2.2%
Q3 2017 YTD 2017Storage Rental
RevenueService Revenue
Total Revenue
Storage Rental Revenue
Service Revenue
Total Revenue
38.2%
61.8%

www.ironmountain.com Selected metric definitions are available in the Appendix
Records Management Volume Growth
8
-4.6% -4.8% -4.8% -4.9% -5.0% -5.0% -4.1% -3.9%
-2.1% -2.0% -2.1% -2.2% -2.3% -2.4%-2.1% -2.1%
5.8% 5.8% 6.0% 6.2% 6.3% 6.4% 5.2% 5.0%
2.5% 2.6% 2.6% 2.7% 2.8% 3.0%2.4% 2.3%
0.1%
1.6%
25.9%
Q1-16
3.2%
Q4-15
1.0%
Q1-17
25.0%
23.1%
Q4-16
26.3% 24.6%
2.3% 0.7%
Q3-16
29.2%
27.4%
Q2-16
27.6%
Q3-17 Q2-17
2.4% 1.4%
Outperm/Terms Destructions New Volume from Existing Customers New Sales Business Acquisitions / Dispositions
Total Iron Mountain (680 CuFt MM)
North America (418 CuFt MM)
(3)
(1) Q2-17 cube growth has been adjusted to reflect required regulatory divestments in IRM’s legacy Australian business. (2) Represents CuFt acquired at close. CuFt activity post close flows through new sales, new volume from existing customers, destructions, outperms / terms as appropriate. Acquisitions/ dispositions reflects
business acquisition volume net of dispositions required by Recall transaction and sale of Russia / Ukraine business. (3) Acquisitions of customer relationships are included in new sales as the nature of these transactions is similar to new customer wins.
24.6%
14.0%
61.5%
Sect
ion
VIII
Sect
ion
IX
Sect
ion
VII
Sect
ion
VI
Sect
ion
V Se
ctio
n IV
Se
ctio
n X
(2)
Sect
ion
III
Sect
ion
II Se
ctio
n I
-1.5%
-5.1%
5.2%
1.9%
11.4%
Q2-16
11.6%
-1.6%
-5.1%
-1.5%
-5.1%
5.0%
1.6%
10.5%
Q3-16 Q3-17
0.1%
1.2%
-1.8%
-4.8%
5.0%
Q1-17
5.0%
1.9%
10.7%
Q4-16
10.6%
5.1%
1.7%
11.5%
Q1-16
0.5%
-1.7%
-5.0%
5.0%
1.8% 0.3%
Q4-15
1.0% 0.3% 0.3%
-1.5%
-4.4%
4.2%
1.6%
11.0%
-1.6%
1.8%
-5.0%
11.8%
-1.5%
-4.3%
4.0%
1.6% 0.3%
Q2-17
24.6%
14.0%
61.5%
Other International
Western Europe
North America
Percentage of Total Cubic Volume at 9/30/17
1.6% 1.6% 1.7% 1.8% 1.7% 1.9% 1.4% 1.3% Internal Growth %
(1)
(1)
www.ironmountain.com Selected metric definitions are available in the Appendix
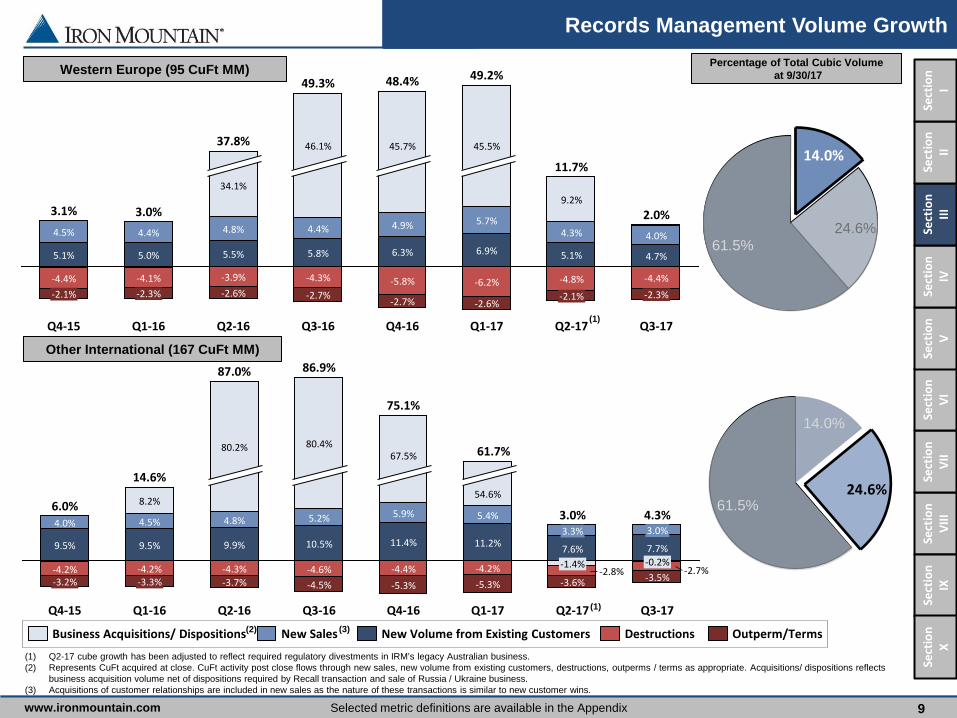
Records Management Volume Growth
9
3.6%
4.3%
9.2%
Q1-17
49.2%
-2.6%
-6.2%
6.9%
5.7%
45.5%
Q4-16
48.4%
-2.7%
-5.8%
6.3%
4.9%
45.7%
Q3-16
49.3%
-2.7%
-4.3%
5.8%
4.4%
46.1%
Q2-16
37.8%
-2.6% -3.9%
5.5%
4.8%
34.1%
Q1-16
3.0%
-2.3% -4.1%
5.0%
4.4%
Q4-15
3.1%
-2.1% -4.4%
5.1%
4.5%
5.1%
Q3-17
2.0%
-2.3% -4.4%
4.7%
4.0%
Q2-17
11.7%
-2.1%
-4.8%
Outperm/Terms Destructions New Volume from Existing Customers New Sales Business Acquisitions/ Dispositions
Western Europe (95 CuFt MM)
Other International (167 CuFt MM)
4.3%
Q3-17
-3.5% -2.7%
7.7%
3.0%
-0.2%
Q2-17
3.0%
-3.6% -2.8%
7.6%
3.3%
-1.4%
Q1-17
61.7%
-5.3% -4.2%
11.2%
5.4%
54.6%
Q4-16
75.1%
-5.3% -4.4%
11.4%
5.9%
67.5%
Q3-16
86.9%
-4.5% -4.6%
10.5%
5.2%
80.4%
Q2-16
87.0%
-3.7% -4.3%
9.9%
4.8%
80.2%
Q1-16
14.6%
-3.3% -4.2%
9.5%
4.5%
8.2%
Q4-15
6.0%
-3.2% -4.2%
9.5%
4.0%
(3)
(1) Q2-17 cube growth has been adjusted to reflect required regulatory divestments in IRM’s legacy Australian business. (2) Represents CuFt acquired at close. CuFt activity post close flows through new sales, new volume from existing customers, destructions, outperms / terms as appropriate. Acquisitions/ dispositions reflects
business acquisition volume net of dispositions required by Recall transaction and sale of Russia / Ukraine business. (3) Acquisitions of customer relationships are included in new sales as the nature of these transactions is similar to new customer wins.
Sect
ion
VIII
Sect
ion
IX
Sect
ion
VII
Sect
ion
VI
Sect
ion
V Se
ctio
n IV
Se
ctio
n III
Se
ctio
n II
Sect
ion
I Se
ctio
n X
(2)
24.6%
14.0%
61.5%
24.6%
14.0%
61.5%
Percentage of Total Cubic Volume at 9/30/17
(1)
(1)

www.ironmountain.com Selected metric definitions are available in the Appendix
Quarterly Operating Performance
10
Sect
ion
VIII
Sect
ion
IX
Sect
ion
VII
Sect
ion
VI
Sect
ion
V Se
ctio
n X
Sect
ion
IV
Sect
ion
III
Sect
ion
II Se
ctio
n I
Q3 Results % Growth
By Reporting SegmentQ3 2016 Q3 2017 Reported -
Impact of FX Rate Changes and Adjustments
= Constant Currency -
Impact of Acquisitions and
Dispositions= Internal Growth
NA Records and Information Management BusinessStorage Rental $298,049 $308,822 3.6% 0.4% 3.2% (0.3)% 3.5%Service 201,928 204,745 1.4% 0.5% 0.9% (0.1)% 1.0%
Total Revenues $499,977 $513,567 2.7% 0.4% 2.3% (0.2)% 2.5%Adjusted EBITDA 199,559 224,882Adjusted EBITDA Margin 39.9% 43.8%
NA Data Management BusinessStorage Rental $72,612 $74,723 2.9% 0.3% 2.6% 0.0% 2.6%Service 34,865 32,263 (7.5)% 0.2% (7.7)% 0.0% (7.7)%
Total Revenues $107,477 $106,986 (0.5)% 0.2% (0.7)% 0.0% (0.7)%Adjusted EBITDA 59,714 56,800Adjusted EBITDA Margin 55.6% 53.1%
Western European BusinessStorage Rental $74,534 $78,012 4.7% 2.4% 2.3% 0.0% 2.3%Service 48,251 50,070 3.8% 2.6% 1.2% 0.0% 1.2%
Total Revenues $122,785 $128,082 4.3% 2.4% 1.9% 0.0% 1.9%Adjusted EBITDA 37,546 43,464Adjusted EBITDA Margin 30.6% 33.9%
Other International BusinessStorage Rental $119,881 $125,903 5.0% 2.5% 2.5% (2.5)% 5.0%Service 77,203 73,795 (4.4)% 2.1% (6.5)% (6.4)% (0.1)%
Total Revenues $197,084 $199,698 1.3% 2.3% (1.0)% (4.0)% 3.0%Adjusted EBITDA 53,844 59,082Adjusted EBITDA Margin 27.3% 29.6%
Corporate and Other BusinessStorage Rental $11,390 $13,630 19.7% 0.0% 19.7% 18.2% 1.5%Service 4,109 3,698 (10.0)% 0.0% (10.0)% 6.0% (16.0)%
Total Revenues $15,499 $17,328 11.8% 0.0% 11.8% 14.9% (3.1)%Adjusted EBITDA (56,460) (61,204)
TotalStorage Rental $576,465 $601,091 4.3% 1.1% 3.2% (0.3)% 3.5%Service 366,357 364,570 (0.5)% 1.1% (1.6)% (1.4)% (0.2)%
Total Revenues $942,822 $965,661 2.4% 1.0% 1.4% (0.6)% 2.0%Adjusted EBITDA 294,203 323,024Adjusted EBITDA Margin 31.2% 33.5%

www.ironmountain.com Selected metric definitions are available in the Appendix
Year-to-Date Operating Performance
11
Sect
ion
VIII
Sect
ion
IX
Sect
ion
VII
Sect
ion
VI
Sect
ion
V Se
ctio
n X
Sect
ion
IV
Sect
ion
III
Sect
ion
II Se
ctio
n I
Year-to-Date Results % Growth
By Reporting SegmentYTD 2016 YTD 2017 Reported -
Impact of FX Rate Changes and Adjustments
= Constant Currency -
Impact of Acquisitions and
Dispositions= Internal Growth
NA Records and Information Management BusinessStorage Rental $853,183 $912,173 6.9% 0.1% 6.8% 3.7% 3.1%Service 572,945 618,588 8.0% 0.1% 7.9% 6.8% 1.1%
Total Revenues $1,426,128 $1,530,761 7.3% 0.1% 7.2% 4.9% 2.3%Adjusted EBITDA 565,254 655,180Adjusted EBITDA Margin 39.6% 42.8%
NA Data Management BusinessStorage Rental $207,602 $221,508 6.7% 0.1% 6.6% 3.9% 2.7%Service 99,488 98,423 (1.1)% 0.0% (1.1)% 6.2% (7.3)%
Total Revenues $307,090 $319,931 4.2% 0.1% 4.1% 4.6% (0.5)%Adjusted EBITDA 170,255 169,295Adjusted EBITDA Margin 55.4% 52.9%
Western European BusinessStorage Rental $203,926 $224,114 9.9% (5.5)% 15.4% 13.2% 2.2%Service 130,933 145,906 11.4% (5.1)% 16.5% 15.5% 1.0%
Total Revenues $334,859 $370,020 10.5% (5.3)% 15.8% 14.0% 1.8%Adjusted EBITDA 102,765 114,134Adjusted EBITDA Margin 30.7% 30.8%
Other International BusinessStorage Rental $278,907 $364,835 30.8% 2.9% 27.9% 21.5% 6.4%Service 185,187 216,509 16.9% 2.8% 14.1% 15.2% (1.1)%
Total Revenues $464,094 $581,344 25.3% 2.9% 22.4% 18.9% 3.5%Adjusted EBITDA 117,351 170,595Adjusted EBITDA Margin 25.3% 29.3%
Corporate and Other BusinessStorage Rental $32,741 $40,979 25.2% 0.0% 25.2% 8.0% 17.2%Service 12,348 11,308 (8.4)% 0.0% (8.4)% 4.8% (13.2)%
Total Revenues $45,089 $52,287 16.0% 0.0% 16.0% 7.0% 9.0%Adjusted EBITDA (164,842) (175,552)
TotalStorage Rental $1,576,358 $1,763,609 11.9% 0.0% 11.9% 8.1% 3.8%Service 1,000,902 1,090,734 9.0% 0.1% 8.9% 9.2% (0.3)%
Total Revenues $2,577,260 $2,854,343 10.8% 0.0% 10.8% 8.6% 2.2%Adjusted EBITDA 790,783 933,652Adjusted EBITDA Margin 30.7% 32.7%
www.ironmountain.com Selected metric definitions are available in the Appendix
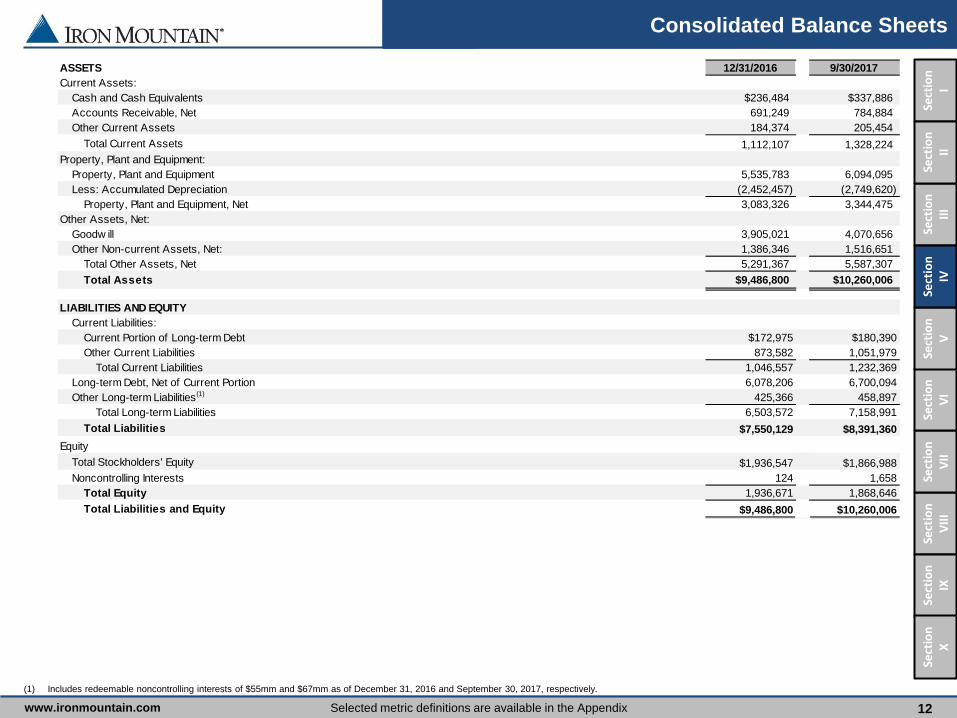
Consolidated Balance Sheets
12
Sect
ion
VIII
Sect
ion
IX
Sect
ion
VII
Sect
ion
VI
Sect
ion
V Se
ctio
n III
Se
ctio
n X
Sect
ion
I Se
ctio
n II
Sect
ion
IV
(1) Includes redeemable noncontrolling interests of $55mm and $67mm as of December 31, 2016 and September 30, 2017, respectively.
ASSETS 12/31/2016 9/30/2017Current Assets:
Cash and Cash Equivalents $236,484 $337,886Accounts Receivable, Net 691,249 784,884Other Current Assets 184,374 205,454
Total Current Assets 1,112,107 1,328,224Property, Plant and Equipment:
Property, Plant and Equipment 5,535,783 6,094,095Less: Accumulated Depreciation (2,452,457) (2,749,620)
Property, Plant and Equipment, Net 3,083,326 3,344,475Other Assets, Net:
Goodw ill 3,905,021 4,070,656Other Non-current Assets, Net: 1,386,346 1,516,651
Total Other Assets, Net 5,291,367 5,587,307Total Assets $9,486,800 $10,260,006
LIABILITIES AND EQUITYCurrent Liabilities:
Current Portion of Long-term Debt $172,975 $180,390Other Current Liabilities 873,582 1,051,979
Total Current Liabilities 1,046,557 1,232,369Long-term Debt, Net of Current Portion 6,078,206 6,700,094Other Long-term Liabilities(1) 425,366 458,897
Total Long-term Liabilities 6,503,572 7,158,991Total Liabilities $7,550,129 $8,391,360
EquityTotal Stockholders' Equity $1,936,547 $1,866,988Noncontrolling Interests 124 1,658
Total Equity 1,936,671 1,868,646Total Liabilities and Equity $9,486,800 $10,260,006

www.ironmountain.com Selected metric definitions are available in the Appendix
Consolidated Statements of Operations
13
(1) Includes $4.5mm and $3.1mm of Recall Costs in Q3 2016 and Q3 2017, respectively. Also, includes $4.8mm and $16.0mm of Recall Costs in YTD 2016 and YTD 2017, respectively. (2) Includes $29.7mm and $15.0mm of Recall Costs in Q3 2016 and Q3 2017, respectively. Also, includes $98.1mm and $42.6mm of Recall Costs in YTD 2016 and YTD 2017, respectively.
Sect
ion
VIII
Sect
ion
IX
Sect
ion
VII
Sect
ion
VI
Sect
ion
V Se
ctio
n IV
Se
ctio
n III
Se
ctio
n II
Sect
ion
I Se
ctio
n X
Q3 2016 Q3 2017 % Change YTD 2016 YTD 2017 % ChangeRevenues:
Storage Rental $576,465 $601,091 4.3% $1,576,358 $1,763,609 11.9%Service 366,357 364,570 (0.5)% 1,000,902 1,090,734 9.0%
Total Revenues $942,822 $965,661 2.4% $2,577,260 $2,854,343 10.8%
Operating Expenses:Cost of Sales (excluding Depreciation and Amortization)(1) 429,808 418,327 (2.7)% 1,151,562 1,259,318 9.4%Selling, General and Administrative(2) 252,944 242,357 (4.2)% 737,787 719,968 (2.4)%Depreciation and Amortization 124,670 128,513 3.1% 326,896 381,319 16.6%(Gain) Loss on Disposal/Write-Dow n of PP&E (excluding Real Estate), Net (54) (292) n/a (1,131) (967) (14.5)%
Total Operating Expenses 807,368 788,905 (2.3)% 2,215,114 2,359,638 6.5%
Operating Income (Loss) 135,454 176,756 30.5% 362,146 494,705 36.6%Interest Expense, Net 83,300 88,989 6.8% 225,228 265,010 17.7%Foreign Currency Transaction (Gain) / Loss 10,685 11,865 11.0% 15,336 27,900 81.9%Debt Extinguishment Expense - 48,298 n/a 9,283 48,298 n/aOther Expense (Income), Net 12,617 (684) n/a 12,387 (42,449) n/a
Income (Loss) before Provision (Benefit) for Income Taxes and Gain on Sale of Real Estate 28,852 28,288 (2.0)% 99,912 195,946 96.1%Provision (Benefit) for Income Taxes 23,418 2,268 (90.3)% 46,157 29,497 (36.1)%(Gain) Loss on Sale of Real Estate, Net of Tax (325) 638 n/a (325) (925) n/aIncome (Loss) from Continuing Operations 5,759 25,382 n/a 54,080 167,374 n/a(Loss) Income from Discontinued Operations, Net of Tax 2,041 (1,058) n/a 3,628 (3,421) n/aNet Income (Loss) 7,800 24,324 n/a 57,708 163,953 n/a
Less: Net Income (Loss) Attributable to Noncontrolling Interests 720 (21) n/a 1,822 2,853 56.6%Net Income (Loss) Attributable to Iron Mountain Incorporated $7,080 $24,345 n/a $55,886 $161,100 n/a
Earnings (Losses) per Share - Basic:Income (Loss) from Continuing Operations $0.02 $0.10 n/a $0.22 $0.62 n/aTotal Income (Loss) from Discontinued Operations $0.01 $0.00 n/a $0.02 ($0.01) n/aNet Income (Loss) Attributable to Iron Mountain Incorporated $0.03 $0.09 n/a $0.23 $0.61 n/a
Earnings (Losses) per Share - Diluted:Income (Loss) from Continuing Operations $0.02 $0.10 n/a $0.22 $0.62 n/aTotal Income (Loss) from Discontinued Operations $0.01 $0.00 n/a $0.02 ($0.01) n/aNet Income (Loss) Attributable to Iron Mountain Incorporated $0.03 $0.09 n/a $0.23 $0.61 n/a
Weighted Average Common Shares Outstanding - Basic 263,269 265,198 0.7% 240,394 264,423 10.0%Weighted Average Common Shares Outstanding - Diluted 264,502 266,139 0.6% 241,520 265,293 9.8%

www.ironmountain.com Selected metric definitions are available in the Appendix 14
Reconciliation of Income (Loss) from Continuing Operations to Adjusted EBITDA
(1) Net of tax provision of $0.6mm in Q3 2017 and YTD 2017. (2) Includes realized and unrealized FX (gains) losses. (3) Other Expense (Income), Net for the nine months ended September 30, 2017 includes a gain of approximately $38.9 million recognized in the second quarter of 2017 associated with the sale of our business in
Russia and Ukraine.
Sect
ion
VIII
Sect
ion
IX
Sect
ion
VII
Sect
ion
VI
Sect
ion
V Se
ctio
n X
Sect
ion
IV
Sect
ion
III
Sect
ion
II Se
ctio
n I
Q3 2016 Q3 2017 % Change YTD 2016 YTD 2017 % Change
Income from Continuing Operations $5,759 $25,382 n/a $54,080 $167,374 n/a
Add / (Deduct): Interest Expense, Net 83,300 88,989 6.8% 225,228 265,010 17.7%Provision (Benefit) for Income Taxes 23,418 2,268 (90.3)% 46,157 29,497 (36.1)%(Gain) Loss on Sale of Real Estate, Net of Tax(1) (325) 638 n/a (325) (925) n/aDebt Extinguishment Expense - 48,298 n/a 9,283 48,298 n/aForeign Currency Transaction Losses (Gains)(2) 10,685 11,865 11.0% 15,336 27,900 81.9%Other Expense (Income), Net(3) 12,617 (684) n/a 12,387 (42,449) n/aRecall Costs 34,133 18,047 (47.1)% 102,872 58,595 (43.0)%Loss (Gain) on Disposal/Write-Dow n of PP&E (excluding Real Estate), Net (54) (292) n/a (1,131) (967) (14.5)%Depreciation and Amortization 124,670 128,513 3.1% 326,896 381,319 16.6%
Adjusted EBITDA $294,203 $323,024 9.8% $790,783 $933,652 18.1%

www.ironmountain.com Selected metric definitions are available in the Appendix 15
Reconciliation of Reported Earnings per Share to Adjusted Earnings per Share
(1) The difference between our effective tax rate and our structural tax rate (or adjusted effective tax rate) for the three and nine months ended September 30, 2016 and 2017, respectively, is primarily due to (i) the reconciling items above, which impact our reported income (loss) from continuing operations before provision (benefit) for income taxes but have an insignificant impact on our reported provision (benefit) for income taxes and (ii) other discrete tax items. Our structural tax rate for purposes of the calculation of Adjusted EPS was 18.6% for the three and nine months ended September 30, 2016 and 21.5% for the three and nine months ended September 30, 2017. The Tax Impact of Reconciling Items and Discrete Tax Items is calculated using the current quarter’s estimate of the annual structural tax rate for both the three nine and YTD periods. This may result in the current period adjustment plus prior reported quarterly adjustments to not sum to the YTD adjustment.
Sect
ion
IX
Sect
ion
VIII
Sect
ion
IX
Sect
ion
VII
Sect
ion
VI
Sect
ion
V Se
ctio
n X
Sect
ion
IV
Sect
ion
III
Sect
ion
II Se
ctio
n I
Q3 2016 Q3 2017 % Change YTD 2016 YTD 2017 % Change
Reported EPS - Fully Diluted from Continuing Operations 0.02$ 0.10$ n/a 0.22$ 0.62$ n/a
Add (Deduct):Gain on Sale of Real Estate, Net of Tax - - - - Income (Loss) Attributable to Noncontrolling Interests - - - 0.01 Debt Extinguishment Expense - 0.18 0.04 0.18 Foreign Currency Transaction Losses (Gains) 0.04 0.04 0.06 0.11 Other Expense (Income), Net 0.05 (0.00) 0.05 (0.16) (Gain) Loss on Disposal/Write-Dow n of PP&E (excluding Real Estate), Net - - - - Recall Costs 0.13 0.07 0.43 0.22 Tax Impact of Reconciling Items and Discrete Tax Items(1) 0.03 (0.08) 0.01 (0.12)
Adjusted EPS - Fully Diluted from Continuing Operations 0.27$ 0.31$ 14.8% 0.80$ 0.85$ 6.3%

www.ironmountain.com Selected metric definitions are available in the Appendix 16
Reconciliation of Net Income to FFO & AFFO
(1) Includes realized and unrealized FX (gains) losses. (2) Calculated as actual cash taxes less current tax provision and other one-time cash tax items, to reflect actual cash tax (impact)/benefit to AFFO. (3) Our structural tax rate for purposes of calculation of Adjusted EPS and FFO (Normalized) was 21.5% for the three and nine months ended September 30, 2017. For 2016, the structural tax rate was 18.6% for
the three and nine months ended September 30, 2016. The Tax Impact of Reconciling Items and Discrete Tax Items is calculated using the current quarter’s estimate of the annual structural tax rate for both the three months and YTD periods. This may result in the current period adjustment plus prior reported quarterly adjustments to not sum to the YTD adjustment.
(4) Non-Real Estate Investment excludes Recall integration CapEx of $4.6mm and $3.4mm in Q3 2016 and Q3 2017, respectively. It also excludes Recall integration CapEx of $6.5mm and $14.9mm in YTD 2016 and YTD 2017, respectively
(5) Maintenance CapEx excludes Recall integration maintenance expense of $0.3mm and $0.8mm in Q3 2016 and Q3 2017, respectively. It also excludes Recall integration maintenance expense of $0.5mm and $2.2mm in YTD 2016 and YTD 2017, respectively.
Sect
ion
VIII
Sect
ion
IX
Sect
ion
VII
Sect
ion
VI
Sect
ion
V Se
ctio
n X
Sect
ion
IV
Sect
ion
III
Sect
ion
II Se
ctio
n I
Q3 2016 Q3 2017 % Change YTD 2016 YTD 2017 % Change
Net Income $7,800 $24,324 n/a $57,708 $163,953 n/aAdd / (Deduct):
Real Estate Depreciation 61,655 64,533 165,037 193,402(Gain) Loss on Sale of Real Estate, Net of Tax (325) 638 (325) (925)
FFO (NAREIT) $69,130 $89,495 29.5% $222,420 $356,430 60.3%
Add / (Deduct):(Gain) Loss on Disposal/Write-Dow n of PP&E (excluding Real Estate), Net (54) (292) (1,131) (967)Foreign Currency Transaction (Gains) Losses(1) 10,685 11,865 15,336 27,900 Debt Extinguishment Expense - 48,298 9,283 48,298 (Income) Other Expense, Net 12,617 (684) 12,387 (42,449) Tax Impact of Reconciling Items and Discrete Tax Items(2) 7,345 (20,419) 1,672 (32,277) (Income) Loss from Discontinued Operations, Net of Tax (2,041) 1,058 (3,628) 3,421 Recall Costs 34,133 18,047 102,872 58,595
FFO (Normalized) $131,815 $147,368 11.8% $359,211 $418,951 16.6%
Add / (Deduct):Non-Real Estate Depreciation 36,706 36,040 102,243 109,078Amortization of Customer Relationship Intangible Assets 26,310 27,940 59,616 78,839Amortization of Deferred Financing Costs 3,588 4,029 9,240 11,904Revenue Reduction Associated w ith Amortization of Permanent Withdraw al Fees 2,946 2,721 9,047 8,627Non-Cash Rent Expense (Income) 389 (404) (970) 5,483 Stock-based Compensation Expense 5,957 7,761 21,870 22,853 Reconciliation to Normalized Cash Taxes(3) (1,759) 14,127 10,339 16,694
Less:Non-Real Estate Investment(4) 7,655 7,099 21,454 18,845Real Estate and Non-Real Estate Maintenance CapEx(5) 21,950 22,375 49,751 55,458
AFFO $176,347 $210,108 19.1% $499,391 $598,126 19.8%
Per Share Amounts (Fully Diluted Shares)
FFO (NAREIT) $0.26 $0.34 30.8% $0.92 $1.34 45.7%FFO (Normalized) $0.50 $0.55 10.0% $1.49 $1.58 6.0%
Weighted Average Common Shares Outstanding - Basic 263,269 265,198 0.7% 240,394 264,423 10.0%Weighted Average Common Shares Outstanding - Diluted 264,502 266,139 0.6% 241,520 265,293 9.8%

www.ironmountain.com Selected metric definitions are available in the Appendix 17
Reconciliation of Cash Flow from Operations to AFFO
(1) Calculated as actual cash taxes less current tax provision and other one-time cash tax items, to reflect actual cash tax (impact)/benefit to AFFO. (2) Working capital adjustments in Q3 2017 are driven primarily by changes in accounts receivables, taxes, accounts payable, employee benefit-related accruals, deferred rent and deferred revenue. (3) Non-Real Estate Investment CapEx excludes $4.6mm and $3.4mm of Recall integration CapEx in Q3 2016 and Q3 2017, respectively. It also excludes $6.5mm and $14.9mm of Recall integration
CapEx in YTD 2016 and YTD 2017, respectively. (4) Real Estate and Non-Real Estate Maintenance CapEx excludes $0.3mm and $0.8mm of Recall integration CapEx in Q3 2016 and Q3 2017, respectively. It also excludes $0.5mm and $2.2mm of
Recall integration CapEx in YTD 2016 and YTD 2017, respectively. (5) Includes Large Volume Accounts (“LVA”) amortization, impairment of long-term assets and foreign currency adjustments.
Sect
ion
IX
Sect
ion
VIII
Sect
ion
IX
Sect
ion
VII
Sect
ion
VI
Sect
ion
V Se
ctio
n X
Sect
ion
IV
Sect
ion
III
Sect
ion
II Se
ctio
n I
Q3 2016 Q3 2017 % Change YTD 2016 YTD 2017 % Change
Cash Flow from from Operating Activities-Continuing Operations 213,347 200,251 (6.1)% 418,952 522,290 24.7%Adjust for:
Tax on Gain from Disposition of Real Estate 34 640 n/a 34 640 n/aTax Impact of Reconciling Items and Discrete Tax Items Net of Deferred Tax 19,639 (1,736) n/a 23,868 (4,058) n/aReconciliation to Normalized Cash Taxes(1) (1,759) 14,127 n/a 10,339 16,694 61.5%Recall Costs 34,133 18,047 (47.1%) 102,872 58,595 (43.0%)Working Capital Adjustments(2) (59,551) 9,589 n/a 16,738 84,086 n/aNon-Real Estate Investment CapEx(3) (7,655) (7,099) (7.3)% (21,454) (18,845) (12.2)%Real Estate and Non-Real Estate Maintenance CapEx(4) (21,950) (22,375) 1.9% (49,751) (55,458) 11.5%Other and FX(5) 109 (1,336) n/a (2,207) (5,818) n/a
AFFO $176,347 $210,108 19.1% $499,391 $598,126 19.8%

www.ironmountain.com Selected metric definitions are available in the Appendix 18
Quarterly Revenue Growth Bridge ($mm)
2% Reported R$
1% C$
$11
$12
Q3 2016 Revenue - Reported $
$943
Q3 2017 Revenue - Reported $
$966
Revenue Growth Excluding FX Benefit
Q3 2016 Revenue at Q3 2017 FX Rates
$954
FX Impact at Q3 2017 FX Rates
Sect
ion
VIII
Sect
ion
IX
Sect
ion
VII
Sect
ion
VI
Sect
ion
V Se
ctio
n IV
Se
ctio
n III
Se
ctio
n II
Sect
ion
I Se
ctio
n X

www.ironmountain.com Selected metric definitions are available in the Appendix 19
Quarterly Adjusted EBITDA Bridge ($mm)
8% C$
$25
$4
Q3 2017 Adjusted EBITDA - Reported $
$323
Growth Excluding FX Benefit
Q3 2016 Adjusted EBITDA at Q3 2017 FX Rates
$298
FX Impact at Q3 2017 FX Rates
Q3 2016 Adjusted EBITDA - Reported $
$294
10% Reported R$
Sect
ion
VIII
Sect
ion
IX
Sect
ion
VII
Sect
ion
VI
Sect
ion
V Se
ctio
n X
Sect
ion
IV
Sect
ion
III
Sect
ion
II Se
ctio
n I

www.ironmountain.com Selected metric definitions are available in the Appendix 20
Storage and Service Reconciliation
Sect
ion
VIII
Sect
ion
IX
Sect
ion
VII
Sect
ion
VI
Sect
ion
X Se
ctio
n III
Se
ctio
n II
Sect
ion
I Se
ctio
n V
Sect
ion
IV
Q3 2016 Q3 2017 % Change YTD 2016 YTD 2017 % Change
Total Storage Revenue $576,465 $601,091 4.3% $1,576,358 $1,763,609 11.9%Add: Permanent Withdraw al Fees 5,630 6,408 13.8% 16,102 17,701 9.9%Adjusted Storage Revenue $582,095 $607,499 4.4% $1,592,460 $1,781,310 11.9%
Total Service Revenue $366,357 $364,570 (0.5%) $1,000,902 $1,090,734 9.0%Less: Permanent Withdraw al Fees (5,630) (6,408) 13.8% (16,102) (17,701) 9.9%Adjusted Service Revenue $360,727 $358,162 (0.7%) $984,800 $1,073,033 9.0%
Storage Cost of Sales (COS)Storage COS Excluding Rent 77,775 77,375 (0.5%) 203,783 222,879 9.4%Storage Rent 73,329 75,462 2.9% 191,389 220,757 15.3%
Total Storage COS 151,104 152,837 1.1% 395,172 443,636 12.3%
Service Cost of Sales (COS)Service COS Excluding Rent 269,685 259,428 (3.8%) 741,707 790,065 6.5%Service Rent 4,562 3,003 (34.2%) 9,895 9,598 (3.0%)
Total Service COS 274,247 262,431 (4.3%) 751,602 799,663 6.4%
Recall Cost of Sales Expenses 4,457 3,059 (31.4%) 4,788 16,019 n/aTotal COS $429,808 $418,327 (2.7%) $1,151,562 $1,259,318 9.4%
SG&A CostsStorage Overhead 33,844 29,906 (11.6%) 97,746 96,991 (0.8%)Service Overhead 23,848 19,950 (16.3%) 68,926 65,878 (4.4%)Corporate Overhead 105,004 115,654 10.1% 297,699 327,644 10.1%Recall Costs Included in SG&A 29,676 14,988 (49.5%) 98,084 42,576 (56.6%)Sales and Marketing 60,572 61,859 2.1% 175,332 186,879 6.6%
Total SG&A $252,944 $242,357 (4.2%) $737,787 $719,968 (2.4%)
Adjusted EBITDATotal Storage Adjusted EBITDA 397,147 424,756 7.0% 1,099,542 1,240,683 12.8%Total Service Adjusted EBITDA 62,632 75,781 21.0% 164,272 207,492 26.3%Less: Corporate Overhead and Sales and Marketing (165,576) (177,513) 7.2% (473,031) (514,523) 8.8%
Total Adjusted EBITDA $294,203 $323,024 9.8% $790,783 $933,652 18.1%

www.ironmountain.com Selected metric definitions are available in the Appendix 21
Storage Net Operating Income (NOI)
(1) Includes Data Center, Fine Art Storage, Consumer Storage, Technology Escrow Services, Digital Storage, Fulfillment Services, Information Governance and Digital Solutions, Entertainment Services and other ancillary storage revenues.
(2) Includes Rent Expense, Building Maintenance, Property Taxes, Utilities and Insurance costs. (3) Refer to page 20 and Appendix for overhead allocations and definitions.
Sect
ion
VIII
Sect
ion
IX
Sect
ion
VII
Sect
ion
VI
Sect
ion
V Se
ctio
n IV
Se
ctio
n III
Se
ctio
n II
Sect
ion
I Se
ctio
n X
Q3 2016 Q3 2017 % Change YTD 2016 YTD 2017 % Change
Revenue from Storage Rental ActivitiesRecords Management $456,850 $473,449 3.6% $1,239,433 $1,386,794 11.9%
Data Protection 85,844 90,537 5.5% 243,739 266,247 9.2%Other(1) 33,771 37,105 9.9% 93,186 110,568 18.7%
Total Storage Rental $576,465 $601,091 4.3% $1,576,358 $1,763,609 11.9%Terminations/Permanent Withdraw al Fees 5,630 6,408 13.8% 16,102 17,701 9.9%
Total Revenue from Adjusted Storage Rental Activities $582,095 $607,499 4.4% $1,592,460 $1,781,310 11.9%Less: Storage Rental Expenses
Facility Costs(2) 136,976 141,766 3.5% 361,157 410,779 13.7%
Storage Rental Labor 4,557 2,927 (35.8)% 12,152 9,697 (20.2)%
Other Storage Rental Expenses 9,571 8,144 (14.9)% 21,863 23,160 5.9%
Storage Cost of Sales 151,104 152,837 1.1% 395,172 443,636 12.3%Allocated Overhead(3) 33,844 29,906 (11.6)% 97,746 96,991 (0.8)%
Total Storage Rental Expenses 184,948 182,743 (1.2)% 492,918 540,627 9.7%
Total Storage Adjusted EBITDA $397,147 $424,756 7.0% $1,099,542 $1,240,683 12.8%Total Storage Adjusted EBITDA Margin 68.2% 69.9% 170 bps 69.0% 69.7% 60 bps
Storage Rent 73,329 75,462 2.9% 191,389 220,757 15.3%
Storage Rental Expenses (excluding Storage Rent) $111,619 $107,281 (3.9)% $301,529 $319,870 6.1%
Storage Net Operating Income $470,476 $500,218 6.3% $1,290,931 $1,461,440 13.2%Storage Net Operating Income Margin 80.8% 82.3% 150 bps 81.1% 82.0% 100 bps

www.ironmountain.com Selected metric definitions are available in the Appendix
Service Business Detail
22
(1) Includes Fulfillment Services, Information Governance and Digital Solutions, Technology Escrow Services, Data Center, Consulting, Entertainment Services, Fine Art Storage, Consumer Storage and other ancillary services.
(2) Includes Building Maintenance, Property Taxes, Utilities, Facility Rent and Insurance costs for shredding, imaging and other services. (3) Refer to page 20 and Appendix for overhead allocations and definitions.
Sect
ion
VIII
Sect
ion
IX
Sect
ion
VII
Sect
ion
VI
Sect
ion
V Se
ctio
n IV
Se
ctio
n III
Se
ctio
n II
Sect
ion
I Se
ctio
n X
Q3 2016 Q3 2017 % Change YTD 2016 YTD 2017 % ChangeService Operations Revenue by Product Line
Records Management $170,055 $165,355 (2.8)% $479,371 $496,930 3.7%Data Protection 44,988 41,054 (8.7)% 128,087 123,111 (3.9)%Shredding 89,951 92,957 3.3% 233,035 281,116 20.6%Other(1) 61,363 65,204 6.3% 160,409 189,577 18.2%
Total Service Revenue $366,357 $364,570 (0.5)% $1,000,902 $1,090,734 9.0%
Less: Terminations/Permanent Withdraw al Fees 5,630 6,408 13.8% 16,102 17,701 9.9%Adjusted Service Revenue $360,727 $358,162 (0.7)% $984,800 $1,073,033 9.0%
Less: Service ExpensesFacility Costs(2) 9,559 8,282 (13.4)% 22,492 24,584 9.3%Service Labor 194,902 188,713 (3.2)% 548,903 578,829 5.5%Other Service Expenses 69,786 65,436 (6.2)% 180,207 196,250 8.9%Service Cost of Sales 274,247 262,431 (4.3)% 751,602 799,663 6.4%Allocated Overhead(3) 23,848 19,950 (16.3)% 68,926 65,878 (4.4)%
Total Service Expenses 298,095 282,381 (5.3)% 820,528 865,541 5.5%
Total Service Adjusted EBITDA $62,632 $75,781 21.0% $164,272 $207,492 26.3%Total Service Adjusted EBITDA Margin 17.4% 21.2% 380 bps 16.7% 19.3% 270 bps
Service Rent 4,562 3,003 (34.2)% 9,895 9,598 (3.0)%
Total Service Adjusted EBITDAR $67,194 $78,784 17.2% $174,167 $217,090 24.6%Total Service Adjusted EBITDAR Margin 18.6% 22.0% 340 bps 17.7% 20.2% 250 bps

www.ironmountain.com Selected metric definitions are available in the Appendix
Gross Book Value of Real Estate Assets
23 (1) Includes warehouse equipment, vehicles, furniture, fixtures, computer hardware and software.
Sect
ion
VIII
Sect
ion
IX
Sect
ion
VII
Sect
ion
X Se
ctio
n VI
Se
ctio
n V
Sect
ion
IV
Sect
ion
III
Sect
ion
II Se
ctio
n I Real Estate Assets
Storage OperationsLand $282,944Buildings & Building Improvements 1,884,027 Leasehold Improvements 526,460 Racking 1,796,553 Construction In Progress 127,524 Total Storage Gross Book Value $4,617,508
Service OperationsLand $9,043Buildings & Building Improvements 67,822 Leasehold Improvements 53,149 Racking 166,669 Construction In Progress 2,169 Total Service Gross Book Value $298,852
Total Real Estate Gross Book Value $4,916,360
Non-Real Estate AssetsAll Other Non-Real Estate Assets Gross Book Value(1) 1,177,735
Total PP&E Gross Book Value $6,094,095
As of 9/30/2017

www.ironmountain.com Selected metric definitions are available in the Appendix
Lease Obligations(1)
(1) Includes capital and operating lease obligations. (2) Reflects month to month leases and predominantly short term occupancies.
Weighted Average Remaining Lease Obligations (exercise of all extension options): 11.6 years
54.3%
2019
3.9%
2020 2023
4.5%
2021
5.4%
3.8%
2025
3.5%
2022
2.8%
3.8%
2024 Thereafter
4.3% 4.3%
2026 2027
6.2%
3.4%
2017 2018
Facility Lease Expirations (% of total square feet subject to lease)
Assuming Exercise of All Extension Options
24
Sect
ion
VIII
Sect
ion
IX
Sect
ion
VII
Sect
ion
X Se
ctio
n VI
Se
ctio
n V
Sect
ion
IV
Sect
ion
III
Sect
ion
II Se
ctio
n I
(2)

www.ironmountain.com Selected metric definitions are available in the Appendix
Global Real Estate Portfolio(1)
25
(1) Includes real estate held in joint ventures. (2) Includes South Africa and United Arab Emirates. (3) Out of the 51 leased building additions and expansions, 41 were the result of acquiring leases in business acquisitions and leased buildings related to acquisitions of customer relationships.
(000s, except for number of buildings)
Sect
ion
VIII
Sect
ion
IX
Sect
ion
VII
Sect
ion
VI
Sect
ion
V Se
ctio
n IV
Se
ctio
n III
Se
ctio
n II
Sect
ion
I Se
ctio
n X
Top Ten Markets Owned, United States Sq. Feet OwnedNorthern New Jersey 2,099Boston 1,428Chicago 1,282Dallas 1,075Los Angeles 1,040Houston 917Philadelphia 858New York 825Baltimore / Washington 777San Francisco Bay Area 742
Top Ten Markets Owned, International Sq. Feet OwnedLondon, UK 1,102Paris, France 807Montreal, Canada 552Buenos Aires, Argentina 470Mexico City, Mexico 452Toronto, Canada 434Lima District, Peru 302Edinburgh, UK 289Singapore, Singapore 274Calgary, Canada 270
TotalBuildings Sq. Ft. Buildings Sq. Ft. Buildings Sq. Ft.
North America 200 21,734 554 34,570 754 56,304 Europe(2) 58 3,529 268 11,423 326 14,952 Latin America 36 1,914 89 4,602 125 6,516 Asia 8 455 200 7,611 208 8,066 International x 102 5,898 557 23,635 659 29,534
Total 302 27,632 1,111 58,205 1,413 85,837
TotalBuildings Sq. Ft. Buildings Sq. Ft. Buildings Sq. Ft.
North America 2 245 16 633 18 877 Europe(2) 3 150 19 464 22 614 Latin America - - 12 535 12 535 Asia - - 4 100 4 100 International x 3 150 35 1,100 38 1,250
Total 5 394 51 1,732 56 2,127
TotalBuildings Sq. Ft. Buildings Sq. Ft. Buildings Sq. Ft.
North America - - (14) (545) (14) (545) Europe(2) - - (9) (161) (9) (161) Latin America - - (3) (120) (3) (120) Asia - - (10) (235) (10) (235) International x - - (22) (516) (22) (516)
Total - - (36) (1,060) (36) (1,060)
TotalBuildings Sq. Ft. Buildings Sq. Ft. Buildings Sq. Ft.
North America 202 21,978 556 34,658 758 56,636 Europe(2) 61 3,679 278 11,727 339 15,405 Latin America 36 1,914 98 5,017 134 6,932 Asia 8 455 194 7,476 202 7,931 International x 105 6,048 570 24,219 675 30,268
Total 307 28,026 1,126 58,877 1,433 86,904
Total % 21.4% 32.3% 78.6% 67.7%
As of 6/30/2017
Q3 2017 Additions & Expansions
Q3 2017 Dispositions & Move Outs
As of 9/30/2017
Owned Facilities Leased Facilities
Leased Facilities
Leased Facilities(3)
Owned Facilities
Owned Facilities
Owned Facilities
Leased Facilities

www.ironmountain.com Selected metric definitions are available in the Appendix
Revenue from Rental Activities and Storage NOI per Racked Square Foot
26
(1) Includes South Africa and United Arab Emirates. (2) Includes loading docks, unracked space, office space, common areas, as well as space in service-related facilities. (3) Excludes Revenue and NOI associated with Technology Escrow Services, Fulfillment Services, Data Center, Entertainment Services, Fine Art Storage, Consumer Storage and other ancillary storage revenue.
Sect
ion
VIII
Sect
ion
IX
Sect
ion
VII
Sect
ion
X Se
ctio
n VI
Se
ctio
n V
Sect
ion
IV
Sect
ion
III
Sect
ion
II Se
ctio
n I Square Footage by Region As of September 30, 2017
North America Europe(1)
Latin America Asia Total
Records Management Racked Space 40,643 10,544 4,781 4,443 60,410
Data Protection Racked Space 713 143 32 18 906
Other(2) 15,280 4,719 2,119 3,470 25,588
Total 56,636 15,405 6,932 7,931 86,904
Annualized Revenue from Rental Activities and Storage NOI per Racked Square Foot(3)
Q3 2017 Annualized
Revenue NOI
North America Records Management $ per Sq Ft $29.71 $24.78
Data Protection $ per Sq Ft $368.73 $333.91
Europe(1) $38.50 $32.83
Latin America $39.55 $35.28
Asia $46.90 $41.37
Total $37.21 $31.81

www.ironmountain.com Selected metric definitions are available in the Appendix
Portfolio Utilization
Records Management Storage Portfolio (CuFt MM) As of 9/30/2017
6864132
5767130
700
600
500
100
0
-2.2%
-0.9%
-1.6%
-17.2% +3.6%
Total IRM
677 693
Asia Latin America Europe North America
425 429
800
700
600
500
100
0 Total IRM
798 740
85% 92%
Asia
66 58 85% 97%
Latin America
78 72 86% 93%
Europe
152 142
85% 92%
North America
501 468
85% 91%
Utilization and Capacity(3) (%)
2611
2613
50
80 70 60
90
40 30 20 10
0
+6.2%
+13.6%
+7.4%
Europe North America
66 63
+45.1% -2.2%
Total IRM
87 81
Asia Latin America
130 120 110 100 90 80
20 10
0 Total IRM
124
106
71% 82%
Asia
3 3 71% 88%
Latin America
8 7 75% 85%
Europe
24 17
53% 76%
North America
88 80
75% 83%
Data Protection Storage Portfolio (DPUs MM) As of 9/30/2017 (IRM Standalone) (2)
(1) RM units stored includes cubic feet of storage in dedicated space leased to customers on a square foot basis; these dedicated space storage units are excluded from our RM volume growth chart on page 10. Dispositions reflects business volume net of dispositions required by Recall transaction and sale of Russia / Ukraine business.
(2) DPUs do not reflect data for Recall, because Recall’s unit of measurement for tapes is not consistent with Iron Mountain’s methodology. We are in the process of converting Recall’s data to be able to report DPUs.
(3) We operate our storage business to achieve a desired utilization of between 94% – 98% to attain maximum operating efficiency. (4) Includes South Africa and United Arab Emirates.
27
YoY Growth in Units Stored(1)
(4) (4)
(4) (4)
Sect
ion
VIII
Sect
ion
IX
Sect
ion
VII
Sect
ion
X Se
ctio
n VI
Se
ctio
n V
Sect
ion
IV
Sect
ion
III
Sect
ion
II Se
ctio
n I
Q3 2017 Q2 2017 Q1 2017 Q4 2016 Q3 2016
Q3 2017 Total Potential Building Cap. Q3 2017 Total Installed Racking Cap.

www.ironmountain.com Selected metric definitions are available in the Appendix
Customer Data
28
(1) No single vertical within ‘Other’ comprises greater than 1% of North America Revenue. (2) Customer acquisition costs include the acquisition of customer relationships and customer inducements.
Federal
Healthcare
Financial
Legal
Insurance Life Sciences
Energy Business Services
44% Other
17%
2%
9%
14%
7% 3% 3%
2%
North America Q3 2017 Trailing Twelve Months Revenue by Vertical
Iron Mountain provides storage and information management services to more than 230,000 customers in 53 countries around the world. This high quality, diversified customer base comprising numerous industries and government organizations includes approximately 95% of the Fortune 1000. No single customer accounted for more than 1% of revenues, or 2% of volume, and our top 20 customers have historically represented approximately 6% of consolidated revenues. Customer retention is consistently high with annual losses limited to approximately 2% (on a volume basis), attributable to customer terminations.
(1)
Sect
ion
VIII
Sect
ion
IX
Sect
ion
VII
Sect
ion
X Se
ctio
n VI
Se
ctio
n V
Sect
ion
IV
Sect
ion
III
Sect
ion
II Se
ctio
n I
YTD 2017 Full Year 2016 Full Year 2015 Full Year 2014Customer Quality Metrics
Volume Retention Rate (RM Global) 94.0% 92.6% 93.3% 93.7%
Bad Debt Expense as a % of Consolidated Revenues 0.2% 0.2% 0.5% 0.5%
Turnover Expenditures (Storage Only) Q3 2017 YTD 2017Sales, Marketing & Account Management 38,505 115,467
Customer Acquisition Costs(2) 31,280 59,790

www.ironmountain.com Selected metric definitions are available in the Appendix
Debt Schedule
29
$254
$1,000
2024
$300
2025
$354
2026 2027 2023
$1,000 $800
2022
$2,191
$1,655
2021
$500
2020
$270
Thereafter
30%
70%
Fixed vs. Floating Rate Debt at 9/30/17(4)
Debt Maturity Schedule ($MM)
Floating Rate Debt Fixed Rate Debt
(1) Includes $16mm and $50mm of mortgage notes payable in 2020 and 2026, respectively. (2) Accounts Receivable securitization. (3) Includes AUD Term Loan B of $189mm. (4) Adjusting to include capital lease and other international borrowings yields a ratio of 71% fixed and 29% floating.
Floating Rate Debt at 9/30/17 Fixed Rate Debt at 9/30/17
Sect
ion
VIII
Sect
ion
IX
Sect
ion
VII
Sect
ion
VI
Sect
ion
V Se
ctio
n IV
Se
ctio
n III
Se
ctio
n II
Sect
ion
I Se
ctio
n X
(1) (1)
(2)
(3)

www.ironmountain.com Selected metric definitions are available in the Appendix
Capitalization
30
(1) Total debt net of cash is calculated as current portion of long-term debt of $180mm plus long-term debt net of current portion of $6,700mm plus $75mm of deferred financing costs less cash and cash equivalents of $338mm.
Sect
ion
VIII
Sect
ion
IX
Sect
ion
VII
Sect
ion
VI
Sect
ion
V Se
ctio
n IV
Se
ctio
n III
Se
ctio
n II
Sect
ion
I Se
ctio
n X
Total Market Capitalization as of 9/30/2017
# of Shares Outstanding 266,882Share Price as of 9/30/2017 $38.89Total Equity Value $10,379,052Total Debt, Net of Cash(1) $6,617,779
Total Market Capitalization $16,996,831
Net Debt to Total Market Capitalization 39%Adj. EBITDA to Interest Expense 3.6xTotal Market Capitalization to Adjusted EBITDA 13.4x
Credit Ratings
S&P Moody's Corporate BB- Ba3Senior Credit Facility BB Ba3Senior Unsecured BB- Ba3Senior Subordinated B B2
Total Debt Weighted Average Rates (as of 9/30/2017)
Interest 5.0%Maturity 6.1
Senior Credit Facility (as of 9/30/2017)
Capacity $1,996,875Outstanding $1,412,413Letters of Credit $53,646Remaining Capacity $530,816Interest Rate Spread (Prime) 1.00%Interest Rate Spread (LIBOR) 2.00%Weighted Average Interest Rate 3.19%Maturity Date 8/21/22
Senior Credit Facility Debt Covenant Analysis (as of 9/30/2017)
Metric Limit CurrentFixed Charge Ratio ≥ 1.5x 2.2xNet Total Lease Adjusted Leverage Ratio ≤ 6.5x 5.5xNet Secured Lease Adjusted Leverage Ratio ≤ 4.0x 2.3x
Senior Subordinated and Senior Unsecured Notes (as of 9/30/2017)Senior Senior Senior Senior Senior Senior Senior Senior
Type of Note Subordinated Unsecured Unsecured Unsecured Unsecured Unsecured Unsecured UnsecuredIssuance Date 8/7/12 8/13/13 9/18/14 5/27/16 5/27/16 9/15/16 5/18/17 9/18/17Denomination USD USD GBP USD USD CAD EUR USDOriginal Principal Amount (FX Rate on Issue Date) $1,000,000 $600,000 $654,960 $500,000 $250,000 $189,537 $336,894 $1,000,000Exchange Rate at 9/30/2017 1.0000 1.0000 1.3398 1.0000 1.0000 0.8018 1.1815 1.0000Principal Amount at 9/30/2017 $1,000,000 $600,000 $535,902 $500,000 $250,000 $200,449 $354,435 $1,000,000Yield (on Issue Date) 5.750% 6.000% 6.125% 4.375% 5.375% 5.375% 3.000% 4.875%Maturity Date 8/15/24 8/15/23 9/15/22 6/1/21 6/1/26 9/15/23 1/15/25 9/15/27Current Call Price N/A 102.875 104.594 N/A N/A N/A N/A N/ANext Call Date 8/15/18 8/15/18 9/15/18 6/1/18 6/1/21 9/15/19 6/15/20 9/15/22Next Call Price 101.917 103.000 103.063 102.188 102.688 104.031 101.500 102.438

www.ironmountain.com Selected metric definitions are available in the Appendix
Capital Expenditures and Investments
31
(1) Includes Recall Integration CapEx of $4.9mm and $6.3mm in Q3 2016 and Q3 2017, respectively. Also, includes Recall CapEx of $6.9mm and $23.9mm in YTD 2016 and YTD 2017, respectively. (2) Includes $14.8mm and $24.5mm (includes $0.0mm and $20.7mm of capital lease associated with Northern Virginia) for data centers in Q3 2016 and Q3 2017, respectively. Also, includes $61.3mm and
$67.0mm (includes $0 .0mm and $53.0mm of capital lease associated with Northern Virginia) for data centers in YTD 2016 and YTD 2017, respectively. (3) Includes Land, Buildings, Improvements, and Racking Structures. (4) Includes FORTRUST non-cash consideration of $83.0mm in Q3 2017 and YTD 2017. (5) Excludes accrual adjustments and customer inducements.
Sect
ion
VIII
Sect
ion
IX
Sect
ion
VII
Sect
ion
VI
Sect
ion
V Se
ctio
n IV
Se
ctio
n III
Se
ctio
n II
Sect
ion
I Se
ctio
n X
Q3 2016 Q3 2017 % Change YTD 2016 YTD 2017 % ChangeCapital Expenditures(1) and Investments
Real Estate:Investment(2)(3) $48,109 $60,635 26.0% $157,272 $175,808 11.8%Maintenance 15,512 16,277 4.9% 35,611 38,430 7.9%
$63,621 $76,911 20.9% $192,883 $214,238 11.1%Non-Real Estate:
Investment $12,208 $10,421 (14.6)% $27,939 $33,714 20.7%Maintenance 6,755 6,861 1.6% 14,592 19,192 31.5%
$18,963 $17,282 (8.9)% $42,531 $52,906 24.4%
Innovation and Growth Investment: $3,908 $7,084 81.3% $5,816 $15,425 n/a
Total Real Estate and Non-Real Estate Capital Expenditures andInnovation and Growth Investments $86,492 $101,277 17.1% $241,230 $282,569 17.1%
Net Change in Prepaid and Accrued Capital Expenditures and Capital Leases (4,128) (22,738) n/a 4,799 (38,823) n/a
Total Cash Paid for Real Estate and Non-Real Estate CapitalExpenditures and Innovation and Growth Investments 82,364 78,539 (4.6%) 246,029 243,746 (0.9)%
Business and Customer AcquisitionsBusiness Acquisitions - $120,086 n/a $30,251 $179,851 n/aChange in Business Acquisition Accruals and Cash Acquired (182) 35,819 n/a (8,940) 14,277 n/a
Cash Paid for Acquisitions, Net of Cash Acquired, Excluding Recall (182) 155,905 n/a $21,311 194,128 n/a
Business Acquisitions Non-Cash Consideration(4) - 83,014 n/a - 83,014 n/a
Recall Acquisition Non-Cash Consideration - - n/a $1,834,983 - n/aRecall Acquisition Cash - - n/a 255,060 - n/a
Total Recall Acquisition - - n/a $2,090,043 - n/a
Total Cash Paid for Acquisitions, Net of Cash Acquired (182) 155,905 n/a 276,371 194,128 (29.8)%
Acquisition of Customer Relationships $18,227 $16,219 (11.0)% $25,212 $46,398 84.0%Customer Inducements 9,677 9,571 (1.1)% 16,099 17,044 5.9%
Total Acquisition of Customer Relationships and Customer Inducements $27,904 $25,790 (7.6)% $41,311 $63,442 53.6%
Change in Customer Acquisition Accruals (3,795) 2,587 n/a (456) (6,555) n/a
Total Cash Paid for Acquisition of Customer Relationships and Customer Inducements 24,109 28,377 17.7% 40,855 56,887 39.2%
Total Capital Expenditures, Investments and Acquisitions(5) $104,719 $320,596 n/a $2,386,736 $591,831 (75.2)%

www.ironmountain.com Selected metric definitions are available in the Appendix
Real Estate Investments(1)
32
(1) Based on 2017 C$ Budgeted FX Rates. (2) Racking Installations exclude consolidation spend in Total Expected Investment, Investment in Current Period and Cumulative Investment to Date of $24.6mm, $5.8mm and $15.3mm, respectively. (3) Includes South Africa and United Arab Emirates. (4) In USD R$ calculated using a twelve month trailing historical average. (5) North America excludes racking investments for development projects that were initiated after 1/1/2017, racking investments associated with these projects are included in the table above.
Sect
ion
VIII
Sect
ion
IX
Sect
ion
VII
Sect
ion
VI
Sect
ion
V Se
ctio
n IV
Se
ctio
n III
Se
ctio
n II
Sect
ion
I Se
ctio
n X
Real Estate Investment ActivityTotal Expected Investment in Estimated Historical Average
Investment Q3 2017 CuFt / DPUs NOI/CuFt or DPU(4)
Racking Installations(2)
North America $19,096 $3,872 $14,539 5,151 $2.47
Europe(3) 38,959 3,443 30,043 8,950 $2.30
Latin America 10,354 954 8,363 2,580 $2.22
Asia 22,447 4,049 13,405 6,871 $2.94
Worldwide $90,856 $12,317 $66,350 23,553 $2.45 8 - 12 months
Total Expected Investment in Total Potential Historical AverageInvestment Q3 2017 CuFt / DPUs NOI/CuFt or DPU(4)
Building Development ProjectsNorth America(5) $15,481 $3,475 $11,174 - 574 $2.47
Europe(3) 2,954 - 2,738 368 22 $2.30
Latin America 22,846 - 11,976 5,196 222 $2.22
Asia - - - - - $2.94
Worldwide $41,280 $3,475 $25,887 5,564 818 $2.45 24 - 36 months
Region Cumulative Investment to Date
Region
Average Stabilization Period
Total Sq Ft Average Stabilization Period
Cumulative Investment to Date
Investment Reconciliation Q3 InvestmentsRacking Installations $12,317Consolidation Related to Racking Installations 5,817Building Development Projects 3,475Total C$ Real Estate Investments 21,635Data Centers 24,487Other Real Estate Investment 9,147Total FX Impact 5,366Real Estate Investment $60,635
Data Center Investment Activity
Metropolitan Area SF Under Construction
MW Under Construction
Total Expected Investment
Expected NOI $ / MW
Expected Completion
Stabilization
Boyers, PA 34.8 2.3 $22,500.0 ~2.1 Q4 2018 Q1 2021Denver 8.6 1.6 $9,126.8 ~2.0 Q1 2018 Q4 2019Northern Virginia 89.2 7.5 $62,236.8 ~2.2 Q3 2018 Q2 2020Total 132.6 11.4 $93,863.6 ~2.1

www.ironmountain.com Selected metric definitions are available in the Appendix
2017 Business and Customer Acquisition and Disposition Activity
Acquisitions and Disposals(1)
33
Sect
ion
VIII
Sect
ion
IX
Sect
ion
VII
Sect
ion
VI
Sect
ion
V Se
ctio
n IV
Se
ctio
n III
Se
ctio
n II
Sect
ion
I Se
ctio
n X
(1) Based on 2017 C$ Budgeted FX Rates. (2) Includes South Africa and United Arab Emirates.
Purchase ExpectedPrice IRRs
2017 Building AcquisitionsNorth America $33,710 384 9%
Europe(2) - - -
Latin America - - -
Asia - - -
Worldwide $33,710 384 9%
Region Total Sq Ft
BusinessInvestments
Purchase Price $226,249Non-Cash Consideration $83,014
Capital Consideration $36,054Stabilized Total Expected Investment $262,303Estimated Annual Revenues $102,000Expected IRR Range 11% - 14%

www.ironmountain.com Selected metric definitions are available in the Appendix
Components of Value
34
(1) Excludes one month of FORTRUST. (2) Includes South Africa and United Arab Emirates. (3) Trailing four quarter prior to rental expense. (4) Includes Cash, Cash Equivalents, Restricted Cash, Accounts Receivable, Other Tangible Current Assets and Prepaid Expenses. (5) Calculated as current portion of Long-Term Debt of $180mm plus Long-Term Debt net of current portion of $6,700mm.
Sect
ion
VIII
Sect
ion
IX
Sect
ion
VII
Sect
ion
VI
Sect
ion
V Se
ctio
n IV
Se
ctio
n III
Se
ctio
n II
Sect
ion
I Se
ctio
n X
ComponentsQ3 2017 Annualized
NOI
North AmericaRecords Management $1,007,263Data Protection 238,142Other(1) 55,072
Europe(2) 347,370Latin America 168,037Asia 179,976Total Portfolio Storage NOI 1,995,859FORTRUST Storage NOI 15,025Total Storge NOI $2,010,884
Service Adjusted EBITDAR(3) $291,681
Balance at 9/30/2017
Cash, Cash Equivalents & Other Tangible Assets(4) $1,328,224Quarterly Building & Racking Investment, not reflected in NOI $15,793Quarterly Data Center Investment, not reflected in NOI $24,487Bonded Investment $73,450Customer Acquisition Consideration $16,219 Less:
Debt, Gross Book Value(5) $6,880,484Non-Controlling Interests $1,658Annualized Rental Expense $313,860Estimated Tax Liability $24,328
Q3 2017 Service Adjusted EBITDAR
www.ironmountain.com Selected metric definitions are available in the Appendix
Appendix
35
Non-GAAP Measures and Definitions
Non-GAAP measures are supplemental metrics designed to enhance our disclosure and to provide additional information that we believe to be important for investors to consider when evaluating our financial performance. These non-GAAP measures should be considered in addition to, but not as a substitute for, other measures of financial performance reported in accordance with accounting principles generally accepted in the United States of America (“GAAP”), such as operating income, income (loss) from continuing operations, net income (loss) or cash flows from operating activities from continuing operations (as determined in accordance with GAAP).
Adjusted Earnings Per Share, or Adjusted EPS
Adjusted EPS is defined as reported earnings per share fully diluted from continuing operations excluding: (1) (gain) loss on disposal/write-down of property, plant and equipment (excluding real estate), net; (2) gain on sale of real estate, net of tax; (3) intangible impairments; (4) other expense (income), net; (5) Recall Costs (as defined below); and (6) the tax impact of reconciling items and discrete tax items. Adjusted EPS includes income (loss) attributable to noncontrolling interests. We do not believe these excluded items to be indicative of our ongoing operating results, and they are not considered when we are forecasting our future results. We believe Adjusted EPS is of value to our current and potential investors when comparing our results from past, present and future periods.
Adjusted Funds From Operations, or AFFO AFFO is defined as FFO (Normalized) excluding non-cash rent expense or income, plus depreciation on non-real estate assets, amortization expense of customer relationship intangible assets, deferred financing costs and permanent withdrawal fees, stock-based compensation expense and the impact of reconciling to normalized cash taxes, less maintenance capital expenditures and non-real estate investments, excluding Recall integration capital expenditures. We believe AFFO is a useful measure in determining our ability to generate excess cash that may be used for reinvestment in the business, discretionary deployment in investments such as real estate or acquisition opportunities, returning capital to our stockholders and voluntary prepayments of indebtedness. Additionally AFFO is reconciled to cash flow from operations to adjust for real estate and REIT tax adjustments, Recall Costs and other non-cash expenses. AFFO does not include adjustments for customer inducements, acquisition of customer relationships and investment in innovation as we consider these expenditures to be growth related.
Sect
ion
VIII
Sect
ion
IX
Sect
ion
VII
Sect
ion
VI
Sect
ion
V Se
ctio
n IV
Se
ctio
n III
Se
ctio
n II
Sect
ion
I Se
ctio
n X

www.ironmountain.com Selected metric definitions are available in the Appendix
Appendix
Non-GAAP Measures and Definitions (continued) Adjusted EBITDA and Adjusted EBITDA Margin
Adjusted EBITDA is defined as income (loss) from continuing operations before interest expense, net, provision (benefit) for income taxes, depreciation and amortization, and also excludes certain items that we believe are not indicative of our core operating results, specifically: (i) (gain) loss on disposal/write-down of property, plant and equipment (excluding real estate), net; (ii) intangible impairments; (iii) other expense (income), net; (iv) gain on sale of real estate, net of tax; and (v) Recall Costs. Adjusted EBITDA Margin is calculated by dividing Adjusted EBITDA by total revenues. We use multiples of current or projected Adjusted EBITDA in conjunction with our discounted cash flow models to determine our estimated overall enterprise valuation and to evaluate acquisition targets. We believe Adjusted EBITDA and Adjusted EBITDA Margin provide our current and potential investors with relevant and useful information regarding our ability to generate cash flow to support business investment. These measures are an integral part of the internal reporting system we use to assess and evaluate the operating performance of our business.
Adjusted EBITDA excludes both interest expense, net and the provision (benefit) for income taxes. These expenses are associated with our capitalization and tax structures, which we do not consider when evaluating the operating profitability of our core operations. Finally, Adjusted EBITDA does not include depreciation and amortization expenses, in order to eliminate the impact of capital investments, which we evaluate by comparing capital expenditures to incremental revenue generated and as a percentage of total revenues. Adjusted EBITDA and Adjusted EBITDA Margin should be considered in addition to, but not as a substitute for, other measures of financial performance reported in accordance with GAAP, such as operating income, income (loss) from continuing operations, net income (loss) or cash flows from operating activities from continuing operations (as determined in accordance with GAAP).
Funds From Operations, or FFO (NAREIT), and FFO (Normalized)
Funds from operations (“FFO”) is defined by the National Association of Real Estate Investment Trusts ("NAREIT") and us as net income (loss) excluding depreciation on real estate assets and gain on sale of real estate, net of tax (“FFO (NAREIT)”). FFO (NAREIT) does not give effect to real estate depreciation because these amounts are computed, under GAAP, to allocate the cost of a property over its useful life. Because values for well-maintained real estate assets have historically increased or decreased based upon prevailing market conditions, we believe that FFO (NAREIT) provides investors with a clearer view of our operating performance. Our most directly comparable GAAP measure to FFO (NAREIT) is net income (loss). Although NAREIT has published a definition of FFO, modifications to FFO (NAREIT) are common among REITs as companies seek to provide financial measures that most meaningfully reflect their particular business. Our definition of FFO (Normalized) excludes certain items included in FFO (NAREIT) that we believe are not indicative of our core operating results, specifically: (1) (gain) loss on disposal/write-down of property, plant and equipment (excluding real estate), net; (2) intangible impairments; (3) other expense (income), net; (4) Recall Costs; (5) the tax impact of reconciling items and discrete tax items; (6) (income) loss from discontinued operations, net of tax; and (7) loss (gain) on sale of discontinued operations, net of tax.
36
Sect
ion
VIII
Sect
ion
IX
Sect
ion
VII
Sect
ion
VI
Sect
ion
V Se
ctio
n IV
Se
ctio
n III
Se
ctio
n II
Sect
ion
I Se
ctio
n X

www.ironmountain.com Selected metric definitions are available in the Appendix
Appendix
Non-GAAP Measures and Definitions (continued) FFO (Normalized) per share
FFO (Normalized) divided by weighted average fully-diluted shares outstanding.
Service Adjusted EBITDA
Service Adjusted EBITDA is calculated by taking service revenues excluding terminations and permanent withdrawals less direct expenses and overhead allocated to the service business. Terminations and permanent withdrawals are excluded from this calculations as they are included in the Storage NOI calculation.
Service Adjusted EBITDAR
Service Adjusted EBITDA as defined above, excluding rent expense associated with the service business. This is provided to enable valuation of Service Adjusted EBITDA irrespective of whether the company’s properties are leased or owned. Related rent expense is provided in the Components of Value slide.
Storage Adjusted EBITDA
Storage Adjusted EBITDA is calculated by taking storage revenues including terminations and permanent withdrawal fees less direct expenses and overhead allocated to the storage business.
Storage Net Operating Income, or Storage NOI
Storage NOI is defined as revenue from rental activities (storage rental revenue, termination fees and permanent withdrawal fees) less storage rental costs. Storage rental costs include facility costs (excluding rent), storage rental labor, other storage costs and allocated overhead. Storage NOI is commonly used in the REIT industry and enables investors to understand and value the income generated from the company’s real estate. Rent expense is excluded to enable valuation of this income irrespective of whether the company’s properties are leased or owned. Related rent expense is provided in the Components of Value slide.
37
Sect
ion
VIII
Sect
ion
IX
Sect
ion
VII
Sect
ion
VI
Sect
ion
V Se
ctio
n IV
Se
ctio
n III
Se
ctio
n II
Sect
ion
I Se
ctio
n X

www.ironmountain.com Selected metric definitions are available in the Appendix
Appendix Other Definitions Average Stabilization Period – For racking projects, the stabilization period is 8 to 12 months. For new buildings it is 24 to 36 months, assuming phased racking installations over three years. For business acquisitions it is 12 to 24 months, depending on the size of the transaction. Building Development Projects – The construction of new facilities, or three-wall additions. Business Segments
North American Records and Information Management Business (“RIM”) – Our North American Records and Information Management Business segment provides records and information management services, including the storage of physical records, including media such as microfilm and microfiche, master audio and videotapes, film, x-rays and blueprints, including healthcare information services, vital records services, service and courier operations, and the collection, handling and disposal of sensitive documents for corporate customers (“Records Management”); Destruction; and Information Governance and Digital Solutions throughout the United States and Canada; as well as fulfillment services and technology escrow services in the United States.
North American Data Management Business (“DM”) – Our North American Data Management Business segment provides storage and rotation of backup computer media as part of corporate disaster recovery plans, including service and courier operations (“Data Protection & Recovery”); server and computer backup services; digital content repository systems to house, distribute, and archive key media assets; and storage, safeguarding and electronic or physical delivery of physical media of all types, primarily for entertainment and media industry clients throughout the United States and Canada.
Western European Business – Our Western European Business segment provides records and information management services, including Records Management, Data Protection & Recovery and Information Governance and Digital Solutions throughout Austria, Belgium, France, Germany, Ireland, the Netherlands, Spain, Switzerland and the United Kingdom (consisting of our operations in England, Northern Ireland and Scotland), as well as Information Governance and Digital Solutions in Sweden (the remainder of our business in Sweden is included in the Other International Business segment described on the following page).
38
Sect
ion
VIII
Sect
ion
IX
Sect
ion
VII
Sect
ion
VI
Sect
ion
V Se
ctio
n IV
Se
ctio
n III
Se
ctio
n II
Sect
ion
I Se
ctio
n X

www.ironmountain.com Selected metric definitions are available in the Appendix
Appendix Other Definitions (continued)
Other International Business – Our Other International Business segment provides records and information management services throughout the remaining European countries in which we operate, Latin America, Asia and Africa. Our European operations included in this segment provide records and information management services, including Records Management, Data Protection & Recovery and Information Governance and Digital Solutions throughout Cyprus, the Czech Republic, Denmark, Finland, Greece, Hungary, Norway, Poland, Romania, Serbia, Slovakia, and Turkey, as well as Russia and Ukraine until May 30, 2017; Records Management and Information Governance and Digital Solutions in Estonia, Latvia and Lithuania; and Records Management in Sweden. Our Latin America operations provide records and information management services, including Records Management, Data Protection & Recovery, Destruction and Information Governance and Digital Solutions throughout Argentina, Brazil, Chile, Colombia, Mexico and Peru. Our Asia operations provide records and information management services, including Records Management, Data Protection & Recovery, Destruction and Information Governance and Digital Solutions throughout Australia and New Zealand, with Records Management and Data Protection & Recovery also provided in certain markets in China (including Macau and Taiwan), Hong Kong-SAR, India, Indonesia, Malaysia, the Philippines, South Korea, Singapore and Thailand. Our African operations provide Records Management, Data Protection & Recovery and Information Governance and Digital Solutions in South Africa. Our Middle East operations provide Records Management and Data Protection & Recovery in the United Arab Emirates.
Corporate and Other – Our Corporate and Other Business segment primarily consists of our data center and fine art storage businesses in the United States, the primary product offerings of our Adjacent Businesses operating segment, as well as costs related to executive and staff functions, including finance, human resources and information technology, which benefit the enterprise as a whole. These costs are primarily related to the general management of these functions on a corporate level and the design and development of programs, policies and procedures that are then implemented in the individual segments, with each segment bearing its own cost of implementation. Our Corporate and Other Business segment also includes stock-based employee compensation expense associated with all stock options, restricted stock units, performance units and shares of stock issued under our employee stock purchase plan.
Capacity Measures
Building Capacity – The maximum number of cubic feet of records or standard DPUs that can be stored in a given facility.
Building Capacity Utilization – The number of cubic feet of records or standard DPUs in storage divided by the Building Capacity.
Installed Racking Capacity – The storage capacity of the racking installed in a given facility. Capacity is generally measured in cubic feet or standard DPUs.
Installed Racking Capacity Utilization – The number of cubic feet of records or standard DPUs in storage divided by the Installed Racking Capacity.
39
Sect
ion
VIII
Sect
ion
IX
Sect
ion
VII
Sect
ion
VI
Sect
ion
V Se
ctio
n IV
Se
ctio
n III
Se
ctio
n II
Sect
ion
I Se
ctio
n X

www.ironmountain.com Selected metric definitions are available in the Appendix
Appendix
40
Definitions (continued) Capital Expenditures and Investments – Our business requires capital expenditures to support our expected storage rental revenue and service revenue growth and ongoing operations, new products and services and increased profitability. The majority of our capital goes to support business line growth and our ongoing operations. Additionally, we invest capital to acquire or construct real estate. We also expend capital to support the development and improvement of products and services and projects designed to increase our profitability. These expenditures are generally relatively small and discretionary in nature. We categorize our capital expenditures as follows:
Real Estate:
Investment – Real estate assets that support core business growth primarily related to investments in land, buildings, building improvements, leasehold improvements and racking structures that expand our revenue capacity in existing or new geographies, replace a long-term operational obligation or create operational efficiencies (“Real Estate Investment”).
Maintenance – Real estate assets necessary to maintain ongoing business operations primarily related to the repair or replacement of real estate assets such as buildings, building improvements, leasehold improvements and racking structures (“Real Estate Maintenance”).
Non-Real Estate:
Investment – Non-real estate assets that either (i) support the growth of our business, and/or increase our profitability, such as customer-inventory technology systems, and technology service storage and processing capacity, or (ii) are directly related to the development of core products or services in support of our integrated value proposition and enhance our leadership position in the industry, including items such as increased feature functionality, security upgrades or system enhancements (“Non-Real Estate Investment”). Prior to Q1 2017, Innovation and Growth Investment was included in Non-Real Estate Investment.
Maintenance – Non-real estate assets necessary to maintain ongoing business operations primarily related to the repair or replacement of customer-facing assets such as containers and shred bins, warehouse equipment, fixtures, computer hardware, or third-party or internally-developed software assets. This category also includes operational support initiatives such as sales and marketing and information technology projects to support infrastructure requirements (“Non-Real Estate Maintenance”).
Innovation and Growth Investment:
Discretionary capital expenditures in significant new products and services in new, existing or adjacent business opportunities. Prior to Q1 2017, Innovation and Growth Investment was included in Non-Real Estate Investment.
Sect
ion
VIII
Sect
ion
IX
Sect
ion
VII
Sect
ion
VI
Sect
ion
V Se
ctio
n IV
Se
ctio
n III
Se
ctio
n II
Sect
ion
I Se
ctio
n X

www.ironmountain.com Selected metric definitions are available in the Appendix
Appendix
41
Other Definitions (continued) Capital Expenditures and Investments (continued)
Components of Overhead
Allocated Overhead – Includes overhead expenses directly associated with storage and service business operations allocated as follows:
Field Operation Costs – Allocated to storage and service operations based on percent of revenue.
Bad Debt Expenses – Allocated to storage and service operations based on percent of revenue.
Transportation Costs – Allocated fully to service operations.
Corporate Overhead – Includes all other overhead expenses associated with business support functions, including: Executive, Legal, Real Estate/Facilities, Accounting, Financial Performance & Analysis, Treasury, Tax, Internal Audit, M&A, Security, Procurement, HR, REIT, Other G&A, Integration Costs, IT, Product Engineering and Product Management.
Customer Turnover Overhead – Overhead associated with customer acquisition and retention including Sales, Marketing and Account Management expenses.
Constant Dollar Growth (C$) – The year-over-year growth rate excluding the impact of changes to foreign currency exchange rates. Constant currency growth rates are a non-GAAP measure calculated by translating the 2016 results at the 2017 constant dollar budget rates.
Cumulative Investment to Date – Total spend to date since project approval.
Customer Inducements – Represents Move Costs and Permanent Withdrawal Fees.
Sect
ion
VIII
Sect
ion
IX
Sect
ion
VII
Sect
ion
VI
Sect
ion
V Se
ctio
n IV
Se
ctio
n III
Se
ctio
n II
Sect
ion
I Se
ctio
n X

www.ironmountain.com Selected metric definitions are available in the Appendix
Appendix
42
Other Definitions (continued) Destruction Rate – Calculated by dividing the total number of cubic feet of records removed from inventory due to destructions in a one-year period divided by the total number of cubic feet of records in storage at the beginning of the period.
DPUs – Data protection units, a unit of measurement specific to our Data Protection storage services.
Estimated CuFt / DPUs – Estimated based on expected growth and consolidation, resulting from moving boxes from one facility to another.
Historical Average NOI / CF or DPU – The quarterly annualized Storage NOI for a specific region (NA, Europe, Africa, Latin America, Asia) and product (Records Management or Data Protection).
Internal Revenue Growth – Our internal revenue growth rate, which is a non-GAAP measure, represents the weighted average year-over-year growth rate of our revenues excluding the impact of business acquisitions, divestitures and foreign currency exchange rate fluctuations. The revenues generated by Recall have been integrated with our existing revenues and it is impracticable for us to determine actual Recall revenue contribution for the applicable periods. Therefore, our internal revenue growth rates exclude the impact of revenues associated with the Recall Transaction based upon forecasted or budgeted Recall revenues beginning in the third quarter of 2016 through the one-year anniversary of the Recall Transaction. Our internal revenue growth rate includes the impact of acquisitions of customer relationships.
Investment in Current Period – Spend within the quarter being reported.
Lease Adjusted Leverage Ratio – The calculation for this ratio is EBITDA plus rent expense divided by net debt including the capitalized value of lease obligations plus six times rent expense.
Net Volume Growth – New Records Management storage volume from existing customers, plus volume from new customers and volume from acquisitions, offset by volume related to destructions, permanent withdrawals and customer terminations. Quarterly percentages are calculated by dividing the trailing four quarters’ total activity by the ending balance of the same prior-year period.
Non-Cash Rent Expense – Calculated as rent expense less cash paid for rent.
Sect
ion
VIII
Sect
ion
IX
Sect
ion
VII
Sect
ion
VI
Sect
ion
V Se
ctio
n IV
Se
ctio
n III
Se
ctio
n II
Sect
ion
I Se
ctio
n X

www.ironmountain.com Selected metric definitions are available in the Appendix
Appendix
43
Other Definitions (continued) Permanent Withdrawal Rate – Calculated by dividing the total number of cubic feet of records removed from inventory due to permanent withdrawals in a one-year period divided by the total number of cubic feet of records in storage at the beginning of the period. Permanent withdrawals occur when records are permanently removed from inventory by customers for reasons other than the customer terminating its relationship.
Racking Installations – Defined as any incremental racking spend on buildings constructed or operated prior to January 1, 2014. Racking projects are tracked from first dollar spent until completion, which is defined as when the first box is entered into storage. Racking spend on buildings constructed subsequent to January 1, 2014 is included in Building Development Projects.
Recall Costs – Represents operating expenditures associated with the Recall Transaction, including: (i) advisory and professional fees to complete the Recall Transaction; (ii) costs associated with the Divestments required in connection with receipt of regulatory approvals (including transitional services); and (iii) costs to integrate Recall with our existing operations, including moving, severance, facility upgrade, REIT conversion and system upgrade costs, as well as certain costs associated with our shared service center initiative for our finance, human resources and information technology functions ("Recall Costs").
REIT Countries – Countries where we operate that have been converted into a qualified REIT subsidiary and taxable REIT subsidiary structure, the group includes the following: Australia, Canada, Germany, Ireland, Mexico, Netherlands, Poland, Spain, United Kingdom and the United States.
Service Profit and Margin – The Gross Profit and Margin attributable to the worldwide service business. Calculated as follows: Services Adj. EBITDA + Allocated Overhead Expenses + Termination and Permanent Withdrawal Fees = Service Profit ($) / Total Service Revenues (including Termination and Permanent Withdrawal Fees) = Service Margin (%) Storage Profit and Margin – The Gross Profit and Margin attributable to the worldwide storage business. Calculated as follows: Storage Net Operating Income + Allocated Overhead Expenses - Storage Rent - Termination and Permanent Withdrawal Fees = Storage Profit ($) / Total Storage Revenues (excluding Termination and Permanent Withdrawal Fees) = Storage Margin (%) Tangible Assets – Includes PP&E, cash and cash equivalents, restricted cash, accounts receivable, deferred income taxes, and prepaid expenses.
Sect
ion
VIII
Sect
ion
IX
Sect
ion
VII
Sect
ion
VI
Sect
ion
V Se
ctio
n IV
Se
ctio
n III
Se
ctio
n II
Sect
ion
I Se
ctio
n X

www.ironmountain.com Selected metric definitions are available in the Appendix
Appendix
44
Other Definitions (continued)
Tax Rates
Effective Tax Rate – GAAP tax rate for the period calculated as tax expense or benefit for the quarter (total of current and deferred tax provisions), including discrete items, and divided by profit before tax for the period.
Structural Tax Rate – Estimated tax rate for the full fiscal year based on forecasted ordinary income and forecasted tax expense/benefit excluding any significant unusual or infrequently occurring items (i.e., discrete items) and items recognized net of tax on the financials (i.e., discontinued operations).
Total Expected Investment – Is defined as follows:
Total Expected Investment for Racking Installations – The sum of expected investments for all approved racking projects, reported on a constant dollar basis.
Total Expected Investment for Building Development Projects – The sum of expected investments for all approved building projects, including the expected costs of approved racking installations, reported on a constant dollar basis.
Transformation Initiative – During the third quarter of 2015, we implemented a plan that calls for certain organizational realignments to reduce our overhead costs, particularly in our developed markets, in order to optimize our selling, general and administrative cost structure and to support investments to advance our growth strategy, which is expected to be completed by the end of 2017.
Volume Retention Rate – One minus the result of dividing the total number of cubic feet of records removed from inventory due to customer terminations and destructions in a one-year period by the total number of cubic feet of records in storage at the beginning of the period.
Sect
ion
VIII
Sect
ion
IX
Sect
ion
VII
Sect
ion
VI
Sect
ion
V Se
ctio
n IV
Se
ctio
n III
Se
ctio
n II
Sect
ion
I Se
ctio
n X