q3 2016 earnings call presentation 8.3.16 v5 final
TRANSCRIPT

HILLENBRAND
P U R S U I N G G R O W T H ● B U I L D I N G V A L U E
A GLOBAL DIVERSIFIED INDUSTRIAL COMPANY
Q3 ‘16 Earnings Presentation | 2
Hillenbrand Participants
Joe Raver
President and Chief Executive Officer
Kristina Cerniglia
Senior Vice President and Chief Financial Officer
Q3 ‘16 Earnings Presentation | 3
Forward-Looking Statements and Factors That May Affect Future Results:
Throughout this presentation, we make a number of “forward-looking statements” within the meaning of the Private Securities Litigation Reform Act of
1995. As the words imply, these are statements about future plans, objectives, beliefs, and expectations that might or might not happen in the future, as
contrasted with historical information. Forward-looking statements are based on assumptions that we believe are reasonable, but by their very nature are
subject to a wide range of risks.
Accordingly, in this presentation, we may say something like,
“We expect that future revenue associated with the Process Equipment Group will be influenced by order backlog.”
That is a forward-looking statement, as indicated by the word “expect” and by the clear meaning of the sentence.
Other words that could indicate we are making forward-looking statements include:
This is not an exhaustive list, but is intended to give you an idea of how we try to identify forward-looking statements. The absence of any of these words,
however, does not mean that the statement is not forward-looking.
Here is the key point: Forward-looking statements are not guarantees of future performance, and our actual results could differ materially from those set
forth in any forward-looking statements. Any number of factors, many of which are beyond our control, could cause our performance to differ significantly
from what is described in the forward-looking statements.
For a discussion of factors that could cause actual results to differ from those contained in forward-looking statements, see the discussions under the
heading “Risk Factors” in Item 1A of Part I of our Form 10-K for the year ended September 30, 2015, located on our website and filed with the SEC. We
assume no obligation to update or revise any forward-looking statements.
Disclosure Regarding Forward-Looking Statements
Q3 ‘16 Earnings Presentation | 4
Hillenbrand’s Strategy Is Focused On Three Key Areas
Develop Hillenbrand into a world-class global diversified
industrial company
Leverage our strong financial foundation and the
Hillenbrand Operating Model to deliver sustainable profit
growth, revenue expansion, and free cash flow
Reinvest this cash in new growth initiatives, both organic
and inorganic, that create shareholder value
Q3 ‘16 Earnings Presentation | 5
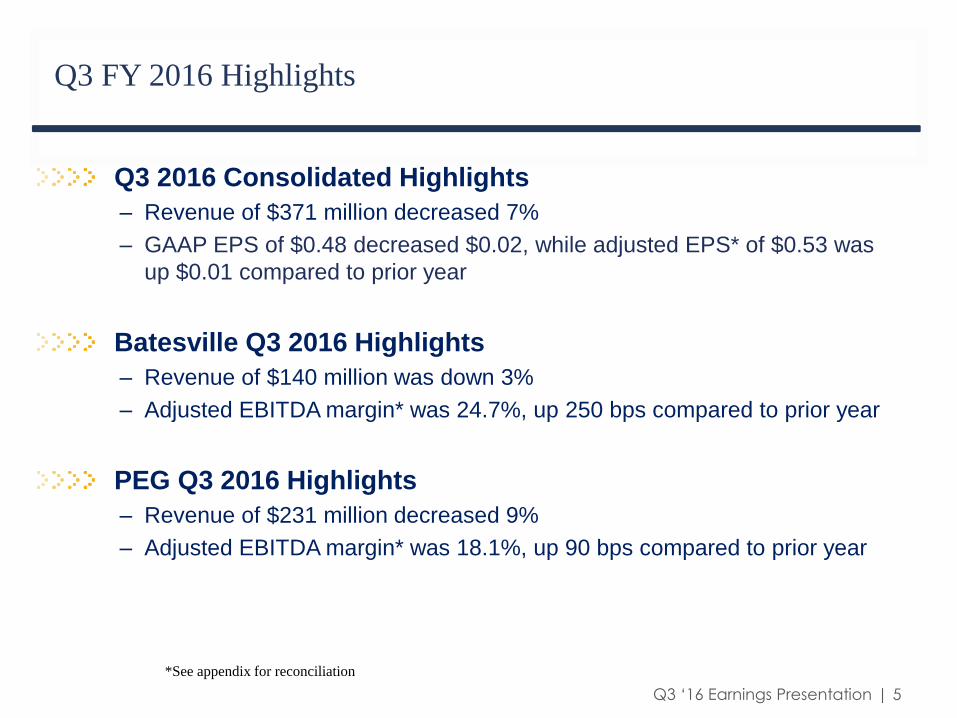
Q3 2016 Consolidated Highlights
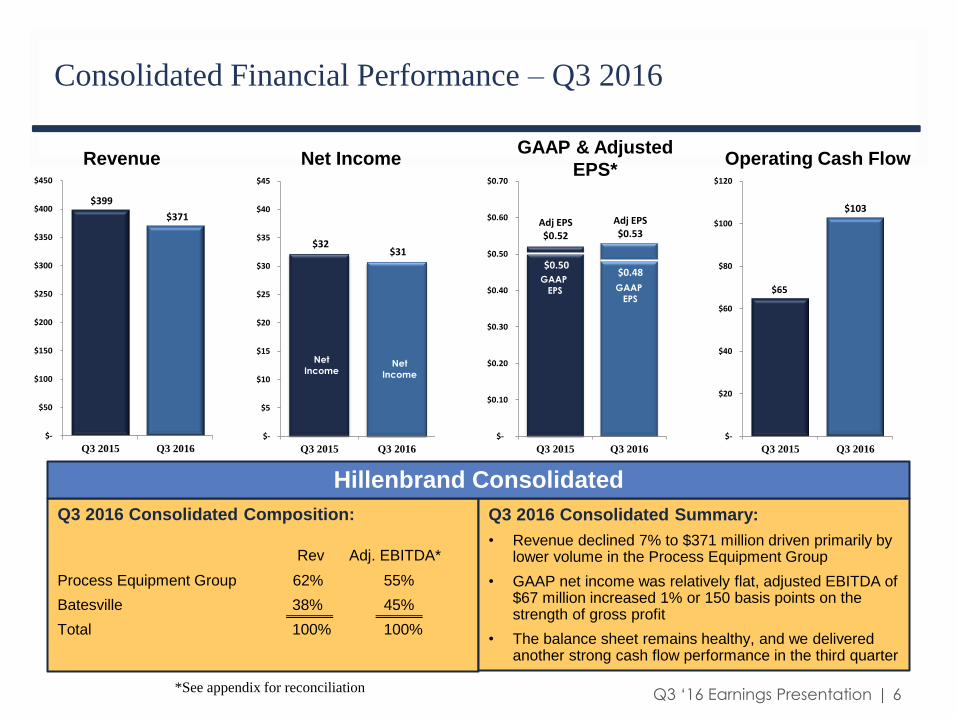
– Revenue of $371 million decreased 7%
– GAAP EPS of $0.48 decreased $0.02, while adjusted EPS* of $0.53 was
up $0.01 compared to prior year
Batesville Q3 2016 Highlights
– Revenue of $140 million was down 3%
– Adjusted EBITDA margin* was 24.7%, up 250 bps compared to prior year
PEG Q3 2016 Highlights
– Revenue of $231 million decreased 9%
– Adjusted EBITDA margin* was 18.1%, up 90 bps compared to prior year
Q3 FY 2016 Highlights
*See appendix for reconciliation
Q3 ‘16 Earnings Presentation | 6
$32 $31
$-
$5
$10
$15
$20
$25
$30
$35
$40
$45
Q3 2015 Q3 2016
$399
$371
$-
$50
$100
$150
$200
$250
$300
$350
$400
$450
Q3 2015 Q3 2016
$0.50 $0.48
$-
$0.10
$0.20
$0.30
$0.40
$0.50
$0.60
$0.70
Q3 2015 Q3 2016
Adj EPS$0.52
Adj EPS$0.53
Q3 2016 Consolidated Composition:
Rev Adj. EBITDA*
Process Equipment Group 62% 55%
Batesville 38% 45%
Total 100% 100%
Consolidated Financial Performance – Q3 2016
GAAP & Adjusted
EPS*
Q3 2016 Consolidated Summary:
• Revenue declined 7% to $371 million driven primarily by lower volume in the Process Equipment Group
• GAAP net income was relatively flat, adjusted EBITDA of $67 million increased 1% or 150 basis points on the strength of gross profit
• The balance sheet remains healthy, and we delivered another strong cash flow performance in the third quarter
Hillenbrand Consolidated
Net Income Revenue
*See appendix for reconciliation
Operating Cash Flow
Net
Income
Net
Income
GAAP
EPS
GAAP
EPS $65
$103
$-
$20
$40
$60
$80
$100
$120
Q3 2015 Q3 2016
Q3 ‘16 Earnings Presentation | 7
$145 $140
$-
$50
$100
$150
$200
$250
$300
Q3 2015 Q3 2016
$32 $35
$-
$10
$20
$30
$40
$50
Q3 2015 Q3 2016
$254
$231
$-
$50
$100
$150
$200
$250
$300
Q3 2015 Q3 2016
$44 $42
$-
$10
$20
$30
$40
$50
Q3 2015 Q3 2016
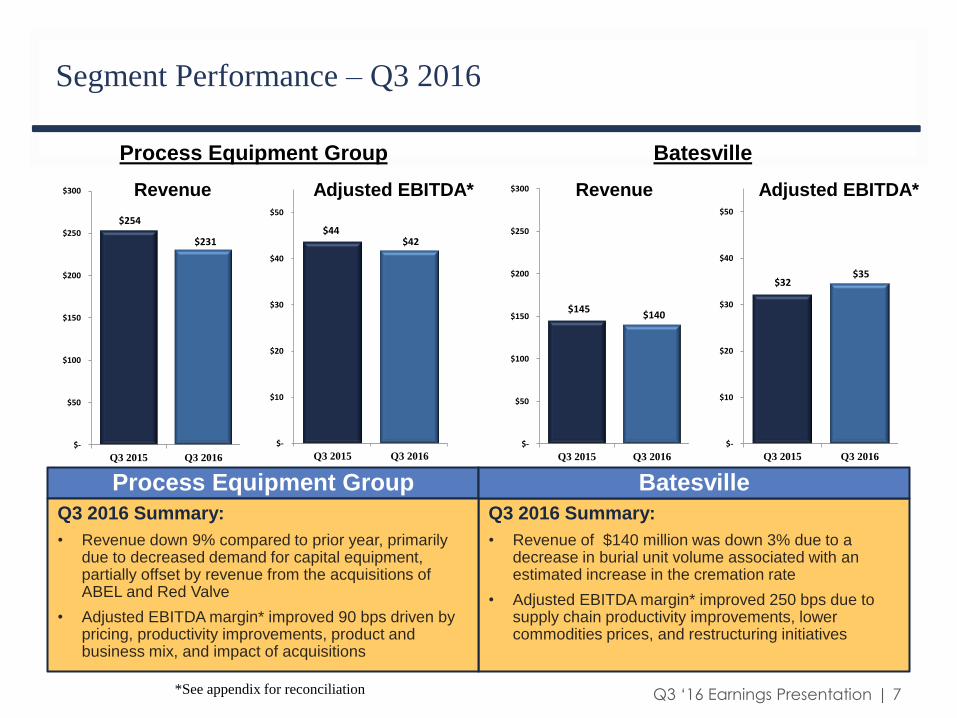
Segment Performance – Q3 2016
Process Equipment Group Batesville
Revenue Adjusted EBITDA* Revenue Adjusted EBITDA*
Q3 2016 Summary:
• Revenue of $140 million was down 3% due to a decrease in burial unit volume associated with an estimated increase in the cremation rate
• Adjusted EBITDA margin* improved 250 bps due to supply chain productivity improvements, lower commodities prices, and restructuring initiatives
Process Equipment Group Batesville
*See appendix for reconciliation
Q3 2016 Summary:
• Revenue down 9% compared to prior year, primarily due to decreased demand for capital equipment, partially offset by revenue from the acquisitions of ABEL and Red Valve
• Adjusted EBITDA margin* improved 90 bps driven by pricing, productivity improvements, product and business mix, and impact of acquisitions
Q3 ‘16 Earnings Presentation | 8
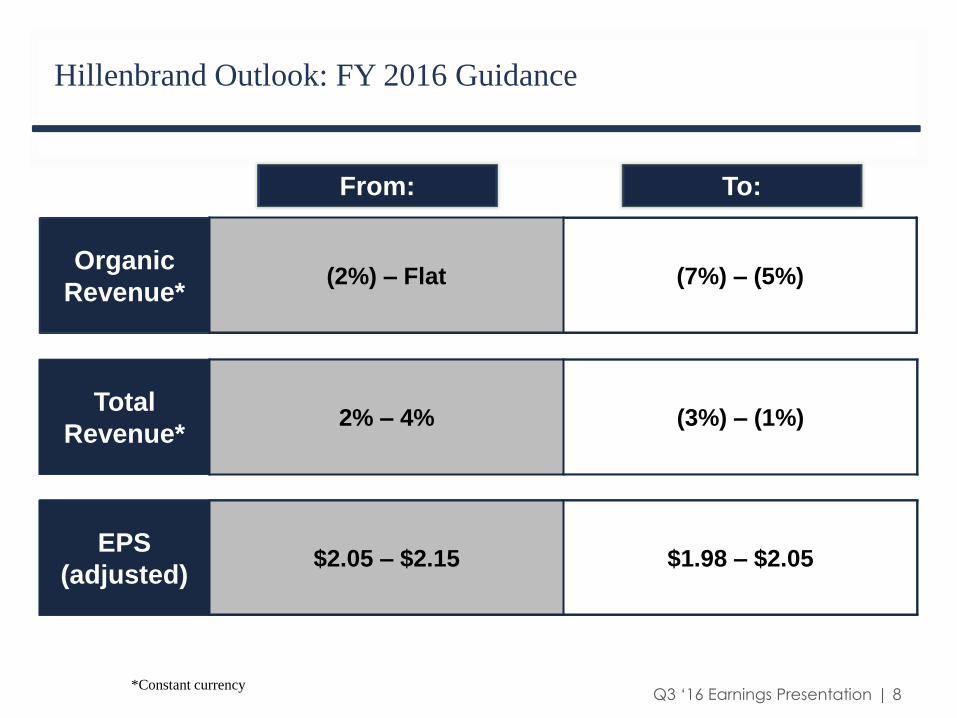
Hillenbrand Outlook: FY 2016 Guidance
Organic
Revenue* (2%) – Flat (7%) – (5%)
2% – 4% (3%) – (1%)
$2.05 – $2.15 $1.98 – $2.05
From: To:
*Constant currency
Total
Revenue*
EPS
(adjusted)

HILLENBRAND
Q3 ‘16 Earnings Presentation | 9
Q & A
Q3 ‘16 Earnings Presentation | 10
Replay Information
Dial In: (855)-859-2056
International: +1 (404)-537-3406
Conference ID: 42034114
Encore Replay Dates: 08/04/2016 - 08/18/2016
Log on to: http://ir.hillenbrandinc.com/investor-relations

HILLENBRAND
Q3 ‘16 Earnings Presentation | 11
Appendix
Q3 ‘16 Earnings Presentation | 12
Disclosure Regarding Non-GAAP Measures
While we report financial results in accordance with accounting principles generally accepted in the United States
(GAAP), we also provide certain non-GAAP operating performance measures. These non-GAAP measures are
referred to as “adjusted” and exclude expenses associated with backlog amortization, inventory step-up, business
acquisition and integration, restructuring, trade name impairment and antitrust litigation. The related income tax for all
of these items is also excluded. This non-GAAP information is provided as a supplement, not as a substitute for, or as
superior to, measures of financial performance prepared in accordance with GAAP.
One important non-GAAP measure that we use is Adjusted Earnings Before Interest, Income Tax, Depreciation, and
Amortization (“Adjusted EBITDA”). As previously discussed, a part of our strategy is to selectively acquire companies
that we believe can benefit from our core competencies to spur faster and more profitable growth. Given that strategy,
it is a natural consequence to incur related expenses, such as amortization from acquired intangible assets and
additional interest expense from debt-funded acquisitions. Accordingly, we use Adjusted EBITDA, among other
measures, to monitor our business performance.
Another important non-GAAP measure that we use is backlog. Backlog is not a term recognized under GAAP;
however, it is a common measurement used in the Process Equipment Group industry. Our backlog represents the
amount of consolidated revenue that we expect to realize on contracts awarded related to the Process Equipment
Group. Backlog includes expected revenue from large systems, equipment, and to a lesser extent, replacement parts,
components, and service. There is no GAAP financial measure comparable to backlog; therefore a quantitative
reconciliation is not provided.
We use this non-GAAP information internally to make operating decisions and believe it is helpful to investors because
it allows more meaningful period-to-period comparisons of our ongoing operating results. The information can also be
used to perform trend analysis and to better identify operating trends that may otherwise be masked or distorted by
these types of items. Finally, the Company believes such information provides a higher degree of transparency.
Q3 ‘16 Earnings Presentation | 13
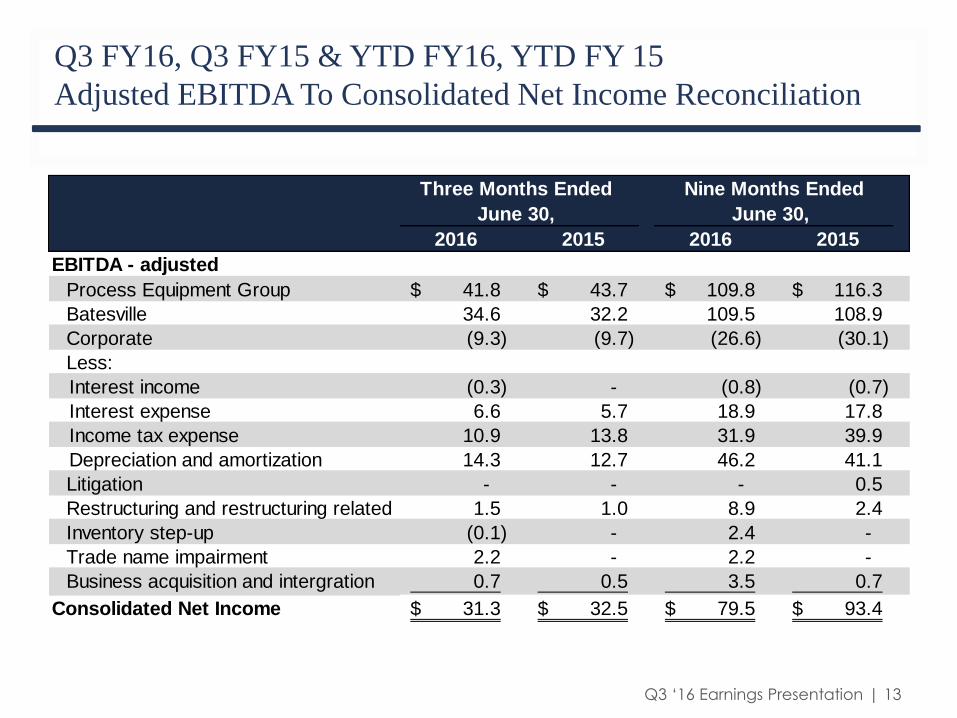
Q3 FY16, Q3 FY15 & YTD FY16, YTD FY 15
Adjusted EBITDA To Consolidated Net Income Reconciliation
($ in millions)
2016 2015 2016 2015
EBITDA - adjusted
Process Equipment Group 41.8$ 43.7$ 109.8$ 116.3$
Batesville 34.6 32.2 109.5 108.9
Corporate (9.3) (9.7) (26.6) (30.1)
Less:
Interest income (0.3) - (0.8) (0.7)
Interest expense 6.6 5.7 18.9 17.8
Income tax expense 10.9 13.8 31.9 39.9
Depreciation and amortization 14.3 12.7 46.2 41.1
Litigation - - - 0.5
Restructuring and restructuring related 1.5 1.0 8.9 2.4
Inventory step-up (0.1) - 2.4 -
Trade name impairment 2.2 - 2.2 -
Business acquisition and intergration 0.7 0.5 3.5 0.7
Consolidated Net Income 31.3$ 32.5$ 79.5$ 93.4$
Three Months Ended
June 30,
Nine Months Ended
June 30,
Q3 ‘16 Earnings Presentation | 14
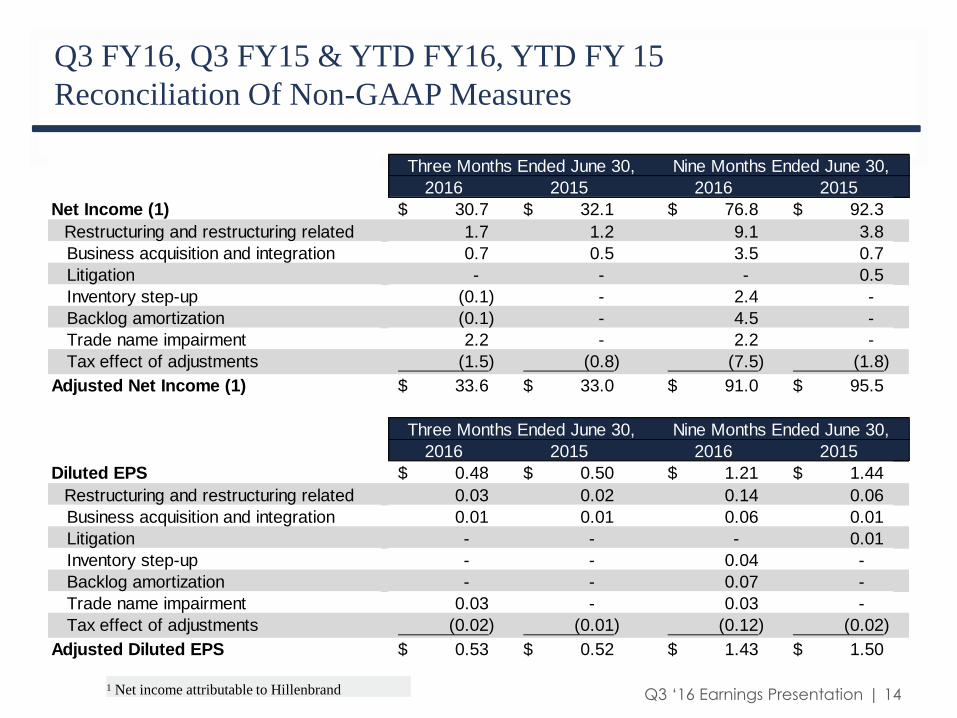
Q3 FY16, Q3 FY15 & YTD FY16, YTD FY 15
Reconciliation Of Non-GAAP Measures
1 Net income attributable to Hillenbrand
2016 2015 2016 2015
Net Income (1) 30.7$ 32.1$ 76.8$ 92.3$
Restructuring and restructuring related 1.7 1.2 9.1 3.8
Business acquisition and integration 0.7 0.5 3.5 0.7
Litigation - - - 0.5
Inventory step-up (0.1) - 2.4 -
Backlog amortization (0.1) - 4.5 -
Trade name impairment 2.2 - 2.2 -
Tax effect of adjustments (1.5) (0.8) (7.5) (1.8)
Adjusted Net Income (1) 33.6$ 33.0$ 91.0$ 95.5$
2016 2015 2016 2015
Diluted EPS 0.48$ 0.50$ 1.21$ 1.44$
Restructuring and restructuring related 0.03 0.02 0.14 0.06
Business acquisition and integration 0.01 0.01 0.06 0.01
Litigation - - - 0.01
Inventory step-up - - 0.04 -
Backlog amortization - - 0.07 -
Trade name impairment 0.03 - 0.03 -
Tax effect of adjustments (0.02) (0.01) (0.12) (0.02)
Adjusted Diluted EPS 0.53$ 0.52$ 1.43$ 1.50$
Three Months Ended June 30, Nine Months Ended June 30,
Three Months Ended June 30, Nine Months Ended June 30,
Q3 ‘16 Earnings Presentation | 15
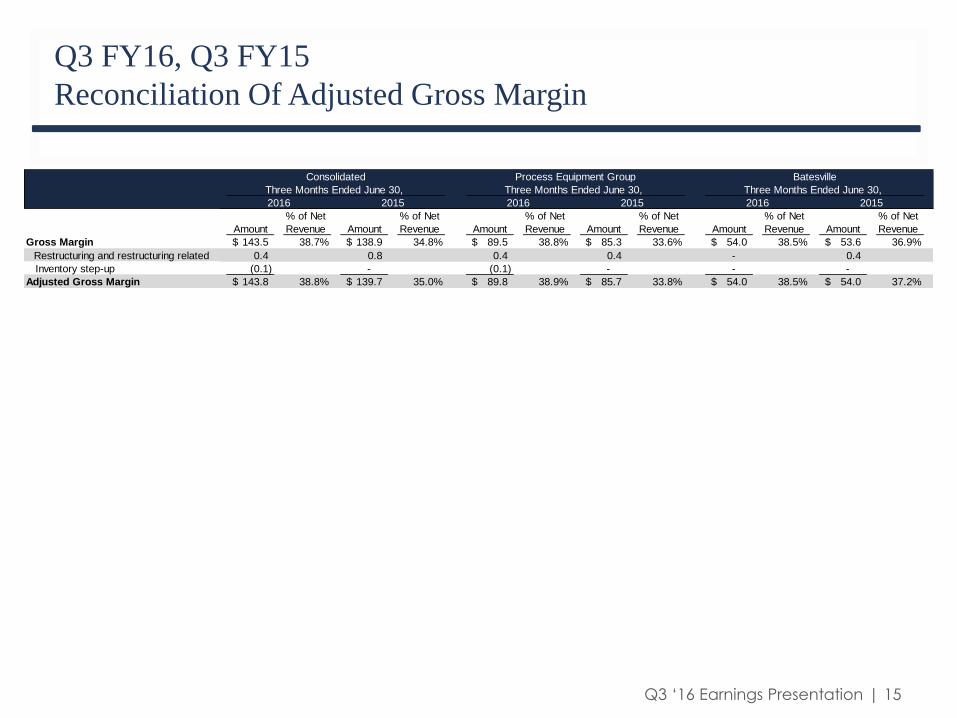
Q3 FY16, Q3 FY15
Reconciliation Of Adjusted Gross Margin
Amount
% of Net
Revenue Amount
% of Net
Revenue Amount
% of Net
Revenue Amount
% of Net
Revenue Amount
% of Net
Revenue Amount
% of Net
Revenue
Gross Margin 143.5$ 38.7% 138.9$ 34.8% 89.5$ 38.8% 85.3$ 33.6% 54.0$ 38.5% 53.6$ 36.9%
Restructuring and restructuring related 0.4 0.8 0.4 0.4 - 0.4
Inventory step-up (0.1) - (0.1) - - -
Adjusted Gross Margin 143.8$ 38.8% 139.7$ 35.0% 89.8$ 38.9% 85.7$ 33.8% 54.0$ 38.5% 54.0$ 37.2%
2015
Three Months Ended June 30, Three Months Ended June 30, Three Months Ended June 30,
Consolidated Process Equipment Group Batesville
2016 2015 2016 2015 2016