q3 2015 results presentation
TRANSCRIPT

1
October 28, 2015
Q3 2015 Results
2
NOT AN OFFER TO SELL OR SOLICITATION OF AN OFFER
TO PURCHASE SECURITIES
This presentation does not constitute or form part of, and should not be construed as,
an offer or invitation to sell securities of Altice N.V. or any of its affiliates (collectively
the “Altice Group”) or the solicitation of an offer to subscribe for or purchase securities
of the Altice Group, and nothing contained herein shall form the basis of or be relied on
in connection with any contract or commitment whatsoever. Any decision to purchase
any securities of the Altice Group should be made solely on the basis of the final terms
and conditions of the securities and the information to be contained in the offering
memorandum produced in connection with the offering of such securities. Prospective
investors are required to make their own independent investigations and appraisals of
the business and financial condition of the Altice Group and the nature of the securities
before taking any investment decision with respect to securities of the Altice Group.
Any such offering memorandum may contain information different from the information
contained herein.
FORWARD-LOOKING STATEMENTS
Certain statements in this presentation constitute forward-looking statements within the
meaning of the Private Securities Litigation Reform Act of 1995. These forward-looking
statements include, but are not limited to, all statements other than statements of
historical facts contained in this presentation, including, without limitation, those
regarding our intentions, beliefs or current expectations concerning, among other
things: our future financial conditions and performance, results of operations and
liquidity; our strategy, plans, objectives, prospects, growth, goals and targets; and
future developments in the markets in which we participate or are seeking to
participate. These forward-looking statements can be identified by the use of forward-
looking terminology, including the terms “believe”, “could”, “estimate”, “expect”,
“forecast”, “intend”, “may”, “plan”, “project” or “will” or, in each case, their negative, or
other variations or comparable terminology. Where, in any forward-looking statement,
we express an expectation or belief as to future results or events, such expectation or
belief is expressed in good faith and believed to have a reasonable basis, but there
can be no assurance that the expectation or belief will result or be achieved or
accomplished. To the extent that statements in this press release are not recitations of
historical fact, such statements constitute forward-looking statements, which, by
definition, involve risks and uncertainties that could cause actual results to differ
materially from those expressed or implied by such statements.
FINANCIAL MEASURES
This presentation contains measures and ratios (the “Non-IFRS Measures”), including
EBITDA and Operating Free Cash Flow that are not required by, or presented in
accordance with, IFRS or any other generally accepted accounting standards. We
present Non-IFRS or any other generally accepted accounting standards. We present
Non-IFRS measures because we believe that they are of interest for the investors and
similar measures are widely used by certain investors, securities analysts and other
interested parties as supplemental measures of performance and liquidity. The Non-
IFRS measures may not be comparable to similarly titled measures of other
companies, have limitations as analytical tools and should not be considered in
isolation or as a substitute for analysis of our, or any of our subsidiaries’, operating
results as reported under IFRS or other generally accepted accounting standards.
Non-IFRS measures such as EBITDA are not measurements of our, or any of our
subsidiaries’, performance or liquidity under IFRS or any other generally accepted
accounting principles. In particular, you should not consider EBITDA as an alternative
to (a) operating profit or profit for the period (as determined in accordance with IFRS)
as a measure of our, or any of our operating entities’, operating performance, (b) cash
flows from operating, investing and financing activities as a measure of our, or any of
our subsidiaries’, ability to meet its cash needs or (c) any other measures of
performance under IFRS or other generally accepted accounting standards. In
addition, these measures may also be defined and calculated differently than the
corresponding or similar terms under the terms governing our existing debt.
EBITDA and similar measures are used by different companies for differing purposes
and are often calculated in ways that reflect the circumstances of those companies.
You should exercise caution in comparing EBITDA as reported by us to EBITDA of
other companies. EBITDA as presented herein differs from the definition of
“Consolidated Combined EBITDA” for purposes of any the indebtedness of the Altice
Group. The information presented as EBITDA is unaudited. In addition, the
presentation of these measures is not intended to and does not comply with the
reporting requirements of the U.S. Securities and Exchange Commission (the “SEC”)
and will not be subject to review by the SEC; compliance with its requirements would
require us to make changes to the presentation of this information.
DISCLAIMER

3
SPEAKERS
Dexter Goei,
CEO Altice
Michel Combes,
COO Altice – Chairman
Numericable-SFR
Dennis Okhuijsen,
CFO Altice
Dexter Goei,
CEO Altice
Michel Combes,
COO Altice – Chairman
Numericable-SFR
Dennis Okhuijsen,
CFO Altice
Dexter Goei,
CEO Altice
Michel Combes,
COO Altice
Chairman Numericable-SFR
4
Q3 Highlights & Strategy Update
Dexter Goei, Group CEO
5
HIGHLIGHTS
1 Pro forma financials defined here & throughout presentation as pro forma results of the Altice N.V. group as if all acquisitions and divestitures occurred on January 1st 2014. These results are not pro forma for the
announced Suddenlink and Cablevision transactions and exclude Cabovisao, ONI and the Mobile assets of FOT on La Réunion and Mayotte. 2 Defined here and throughout presentation as Adj. EBITDA – Capex 3 excluding cash held in escrow for acquisitions4 includes the debt at Suddenlink, Cablevision, Altice Europe and Altice Corporate
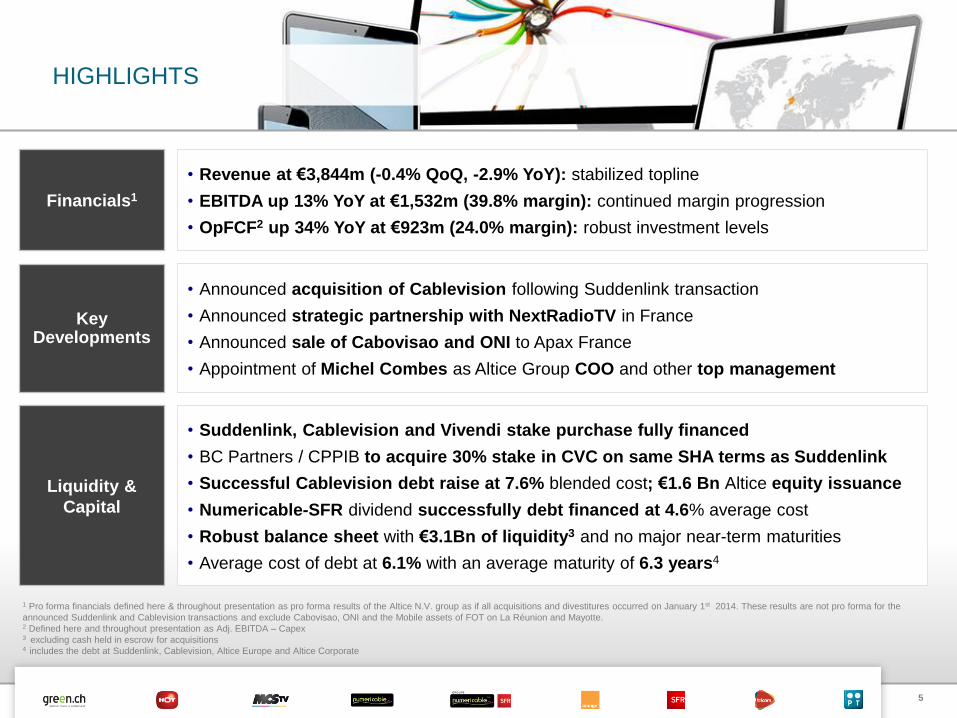
• Revenue at €3,844m (-0.4% QoQ, -2.9% YoY): stabilized topline
• EBITDA up 13% YoY at €1,532m (39.8% margin): continued margin progression
• OpFCF2 up 34% YoY at €923m (24.0% margin): robust investment levels
Financials1
• Announced acquisition of Cablevision following Suddenlink transaction
• Announced strategic partnership with NextRadioTV in France
• Announced sale of Cabovisao and ONI to Apax France
• Appointment of Michel Combes as Altice Group COO and other top management
Key Developments
• Suddenlink, Cablevision and Vivendi stake purchase fully financed
• BC Partners / CPPIB to acquire 30% stake in CVC on same SHA terms as Suddenlink
• Successful Cablevision debt raise at 7.6% blended cost; €1.6 Bn Altice equity issuance
• Numericable-SFR dividend successfully debt financed at 4.6% average cost
• Robust balance sheet with €3.1Bn of liquidity3 and no major near-term maturities
• Average cost of debt at 6.1% with an average maturity of 6.3 years4
Liquidity &
Capital
6
KEY Q3 2015 TAKEAWAYS
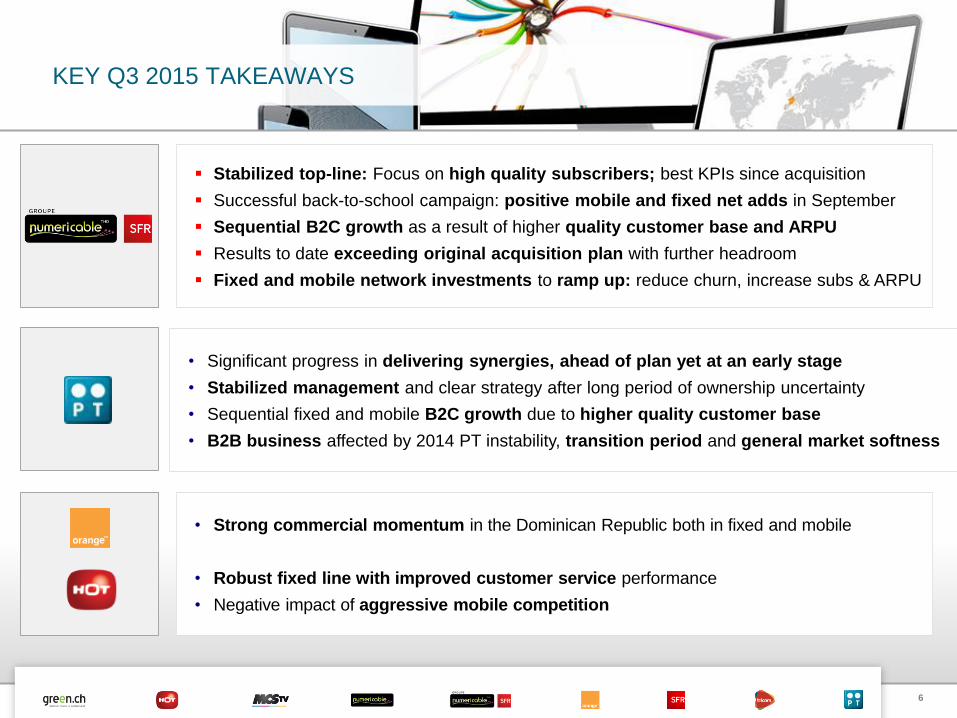
Stabilized top-line: Focus on high quality subscribers; best KPIs since acquisition
Successful back-to-school campaign: positive mobile and fixed net adds in September
Sequential B2C growth as a result of higher quality customer base and ARPU
Results to date exceeding original acquisition plan with further headroom
Fixed and mobile network investments to ramp up: reduce churn, increase subs & ARPU
• Significant progress in delivering synergies, ahead of plan yet at an early stage
• Stabilized management and clear strategy after long period of ownership uncertainty
• Sequential fixed and mobile B2C growth due to higher quality customer base
• B2B business affected by 2014 PT instability, transition period and general market softness
• Strong commercial momentum in the Dominican Republic both in fixed and mobile
• Robust fixed line with improved customer service performance
• Negative impact of aggressive mobile competition
7
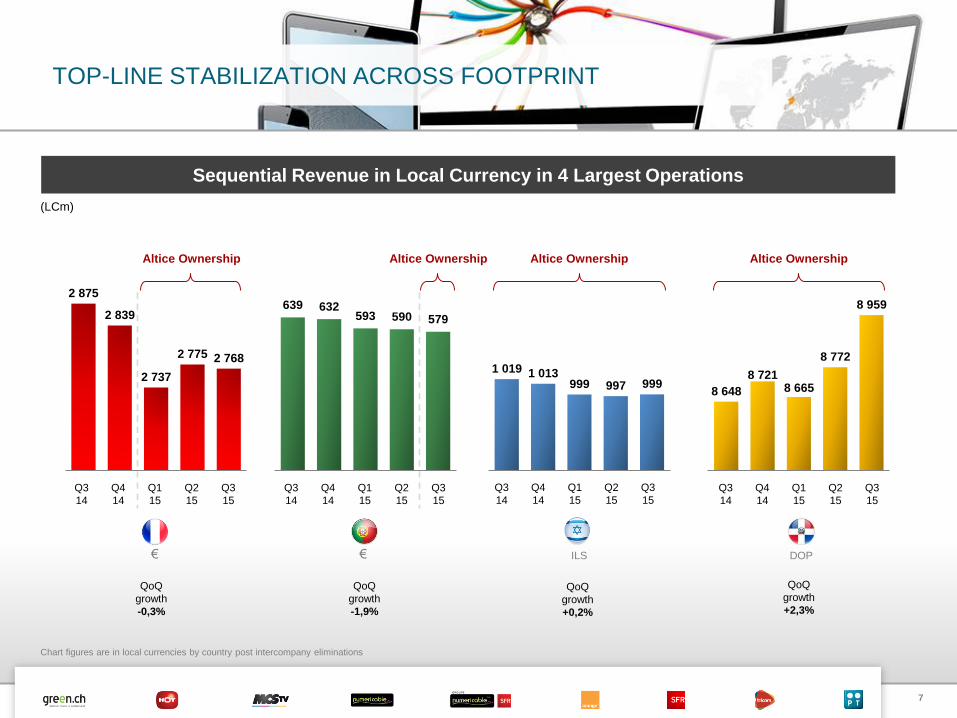
TOP-LINE STABILIZATION ACROSS FOOTPRINT
2 875
2 839
2 737
2 775 2 768
Sequential Revenue in Local Currency in 4 Largest Operations
639 632593 590 579
1 019 1 013999 997 999
8 648
8 7218 665
8 772
8 959
€ € DOPILS
QoQ
growth
-0,3%
QoQ
growth
-1,9%
QoQ
growth
+0,2%
QoQ
growth
+2,3%
Chart figures are in local currencies by country post intercompany eliminations
Q3
14
Q4
14
Q1
15
Q2
15
Q3
15Q3
14
Q4
14
Q1
15
Q2
15
Q3
15
Q3
14
Q4
14
Q1
15
Q2
15
Q3
15
Q3
14
Q4
14
Q1
15
Q2
15
Q3
15
Altice Ownership Altice Ownership
(LCm)
Altice OwnershipAltice Ownership
8
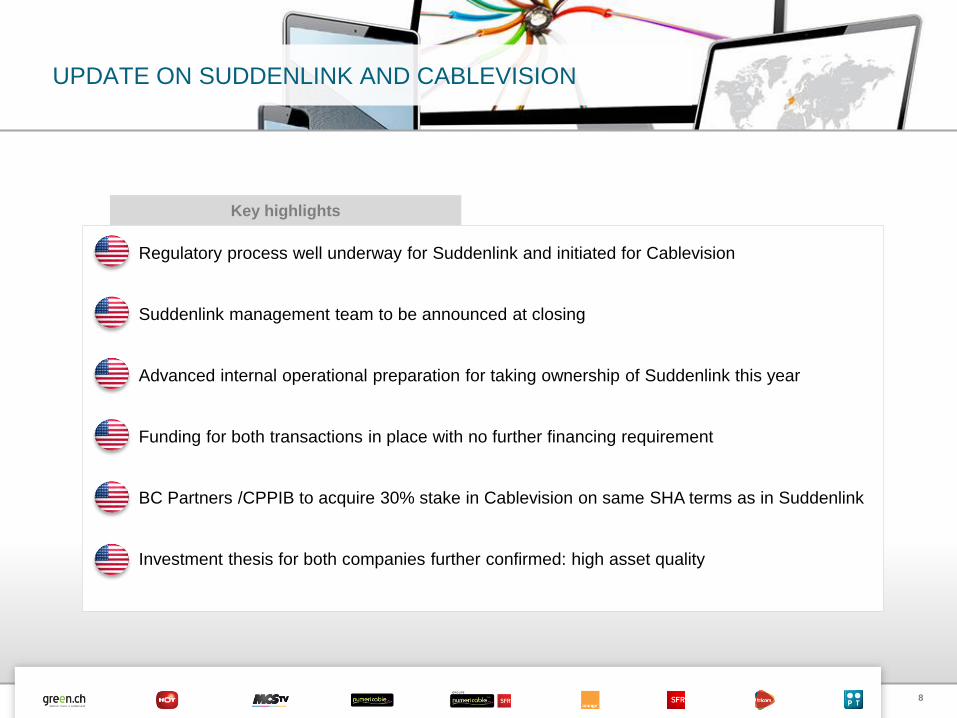
UPDATE ON SUDDENLINK AND CABLEVISION
Key highlights
Regulatory process well underway for Suddenlink and initiated for Cablevision
Suddenlink management team to be announced at closing
Advanced internal operational preparation for taking ownership of Suddenlink this year
Funding for both transactions in place with no further financing requirement
BC Partners /CPPIB to acquire 30% stake in Cablevision on same SHA terms as in Suddenlink
Investment thesis for both companies further confirmed: high asset quality
9
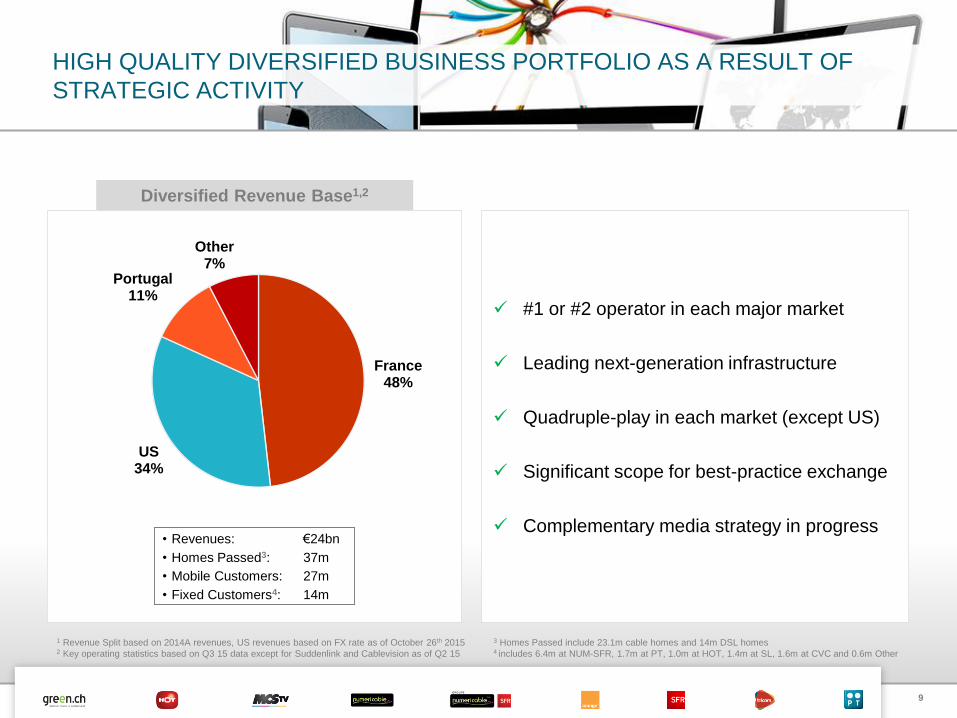
HIGH QUALITY DIVERSIFIED BUSINESS PORTFOLIO AS A RESULT OF
STRATEGIC ACTIVITY
1 Revenue Split based on 2014A revenues, US revenues based on FX rate as of October 26th 20152 Key operating statistics based on Q3 15 data except for Suddenlink and Cablevision as of Q2 15
• Revenues: €24bn
• Homes Passed3: 37m
• Mobile Customers: 27m
• Fixed Customers4: 14m
#1 or #2 operator in each major market
Leading next-generation infrastructure
Quadruple-play in each market (except US)
Significant scope for best-practice exchange
Complementary media strategy in progress
France48%
US34%
Portugal11%
Other7%
Diversified Revenue Base1,2
3 Homes Passed include 23.1m cable homes and 14m DSL homes 4 includes 6.4m at NUM-SFR, 1.7m at PT, 1.0m at HOT, 1.4m at SL, 1.6m at CVC and 0.6m Other
10
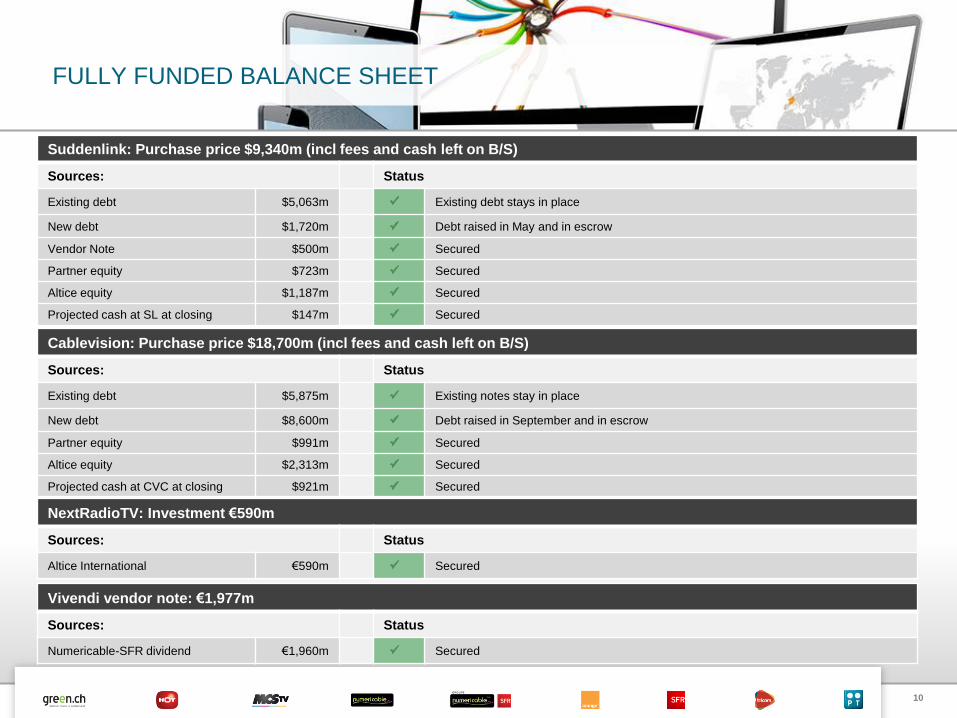
FULLY FUNDED BALANCE SHEET
Suddenlink: Purchase price $9,340m (incl fees and cash left on B/S)
Sources: Status
Existing debt $5,063m Existing debt stays in place
New debt $1,720m Debt raised in May and in escrow
Vendor Note $500m Secured
Partner equity $723m Secured
Altice equity $1,187m Secured
Projected cash at SL at closing $147m Secured
Cablevision: Purchase price $18,700m (incl fees and cash left on B/S)
Sources: Status
Existing debt $5,875m Existing notes stay in place
New debt $8,600m Debt raised in September and in escrow
Partner equity $991m Secured
Altice equity $2,313m Secured
Projected cash at CVC at closing $921m Secured
NextRadioTV: Investment €590m
Sources: Status
Altice International €590m Secured
Vivendi vendor note: €1,977m
Sources: Status
Numericable-SFR dividend €1,960m Secured
11
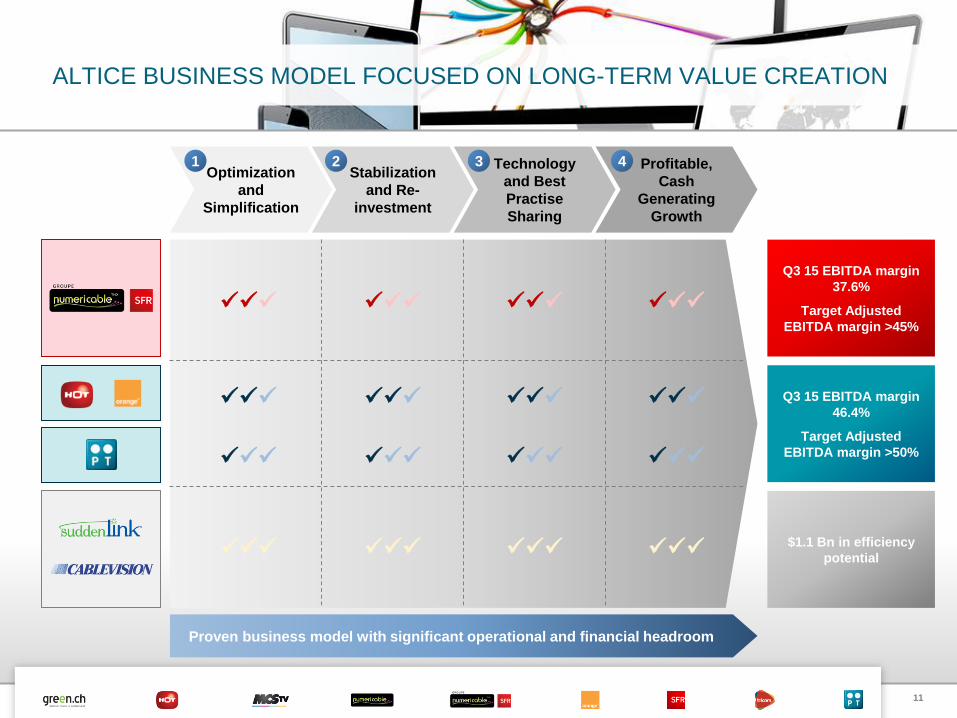
ALTICE BUSINESS MODEL FOCUSED ON LONG-TERM VALUE CREATION
$1.1 Bn in efficiency
potential
Optimization
and
Simplification
Stabilization
and Re-
investment
Technology
and Best
Practise
Sharing
Profitable,
Cash
Generating
Growth
1 2 3 4
Proven business model with significant operational and financial headroom
Q3 15 EBITDA margin
37.6%
Target Adjusted
EBITDA margin >45%
Q3 15 EBITDA margin
46.4%
Target Adjusted
EBITDA margin >50%
12
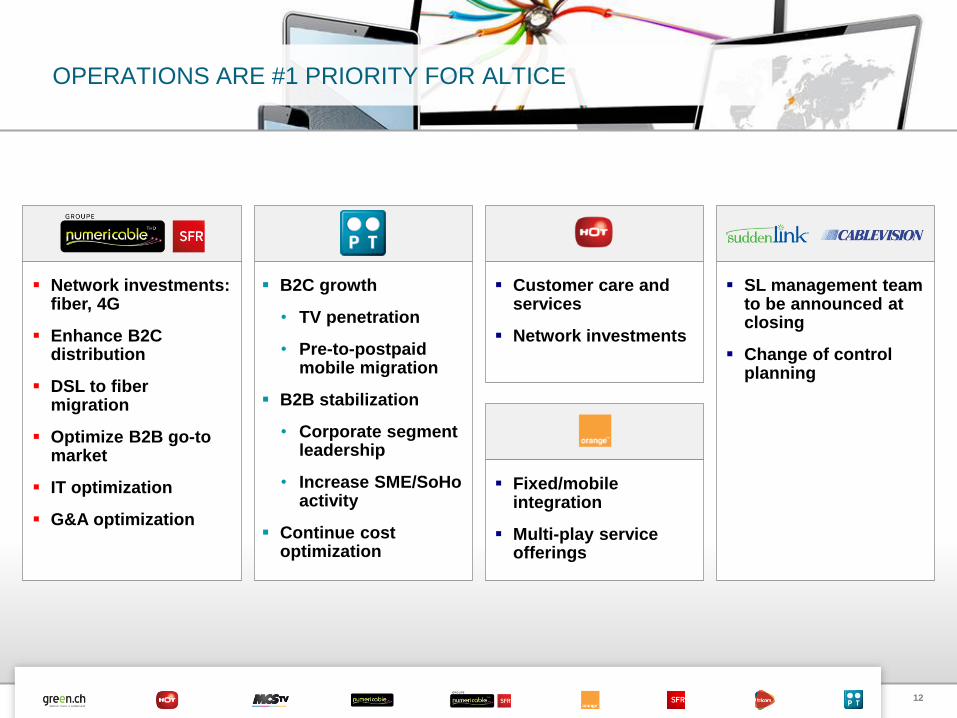
OPERATIONS ARE #1 PRIORITY FOR ALTICE
Network investments: fiber, 4G
Enhance B2C distribution
DSL to fibermigration
Optimize B2B go-to market
IT optimization
G&A optimization
SL management team to be announced at closing
Change of control planning
B2C growth
• TV penetration
• Pre-to-postpaid mobile migration
B2B stabilization
• Corporate segment leadership
• Increase SME/SoHoactivity
Continue cost optimization
Customer care and services
Network investments
Fixed/mobile integration
Multi-play service offerings
13
Operational Review
Michel Combes, Group COO
14
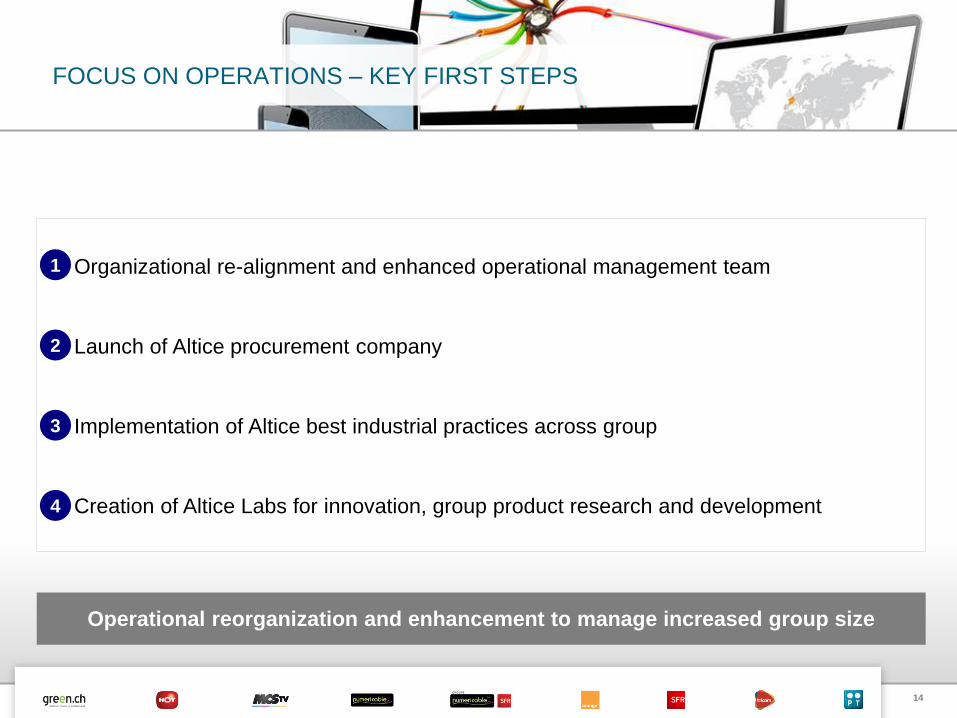
FOCUS ON OPERATIONS – KEY FIRST STEPS
• Organizational re-alignment and enhanced operational management team
• Launch of Altice procurement company
• Implementation of Altice best industrial practices across group
• Creation of Altice Labs for innovation, group product research and development
Operational reorganization and enhancement to manage increased group size
1
2
3
4
15
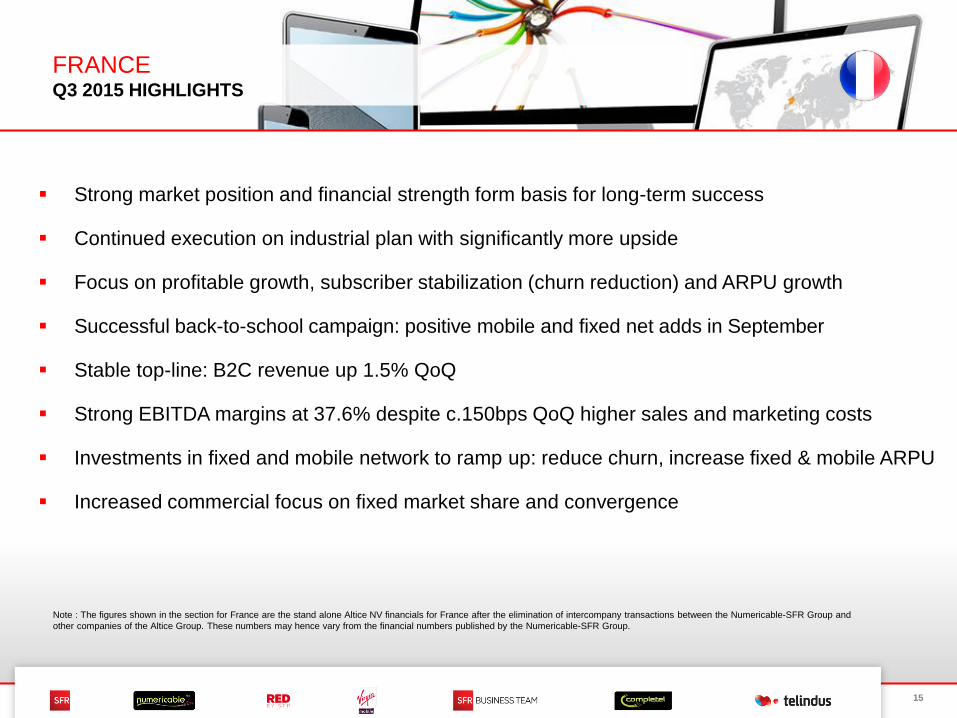
FRANCE Q3 2015 HIGHLIGHTS
Note : The figures shown in the section for France are the stand alone Altice NV financials for France after the elimination of intercompany transactions between the Numericable-SFR Group and
other companies of the Altice Group. These numbers may hence vary from the financial numbers published by the Numericable-SFR Group.
Strong market position and financial strength form basis for long-term success
Continued execution on industrial plan with significantly more upside
Focus on profitable growth, subscriber stabilization (churn reduction) and ARPU growth
Successful back-to-school campaign: positive mobile and fixed net adds in September
Stable top-line: B2C revenue up 1.5% QoQ
Strong EBITDA margins at 37.6% despite c.150bps QoQ higher sales and marketing costs
Investments in fixed and mobile network to ramp up: reduce churn, increase fixed & mobile ARPU
Increased commercial focus on fixed market share and convergence
16
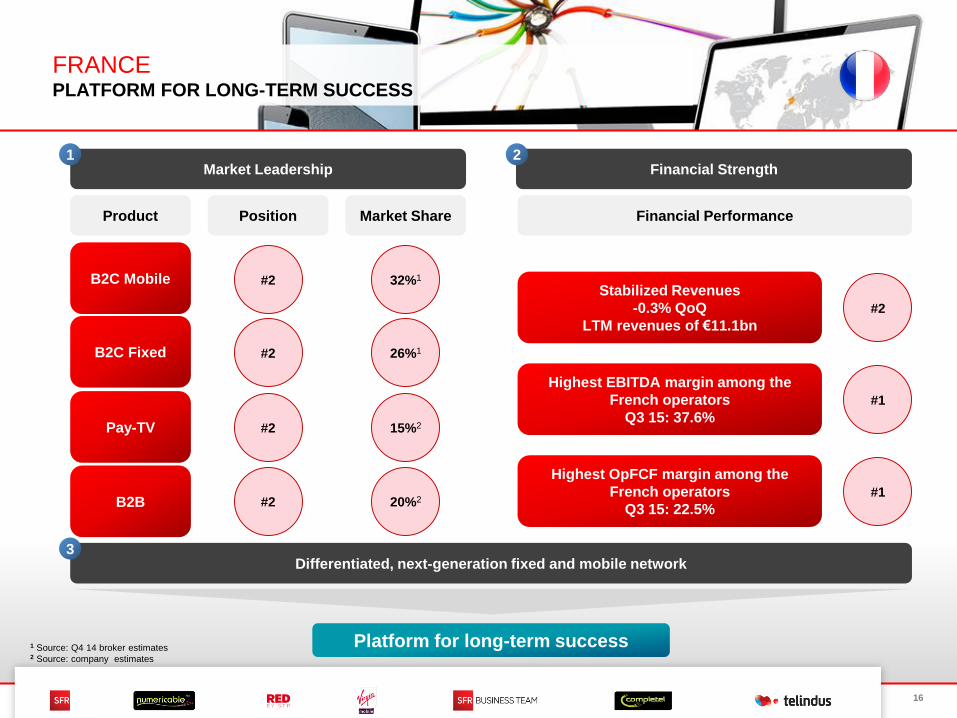
FRANCE PLATFORM FOR LONG-TERM SUCCESS
B2C Mobile
B2C Fixed
Pay-TV
B2B
#2 32%1
Market Leadership
Position Market Share
Financial Strength
#2 26%1
#2 15%2
#2 20%2
Stabilized Revenues
-0.3% QoQ
LTM revenues of €11.1bn
Highest EBITDA margin among the
French operators
Q3 15: 37.6%
Highest OpFCF margin among the
French operators
Q3 15: 22.5%
Financial Performance
#2
Platform for long-term success
#1
#1
1 2
Product
Differentiated, next-generation fixed and mobile network3
1 Source: Q4 14 broker estimates2 Source: company estimates
17
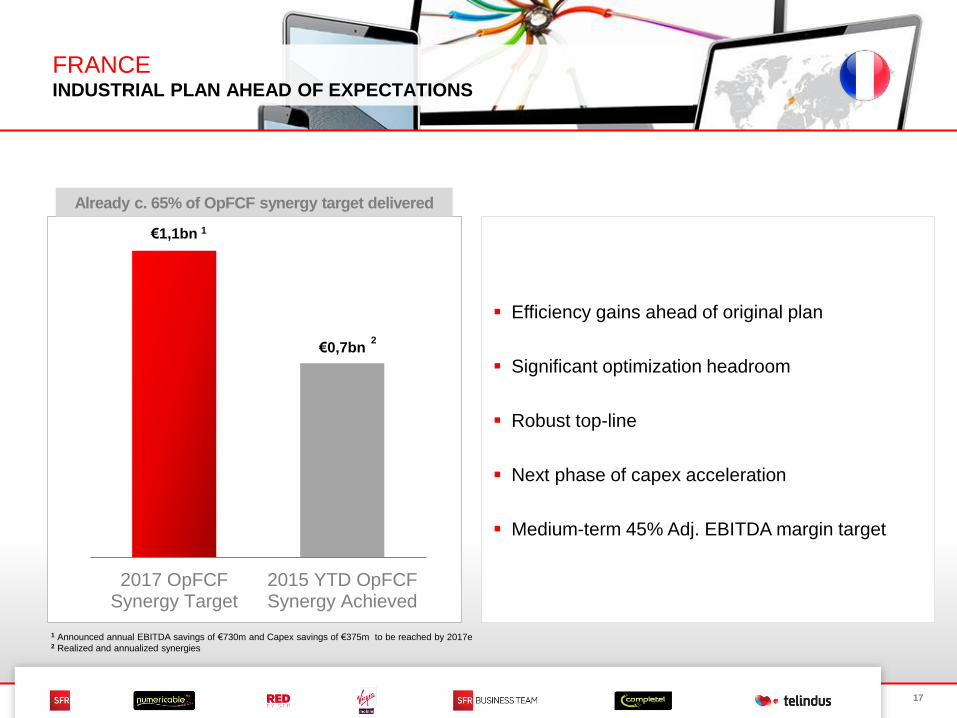
FRANCE INDUSTRIAL PLAN AHEAD OF EXPECTATIONS
1 Announced annual EBITDA savings of €730m and Capex savings of €375m to be reached by 2017e2 Realized and annualized synergies
€1,1bn
€0,7bn
2017 OpFCFSynergy Target
2015 YTD OpFCFSynergy Achieved
Efficiency gains ahead of original plan
Significant optimization headroom
Robust top-line
Next phase of capex acceleration
Medium-term 45% Adj. EBITDA margin target
Already c. 65% of OpFCF synergy target delivered
1
2
18
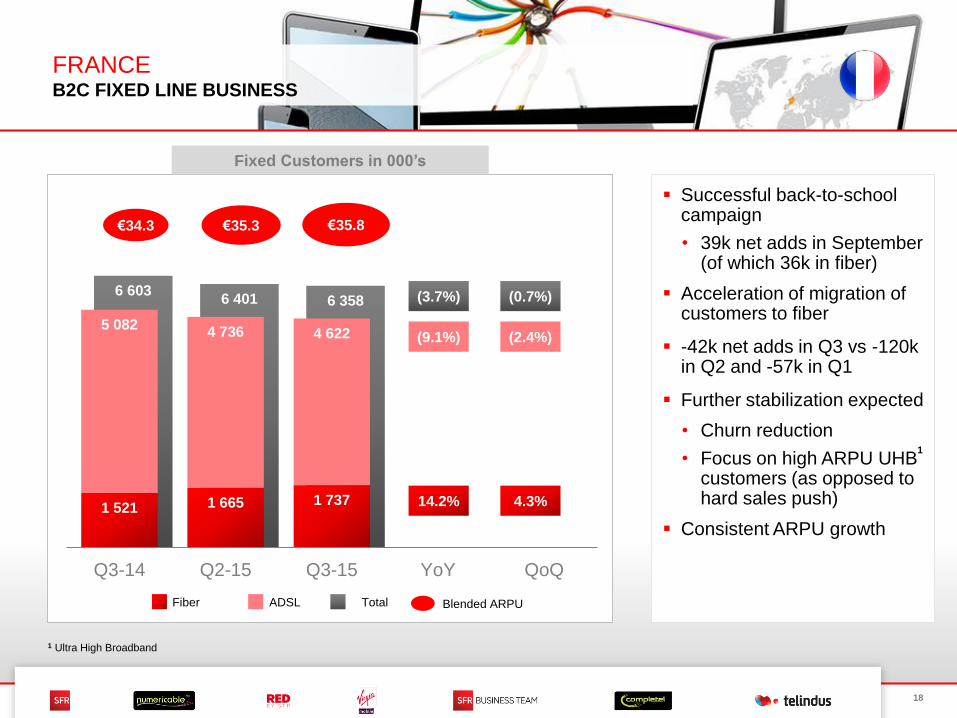
FRANCE B2C FIXED LINE BUSINESS
Successful back-to-school campaign
• 39k net adds in September (of which 36k in fiber)
Acceleration of migration of customers to fiber
-42k net adds in Q3 vs -120k in Q2 and -57k in Q1
Further stabilization expected
• Churn reduction
• Focus on high ARPU UHBcustomers (as opposed to hard sales push)
Consistent ARPU growth
6 6036 401 6 358
1 521 1 665 1 737
5 0824 736 4 622
Q3-14 Q2-15 Q3-15 YoY QoQ
Fixed Customers in 000’s
(0.7%)
(2.4%)
4.3%
TotalFiber ADSL Blended ARPU
€34.3 €35.3 €35.8
(3.7%)
(9.1%)
14.2%
1 Ultra High Broadband
1
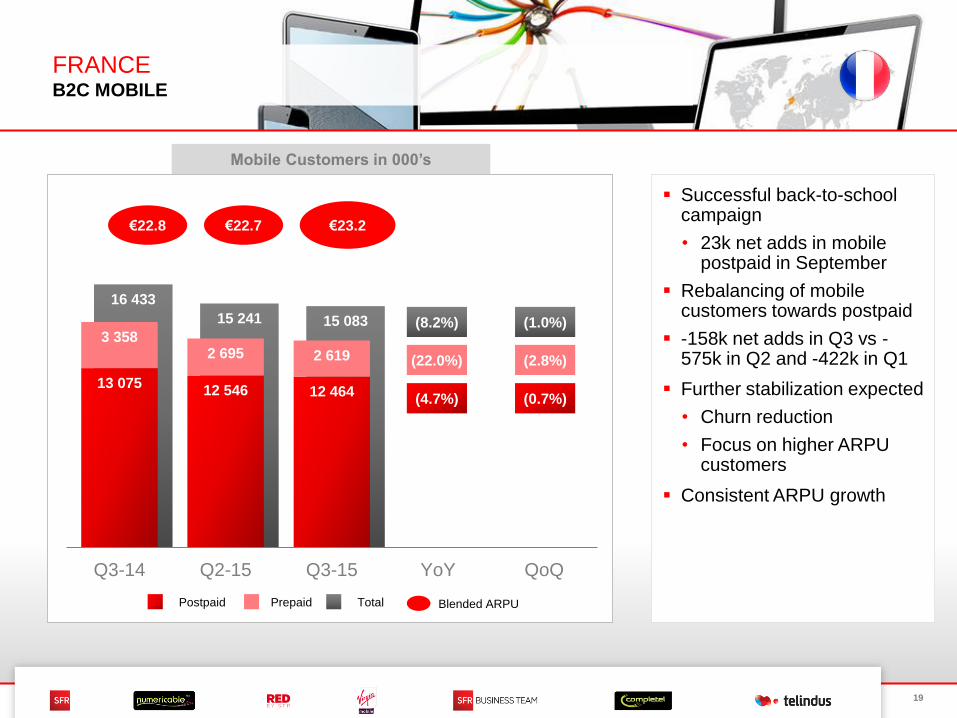
19
FRANCEB2C MOBILE
Successful back-to-school campaign
• 23k net adds in mobile postpaid in September
Rebalancing of mobile customers towards postpaid
-158k net adds in Q3 vs -575k in Q2 and -422k in Q1
Further stabilization expected
• Churn reduction
• Focus on higher ARPU customers
Consistent ARPU growth
(1.0%)
(0.7%)
(2.8%)
Mobile Customers in 000’s
TotalPrepaidPostpaid
16 433
15 241 15 083
13 07512 546 12 464
3 3582 695 2 619
Q3-14 Q2-15 Q3-15 YoY QoQ
€22.8 €22.7 €23.2
Blended ARPU
(8.2%)
(4.7%)
(22.0%)
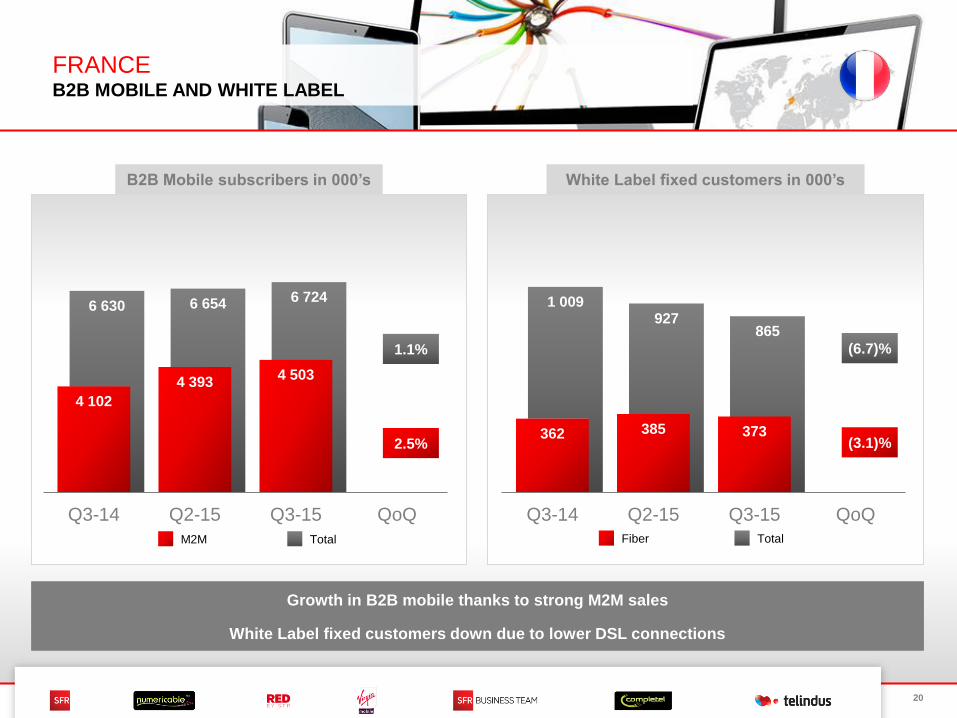
20
1 009927
865
362 385 373
Q3-14 Q2-15 Q3-15 QoQ
6 630 6 654 6 724
4 102
4 3934 503
Q3-14 Q2-15 Q3-15 QoQ
1.1%
2.5%
(6.7)%
(3.1)%
FRANCE B2B MOBILE AND WHITE LABEL
B2B Mobile subscribers in 000’s
TotalM2M
White Label fixed customers in 000’s
TotalFiber
Growth in B2B mobile thanks to strong M2M sales
White Label fixed customers down due to lower DSL connections
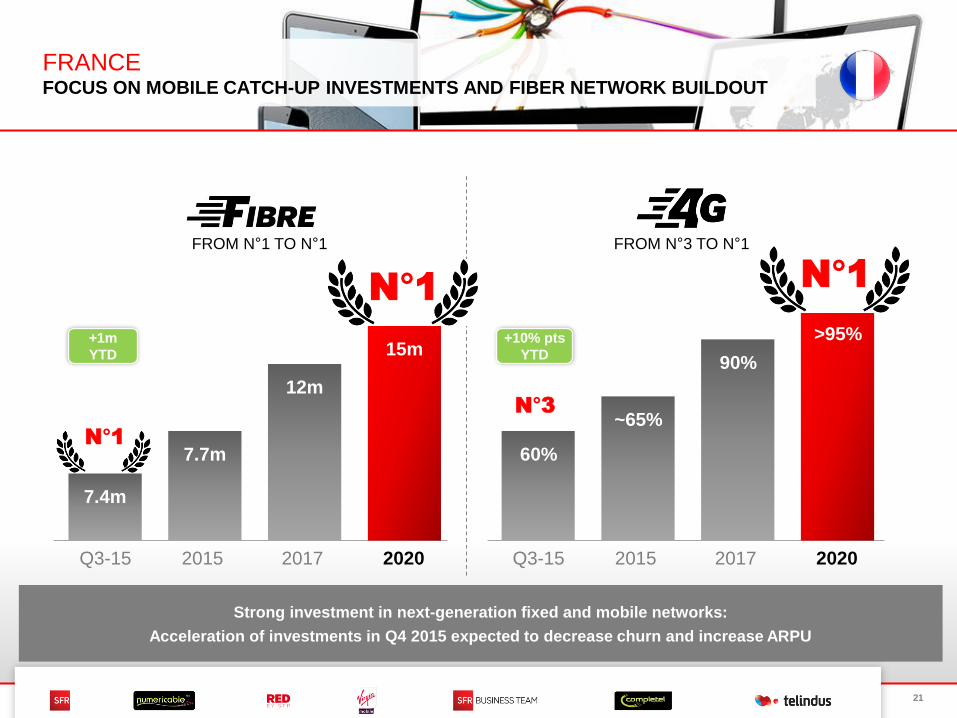
21
FRANCEFOCUS ON MOBILE CATCH-UP INVESTMENTS AND FIBER NETWORK BUILDOUT
7.4m
Q3-15
N°17.7m
2015 2017
12m
2020
15m
60%
Q3-15
~65%
2015 2017
90%
2020
>95%+1m
YTD
+10% pts
YTD
Strong investment in next-generation fixed and mobile networks:
Acceleration of investments in Q4 2015 expected to decrease churn and increase ARPU
N°1
FROM N°1 TO N°1
N°1
N°3
FROM N°3 TO N°1
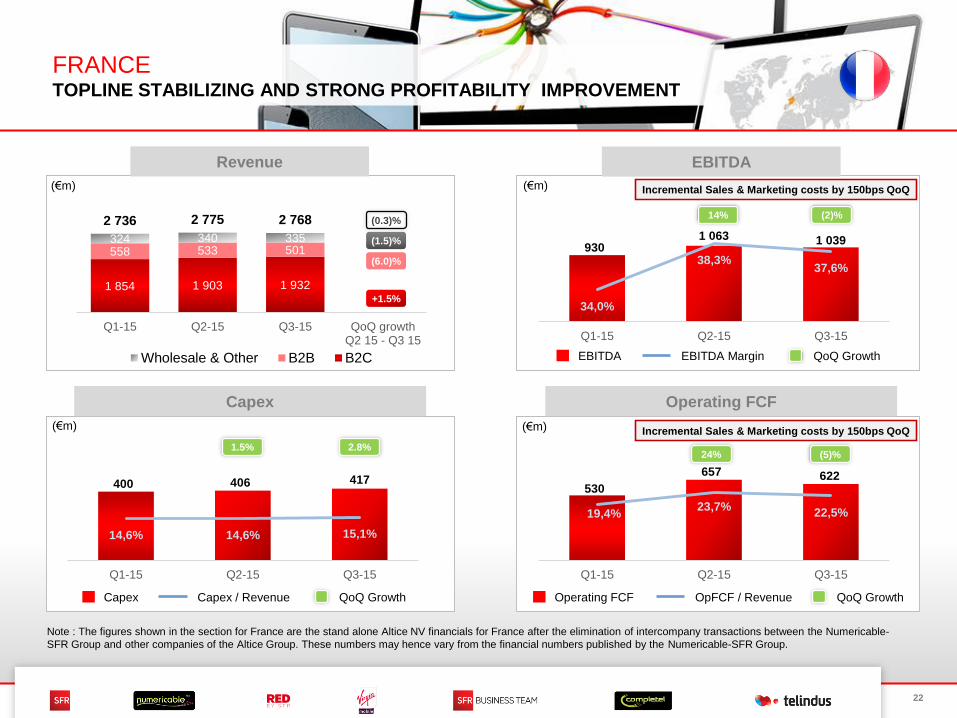
22
FRANCE TOPLINE STABILIZING AND STRONG PROFITABILITY IMPROVEMENT
EBITDA
Capex
(€m)
Operating FCF
530
657 622
19,4%23,7%
22,5%
Q1-15 Q2-15 Q3-15
(5)%24%
(€m)
Operating FCF OpFCF / Revenue QoQ Growth
400 406 417
14,6% 14,6% 15,1%
Q1-15 Q2-15 Q3-15
2.8%1.5%
Capex Capex / Revenue QoQ Growth
(€m)
9301 063 1 039
34,0%
38,3%37,6%
Q1-15 Q2-15 Q3-15
(2)%14%
EBITDA EBITDA Margin QoQ Growth
Revenue
1 854 1 903 1 932
558 533 501324 340 335
2 736 2 775 2 768
-
Q1-15 Q2-15 Q3-15 QoQ growthQ2 15 - Q3 15
Wholesale & Other B2B B2C
(0.3)%
(1.5)%
(6.0)%
+1.5%
(€m) Incremental Sales & Marketing costs by 150bps QoQ
Incremental Sales & Marketing costs by 150bps QoQ
Note : The figures shown in the section for France are the stand alone Altice NV financials for France after the elimination of intercompany transactions between the Numericable-
SFR Group and other companies of the Altice Group. These numbers may hence vary from the financial numbers published by the Numericable-SFR Group.
23
ALTICE INTERNATIONALQ3 2015 HIGHLIGHTS
Initial process optimization and simplification well underway with very strong results
EBITDA margin expansion by 7.2% pts & OpFCF margin expansion by 12.7% pts
Robust B2C performance with top-line growth QoQ ; competitive B2B market pressures
Solid cable business with strong margins and high level of investments
Israeli mobile market continuing to suffer from aggressive price competition affecting results
Continued momentum and accelerated investments
24
Monthly ARPU in €
Monthly ARPU in €
Fixed Customer Base (000’s)
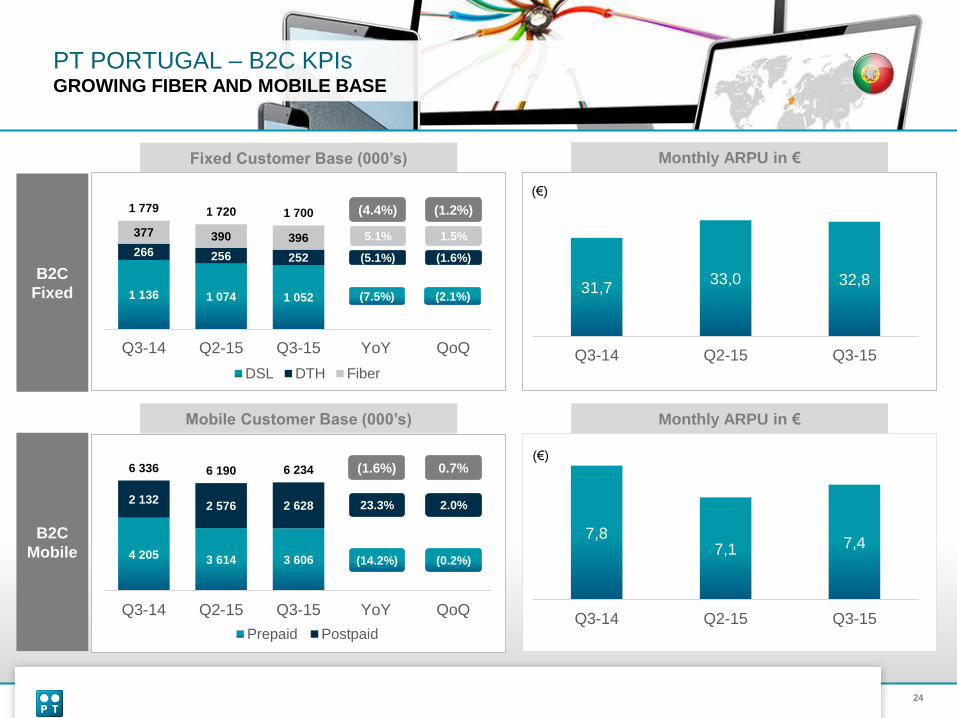
PT PORTUGAL – B2C KPIsGROWING FIBER AND MOBILE BASE
(€)
B2C
Fixed
B2C
Mobile
7,87,1 7,4
Q3-14 Q2-15 Q3-15
(€)
31,733,0 32,8
Q3-14 Q2-15 Q3-15
4 205 3 614 3 606
2 1322 576 2 628
6 336 6 190 6 234
Q3-14 Q2-15 Q3-15 YoY QoQ
Prepaid Postpaid
Mobile Customer Base (000’s)
1 136 1 074 1 052
266 256 252
377 390 396
1 779 1 720 1 700
Q3-14 Q2-15 Q3-15 YoY QoQ
DSL DTH Fiber
(2.1%)
1.5%
(1.2%)
(1.6%)
(0.2%)
2.0%
0.7%
(7.5%)
5.1%
(4.4%)
(5.1%)
(14.2%)
23.3%
(1.6%)
25
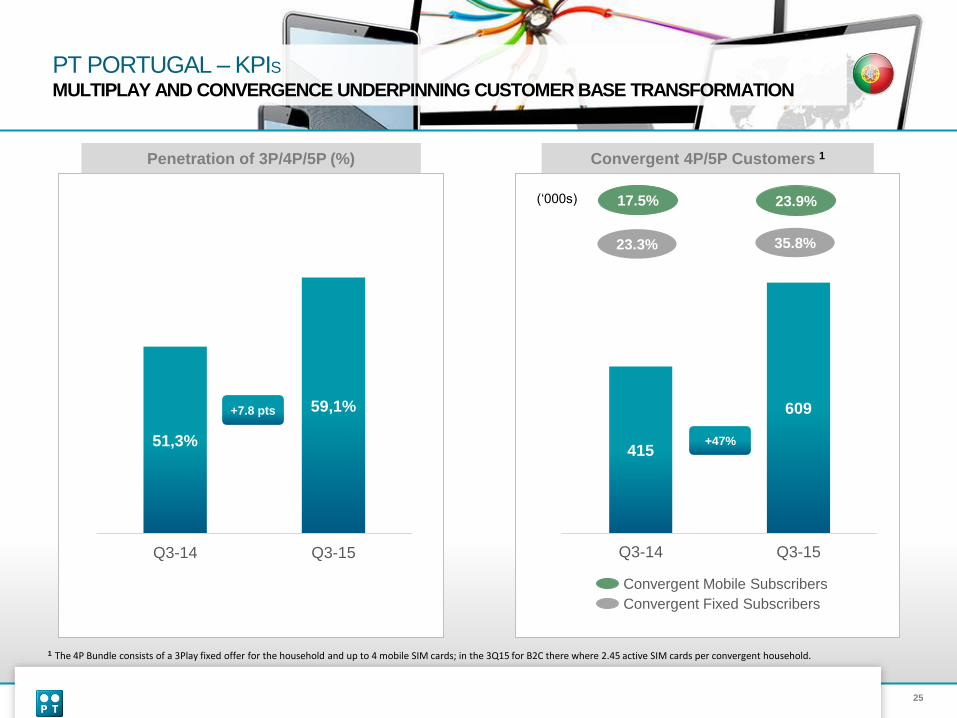
415
609
Q3-14 Q3-15
23.3% 35.8%
17.5% 23.9%
Convergent Fixed Subscribers
Convergent Mobile Subscribers
(‘000s)
51,3%
59,1%
Q3-14 Q3-15
+7.8 pts
+47%
Penetration of 3P/4P/5P (%) Convergent 4P/5P Customers 1
PT PORTUGAL – KPISMULTIPLAY AND CONVERGENCE UNDERPINNING CUSTOMER BASE TRANSFORMATION
1 The 4P Bundle consists of a 3Play fixed offer for the household and up to 4 mobile SIM cards; in the 3Q15 for B2C there where 2.45 active SIM cards per convergent household.
26
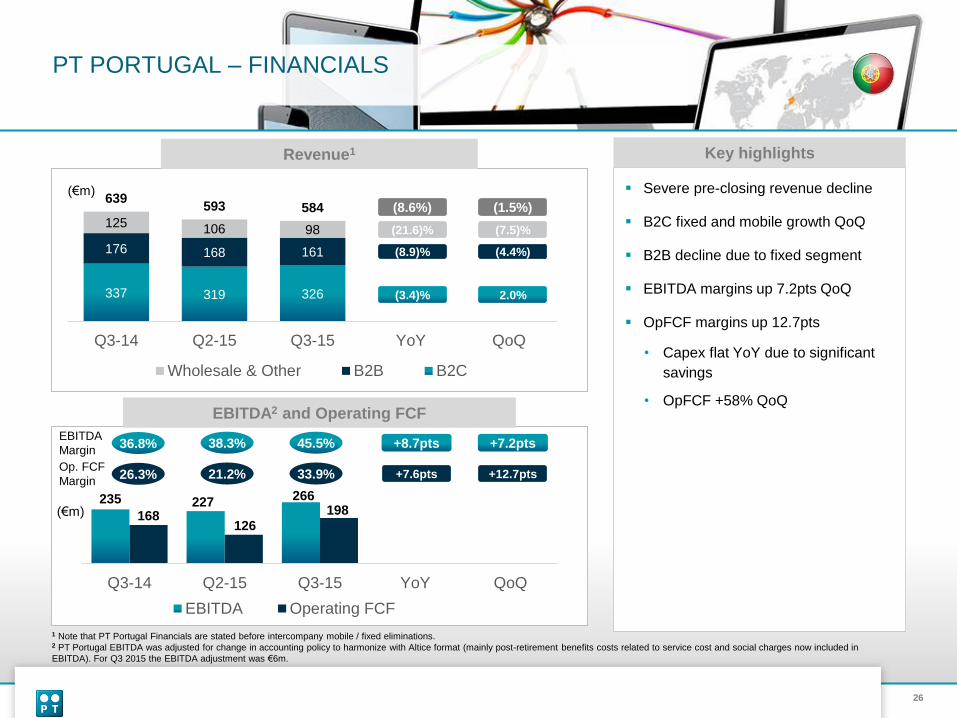
1 Note that PT Portugal Financials are stated before intercompany mobile / fixed eliminations.2 PT Portugal EBITDA was adjusted for change in accounting policy to harmonize with Altice format (mainly post-retirement benefits costs related to service cost and social charges now included in
EBITDA). For Q3 2015 the EBITDA adjustment was €6m.
PT PORTUGAL – FINANCIALS
Severe pre-closing revenue decline
B2C fixed and mobile growth QoQ
B2B decline due to fixed segment
EBITDA margins up 7.2pts QoQ
OpFCF margins up 12.7pts
• Capex flat YoY due to significant
savings
• OpFCF +58% QoQ
Key highlights
337 319 326
176 168 161
125 106 98
639593 584
Q3-14 Q2-15 Q3-15 YoY QoQ
Wholesale & Other B2B B2C
(€m)
Revenue1
235 227266
168126
198
Q3-14 Q2-15 Q3-15 YoY QoQ
EBITDA Operating FCF
36.8% 45.5%EBITDA
Margin
(€m)
EBITDA2 and Operating FCF
38.3%
2.0%
(7.5)%
(1.5%)
(4.4%)
+7.2pts
26.3% 33.9%Op. FCF
Margin21.2% +12.7pts
+8.7pts
+7.6pts
(3.4)%
(21.6)%
(8.6%)
(8.9)%
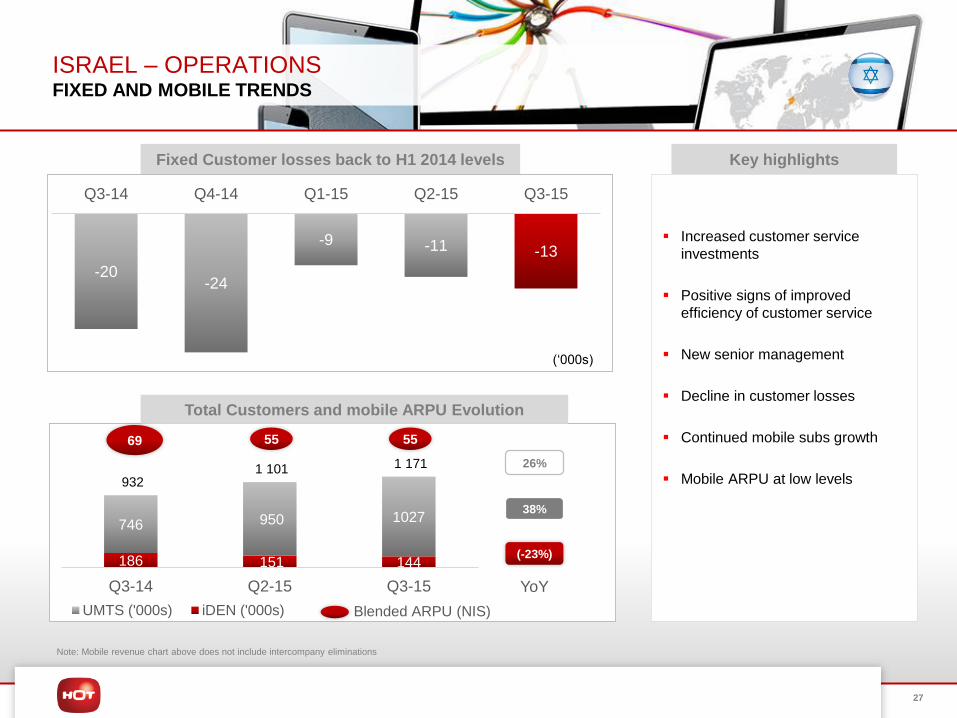
27
Fixed Customer losses back to H1 2014 levels Key highlights
ISRAEL – OPERATIONSFIXED AND MOBILE TRENDS
-20-24
-9 -11 -13
Q3-14 Q4-14 Q1-15 Q2-15 Q3-15
(‘000s)
Increased customer service
investments
Positive signs of improved
efficiency of customer service
New senior management
Decline in customer losses
Continued mobile subs growth
Mobile ARPU at low levels
Note: Mobile revenue chart above does not include intercompany eliminations
Total Customers and mobile ARPU Evolution
186 151 144
746 950 1027
932 1 101 1 171
Q3-14 Q2-15 Q3-15
UMTS ('000s) iDEN ('000s)
69 55
(-23%)
38%
55
YoY
26%
Blended ARPU (NIS)
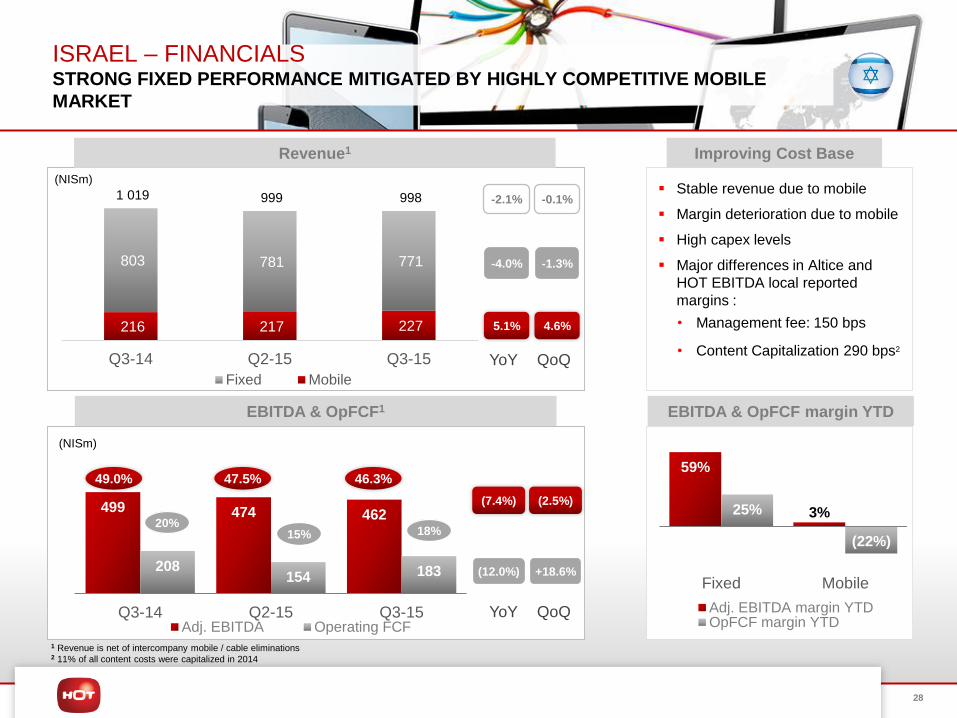
28
ISRAEL – FINANCIALSSTRONG FIXED PERFORMANCE MITIGATED BY HIGHLY COMPETITIVE MOBILE
MARKET
Improving Cost Base
Stable revenue due to mobile
Margin deterioration due to mobile
High capex levels
Major differences in Altice and
HOT EBITDA local reported
margins :
• Management fee: 150 bps
• Content Capitalization 290 bps2
499 474 462
208154 183
Q3-14 Q2-15 Q3-15Adj. EBITDA Operating FCF
216 217 227
803 781 771
1 019 999 998
Q3-14 Q2-15 Q3-15
Fixed Mobile
EBITDA & OpFCF1
49.0% 46.3%
5.1%
Revenue1
(NISm)
-4.0%
47.5%
YoY
-2.1%
(7.4%)
(12.0%)
20%15% 18%
1 Revenue is net of intercompany mobile / cable eliminations2 11% of all content costs were capitalized in 2014
4.6%
-1.3%
QoQ
-0.1%
(2.5%)
+18.6%
YoY QoQ
EBITDA & OpFCF margin YTD
59%
3%25%
(22%)
Fixed Mobile
Adj. EBITDA margin YTDOpFCF margin YTD
(NISm)
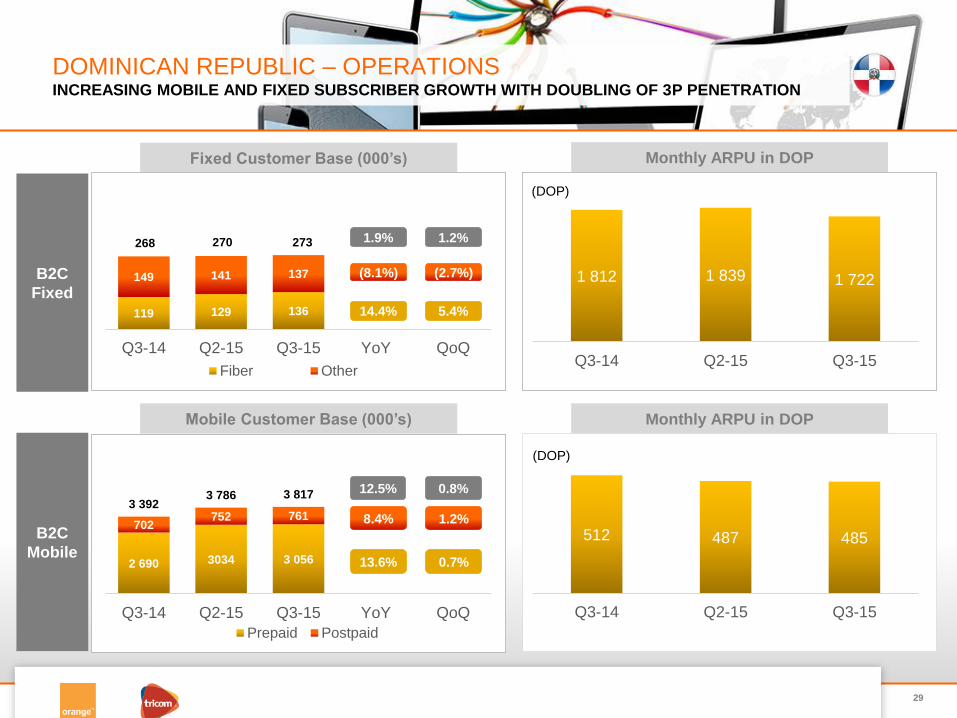
29
DOMINICAN REPUBLIC – OPERATIONSINCREASING MOBILE AND FIXED SUBSCRIBER GROWTH WITH DOUBLING OF 3P PENETRATION
2 690 3034 3 056
702752 761
3 3923 786 3 817
Q3-14 Q2-15 Q3-15 YoY QoQ
Prepaid Postpaid
Monthly ARPU in DOP
Monthly ARPU in DOPMobile Customer Base (000’s)
Fixed Customer Base (000’s)
(DOP)
B2C
Fixed
B2C
Mobile512 487 485
Q3-14 Q2-15 Q3-15
(DOP)
119 129 136
149 141 137
268 270 273
Q3-14 Q2-15 Q3-15 YoY QoQ
Fiber Other
(2.7%)
5.4%
0.7%
0.8%
1 812 1 839 1 722
Q3-14 Q2-15 Q3-15
1.2%
1.2%
(8.1%)
14.4%
1.9%
13.6%
12.5%
8.4%
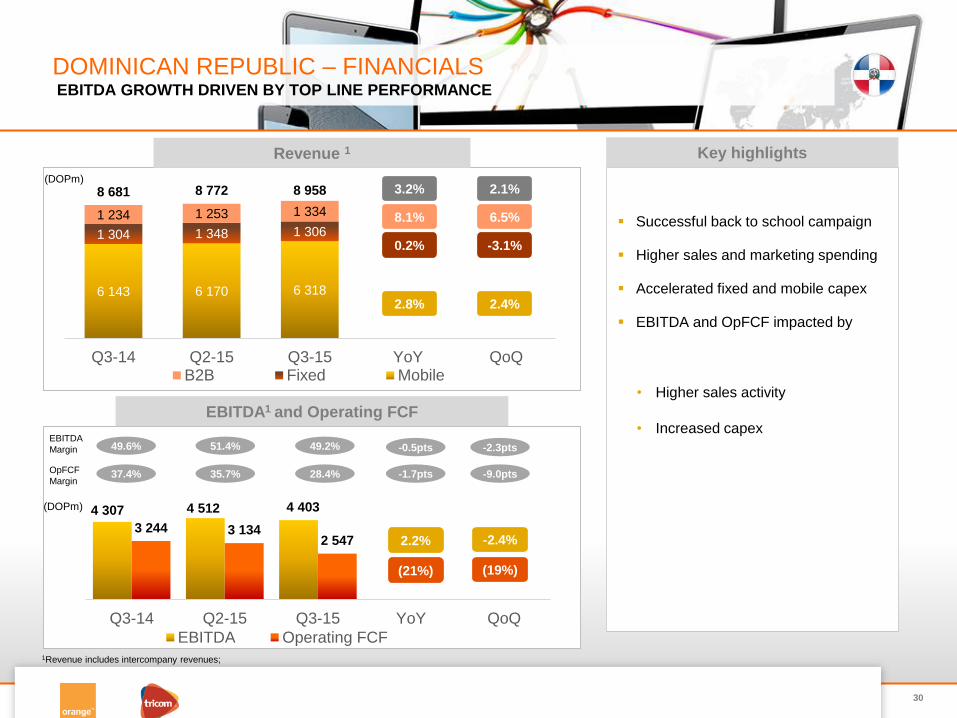
30
EBITDA1 and Operating FCF
DOMINICAN REPUBLIC – FINANCIALSEBITDA GROWTH DRIVEN BY TOP LINE PERFORMANCE
(DOPm)
1Revenue includes intercompany revenues;
4 307 4 512 4 403
3 244 3 1342 547
Q3-14 Q2-15 Q3-15 YoY QoQ
EBITDA Operating FCF
49.6%EBITDA
Margin
(DOPm)
49.2%
6 143 6 170 6 318
1 304 1 348 1 306
1 234 1 253 1 334
8 681 8 772 8 958
Q3-14 Q2-15 Q3-15 YoY QoQB2B Fixed Mobile
Successful back to school campaign
Higher sales and marketing spending
Accelerated fixed and mobile capex
EBITDA and OpFCF impacted by
• Higher sales activity
• Increased capex
Key highlightsRevenue 1
6.5%
-3.1%
2.1%
2.4%
(19%)
-2.4%
51.4%
37.4% 28.4%35.7%OpFCF
Margin
(21%)
2.2%
-0.5pts -2.3pts
8.1%
0.2%
3.2%
2.8%
-1.7pts -9.0pts
31
Financial Review
Dennis Okhuijsen, Group CFO
32
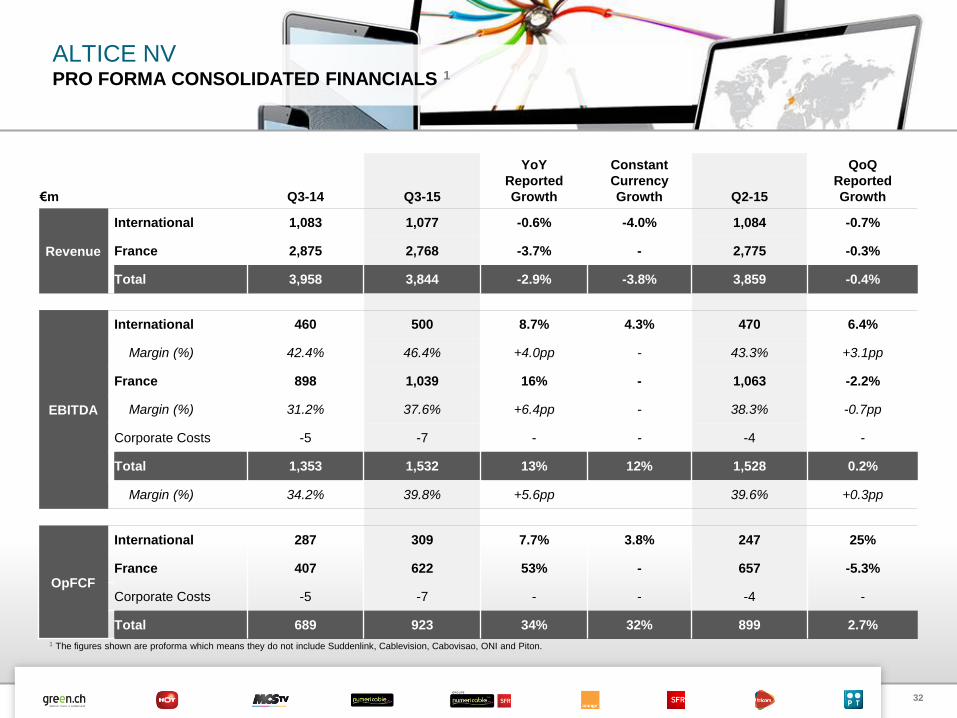
€m Q3-14 Q3-15
YoY
Reported
Growth
Constant
Currency
Growth Q2-15
QoQ
Reported
Growth
Revenue
International 1,083 1,077 -0.6% -4.0% 1,084 -0.7%
France 2,875 2,768 -3.7% - 2,775 -0.3%
Total 3,958 3,844 -2.9% -3.8% 3,859 -0.4%
EBITDA
International 460 500 8.7% 4.3% 470 6.4%
Margin (%) 42.4% 46.4% +4.0pp - 43.3% +3.1pp
France 898 1,039 16% - 1,063 -2.2%
Margin (%) 31.2% 37.6% +6.4pp - 38.3% -0.7pp
Corporate Costs -5 -7 - - -4 -
Total 1,353 1,532 13% 12% 1,528 0.2%
Margin (%) 34.2% 39.8% +5.6pp 39.6% +0.3pp
OpFCF
International 287 309 7.7% 3.8% 247 25%
France 407 622 53% - 657 -5.3%
Corporate Costs -5 -7 - - -4 -
Total 689 923 34% 32% 899 2.7%
ALTICE NVPRO FORMA CONSOLIDATED FINANCIALS 1
1 The figures shown are proforma which means they do not include Suddenlink, Cablevision, Cabovisao, ONI and Piton.
33
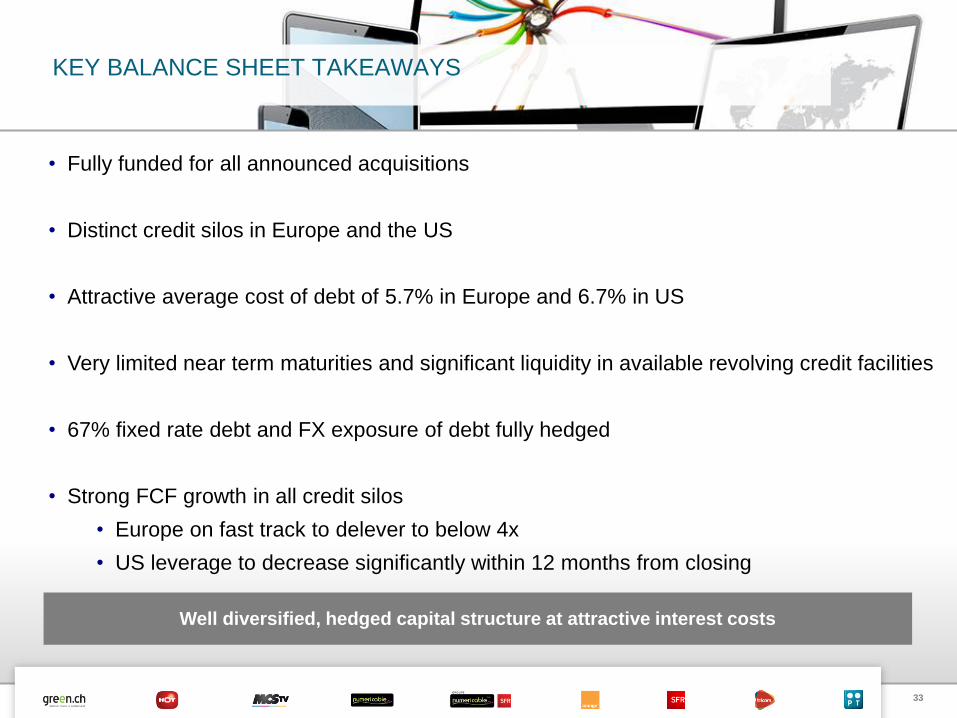
KEY BALANCE SHEET TAKEAWAYS
• Fully funded for all announced acquisitions
• Distinct credit silos in Europe and the US
• Attractive average cost of debt of 5.7% in Europe and 6.7% in US
• Very limited near term maturities and significant liquidity in available revolving credit facilities
• 67% fixed rate debt and FX exposure of debt fully hedged
• Strong FCF growth in all credit silos
• Europe on fast track to delever to below 4x
• US leverage to decrease significantly within 12 months from closing
Well diversified, hedged capital structure at attractive interest costs
34
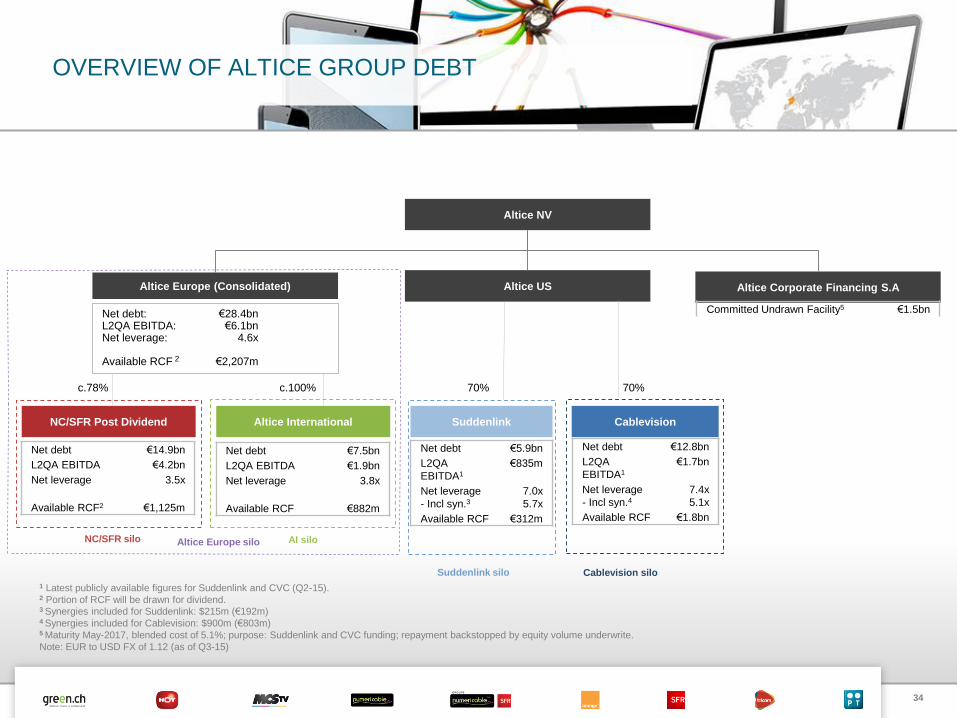
OVERVIEW OF ALTICE GROUP DEBT
Altice USAltice Europe (Consolidated)
Suddenlink Cablevision
Altice Europe silo
Altice InternationalNC/SFR Post Dividend
Suddenlink silo Cablevision silo
AI siloNC/SFR silo
Net debt: €28.4bnL2QA EBITDA: €6.1bnNet leverage: 4.6x
Available RCF 2 €2,207m
1 Latest publicly available figures for Suddenlink and CVC (Q2-15).2 Portion of RCF will be drawn for dividend.3 Synergies included for Suddenlink: $215m (€192m)4 Synergies included for Cablevision: $900m (€803m)5 Maturity May-2017, blended cost of 5.1%; purpose: Suddenlink and CVC funding; repayment backstopped by equity volume underwrite.
Note: EUR to USD FX of 1.12 (as of Q3-15)
c.78% c.100% 70%
Net debt €14.9bn
L2QA EBITDA €4.2bn
Net leverage 3.5x
Available RCF2 €1,125m
Net debt €7.5bn
L2QA EBITDA €1.9bn
Net leverage 3.8x
Available RCF €882m
Net debt €5.9bn
L2QA
EBITDA1
€835m
Net leverage
- Incl syn.37.0x
5.7x
Available RCF €312m
Net debt €12.8bn
L2QA
EBITDA1
€1.7bn
Net leverage
- Incl syn.47.4x
5.1x
Available RCF €1.8bn
70%
Altice NV
Altice Corporate Financing S.A
Committed Undrawn Facility5 €1.5bn
35
210 1 427 392
10
5 627 1 804 3 595
10
8 470
6 230
27 219 154 261
3 231 3 988
39
20 327
1 295 1 347 1 801 1 535837 1 417503 480
927
8 722
11 56 859
1 439 1 799 1 827 2 728
10 257
1 500
Alt Int SFR-NC Alt Lux SL CVC Altice Corp. Fin
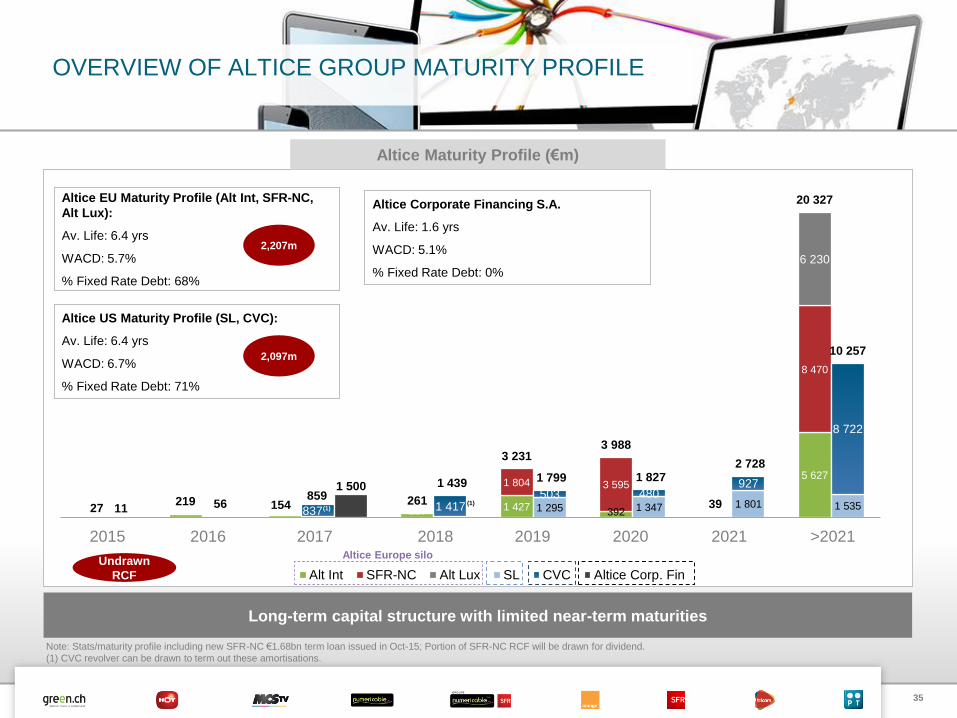
OVERVIEW OF ALTICE GROUP MATURITY PROFILE
Altice Maturity Profile (€m)
Altice EU Maturity Profile (Alt Int, SFR-NC,
Alt Lux):
Av. Life: 6.4 yrs
WACD: 5.7%
% Fixed Rate Debt: 68%
Note: Stats/maturity profile including new SFR-NC €1.68bn term loan issued in Oct-15; Portion of SFR-NC RCF will be drawn for dividend.
(1) CVC revolver can be drawn to term out these amortisations.
Long-term capital structure with limited near-term maturities
Altice US Maturity Profile (SL, CVC):
Av. Life: 6.4 yrs
WACD: 6.7%
% Fixed Rate Debt: 71%
2015 2016 2018 202120202019 >20212017
Altice Corporate Financing S.A.
Av. Life: 1.6 yrs
WACD: 5.1%
% Fixed Rate Debt: 0%
2,207m
Undrawn
RCF
2,097m
Altice Europe silo
(1)(1)
36
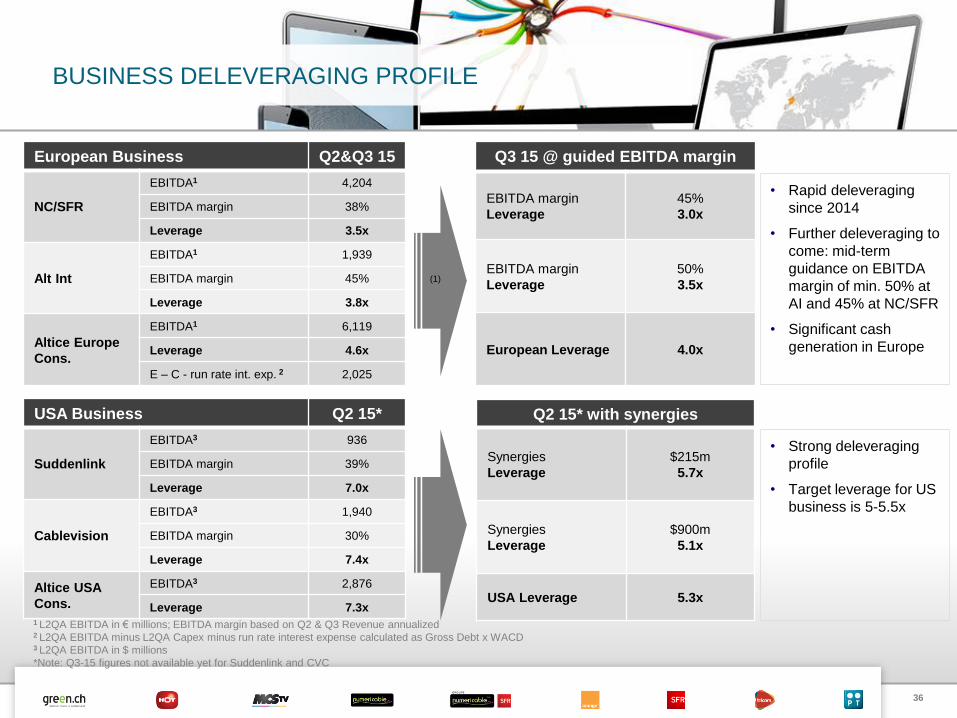
BUSINESS DELEVERAGING PROFILE
European Business Q2&Q3 15
NC/SFR
EBITDA1 4,204
EBITDA margin 38%
Leverage 3.5x
Alt Int
EBITDA1 1,939
EBITDA margin 45%
Leverage 3.8x
Altice Europe
Cons.
EBITDA1 6,119
Leverage 4.6x
E – C - run rate int. exp. 2 2,025
(1)
Q3 15 @ guided EBITDA margin
EBITDA margin
Leverage
45%
3.0x
EBITDA margin
Leverage
50%
3.5x
European Leverage 4.0x
1 L2QA EBITDA in € millions; EBITDA margin based on Q2 & Q3 Revenue annualized2 L2QA EBITDA minus L2QA Capex minus run rate interest expense calculated as Gross Debt x WACD3 L2QA EBITDA in $ millions
*Note: Q3-15 figures not available yet for Suddenlink and CVC
USA Business Q2 15*
Suddenlink
EBITDA3 936
EBITDA margin 39%
Leverage 7.0x
Cablevision
EBITDA3 1,940
EBITDA margin 30%
Leverage 7.4x
Altice USA
Cons.
EBITDA3 2,876
Leverage 7.3x
Q2 15* with synergies
Synergies
Leverage
$215m
5.7x
Synergies
Leverage
$900m
5.1x
USA Leverage 5.3x
• Rapid deleveraging
since 2014
• Further deleveraging to
come: mid-term
guidance on EBITDA
margin of min. 50% at
AI and 45% at NC/SFR
• Significant cash
generation in Europe
• Strong deleveraging
profile
• Target leverage for US
business is 5-5.5x
37
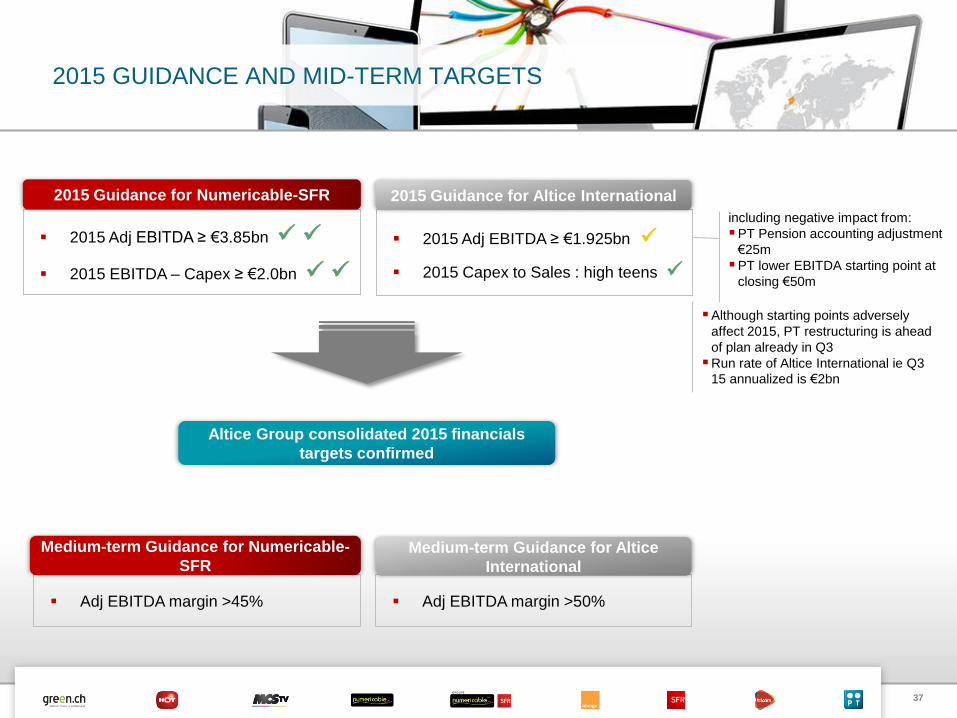
2015 GUIDANCE AND MID-TERM TARGETS
2015 Adj EBITDA ≥ €3.85bn
2015 EBITDA – Capex ≥ €2.0bn
2015 Guidance for Numericable-SFR
2015 Adj EBITDA ≥ €1.925bn
2015 Capex to Sales : high teens
2015 Guidance for Altice International
Altice Group consolidated 2015 financials
targets confirmed
Adj EBITDA margin >45%
Medium-term Guidance for Numericable-
SFR
Adj EBITDA margin >50%
Medium-term Guidance for Altice
International
including negative impact from:
PT Pension accounting adjustment
€25m
PT lower EBITDA starting point at
closing €50m
Although starting points adversely
affect 2015, PT restructuring is ahead
of plan already in Q3
Run rate of Altice International ie Q3
15 annualized is €2bn
38
Q&A
39
Appendix
40
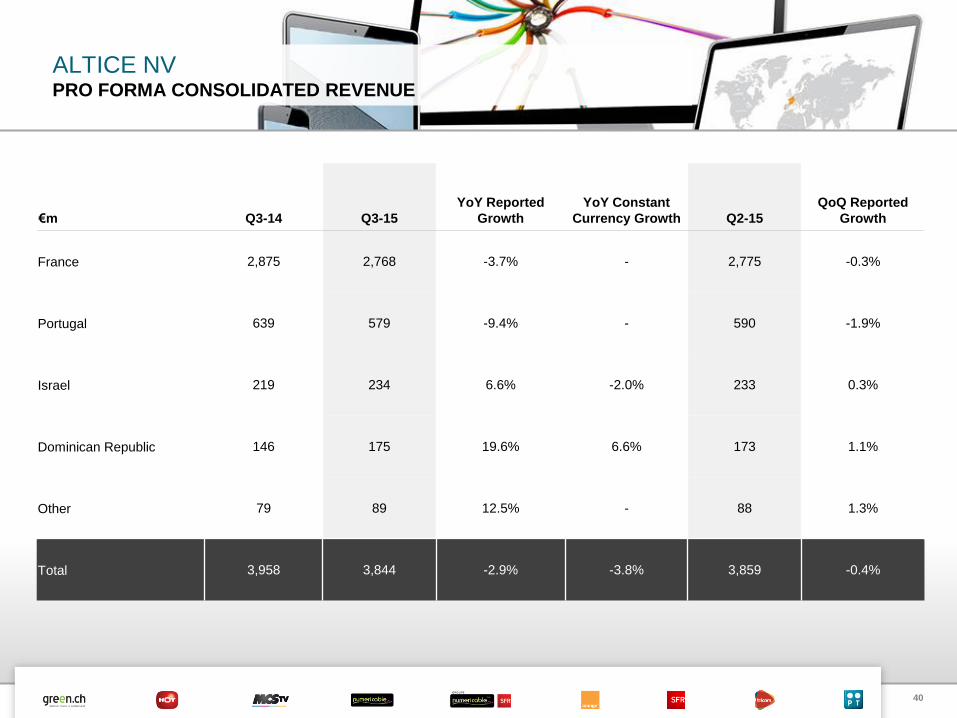
ALTICE NVPRO FORMA CONSOLIDATED REVENUE
€m Q3-14 Q3-15
YoY Reported
Growth
YoY Constant
Currency Growth Q2-15
QoQ Reported
Growth
France 2,875 2,768 -3.7% - 2,775 -0.3%
Portugal 639 579 -9.4% - 590 -1.9%
Israel 219 234 6.6% -2.0% 233 0.3%
Dominican Republic 146 175 19.6% 6.6% 173 1.1%
Other 79 89 12.5% - 88 1.3%
Total 3,958 3,844 -2.9% -3.8% 3,859 -0.4%
41
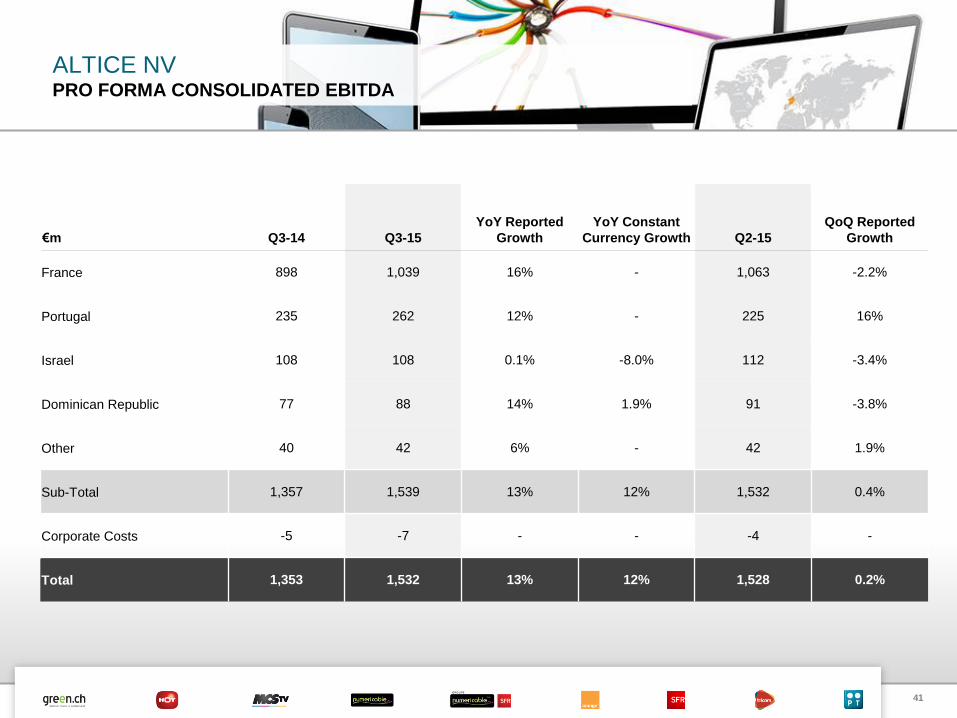
ALTICE NVPRO FORMA CONSOLIDATED EBITDA
€m Q3-14 Q3-15
YoY Reported
Growth
YoY Constant
Currency Growth Q2-15
QoQ Reported
Growth
France 898 1,039 16% - 1,063 -2.2%
Portugal 235 262 12% - 225 16%
Israel 108 108 0.1% -8.0% 112 -3.4%
Dominican Republic 77 88 14% 1.9% 91 -3.8%
Other 40 42 6% - 42 1.9%
Sub-Total 1,357 1,539 13% 12% 1,532 0.4%
Corporate Costs -5 -7 - - -4 -
Total 1,353 1,532 13% 12% 1,528 0.2%
42
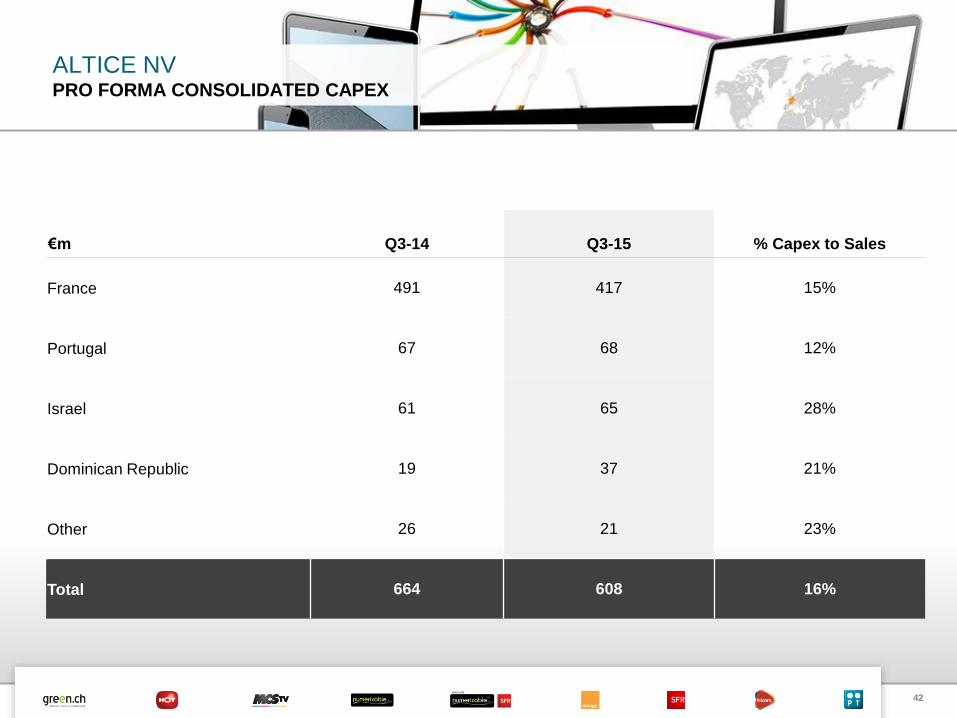
ALTICE NVPRO FORMA CONSOLIDATED CAPEX
€m Q3-14 Q3-15 % Capex to Sales
France 491 417 15%
Portugal 67 68 12%
Israel 61 65 28%
Dominican Republic 19 37 21%
Other 26 21 23%
Total 664 608 16%
43
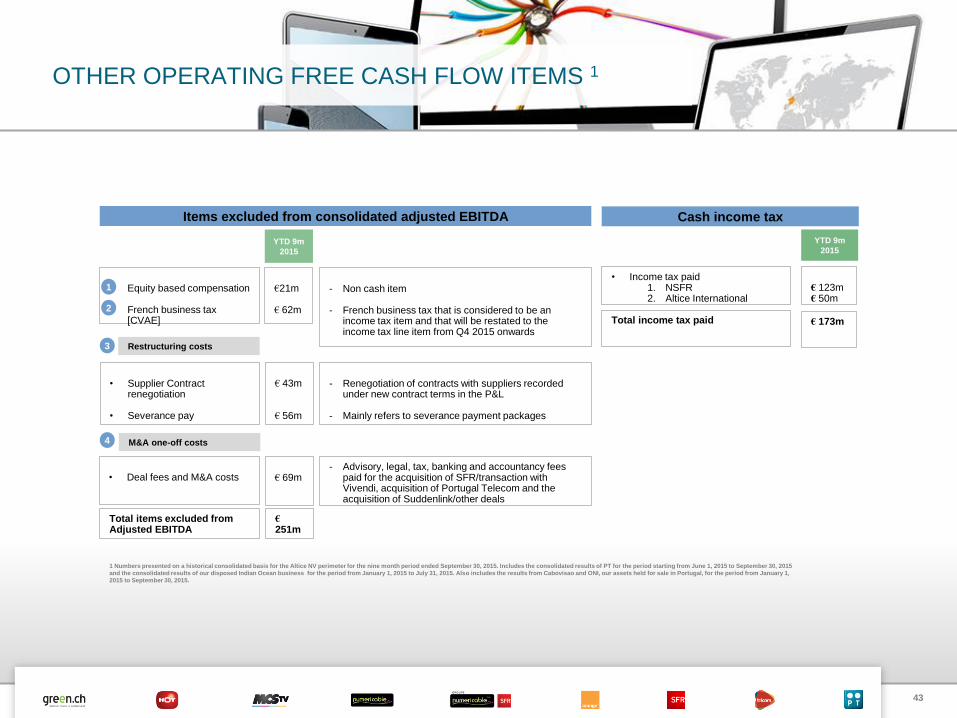
OTHER OPERATING FREE CASH FLOW ITEMS 1
Items excluded from consolidated adjusted EBITDA
• Equity based compensation
• French business tax [CVAE]
- Non cash item
- French business tax that is considered to be an income tax item and that will be restated to the income tax line item from Q4 2015 onwards
€21m
€ 62m
YTD 9m
2015
Cash income tax
• Income tax paid1. NSFR2. Altice International
€ 123m€ 50m
YTD 9m
2015
Total items excluded from Adjusted EBITDA
€251m
Total income tax paid € 173m
1 Numbers presented on a historical consolidated basis for the Altice NV perimeter for the nine month period ended September 30, 2015. Includes the consolidated results of PT for the period starting from June 1, 2015 to September 30, 2015
and the consolidated results of our disposed Indian Ocean business for the period from January 1, 2015 to July 31, 2015. Also includes the results from Cabovisao and ONI, our assets held for sale in Portugal, for the period from January 1,
2015 to September 30, 2015.
• Supplier Contract renegotiation
• Severance pay
• Deal fees and M&A costs
€ 43m
€ 56m
€ 69m
1
2
3
- Renegotiation of contracts with suppliers recorded under new contract terms in the P&L
- Mainly refers to severance payment packages
- Advisory, legal, tax, banking and accountancy fees paid for the acquisition of SFR/transaction with Vivendi, acquisition of Portugal Telecom and the acquisition of Suddenlink/other deals
4 M&A one-off costs
Restructuring costs
44
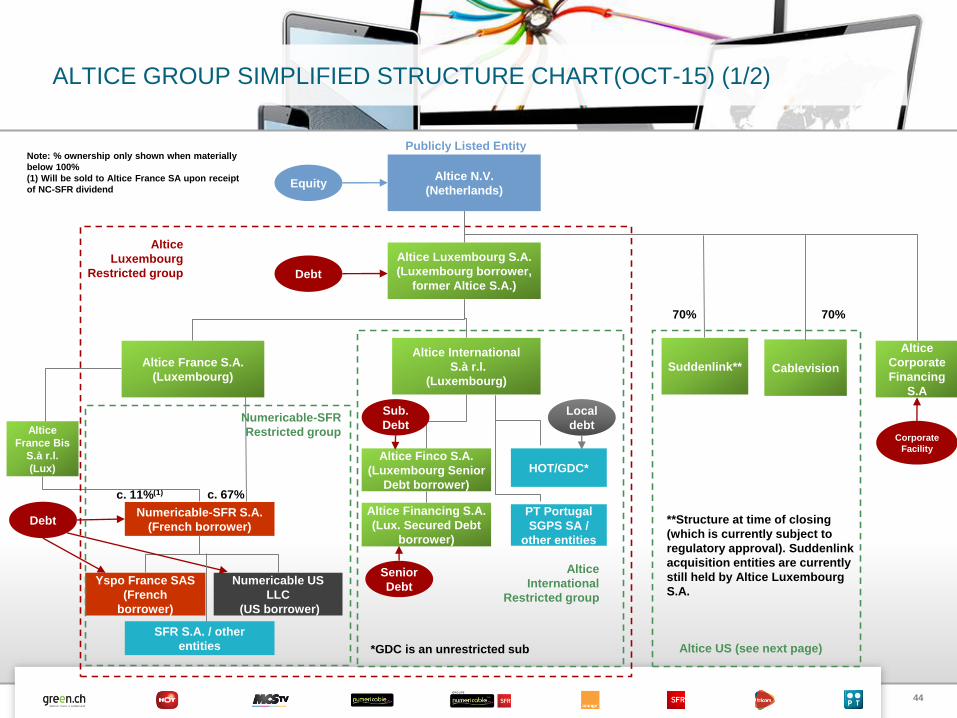
ALTICE GROUP SIMPLIFIED STRUCTURE CHART(OCT-15) (1/2)
Altice N.V.
(Netherlands)
Publicly Listed Entity
Altice Luxembourg S.A.
(Luxembourg borrower,
former Altice S.A.)
Altice France S.A.
(Luxembourg)
Altice
France Bis
S.à r.l.
(Lux)
Numericable-SFR S.A.
(French borrower)
c. 67%c. 11%(1)
Numericable US
LLC
(US borrower)
Yspo France SAS
(French
borrower)
Debt
SFR S.A. / other
entities
Numericable-SFR
Restricted group
Equity
Debt
Altice International
S.à r.l.
(Luxembourg)
Altice Finco S.A.
(Luxembourg Senior
Debt borrower)
Altice Financing S.A.
(Lux. Secured Debt
borrower)
Sub.
Debt
HOT/GDC*
PT Portugal
SGPS SA /
other entities
Local
debt
Senior
Debt
Suddenlink**
Altice
International
Restricted group
Altice
Luxembourg
Restricted group
*GDC is an unrestricted sub Altice US (see next page)
Cablevision
**Structure at time of closing
(which is currently subject to
regulatory approval). Suddenlink
acquisition entities are currently
still held by Altice Luxembourg
S.A.
Altice
Corporate
Financing
S.A
Corporate
Facility
70% 70%
Note: % ownership only shown when materially
below 100%
(1) Will be sold to Altice France SA upon receipt
of NC-SFR dividend
45
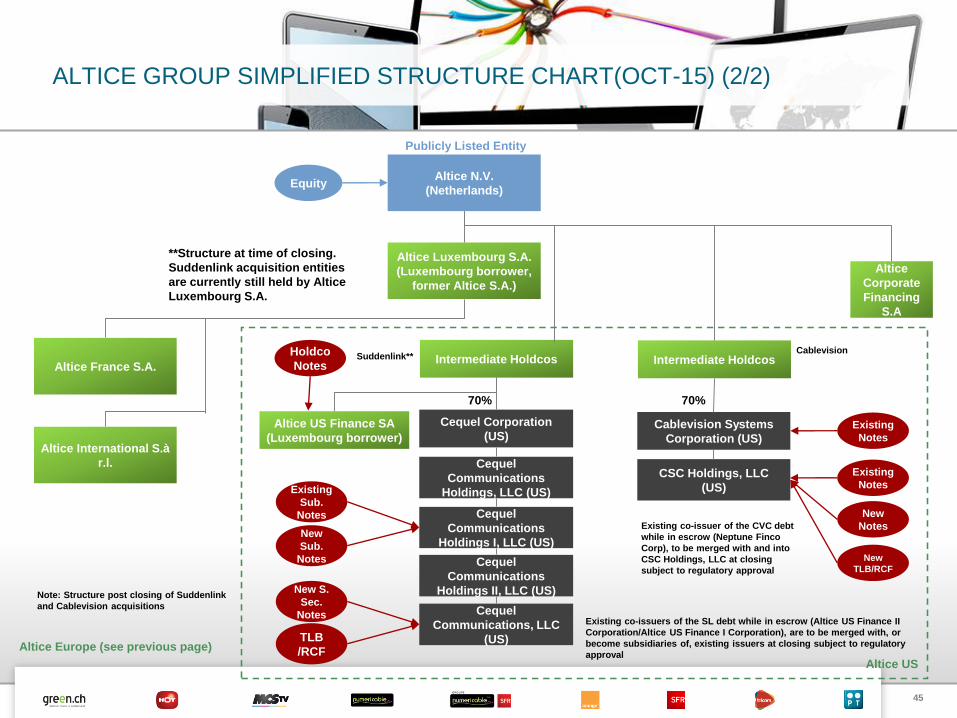
ALTICE GROUP SIMPLIFIED STRUCTURE CHART(OCT-15) (2/2)
Altice N.V.
(Netherlands)
Publicly Listed Entity
Altice Luxembourg S.A.
(Luxembourg borrower,
former Altice S.A.)
Altice France S.A.
Equity
Altice International S.à
r.l.
Intermediate Holdcos
Cequel
Communications
Holdings, LLC (US)
Holdco
Notes
New
Sub.
Notes
New S.
Sec.
Notes
Altice US Finance SA
(Luxembourg borrower)
Altice Europe (see previous page)
Intermediate Holdcos
Altice US
Suddenlink**Cablevision
**Structure at time of closing.
Suddenlink acquisition entities
are currently still held by Altice
Luxembourg S.A.
70%
Cequel Corporation
(US)
Cequel
Communications
Holdings I, LLC (US)
Cequel
Communications
Holdings II, LLC (US)
Cequel
Communications, LLC
(US)TLB
/RCF
Existing
Sub.
Notes
Existing co-issuers of the SL debt while in escrow (Altice US Finance II
Corporation/Altice US Finance I Corporation), are to be merged with, or
become subsidiaries of, existing issuers at closing subject to regulatory
approval
CSC Holdings, LLC
(US)
Cablevision Systems
Corporation (US)
Existing
Notes
Existing
Notes
New
Notes
New
TLB/RCF
Existing co-issuer of the CVC debt
while in escrow (Neptune Finco
Corp), to be merged with and into
CSC Holdings, LLC at closing
subject to regulatory approval
70%
Note: Structure post closing of Suddenlink
and Cablevision acquisitions
Altice
Corporate
Financing
S.A